CARE DURING CRISIS LET’S INCLUDE THE CHILDREN · CARE DURING CRISIS LET’S INCLUDE THE CHILDREN...
89
CARE DURING CRISIS LET’S INCLUDE THE CHILDREN David Marcozzi, MD, MHS-CL, FACEP Associate Professor, Director of Population Health Department of Emergency Medicine, University of Maryland School of Medicine Assistant Chief Medical Officer for Acute Care, University of Maryland Medical Center
Transcript of CARE DURING CRISIS LET’S INCLUDE THE CHILDREN · CARE DURING CRISIS LET’S INCLUDE THE CHILDREN...

CARE DURING CRISIS
LET’S INCLUDE THE CHILDRENDavid Marcozzi, MD, MHS-CL, FACEP
Associate Professor, Director of Population HealthDepartment of Emergency Medicine, University of Maryland School of Medicine
Assistant Chief Medical Officer for Acute Care, University of Maryland Medical Center

Non Disclosure
■ Thepresenterhasnofinancialrelationshipstodisclose.■ TheviewspresenteddonotrepresenttheDepartmentofDefenseofthetheUniversityofMaryland
■ Commercialsupportwasnotreceivedforthisactivity.

Agenda
■ Challenges with optimizing healthcare delivery during crises-Problem statement
■ Healthcare delivery 101
■ Describe the vision
■ “Linking” solutions
■ Potential future


Objectives
■ Understanding pediatric preparedness tenants, that if employed, actually strengthen daily healthcare delivery
■ Discussing healthcare executives perspectives on preparedness
■ Explain the linkage between daily healthcare delivery policy, priorities and care with healthcare delivery during disasters
■ The importance of understanding care in crisis, immediate bed availability, and the risks to patients and facilities of not being prepared


■ https://timedotcom.files.wordpress.com/2014/10/141001-spanish-flu-03.jpg?quality=75&strip=color&w=778


Emergency Department Visits and Emergency Departments(1)
in Community Hospitals, 1991 – 2011
3,500
3,700
3,900
4,100
4,300
4,500
4,700
4,900
5,100
5,300
80
85
90
95
100
105
110
115
120
125
130
91 92 93 94 95 96 97 98 99 00 01 02 03 04 05 06 07 08 09 10 11
Emer
genc
y D
epar
tmen
ts
Num
ber
of E
D V
isits
(M
illion
s)
ED Visits Emergency Departments
Source: Avalere Health analysis of American Hospital Association Annual Survey data, 2011, for community hospitals.
(1) Defined as hospitals reporting ED visits in the AHA Annual Survey.

ER visits still rising despite ACA
■ JAN 2015 Modern Healthcare: – “Patient emergency room visits rose sharply at hospitals
with the highest ER use in 2013, the last year before the Affordable Care Act's insurance expansion kicked in… and many of the hospitals with the busiest ERs in 2013 are reporting even higher volumes in 2014 despite the nation's declining uninsured rate.”
■ The article goes on to describe that the nation's 24 busiest emergency rooms reported 18.7% more visits in 2013 over 2012
■ It appears this trend will continue

National Healthcare System Capacity National Healthcare System Capacity
Decreasing Capacity
Health CareDelivery during Crises
19
100% Ready
Gap
Hospitals/coalition
Hospital/coalition Readiness

Slide 19
DHHS1 Seems slide 7 is "Today", and slide 8 is "Future". Considering titling slides as such.DHHS, 10/22/2012

National Healthcare System Capacity National Healthcare System Capacity
100% Ready
Hospital/coalition Readiness
Gap
Hospitals/coalitions
Health CareDelivery during Crises
20

Geographic Dispersion ofHPP Healthcare Coalitions

US Trauma Systems

Hospital Referral Regions


Health Disparities


THE GREAT DIVIDE■ Healthcare “Preparedness”
– $235 million– Pandemic and All Hazards
Preparedness Act (reauth)– HELP Committee– Energy and Commerce
Committee– ASPR/CDC
■ Healthcare
– $3 trillion – Social Security Act– Balanced Budget Act– Finance Committee– Ways and Means Committee– CMS/ONC


Problem Statement
■ The US healthcare system has no requirements and is not incentivized to deliver optimal healthcare in disasters to optimize a patient’s or a population’s health
■ The US healthcare delivery system is focused on cost reduction, including service retraction and an emphasis on out-patient management, resulting in “just-in-time” (JIT) operating principles and staffing negating medical surge.
■ The United States health system emergency preparedness and response mechanisms are established but undeveloped. They often are fragmented, divorced from daily health delivery practice patterns and restrained by economic realities.
■ The US emergency care delivery system continues to experience overcrowding, with limited mechanisms to reallocate patients throughout the hospital or the community.

Healthcare

What 183 C-suite executives told the Advisory Board-May 2017
■ The top six issues were:
– Improving ambulatory access (57% assigning an "A" grade)– Innovative approaches to expense reduction (57%)– Boosting outpatient procedural market share (55%)– Minimizing unwarranted clinical variation(54%)– Controlling avoidable utilization (49%)– Exploring diversified, innovative revenue streams (48%)

Payment Taxonomy Framework
Payment Taxonomy Framework
Category 1:
Fee for Service—No Link to Quality
Category 2:
Fee for Service—Link to Quality
Category 3:
Alternative Payment Models Built on Fee-for-Service Architecture
Category 4:
Population-Based Payment
Des
crip
tion
Payments are based on volume of services and not linked to quality or efficiency
At least a portion of payments vary based on the quality or efficiency of health care delivery
Some payment is linked to the effective management of a population or an episode of care. Payments still triggered by delivery of services, but opportunities for shared savings or 2-sided risk
Payment is not directly triggered by service delivery so volume is not linked to payment. Clinicians and organizations are paid and responsible for the care of a beneficiary for a long period (e.g. >1 yr)
Med
icar
e FF
S
Limited in Medicare fee-for-service
Majority of Medicare payments now are linked to quality
Hospital value-based purchasing
Physician Value-Based Modifier
Readmissions/Hospital Acquired Condition Reduction Program
Accountable care organizations Medical homes Bundled payments Comprehensive primary care
initiative Comprehensive ESRD Medicare-Medicaid Financial
Alignment Initiative Fee-For-Service Model
Eligible Pioneer accountable care organizations in years 3-5

Target percentage of Medicare FFS payments linked to quality and alternative payment models in 2016 and 2018
2016
All Medicare FFS (Categories 1-4)FFS linked to quality (Categories 2-4)
Alternative payment models (Categories 3-4)2018
50%
85%
30%
90%


Four MIPS1 Categories Make up Total Performance Score
Merit-Based Incentive Payment System.Electronic Health Records.Eligible clinicians include physicians, physician assistants, nurse practitioners, clinical nurse specialists, certified registered nurse anesthetists, and groups that include such clinicians.
25% 25% 25%
15% 15% 15%
10% 15%30%
50% 45%30%
2019 2020 2021+
QualityCost/Resource UseClinical Practice ImprovementAdvancing Care Information
Relative Weight of Each MIPS Category Over Time
Category Description RelativeDifficulty
Quality Clinicians must select 6 measures of the over 200+ available to report to CMS; score in this category not just awarded for reporting, but for high performance
Resource Use Points awarded for cost savings; clinician scores based on Medicare claims, no reporting required
Clinical Practice
Improvement
New category that rewards clinicians for clinical practice improvement activities; over 90 activities to choose from
Advancing Care
Information
Tracks clinicians EHR2 use offering partial credit, can report as individual or group
Score based on peer performance benchmarks
Score based on Eligible Clinicians’3 own performance
Source: CMS, “Medicare Program; Merit-Based Incentive Payment System (MIPS) and Alternative Payment Model (APM) Incentive under the Physician Fee Schedule, and Criteria for Physician-Focused Payment Models,” May 9, 2016, available at: https://s3.amazonaws.com/public-inspection.federalregister.gov/2016-10032.pdf; Advisory Board research and analysis. ;

CEOs Top Challenges in Pediatric Health Care■ Future workforce
– A 2012 Children’s Hospital Association survey of nearly 70 children’s hospitals across the country revealed ongoing vacancies of 12 months or longer among key pediatric specialties—such as neurology, general surgery and developmental/ behavior health
■ Lack of research funding
– The average number of research applicants who consistently receive grant funding is 7 percent.
■ Changing reimbursement models
– 70 percent of Children’s Hospital of Michigan patients are on Medicaid, so understanding how reimbursement will change if they’re covered by a health insurance exchange plan is crucial.

CEOs Top Challenges in Pediatric Health Care■ Competition, collaboration, consolidation– Children’s hospitals often see their biggest competition as each other. – If children’s hospitals compete with each other to the point of putting others out of business, it
could limit access to care. – Instead of competing, consider for example, what would happen if multiple children’s hospitals
within the same market pooled resources or data and formed a nonprofit research entity. All of the hospitals involved, and their patients, would benefit.
■ Partnerships and data sharing– Nearly 40 Children’s Hospital Association member hospitals have combined forces in a common
group purchasing organization (GPO) to reduce costs and also connect purchasing information with pediatric evidence-based operational and clinical data.
– GPO participants access an integrated database that uses administrative data for benchmarking and performance improvements across the continuum-of-care.
– CHOP’s partnership with the Beijing Genomics Institute and Boston Children’s partnership with Claritas Genomics.
– Of CHOP’s $2.2 billion annual revenue, approximately $100 million comes from international efforts.


Donald Berwick (Chair), Institute for Healthcare ImprovementEllen Embrey, Stratitia, Inc., and 2c4 Technologies, Inc.Sara F. Goldkind, Goldkind Consulting, LLCAdil Haider, Brigham and Women’s Hospital, and Harvard
UniversityCOL (Ret) John Bradley Holcomb, University of Texas Health
Science CenterBrent C. James, Intermountain HealthcareJorie Klein, Parkland Health & Hospital SystemDouglas F. Kupas, Geisinger Health SystemCato Laurencin, University of ConnecticutEllen MacKenzie, Johns Hopkins University School of Hygiene
and Public HealthDavid Marcozzi, University of Maryland School of Medicine
C. Joseph McCannon, The Billions InstituteNorman McSwain, JR., (until July 2015), Tulane Department of
SurgeryJohn Parrish, Consortia for Improving Medicine with Innovation
and Technology (CIMIT); Harvard Medical SchoolRita Redberg, University of California, San FranciscoUwe E. Reinhardt, (until August 2015), Princeton UniversityJames Robinson, Denver Health EMS-Paramedic DivisionThomas Scalea, R. Adams Cowley Shock Trauma Center,
University of MarylandC. William Schwab, University of PennsylvaniaPhilip C. Spinella, Washington University in St. Louis School of
Medicine
42
Committee on Military Trauma Care’s Learning Health System and Its Translation to the Civilian Sector
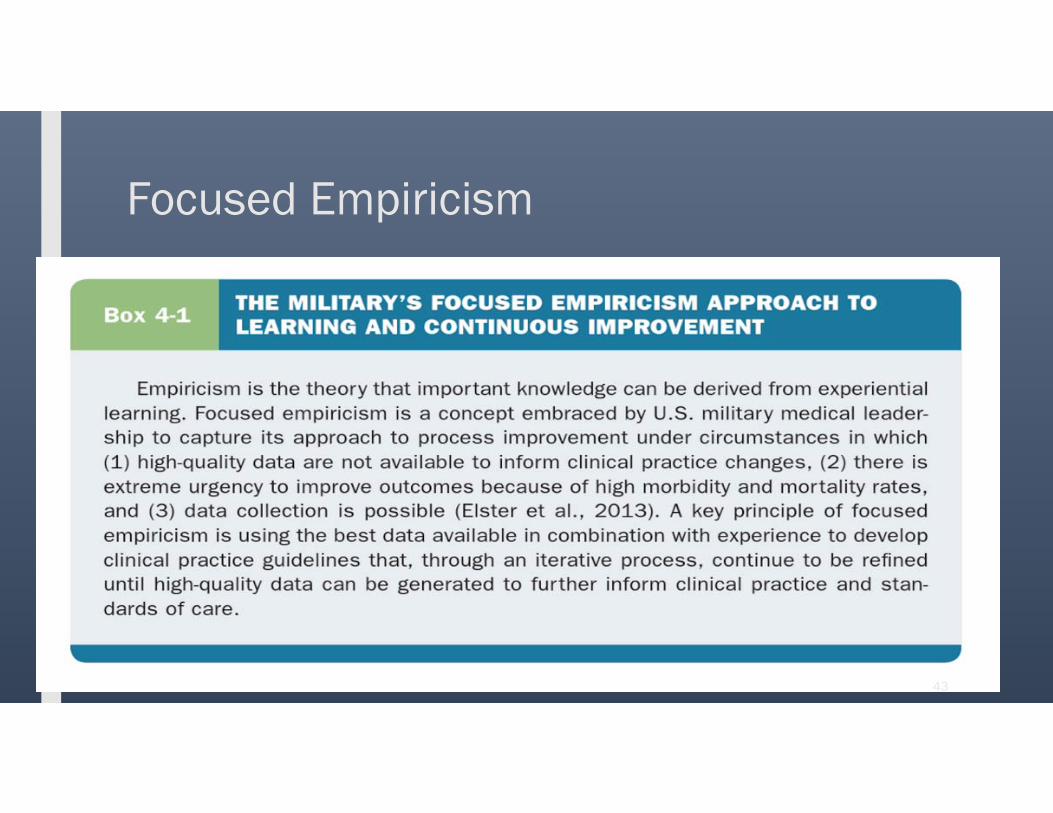
Focused Empiricism
43

■ American College of Emergency Physicians■ American College of Surgeons■ National Association of Emergency Medical Technicians■ National Association of EMS Physicians■ Trauma Center Association of America■ U.S. Department of Defense’s U.S. Army Medical Research and
Material Command■ U.S. Department of Homeland Security’s Office of Health Affairs■ U.S. Department of Transportation’s National Highway Traffic Safety
Administration
Study Sponsors

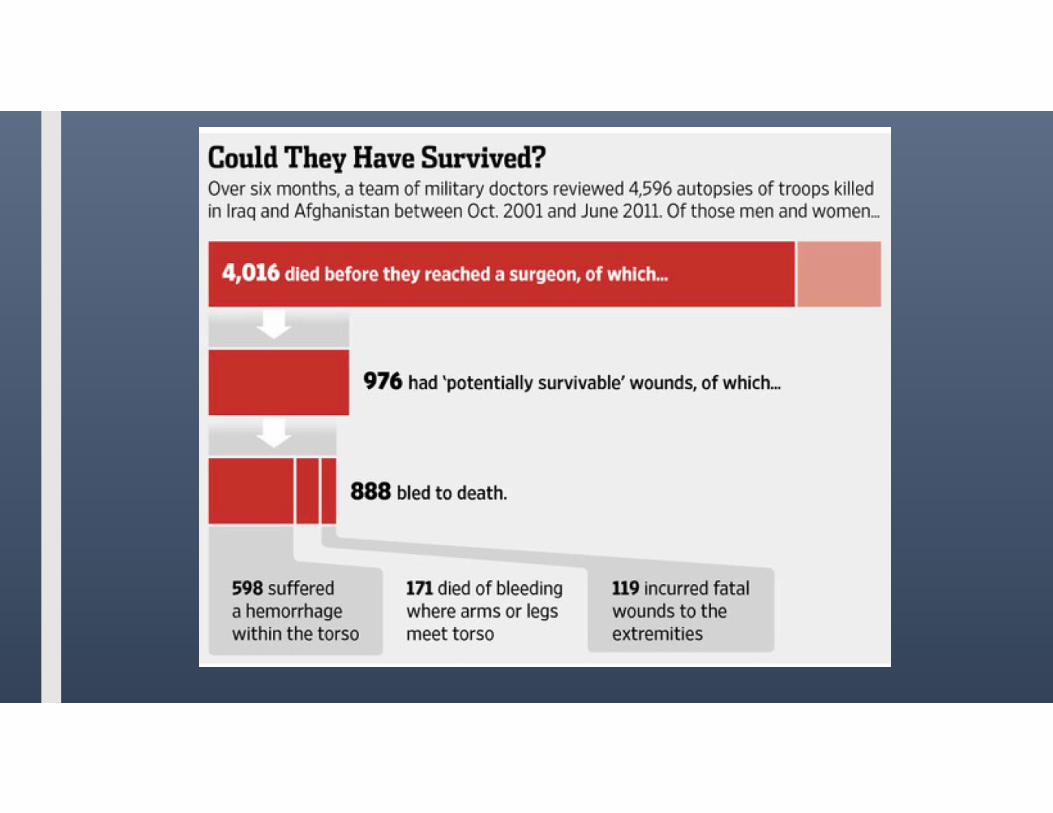
■ The Imperative – The U.S. service members the nation sends into harm’s way
and every American should have the best possible chance for survival and functional recovery after injury.
■ The Urgency– Military burden: ~6,850 service member deaths in Iraq and
Afghanistan. Nearly 1,000 from potentially survivable injuries.– Civilian burden: 147,790 U.S. trauma deaths in 2014 - as
many as 30,000 may have been preventable with optimal trauma care.
– Threats from active shooter and other mass casualty incidents.– As wars end and service members leave the military, the
knowledge, experience and advances in trauma care gained over past decade are being lost.
• The Opportunity– Existence of a military trauma system built on a learning system framework that has
achieved unprecedented survival rates for casualties.– Organized civilian trauma system that is well positioned to assimilate recent wartime
trauma lessons learned and serve as a repository and incubator for innovation during the interwar period.
Traumatic injury accounts for nearly half of all deaths for Americans under 46 years of age and cost the nation $670B in 2013.
Context

46
The Aim (Rec 1)
The Role of Leadership– National-Level Leadership (Rec 2)– Military Leadership (Rec 3)– Civilian Sector Leadership (Rec 4)
An Integrated Military–Civilian Framework for Learning to Advance Trauma Care
– Improving the Collection and Use of Data (Rec 5)– A Collaborative Research Infrastructure in a Supportive Regulatory
Environment (Recs 7 and 8)– Systems and Incentives for Improving Transparency and Trauma Care
Quality (Recs 9 and 10)– Developing Expertise (Recs 6 and 11)
Findings and Recommendations


What GAO Found
■ GAO estimates that 57 percent of the 73.7 million children in the United States during the period 2011-2015 lived within 30 miles of a pediatric trauma center that can treat all injuries regardless of severity.
■ In areas without pediatric trauma centers, injured children may have to rely on adult trauma centers or less specialized hospital emergency departments for initial trauma care.
■ Some studies GAO reviewed, including nationwide studies, found that children treated at pediatric trauma centers have a lower mortality risk compared to children treated at adult trauma centers and other facilities, while other state-level studies GAO reviewed found no difference in mortality.
■ Further, some studies GAO reviewed and stakeholders GAO interviewed suggest that more information is needed on outcomes other than mortality for children treated at pediatric trauma centers because mortality can be a limited outcome measure, as overall mortality is low among severely injured children.


JAMA PEDIATRICS JOURNAL CLUB SLIDES:NATIONAL ASSESSMENT OF ED PEDIATRIC READINESS
Gausche-Hill M, Ely M, Schmuhl P, et al. A national assessment of pediatric readiness of emergency departments. JAMA Pediatr. Published online April 13, 2015. doi:10.1001/jamapediatrics.2015.138.

■ Study Design
– Web-based assessment of US EDs for pediatric readiness.
■ Setting– EDs (excluding specialty hospitals and hospitals without an ED open 24
hours per day, 7 days per week).
■ Participants– All 5017 ED nurse managers were sent a 55-question web-based
assessment.
Methods

Results■ Of the 5017 EDs contacted, 4149 (82.7%) responded, representing 24
million annual pediatric ED visits.
■ Among the EDs entered in the analysis, 69.4% had low or medium pediatric volume and treated fewer than 14 children per day.
■ The median WPRS was 68.9 (interquartile range [IQR], 56.1-83.6).
■ The median WPRS increased by pediatric patient volume, from 61.4 (IQR, 49.5-73.6) for low-pediatric-volume EDs compared with 89.8 (IQR, 74.7-97.2) for high-pediatric-volume EDs (P < .001).
■ The median percentage of recommended pediatric equipment available was 91% (IQR, 81%-98%).

Results■ The presence of physician and nurse PECCs was associated with a
higher adjusted median WPRS (82.2 [IQR, 69.7-92.5]) compared with no PECC (66.5 [IQR, 56.0-76.9]) across all pediatric volume categories (P < .001).
■ The presence of PECCs increased the likelihood of having all the recommended guideline components, including a pediatric quality improvement process (adjusted relative risk, 4.11; 95% CI, 3.37-5.02).
■ Barriers to guideline implementation were reported by 80.8% of responding EDs.

Comment■ In 2006, the Institute of Medicine report on the future of emergency
care in US health care systems recommended that “hospitals should appoint 2 pediatric emergency coordinators—one a physician—to provide pediatric leadership for the organization.”1(p322)
■ These data provide evidence for the importance of PECCs in ensuring pediatric readiness of EDs.
■ The presence of PECCs is associated with improved compliance with published guidelines.
1Institute of Medicine, Committee of the Future of Emergency Care in the US Health System. Emergency Care for Children: Growing Pains. Washington, DC: National Academy Press; 2006.

Comment■ The importance for EDs to maintain a state of readiness to care for
children cannot be overemphasized because day-to-day readiness affects disaster planning and response as well as patient safety.
■ These data demonstrate improvement in pediatric readiness of EDs as compared with previous reports.
■ Barriers to guideline implementation may be targeted for future initiatives by a national coalition whose goal is to ensure day-to-day pediatric readiness of our nation’s EDs.

Current status of pediatric health system performance measurement
■ We know relatively little about the quality and efficiency of pediatric health care and publicly report even less.
■ Compared to the care provided to Medicare beneficiaries, where extensive research and public information on utilization, costs, and outcomes is increasingly routine,24 pediatric health care often occurs within a black box where the type, quantity, and outcomes of care are unknown.
■ The reasons for the slow pace of developing health care metrics for pediatrics are multi-faceted, some simply by redirecting the nature of pediatric health care, and others the fragmented data sources that are frequently owned by private insurers and providers.
The Dartmouth Atlas of Children’s Health Care in Northern New England David C. Goodman, MD, MS Nancy E. Morden, MD, MPH Shawn L. Ralston, MD Chiang-Hua Chang, PhD Devin M. Parker, BA Shelsey J. Weinstein, BA Copyright 2013 by the Trustees of Dartmouth College

Pediatric Disaster Vulnerabilities
■ Infants and toddlers may not have the cognitive or motor skills to escape from the scene of an incident.
■ PPE is scary
■ Allow families to stay together
■ Take into consideration that infants when wet are slippery and will need a way to get them through the decontamination process - i.e. plastic buckets, car seats, stretchers.
■ Infants and children are at increased risk for hypothermia

Doable Pediatric Procedures Wearing PPE?
Examination
■ Central, peripheral pulse
Procedures
■ CPR
■ AED defibrillator
■ BVM
■ Intubation - cuffed and uncuffed
■ IO- powered
■ Autoinjectors, IM syringes
■ tourniquet

Medical Countermeasure Gaps■ The timely availability of appropriately dosed, safe, effective pediatric antidotes,
supportive drugs and equipment for children of all ages and sizes is crucial.
■ Lack of pediatric autoinjector - pralidoxime
■ Lack of effective oxime
■ Many of the MCMs are used off label – lack the requisite safety, and efficacy information
■ Obesity dosing
■ PPE difficulties

Pediatric Disaster Preparedness Education and Training■ There are no established role-specific national core competencies in disaster health
for children.
■ In the event of a significant disaster most of our children will have to be cared for by non-pediatric or generalist trained clinicians (such as emergency physicians, nurses and paramedics).

RETROFITTING A SYSTEM

Our Current Need
– A population based health delivery model for disaster response
– VISION: A comprehensive, requirement-driven national health care system that is integrated with health delivery, seamlessly scalable, sustainable and educated to meet local, state, regional and national needs during disasters

Cross Cutting Concepts
Right
patient
Right
location
Prehospital
care
Triage
Admitting
processes
Care
coordination
Patient
Flow
Surgical
capacity
Discharge
planning
Population
based
efforts
Mortality
Safety
Quality
Healthcare x x x x x x x x x x
“Preparedness” x x x x x x x x x x x x

Healthcare Operations
■ How many ORs do you have available
■ How many OR teams are ready
■ How many CRNAs or anesthesiologists
■ How many trauma surgeons
■ How long to perform an emergency thoracotomy
■ How long to perform an trauma exploratory laparotomy
■ How fast do you turn over rooms
■ Damage Control Resuscitation including MTP

1 Hospital’s Answer
■ How many ORs do you have available-20
■ How many OR teams are ready-6
■ How many CRNAs or anesthesiologists-6
■ How many trauma surgeons-4
■ How long to perform an emergency thoracotomy-90mins
■ How long to perform an trauma exploratory laparotomy-90mins
■ How fast do you turn over rooms-30 mins

What is your adjusted mortality rate compared to the national injury age-adjusted mortality rate?
Macario A. Are Your Hospital Operating Rooms "Efficient"? Anesthesiology 2006; 105:237-40.

How long till the last red tag in the OR?
■ 10 Red tag patients from a mass shooting
■ Last patient 6 hours later
■ Damage Control Resuscitation including MTP-?

Exploring the relation between process design and efficiency in high-volume cataract pathways from a lean thinking perspectiveEllen J. Van Vliet, Eelco Bredenhoff, Walter Sermeus, Lucas M. Kop, Johannes C.A. Sol, Wim H. Van HartenDOI: http://dx.doi.org/10.1093/intqhc/mzq071 83-93 First published online: 30 November 2010
The environmental context and operational focus primarily influenced process design of the cataract pathways. When pressed to further optimize their processes, hospitals can use these systematic benchmarking data to decrease the frequency of hospital visits, lead times and costs

Discharge Times

Time is muscle-Door to Balloon time
■ ED physician activates
■ Single-call activation system
■ Response team is available within 20–30 minutes
■ Prompt data feedback
■ Senior management commitment
■ Team based approach
■ Paramedics perform pre-hospital tests

Maintaining Healthcare and Outcomes in Disasters
Continuity of Healthcare Operations
Healthcare entities will maintain operations during crises and will be able to implement rapid recovery principles if rendered inoperable
Delivery of CareMedical surge is the capability, from point of injury or illness through the medical system, to rapidly expand the ability to triage, diagnosis, treat and disposition presenting patients from the crisis and all other non-event related patients

Immediate Bed Availability (IBA)
■ The ability of a healthcare community to provide no less than 20% bed availability of staffed members’ beds within four hours of a disaster

IBA
■Evidence informed
■Operationally tenable
■Economically sustainable
■Ethically grounded

Immediate Bed Availability
Stroke/MIs
High Acuity Psychiatric patients
ICU Patients
Acute Surgical Patients
Imminent OB delivery
Convalescing
Awaiting discharge
Behavioral Health Social Issues
Post Operative
Elective Procedures Cancelled
Home
Community Health Centers
Long Term Care
20%
Hospital(s) HCC Partners

Immediate Bed Availability: Making Room within the System
Former Construct
Additional Surge
MED/SURG/OB
Step Down
ICU Additional Surge
ICU
Step Down
MED/SURG/OB
IBA Construct

Institute of MedicineCrisis Standards of Care
Ccoa
litio
nB
uild
ing
IBA
Source: IOM Crisis Standards of Care Report

IBA
ContinuousMonitoring
•Maintain operations•Monitor patient acuity in real-time •Continually establish disaster disposition protocols
Off-load•Disaster disposition protocols utilized•Rapid bed turnover•Discharge or Transfer of lower acuity patients to coalitions partners/home•Deferral of elective admissions/procedures etc.
On-load •Redeploy existing resources to allow for higher-acuity admissions

Madrid bombing
• Coordinated near-simultaneous attacks targeting commuter trains
• 191 dead
• More than 1,800 injured
•1000 acute care beds/healthcare systems•20% IBA=200 beds immediately avail/system•100 healthcare systems in the United States
•Madrid = 2,000 patients=10 systems engaged•Across the U.S., 20,000 beds available—immediately

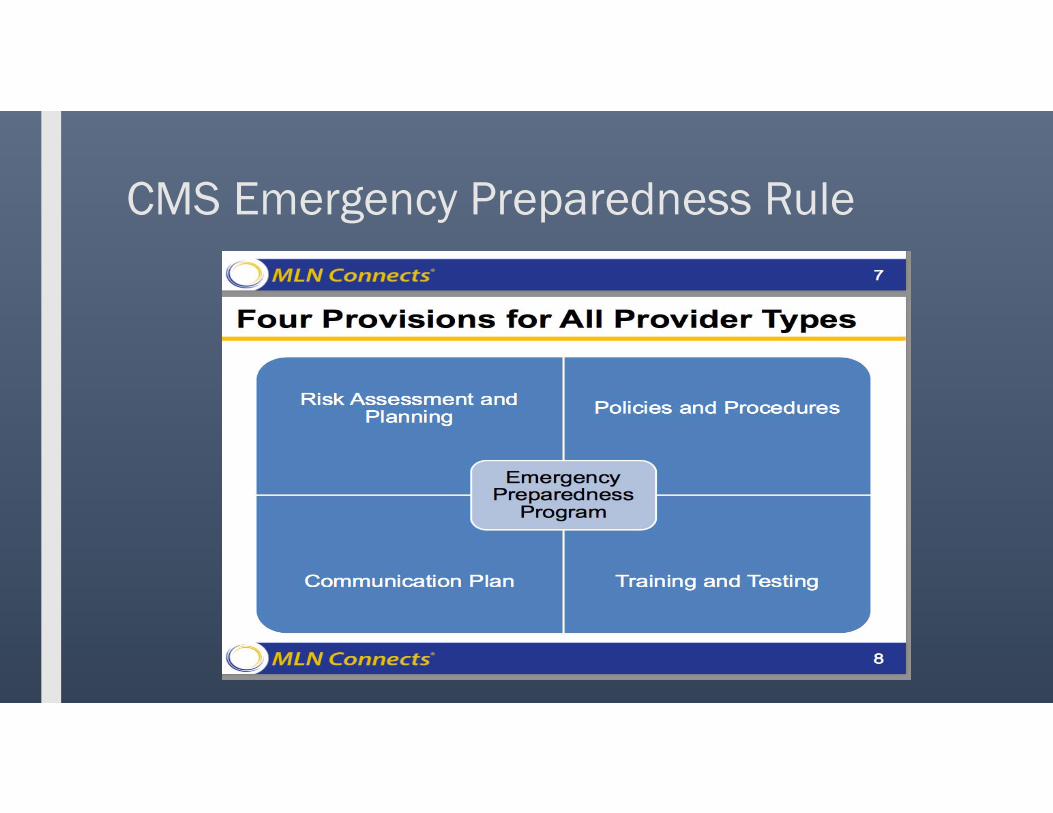
CMS Emergency Preparedness Rule

CMS Emergency Preparedness Rule
■ Emergency plan: Based on a risk assessment, develop an emergency plan using an all hazards approach focusing on capacities and capabilities that are critical to preparedness for a full spectrum of emergencies or disasters specific to the location of a provider or supplier.
■ Policies and procedures: Develop and implement policies and procedures based on the plan and risk assessment.
■ Communication plan: Develop and maintain a communication plan that complies with both Federal and State law. Patient care must be well-coordinated within the facility, across health care providers, and with State and local public health departments and emergency systems.
■ Training and testing program: Develop and maintain training and testing programs, including initial and annual trainings, and conduct drills and exercises or participate in an actual incident that tests the plan.


Centers for Medicare Medicaid Services (CMS) Proposed Rule: Medicare Program: Request for Information Regarding Implementation of the Merit Based Incentive Payment System, Promotion of Alternative Payment Models, and Incentive Payments for Participation in Eligible Alternative Payment Models


Summary
■ Public and private resources, roles, and responsibilities for national health resiliency will continue to evolve relative to political will, the fiscal climate, and the frequency and scale of disasters.
■ Health care organizations, insurers, communities, and the nation can improve health and health care delivery in disasters by using innovative strategies that incentivize and finance quality efforts for care during crisis
■ Payers, providers, and health care communities can link preparedness to day-to-day activities, capitalize on economies of scale, and develop regional value-based models for sustaining emergency preparedness.

Thank you.