Cardio Cardiac cycle
55
THE CARDIAC CYCLE Physiology Department
Transcript of Cardio Cardiac cycle

THE CARDIAC
CYCLE
Physiology Department

• 01. Define the term cardiac cycle.• Define preload and explain why ventricular end-diastolic
pressure, atrial pressure, and venous pressure are all good estimates of ventricular preload in a normal heart.
• Define afterload and explain why arterial pressure is a good estimate of afterload in a normal heart. Predict the consequence of an increase or decrease in arterial pressure on the cardiac workload.
• Define the difference between cardiac performance and cardiac contractility. Describe the impact of changes in preload, afterload, and contractility in determining cardiac performance.
Objectives

Preload• Preload is regulated by venous return to the heart
• Preload is the load (stretch, filling) on the ventricle before ejection
• Measures of Preload: End-diastolic volume, end-diastolic pressure, right atrial pressure
• Frank-Starling’s Law: An increase in preload leads to an increase in stroke volume
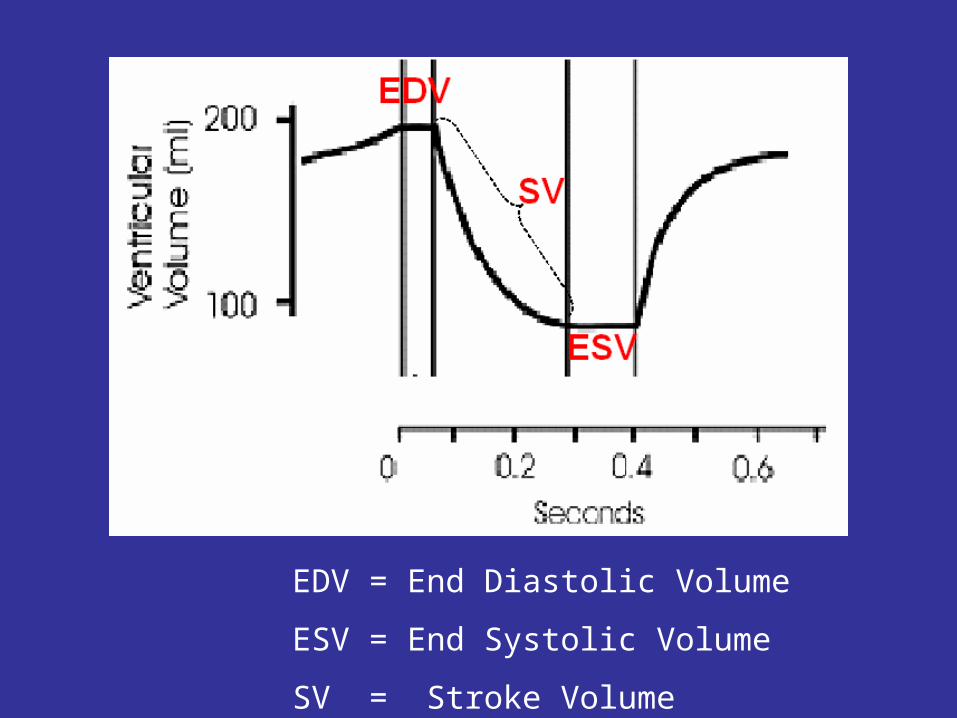
EDV = End Diastolic Volume
ESV = End Systolic Volume
SV = Stroke Volume

Afterload• Definition: The load
against which the LV ejects after the opening of the aortic valve
• Simple measure of afterload: mean arterial pressure

Cardiac Contractility• Definition: Contractile
capability of the heart• Simple measure of
cardiac contractility: Ejection Fraction
• EF = SV/EDV• Cardiac contractility is
increased by sympathetic stimulation
• Family of different Frank-Starling curves for different cardiac contractility

Frank-Starling’s Law of the Heart
End-Diastolic Volume
StrokeVolume
Normal Range: SV increases with EDV
Maximum CapacityTo Produce SV
Mechanism: Length-Force Relations of Muscle Contraction

Family of Frank-Starling Curves
Stroke Volume
Preload (End-Diastolic Volume)
Increase inCardiacContractility
At a given EDV, SV increases With cardiac contractility
Low
High

02. Know the various phases of ventricular systole and ventricular diastole. Contrast the relationship between pressure and flow into and out of the left and right ventricles during each phase of the cardiac cycle.
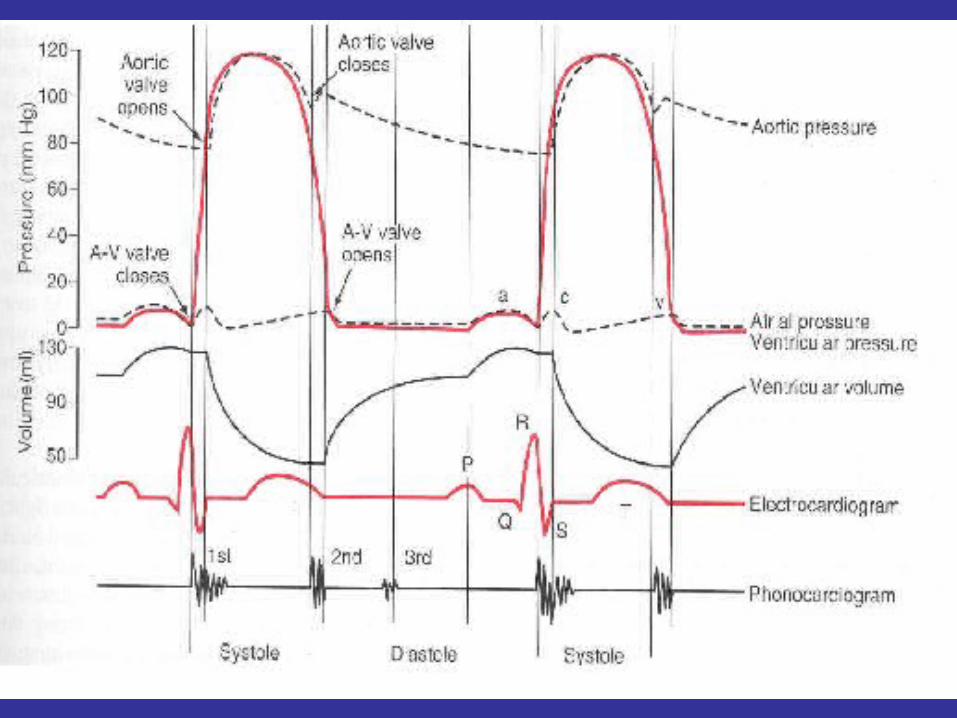
• Draw, in correct temporal relationship, the pressure, volume, heart sound, and ECG changes in the cardiac cycle. Identify the intervals of isovolumic contraction, rapid ejection, reduced ejection, isovolumic relaxation, rapid ventricle filling, reduced ventricular filling and atrial contraction.
• Understand the basic functional anatomy of the atrioventricular and semilunar valves, and explain how they operate.
• Understand how and why left sided and right sided events differ in their timing.
Objectives


Single cardiac cycle

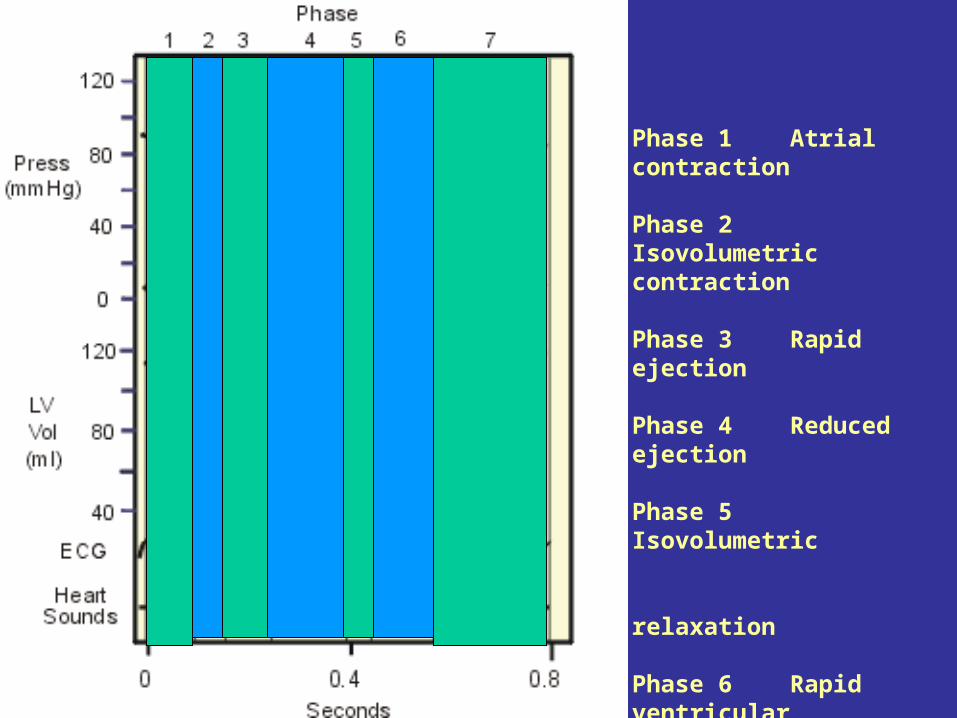
Phase 1 Atrial contraction
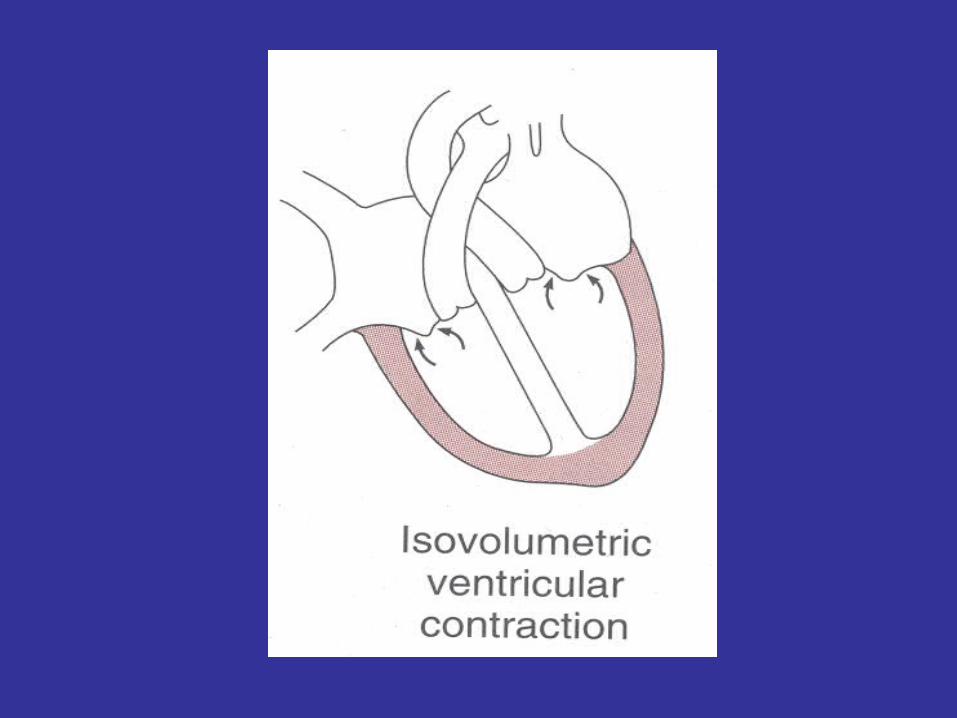
Phase 2 Isovolumetric contraction
Phase 3 Rapid ejection
Phase 4 Reduced ejection
Phase 5 Isovolumetric relaxation
Phase 6 Rapid ventricular filling
Phase 7 Reduced ventricular filling


• 03. Draw and describe the length-tension relationship in a single cardiac cell. Correlate the cellular characteristics of length, tension, and velocity of shortening with the intact ventricle, characteristics of end diastolic volume, pressure, and dP/dt.
• Define contractility and explain why dP/dt is a useful index of contractility. Explain the cellular basis for the effects of Ca2+ on cardiac muscle, but not skeletal muscle, contractility.
Objectives
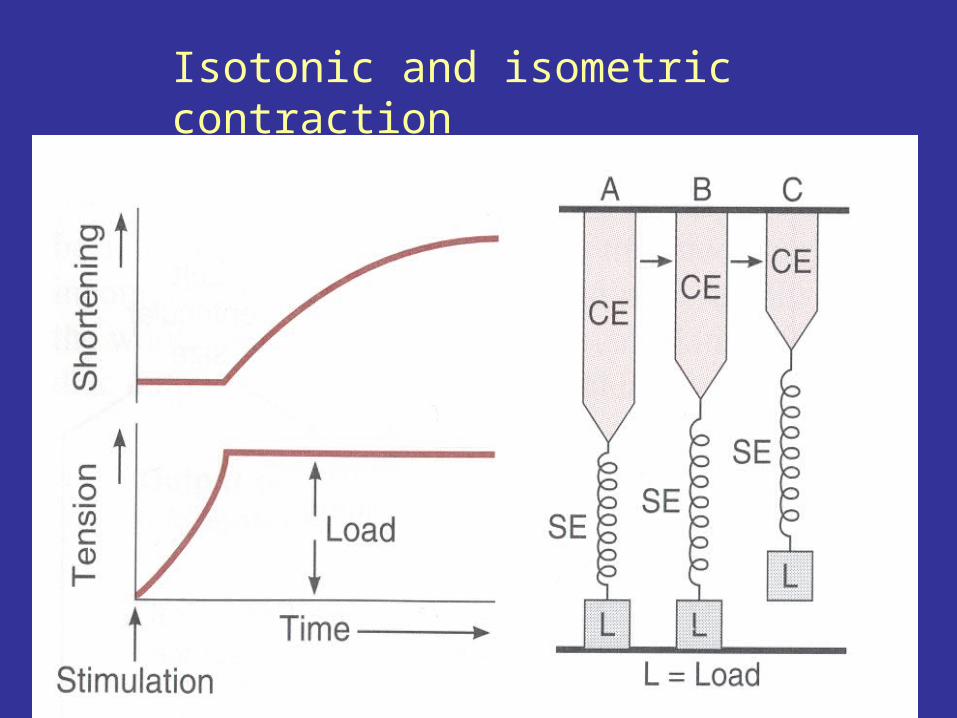
Isotonic and isometric contraction

Isotonic and isometric contraction

Effect of Sympathetic stimulation on contractility
1. Increased dp/dt – increased slope, thus increased rate of pressure development
2. Increased peak LVP due to more forceful contraction
3. Increased rate of relaxation due to increased rate of calcium sequestration
4. Decreased systolic interval due to effects #1 and #2

• 04. Draw a ventricular pressure-volume loop and on it labels the phases and events of the cardiac cycle (ECG, valve movement).
• Differentiate between stroke volume and stroke work. Identify stroke volume and stroke work from a pressure-volume loop.
• Draw the change in pressure-volume loops that would result from changes in a) afterload, b) preload, or c) contractility, for one cycle and the new steady state that is reached after 20 or more cycles.
• 05. Ejection fraction.Define ejection fraction and be able to calculate it from end diastolic volume, end systolic volume, and/or stroke volume. Predict the change in ejection fraction that would result from a change in a) preload, b) afterload, and c) contractility.
Objectives

Pressure-volume loop
Ventricular filling
Isovolumic contraction
Ejection
Isovolumic relaxation

LV Pressure-volume loop

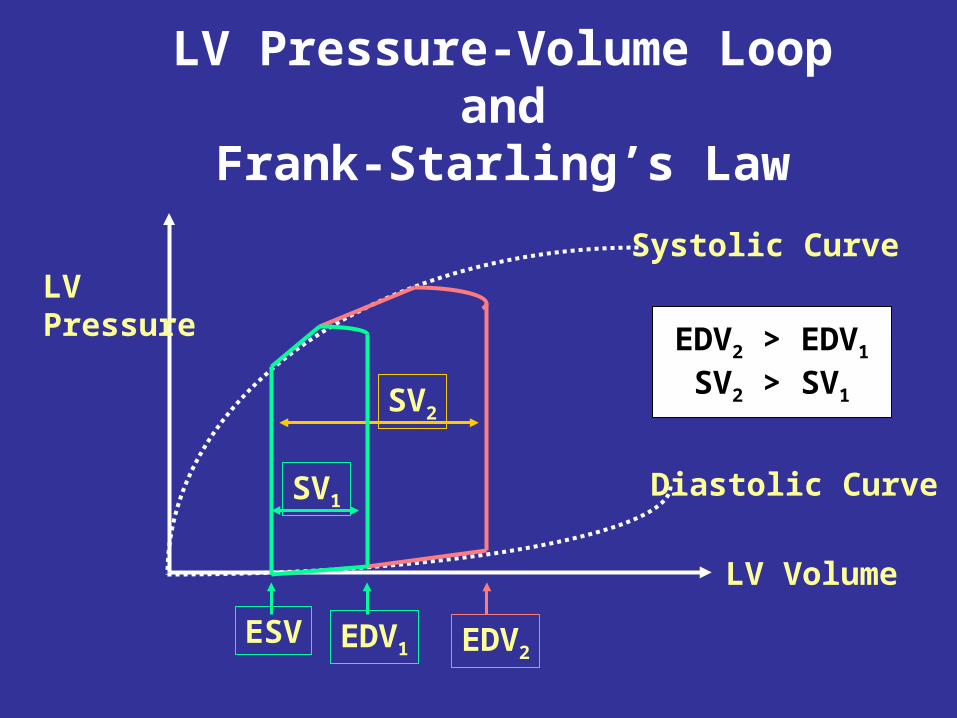
LV Pressure-Volume Loop andFrank-Starling’s Law
LVPressure
LV Volume
Systolic Curve
Diastolic Curve
SV2
EDV2EDV1
SV1
ESV
EDV2 > EDV1
SV2 > SV1

LV Pressure-Volume Loop andAfterload
LVPressure
LV Volume
Systolic Curve
Diastolic Curve
SV2
EDV1
SV1
ESV
EDV2 = EDV1
SV2 < SV1

Objectives
06. Understand the properties of sound and auditory perception that form the basis of auscultation.
Describe the timing and causes of the four heart sounds.
07. Describe the expected auscultation sounds that define mitral stenosis, mitral insufficiency, aortic stenosis, and aortic insufficiency and how each affects the cardiac cycle, left ventricular oxygen needs, and coronary blood flow.
Draw, in correct temporal relationship, the pressure, volume, murmur of each of the valvular defects referred above.

FIG. 1 Interactive exercise-physiology of a pump. Chamber 1, left atrium; chamber 2, left ventricle; chamber 3, aorta; valve M, mitral valve; valve A, aortic valve.

•What happens if P in chamber 2 > P in chamber 3?
•Valve A is open, and volume moves from 2 into 3
•What happens if P in chamber 1 > P in chamber 2?
•Valve M is open, and volume moves from 1 into 2
•What happens if P in 2 is greater than P in chamber 1?
•Fluid starting to move from 2 into 1 will close valve M,
•No fluid will move when the valve is closed
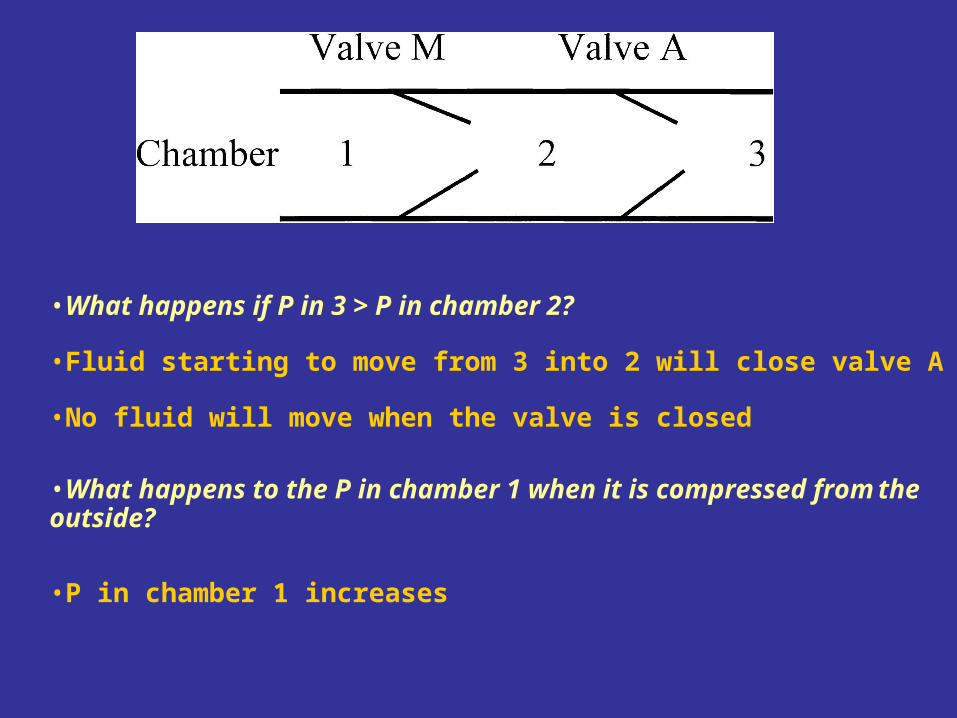
•What happens if P in 3 > P in chamber 2?
•P in chamber 1 increases
•What happens to the P in chamber 1 when it is compressed from the outside?
•No fluid will move when the valve is closed
•Fluid starting to move from 3 into 2 will close valve A

•What happens to the P in chamber 2 when it is compressed from the outside?
•P in chamber 2 increases
•Assume P in 3 is higher than P in 1. What would happen if both valves M and A were open at the same time?
•Fluid would flow from 3 through 2 into 1


Aortic Insufficiency or RegurgitationLow diastolic aortic pressure
Normal systolic aortic pressure
High diastolic ventricular pressure
High ventricular volume
Diastolic, and early systolic murmur
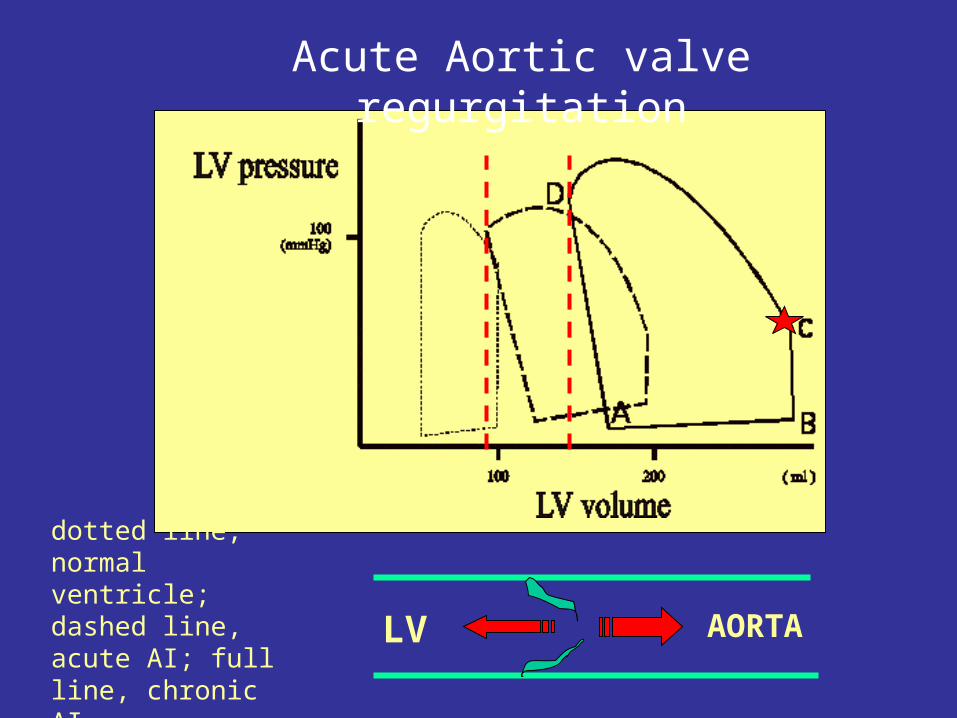
Acute Aortic valve regurgitation
LV AORTA
dotted line, normal ventricle; dashed line, acute AI; full line, chronic AI

Acute Aortic valve regurgitation
Volume loading depend on:• size of the aortic opening• pressure gradient between the aorta and the left ventricle• duration of regurgitation which is determined by the duration of diastole
Illustration copyright 2002, 2003 Nucleus Communications, Inc. All rights reserved. http://www.nucleusinc.com
Acute Aortic valve regurgitation
• For chronic aortic insufficiency, a very long symptom-free interval is typical. During this period, the patients have good exercise tolerance and some may practice intensive sports. After years symptoms of heart failure slowly develop:* fatigue,* edema formation, dyspnea.
• Traumatic or degenerative aortic dissections can dilate the aortic root and spread the valve leaflets causing aortic insufficiency.
• In acute aortic insufficiency, the heart has no time to adapt to volume
overload, and heart failure rapidly results (rapid surgical correction).

Illustration copyright 2002, 2003 Nucleus Communications, Inc. All rights reserved. http://www.nucleusinc.com
Aortic valve stenosis

Aortic Stenosis
Systolic ventricular pressure > Aortic Pressure
Rate of ejection reduced (see volume trace)
Systolic murmur (wedge shaped)

• Normal aortic valve area is 2-3 cm2. If it is less than 1.5 cm2, it is hemodynamically relevant
• Outflow obstruction requires high ventricular pressures to generate ejection, cardiac work is increased (increase of the area of the pressure volume loop)
Acute Aortic valve stenosis

Acute Aortic valve stenosis• The heart adapts to the increased pressure work by
concentric hypertrophy, i.e., by an increase in LV muscle mass at normal LV volumes
• The clinical symptoms of aortic stenosis are: angina, cardiac failure, syncope, sudden death
Concentric: chronic pressure overload; sarcomeres in parallel are added
Excentric: volume overload, sarcomeres in series are added

High systolic atrial pressure (see v curve)
Causes volume loading of the left ventricle
Systolic murmur
Mitral insufficiency or
regurgitation

6
There is no isovolumetric contraction phase (line B/C), because of the ejection of blood into the left atrium at the begining of ventricular contraction.
More than 50% of LV volume can be ejected into the left atrium before the aortic valve opens. This mechanism reduces LV afterload (only moderate LV hypertrophy develops).
Mitral insuficiency or regurgitation

Mitral stenosis
Atrial pressure is high throughout cycle
Diastolic murmur (filling murmur)

Main feature of mitral stenosis: reduced preload reserve and impaired LV inflow.
20-30 years before the onset of the first symptoms (dyspnea). The one year survival after the onset of symptoms is only 80%, making surgical valve replacement necessary
Acute mitral valve stenosis


LeftVentricularPressure
Left ventricular volume (Preload)
Acute Aortic valve stenosis
Acute responses with no change in heart rate, inotropy, blood volume, or systemic vascular resistance

Acute responses with no change in heart rate, inotropy, blood volume, or systemic vascular resistance
LeftVentricularPressure
Left ventricular volume or Preload
Acute mitral valve regurgitation

LeftVentricularPressure
Left ventricular volume (Preload)
Acute mitral valve stenosis
Acute responses with no change in heart rate, inotropy, blood volume, or systemic vascular resistance