
Cardinal temperatures and vernalisation requirements for … · The cardinal temperatures and...
77
Cardinal temperatures and vernalisation requirements for a selection of vegetables for seed production A dissertation submitted in partial fulfilment of the requirement for the Degree of Bachelor of Agricultural Science at Lincoln University by R. A. Goodger Lincoln University 2013
Transcript of Cardinal temperatures and vernalisation requirements for … · The cardinal temperatures and...

Cardinal temperatures and vernalisation requirements for a selection of vegetables for seed production
A dissertation
submitted in partial fulfilment
of the requirement for the Degree of
Bachelor of Agricultural Science
at Lincoln University
by
R. A. Goodger
Lincoln University
2013

i
ABSTRACT
Abstract of a Thesis submitted in partial fulfilment of the requirement for
the Degree of Bachelor of Agricultural Science
Cardinal temperatures and vernalisation requirements for a selection of
vegetables for seed production
By
R. A. Goodger
The cardinal temperatures and vernalisation requirements for a selection of vegetables
for seed production were studied. Experiment one assessed the rate of germination
(1/days) of selected vegetable species over a range of 5-40 °C, in order to calculate the
cardinal (base, optimum and maximum) temperatures for germination. The cardinal
temperatures for carrot and red beet were 0.1, 30.9 and 40.7 °C, and 4.2, 35.9 and 44.4
°C respectively. Experiment two examined the vernalisation response of imbibed
cabbage, carrot and red beet seeds, plus perennial ryegrass as a comparison over
duration treatments of 0-12 weeks at 4 °C. Red beet and ryegrass had positive
vernalisation responses with anthesis occurring in plants from the 4-12 week durations in
red beet, and all durations in ryegrass. The number of days to anthesis and the final
number of main stem leaves did not differ significantly (P = 0.143 and P = 0.323
respectively) among vernalisation durations in red beet, but did differ significantly in
ryegrass (P <0.001 and P = 0.004 respectively). The number of days to anthesis decreased
by 3.6 days for every one week increase in vernalisation duration. The same pattern was
observed for main stem leaf number in ryegrass, with a decrease of 0.1 leaves for every
one week increase in vernalisation duration. This response is likely to be attributed to
perennial ryegrass having a lower base temperature (1.1 °C) than the vernalisation
treatment (4 °C), leading to continued development towards anthesis throughout the
vernalisation period. Red beet had a base temperature of 4.6 °C, so may not have
experienced development towards reproduction, or may have reached vernalisation
saturation at ≤ 4 weeks, resulting in a minimum number of leaves produced for all

ii
durations. There is potential for the sowing date of red beet to be changed to spring for
successfully vernalised seeds, which would reduce the expenses of weed, pest and
disease control and give opportunity of other land uses over the winter period.
Keywords: biennial, cabbage (Brassica oleracea), cardinal temperatures, carrot (Daucus
carota), crop rotation, disease, germination, perennial ryegrass, photoperiod, red beet
(Beta vulgaris).

iii
TABLE OF CONTENTS
ABSTRACT ............................................................................................................................... i
Table of Contents ................................................................................................................. iii
List of Tables .......................................................................................................................... v
List of Figures ........................................................................................................................ vi
List of Plates ......................................................................................................................... vii
List of Appendices ............................................................................................................... viii
1 INTRODUCTION ............................................................................................................. 1
2 REVIEW OF THE LITERATURE ......................................................................................... 3
2.1 Introduction ............................................................................................................ 3
2.2 Current practices for vegetable seed production ................................................... 3
2.2.1 Length of season .............................................................................................. 3
2.2.2 Weeds, pests and diseases .............................................................................. 4
2.2.3 Crop rotation ................................................................................................... 9
2.3 Physiology of biennial crops ................................................................................. 11
2.4 Cardinal temperatures .......................................................................................... 12
2.4.1 What are cardinal temperatures? ................................................................. 12
2.4.2 Calculating base temperature ....................................................................... 12
2.4.3 Vegetable seed base temperatures............................................................... 14
2.5 Vernalisation ......................................................................................................... 17
2.5.1 Explaining vernalisation ................................................................................. 17
2.5.2 Juvenile stage ................................................................................................ 20
2.5.3 Optimum vernalisation .................................................................................. 21
2.5.4 De-vernalisation ............................................................................................ 24
2.6 Photoperiod .......................................................................................................... 25
2.6.1 Explaining photoperiod ................................................................................. 25
2.6.2 Vegetable photoperiod examples ................................................................. 27
2.7 Conclusions ........................................................................................................... 27
3 MATERIALS AND METHODS ......................................................................................... 29
3.1 Experiment 1: Determination of cardinal temperatures ...................................... 29
3.1.1 Experimental design ...................................................................................... 29
3.1.2 Measurements ............................................................................................... 29
3.1.3 Statistical analysis .......................................................................................... 30

iv
3.2 Experiment 2: Determination of vernalisation requirement................................ 31
3.2.1 Experimental design ...................................................................................... 31
3.2.2 Temperature and lighting .............................................................................. 32
3.2.3 Measurements ............................................................................................... 32
3.2.4 Statistical analysis .......................................................................................... 33
4 RESULTS ....................................................................................................................... 34
4.1 Base temperature experiment.............................................................................. 34
4.1.1 Germination percentage ............................................................................... 34
4.1.2 Germination rate and estimation of cardinal temperatures ........................ 37
4.2 Vernalisation experiment ..................................................................................... 40
4.2.1 The number of plants that flowered ............................................................. 42
4.2.2 Vernalisation effect on the number of days to anthesis ............................... 43
4.2.3 Vernalisation effect on the number of main stem leaves produced ............ 45
5 DISCUSSION ................................................................................................................. 48
5.1 Cardinal temperature experiment ........................................................................ 48
5.1.1 Cumulative germination percentage ............................................................. 48
5.1.2 Germination rate and cardinal temperatures ............................................... 49
5.1.2.1 Methods ................................................................................................. 49
5.1.2.2 Moisture ................................................................................................. 51
5.1.2.3 Origin ...................................................................................................... 52
5.2 Vernalisation ......................................................................................................... 52
5.2.1 Determining vernalisation response ............................................................. 52
5.2.2 Cabbage ......................................................................................................... 53
5.2.3 Carrot ............................................................................................................. 54
5.2.4 Red beet ......................................................................................................... 56
5.2.4.1 Days to anthesis ..................................................................................... 56
5.2.4.2 Main stem leaf number .......................................................................... 57
5.2.5 Perennial ryegrass ......................................................................................... 57
5.2.5.1 Days to anthesis ..................................................................................... 57
5.2.5.2 Main stem leaf number .......................................................................... 58
5.2.6 Application to the vegetable seed industry .................................................. 59
5.3 Conclusions ........................................................................................................... 61
Acknowledgements ............................................................................................................. 62
References ........................................................................................................................... 63
Appendices .......................................................................................................................... 68

v
LIST OF TABLES
Table 2.1 The main pathogens of carrot crops (from George, 2009). .................................. 5
Table 2.2 The percentage of leaves infected with Alternaria radicina or A. dauci in a field spray trial in New Zealand (adapted from Soteros, 1979). ................................ 7
Table 2.3 The effect of weed competition on yield (fresh weight of roots) and leaf area of carrot plants. Measurements are expressed as a percent reduction from the weed free controls (adapted from Shadbolt and Holm, 1956). ......................... 8
Table 2.4 The percent reduction from the weed free checks of the yield (fresh weight of roots) of red beet plants. Measurements were taken early in the season at the time that the weeds were removed (adapted from Shadbolt and Holm, 1956). ............................................................................................................................ 9
Table 2.5 The base temperatures for a selection of vegetable species. ............................ 15
Table 2.6 The minimum, optimum and maximum temperature range for vernalisation resulting in flowering, and the duration of cold exposure required in some important vegetable seed crops (adapted from Wiebe, 1990). ....................... 22
Table 2.7 Effects of different constant temperatures, and length the plants were exposed to temperature, on subsequent flowering in the carrot cultivar ‘Chantenay Red Cored’ (From Atherton et al., 1990). ......................................................... 23
Table 3.1 The vegetable species used in this experiment, sourced from South Pacific Seeds Ltd (Darfield, NZ). ................................................................................... 29
Table 3.2 The average monthly temperature in Fletcher glasshouse, Lincoln University. . 32
Table 4.1 The base, optimum and maximum temperature (°C) for germination determined by linear regression for the selected vegetable species and perennial ryegrass. ........................................................................................... 40

vi
LIST OF FIGURES
Figure 2.1 The effect of constant temperature on the rate of germination for different germination percentages of the carrot seed population. Extrapolation of the linear regression fitted to data for the 50th percentile to the temperature axis (Tb) is shown (from Finch‐Savage et al., 1998). ................................................ 13
Figure 2.2 Vernalisation response in days to flowering in Ryegrass (Lolium) species (from Leopold and Kriedmann, 1975). ....................................................................... 18
Figure 2.3 Temperature effectiveness on vernalisation (from Weir et al., 1984). ............ 19
Figure 2.4 The percentage of winter rye seeds remaining vernalised vs. duration of vernalisation, after de-vernalising treatment (from Purvis and Gregory, 1952). .......................................................................................................................... 25
Figure 2.5 An explanation of red light and far red light accumulation in plants (adapted from Kendrick and Frankland, 1983). ............................................................... 26
Figure 4.1 (1 of 2) The average cumulative germination percentage at temperature
treatments of 5 °C (●), 10 °C (○), 15 °C (▼), 20 °C (△), 25 °C (■), 30 °C (□),
35 °C (◆) and 40 °C (◇) for Asian radish (a), cabbage (b), carrot (c), Chinese cabbage (d), mustard (e) and onion (f). Time is the number of days from initial imbibition to germination. Error bars represent the standard error of the mean for the final germination percentages. .................................................. 35
Figure 4.2 (1 of 2) Rate of germination (1/days) to 50% germination over a range of temperatures (°C) increasing in 5 °C increments used to find the base, optimum and maximum temperatures for germination for Asian radish (a), cabbage (b), carrot (c), Chinese cabbage (d), mustard (e) and onion (f). ........ 38
Figure 4.3 The number of plants that flowered per pot (out of a possible 4) over
vernalisation durations of 0-12 weeks, for perennial ryegrass (○) and red
beet (●). The effect of vernalisation (LSD 0.537, p <0.001) and species (LSD 0.287, P <0.001) was significant with no interaction. ...................................... 43
Figure 4.4 The number of days on average from the end of the vernalisation period until anthesis occurred in perennial ryegrass over a vernalisation range of 0-12 weeks. The vernalisation treatment had a significant effect on the number of days to anthesis (LSD 8.15, P <0.001). .............................................................. 44
Figure 4.5 The number of days on average from the end of the vernalisation period until anthesis occurred in red beet over a vernalisation range of 0-12 weeks. The vernalisation treatment did not have a significant effect on the number of days to anthesis (P = 0.143). ............................................................................. 45
Figure 4.6 The main stem leaf number for perennial ryegrass over vernalisation durations of 0-12 weeks. The vernalisation treatment had a significant effect on the number of main stem leaves (LSD 0.817, P = 0.004). ....................................... 46
Figure 4.7 The main stem leaf number for red beet over vernalisation durations of 0-12 weeks. The vernalisation treatment did not have a significant effect on the number of main stem leaves (P = 0.323). ......................................................... 47

vii
LIST OF PLATES
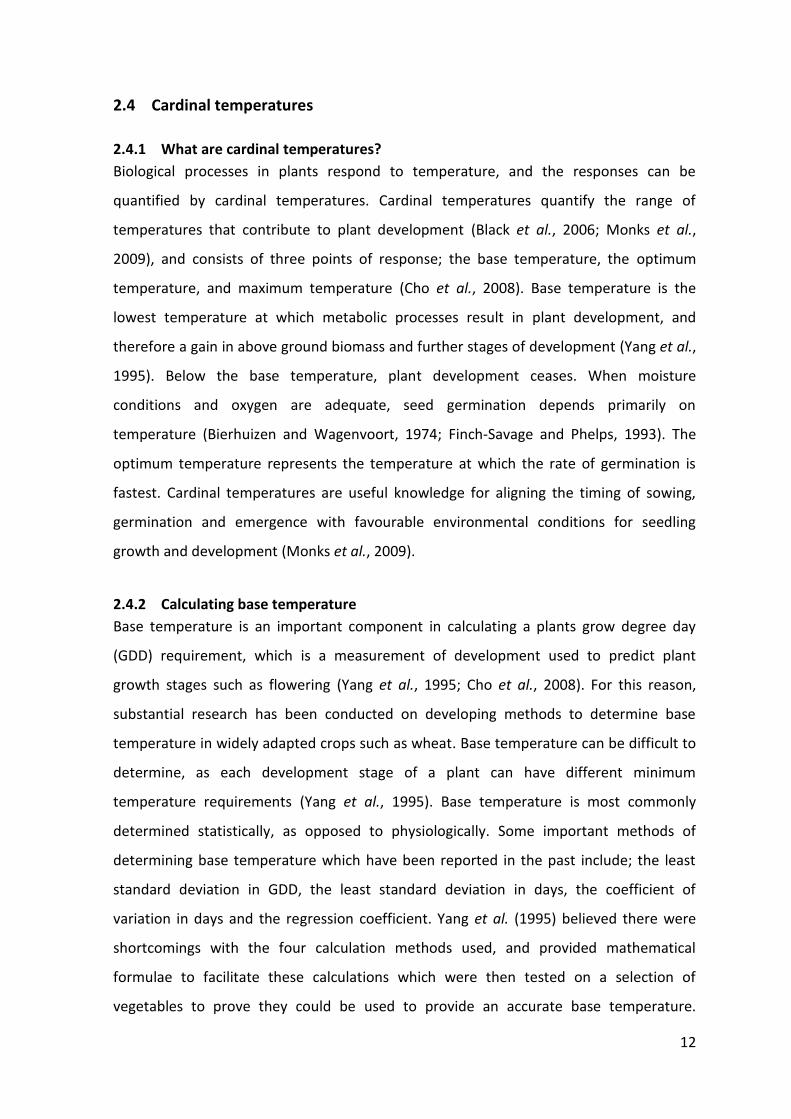
Plate 4.1 The visual effect of vernalisation durations of 0-12 weeks on flowering in red beet, with no reproductive changes in 0-2 week plants. ................................. 41
Plate 4.2 Vegetative carrot plants from 0-12 week vernalisation durations with no visual signs of reproductive change in any duration. ................................................. 41
Plate 4.3 Vegetative cabbage plants from 0-12 week vernalisation durations with no visual signs of reproductive change in any duration. ....................................... 42
Plate 5.1 Microscopic view of the vegetative stage of the growing point (apex) of a cabbage plant exposed to 12 weeks of vernalisation (at 4 °C). ....................... 54

viii
LIST OF APPENDICES
Appendix 1 The vernalisation experiment complete randomised block design for the layout of the pots in Fletcher glasshouse. ........................................................ 68

1
1 INTRODUCTION
The seed industry is an important part of New Zealand’s economy and land based
industries. Annual seed exports from New Zealand in 2010 and 2011 were valued at
approximately $136 million per year, excluding cereal seeds (Hampton et al., 2012). From
this figure, carrots (Daucus carota) contribute an average of $11.35 million per year.
Carrot plants for seed production have a biennial lifecycle, meaning they take two years
(13-14 months) to reach maturity. Carrot seed crops are of particular interest in this
study, as they are a long term land commitment and high capital input crop due to
disease susceptibility and low competiveness against weeds. A decrease in the growing
period of biennial seed crops such as carrot is likely to reduce disease and weed issues
and minimise production expenses.
Biological processes in plants respond to temperature, and the responses can be
quantified by base, optimum and maximum temperatures (cardinal temperatures) for
development. Base temperature is the lowest temperature at which metabolic processes
result in plant development, and therefore a gain in above ground biomass and further
stages of development (Yang et al., 1995). Cardinal temperatures are useful knowledge
for aligning the timing of sowing, germination and emergence with favourable
environmental conditions for seedling growth and development (Monks et al., 2009).
Base temperature is important in calculating the thermal time requirements of a crop,
and is also an important concept in vernalisation (cold period) research. Base
temperature is usually calculated statistically rather than physiologically due to
difficulties with varying developmental phases. Literature on the base temperature for
germination in vegetable seeds is limited. There are various models available for
predicting and calculating the base temperature for plants, but the estimates of base
temperatures from experiments are variable, and the methods are often tedious and lack
a theoretical foundation in mathematics (Yang et al., 1995).
Many biennial vegetable species require a vernalisation period before they become
reproductive and flower (Alessandro and Galmarini, 2007). The stimulus for stem
elongation and flowering has long been known to be vernalisation, but the range of
effective temperatures, the duration required and receptive stages vary for different

2
species and cultivars, and have not been precisely determined (Chouard, 1960; Atherton
et al., 1990; Alessandro and Galmarini, 2007 etc.). Red beet (Beta vulgaris) has been
stated to have the ability to receive vernalisation as a seed (Chouard, 1960), which may
suggest that other species could also have this ability. This could lead to the potential to
plant a seed crop post-winter, resulting in a shortened lifecycle and decreased pest and
disease issues. Other species of interest in this study include red beet and cabbage
(Brassica oleracea), as they are also biennial plants with similar growing seasons and pest
and disease issues to carrot.
The aim of this thesis was to calculate cardinal temperatures for germination for a
selection of vegetable species and to determine if cabbage, carrot and red beet could be
vernalised as imbibed seed and therefore reduce the period to flowering.

3
2 REVIEW OF THE LITERATURE
2.1 Introduction
The objective of this review is to gain an insight into the physiology of biennial crops,
explain base temperature, vernalisation and photoperiod, and discuss some basic
principles of vegetable seed production. An understanding of these topics will help to
assess the potential of changing the sowing date of some biennial vegetable seed crops
to after the winter.
2.2 Current practices for vegetable seed production
2.2.1 Length of season
Due to the species of interest in this review having a biennial lifecycle when grown for
seed, the length of season is greater than twelve months. This is a long term land
commitment causes major difficulties with weed competition and diseases, and well as
some inconvenience with crop rotation with other species. The species of interest in this
review (mainly carrot and red beet, and cabbage to a lower extent) all have similar
season lengths, generally being planted in late summer/early autumn and harvested early
autumn the following year. The length of season for carrot is explained in more detail; for
carrot seed production using the seed-to-seed method, sowing generally takes place in
January-February in Southern Hemisphere (McDonald and Copeland, 1997; Kelly and
George, 1998). After germination, the juvenile seedling produces leaves and a tap root
before being vernalised over the winter period, and proceeding to flower in the spring
and produce seed for harvest in late February to March (McDonald and Copeland, 1997).
There is some variation in the literature on the growing season for carrot seed crops, as
Alessandro and Galmarini (2007) state that there are early flowering cultivars available
that are able to be sown from January to July (summer to early winter), and achieve
flowering in the same year. It was also stated that late flowering cultivars need to be
sown early in summer (January) to achieve flowering late in the following spring
(November), so it could be assumed that majority of the literature discussed is referring
to late flowering carrot cultivars.

4
There may be potential to shorten the growing season of vegetable seed crops with an
obligate vernalisation requirement, by exposing imbibed seeds to a cold period, as
opposed to a post-juvenile plant. If this was successful the sowing date of vegetable seed
crops such as carrot may be able to be changed to after winter. This would mean the
length of season/time in the ground would be much shorter (less than 12 months) which
may have a positive effect on crop rotation and pest and disease issues. There is an
‘opportunity cost’ of being able to do something else with the land between autumn and
spring if the planting of crops like carrot and red beet was able to be moved to spring.
If the length of time that a carrot seed crop is in the ground is reduced by planting after
winter, then a winter cover crop such as oats (Avena sativa) could be planted. Winter
cover crops are used reduce soil erosion and loss of plant available nutrient s from
leaching and runoff (Dabney et al., 2001). Some other factors cover crops may also help
with include weed suppression, increasing soil quality, increasing beneficial insect
populations and some disease reduction (Dabney et al., 2001). There is opportunity for
income from grazing or taking silage cuts off a winter cover crop in place of where carrots
or red beet would usually be growing. Winter is the most susceptible time period for
these crops to develop disease and weed issues (see Section 1.2). Carrots especially
require continuous disease control, usually in the form of fungicide and chemical sprays
which may cost up to $1000/ha for the period of February-August (R.Chynoweth,
14/10/2013, Pers.Comm). This means there is also opportunity cost to save money on
chemical expenses and make income from the cover crop. The current length of carrot
seed season running from January/February until March/April the following year
(McDonald and Copeland, 1997) places some restrictions on the use of winter cover crops
which would need to be sown in March, or earlier for sufficient dry matter production
(see Section 2.2.3)(Dabney et al., 2001).
2.2.2 Weeds, pests and diseases
It is well known that carrots, and red beet are susceptible to many diseases, insects, and
weeds and that crop rotation is one of the most effective production practices for
minimising their occurrence (McDonald and Copeland, 1997), as well as host resistance
and chemical use.

5
George (2009) produced a table of the main pests and seed-borne pathogens effecting
carrot crops (Table 2.1).
Table 2.1 The main pathogens of carrot crops (from George, 2009).
Pathogens Common names
Alternaria dauci Carrot leaf blight Alternaria radicina Black root rot, seedling blight Cercospora carotae Cercospora blight of carrot, leaf spot Erysiphe heraclei Powdery mildew
Phoma rostrupii Phoma root rot Xanthomonas campestris Bacterial blight, root scab Ditylenchus dipsaci Eelworm
Beet crops are also known to have serious pathogen issues, with mildews (such as
powdery mildew (Blumeria graminis)), Cercospora leaf spot, damping off (caused by
numerous pathogens), root rot (from water moulds such as Phytophthora species) and
dry rot canker (Corticium vagum) being some of the most common problems affecting
crop yields (Errakhi et al., 2007).
The pathogens presented in Table 2.1 have been produced from northern hemisphere
literature, but there has been literature published from the southern hemisphere on
some of the same pathogens, particularly the Alternaria species. Alternaria radicina and
Alternaria dauci were stated in literature by Soteros (1979) to be infectious leaf
pathogens of carrot crops in New Zealand, causing considerable damage for both root
and seed crops.
Alternaria radicina is a fungal pathogen primarily of carrot that can cause black root rot,
leaf and umbel blight and pre and post-emergence damping off (condition where seed or
seedling dies/weakens), and is both seed and soil borne (Soteros, 1979; Farrar et al.,
2004; Hampton et al., 2012). It is believed to have been introduced in New Zealand in the
late 1960’s (Soteros, 1979) via imported carrot seed. Infections in carrot seed crops may
lead to reduced seed yield due to root rot and foliar damage, and severe infections can
cause the entire umbel to become necrotic and produce no seed at all (Farrar et al.,

6
2004). Another major problem caused by A. radicina is reduced carrot seed germination.
Reduced germination led to carrot seed lots not meeting contracted standards, and being
rejected by European seed house markets (Hampton et al., 2012). Control of A. radicina
can be difficult as it can spread by seed, soil, wind and crop residue (Farrar et al., 2004),
but is necessary to prevent destruction of the photosynthetic surface area of the plants
(Soteros, 1979). Alternaria dauci causes leaf blight, but can also infect developing seeds
by infecting buds and flowers, which may lead to non-viable seed (Soteros, 1979; Farrar
et al., 2004). If seed is infected with A. dauci fungus then it can spread new strains of the
pathogen to existing carrot production areas, or transmitted it to other areas of carrot
production.
Control methods for the Alternaria carrot pathogens include crop rotation (see Section
2.2.3), cultivation, fungicide application, clean seed, sanitation/seed treatments and
cultivar selection (Soteros, 1979; Farrar et al., 2004). For management of the disease
under high pressure, no single control measure is sufficient. Literature on carrots
produced for the harvestable root product has stated that intensive foliar fungicide
application is routine for adequate control of Alternaria pathogens (Ben-Noon et al.,
2001; Farrar et al., 2004). Fungicide seed treatment can also be used, although it is often
expensive and may reduce seed germination (Farrar et al., 2004). It could be assumed
that these control methods would be the same for carrot seed crops, as they go through
the same lifecycle as plants which are harvested for the root product.
In a trial on the effectiveness of three field spray fungicides on four carrot cultivars,
Soteros (1979) found that on an average of 66% of carrot seedlings were infected with
either or both of the Alternaria pathogens in the untreated control (Table 2.2). The carrot
cultivars were not defined. All of the fungicides effectively reduced the number of
infected leaves, but triphenyltin hydroxide had the best control with an average of only
9.4% of leaves infected after being sprayed seven times over a three month period. This
fungicide however was withdrawn from sale in New Zealand not long after the trial, and
focuses were aimed towards a fungicide called propineb which had been shown to have
successful control of Alternaria pathogens in glasshouse trials (Soteros, 1979).

7
Table 2.2 The percentage of leaves infected with Alternaria radicina or A. dauci in a field spray trial in New Zealand (adapted from Soteros, 1979).
Iprodione and chlorothalonil were the most popular choices of fungicide in the United
States in the early 2000’s, as well as azoxystrobin and pyraclostrobin showing excellent
control in field evaluations for control of leaf blight (Farrar et al., 2004). Fungicide sprays
are generally initiated before the first appearance of disease, and are followed with
subsequent sprays for the rest of the growing season, which has been seen in some
literature to be up to 40 sprays (Ben-Noon et al., 2001). This is likely to be labour and cost
intensive and a shorter growing season could be beneficial.
Carrots do not compete well with weeds, as weeds tend to establish faster, and can
quickly out compete the crop in the early stages of the season (Sasnauskas et al., 2012).
Sasnauskas et al. (2012) also confirm that under intensive agricultural conditions,
chemical application is the most effective method of controlling weeds. Weeds can
dominate carrot crops because in the beginning of the carrot growth cycle, the root of
the plant is the photosynthetic sink and is growing at the expense of the above ground
canopy. This means weeds generally have a much greater ground cover (Sasnauskas et
al., 2012). Control of weeds in carrot seed crops is almost totally dependent on
chemicals, as any physical alteration to the seedbed may affect the seed placement and
result in poor establishment (McDonald and Copeland, 1997).
The ability of weeds to dominate crops was shown in an experiment by Shadbolt and
Holm (1956) where the yield of carrots (fresh weight of roots) was significantly decreased
by weed stands of 30 and 50% of the crop area competing for more than four and a half
weeks (Table 2.3). The spring measurements were taken after weeds were removed early
1 2 3 4
Triphenyltin hydroxide 7 8.5 10.2 10.5 8.7 9.4
Captafol 6 24.7 30.5 32.2 28.2 28.9
Control 0 50.5 76.2 78.7 58.2 65.9
CultivarMean
Triphenyltin acetate
plus maneb6 20.2 24.727.225.5 24.4
Number
of spraysFungicide

8
in the growing season. At this stage where carrots had been competing with weeds for
four and a half and five and a half weeks at 50% of the crop area there was a 92.9 and
90.9% reduction respectively in the fresh weight of carrot roots. The reductions in the
autumn measurement were still significantly different from weed free control plots,
however the reductions were not as great as in the spring measurement. This means the
recovery from weeds was greater and can be related to crop maturity and competition
ability. This is in agreement with what Sasnauskas et al. (2012) stated in relation to
carrots having poor competition ability in early growth stages.
Table 2.3 The effect of weed competition on yield (fresh weight of roots) and leaf area of carrot plants. Measurements are expressed as a percent reduction from the weed free controls (adapted from Shadbolt and Holm, 1956).
Weed Stand (%)
Duration of competition
(weeks)
Percent reduction in yield (fresh weight of roots)
Percent reduction in leaf area
Spring Autumn Spring Autumn
15 3.5
11.6 8.4 3 30 3.5
4.5 9.1 + 7.5
50 3.5
11.6 25 + 5.7
15 4.5 73.6 * 30.1 * 40.6 9.4 30 4.5 81.2 * 30.6 * 49.3 * 12.5 50 4.5 92.9 * 44.5 * 69.4 * 28.7
15 5.5 77.7 * 38.7 * 66 * 26.8 30 5.5 87.4 * 47.4 * 63 * 33.7 50 5.5 90.9 * 61.9 * 73.8 * 36.1
Note: * Significantly different from the weed free check at 1% level
Leaf area was also reduced in the spring measurements by as much as 73.8% in the 50%
weed cover for five and a half weeks (Shadbolt and Holm, 1956). This would effectively
reduce the plants photosynthetic ability, with smaller leaf area not being able to
intercept as much light (Taiz and Zeiger, 2010). Weeds in America may differ to New
Zealand weeds, but it has already been established that carrots struggle with weed
competition, so this data simply quantifies the extent of damage to carrot crops. The root
of vegetable species like carrots and red beet is important for seed production, as the
plant would die without it. The root is in the ground for a long period of time (>12

9
months) with crops such as these, so it is important for the root to stay protected from
pests and disease.
Shadbolt and Holm (1956) also included red beet in their weed trial, and found similar
effects with weeds generally reducing the yield with increasing weed stands and
competition duration (Table 2.4). The damage of weeds on red beet plants was not as
severe as the carrot plants in this study.
Table 2.4 The percent reduction from the weed free checks of the yield (fresh weight of roots) of red beet plants. Measurements were taken early in the season at the time that the weeds were removed (adapted from Shadbolt and Holm, 1956).
Weed Stand (%) Duration of
competition (weeks) Reduction in yield (% fresh
weight of roots)
15 4 16.7 30 4 27.2 50 4 58.4
15 5 56.5 30 5 59.8 50 5 63.3
15 6 16.4 30 6 53.2 50 6 61.7
2.2.3 Crop rotation
Crop rotation is one of the most effective production practices for minimising the
occurrence of weeds, pests and diseases in crops, as well as being important for
maintaining soil physical conditions and plant nutrition (McDonald and Copeland, 1997;
George, 2009).
Crop rotation is an important part of the control of the Alternaria carrot diseases in the
soil, but the rotation must be of sufficient duration to allow carrot debris to completely
decompose and eliminate to fungus (Farrar et al., 2004). Kelly and George (1998)
recommend a break of at least three years between carrot seed crops, and an increase in
this break if there has been presence of soil-borne pathogens such as Sclerotinia

10
sclerotiorum (white mold/watery soft rot). Hampton et al. (2012) suggested that a seven
to eight year gap between carrot seed production in the same paddock is required to
avoid soil-borne issues from A. radicina, after finding the pathogen present in soil six
years after carrot seed was harvested, but absent seven or more years after harvested.
Farrar et al. (2004) also suggested at least eight years rotation for heavily infested soils.
Non-host crops such as faba bean, alfalfa (lucerne), wheat or barley which may have
antifungal root exudates, could be included in the crop rotation to reduce levels of A.
radicina more quickly (Farrar et al., 2004; Hampton et al., 2012).
The long growing season of carrot and red beet grown for seed can cause problems with
the timing of sowing of other species. Carrot needs to be sown in January/February, but
many other commonly grown crops in New Zealand such as wheat and white clover are
not harvested until February (R.Chynoweth, 14/10/2013, Pers.Comm). This causes
species and time limitations. If a carrot or red beet seed crop could be sown later then
there would be time for a stale seed bed to be implemented to control some weed issues
before sowing. Many farmers plough paddocks in hope to minimize/eliminate weeds and
diseases in the soil, however Hampton et al. (2012) stated that in the case of Alternaria
diseases ploughing only reduces the inoculum in the top 0-20 cm for one year. Issues with
crop rotation also arise at the harvest end of seed crops like carrot and red beet, as
harvest does not usually occur until late March/April. Common crops such as wheat and
ryegrass preferably need to be sown by April in New Zealand. It is possible to follow
carrots with crops such as these, but this is usually only in cases where the season is
favourable and harvest is not dull or pushed back by wet spells. Slight delays in harvest
are the difference between sowing a crop in autumn, or having to wait until spring, which
then causes income losses by lowered yields. A fallow period over winter is undesirable
from an environmental point of view also, with mineralisation causing nutrient leaching
(particularly nitrogen) as there are no plant roots present to take up the nutrients.

11
2.3 Physiology of biennial crops
A biennial crop is one which completes its lifecycle in two years (Taiz and Zeiger, 2010).
Almost all biennial crops can also be annual crops, or have early flowering, depending on
their end use (Alessandro and Galmarini, 2007). Many vegetable species fall into this
category, being annual crops if they are grown for food production, or biennial for seed
production (Wiebe, 1990). Using carrots as an example, the first year of growth is
vegetative and involves a basal rosette of leaves being produced along with a tap root for
carbohydrate storage (Alessandro and Galmarini, 2007). If this root is harvested as a food
product, the plant is classed as having an annual growth pattern. If the carrot is grown for
seed then it remains in the ground and the stem elongates, flowers and produces seed in
the following season. Some other examples of biennial vegetables may include cabbages,
beets, onion, parsnip, radish and mustard (Wiebe, 1990). Although most vegetables for
seed production are biennial, there is occasionally a tendency for a small number of
plants to act as an annual and bolt prematurely (Kelly and George, 1998). It is important
that these early bolting plants are removed from the seed crop, so that no genes carrying
this trait are continued.
Many biennial plants have an obligate vernalisation requirement to initiate flowering,
along with specific photoperiod conditions (Wiebe, 1990; Alessandro and Galmarini,
2007). Vernalisation is a cold period which prompts flowering; therefore it is a major
determinant in the growth and development of most biennial plants (Yan and Hunt,
1999)(see Section 2.5). The obligation means that without cold exposure they will remain
vegetative (Wiebe, 1990). Photoperiod is the period of time each day in which a plant or
other organism receives light, or in other terms the day length (Taiz and Zeiger, 2010)(see
Section 2.6). Plant size is also an important factor for vernalisation (see Section 2.5.2).
Before any of the physiological processes of biennial crops can take place, the seeds need
to germinate. Germination has temperature requirements, which are further discussed in
Section 2.4.
12
2.4 Cardinal temperatures
2.4.1 What are cardinal temperatures?
Biological processes in plants respond to temperature, and the responses can be
quantified by cardinal temperatures. Cardinal temperatures quantify the range of
temperatures that contribute to plant development (Black et al., 2006; Monks et al.,
2009), and consists of three points of response; the base temperature, the optimum
temperature, and maximum temperature (Cho et al., 2008). Base temperature is the
lowest temperature at which metabolic processes result in plant development, and
therefore a gain in above ground biomass and further stages of development (Yang et al.,
1995). Below the base temperature, plant development ceases. When moisture
conditions and oxygen are adequate, seed germination depends primarily on
temperature (Bierhuizen and Wagenvoort, 1974; Finch-Savage and Phelps, 1993). The
optimum temperature represents the temperature at which the rate of germination is
fastest. Cardinal temperatures are useful knowledge for aligning the timing of sowing,
germination and emergence with favourable environmental conditions for seedling
growth and development (Monks et al., 2009).
2.4.2 Calculating base temperature
Base temperature is an important component in calculating a plants grow degree day
(GDD) requirement, which is a measurement of development used to predict plant
growth stages such as flowering (Yang et al., 1995; Cho et al., 2008). For this reason,
substantial research has been conducted on developing methods to determine base
temperature in widely adapted crops such as wheat. Base temperature can be difficult to
determine, as each development stage of a plant can have different minimum
temperature requirements (Yang et al., 1995). Base temperature is most commonly
determined statistically, as opposed to physiologically. Some important methods of
determining base temperature which have been reported in the past include; the least
standard deviation in GDD, the least standard deviation in days, the coefficient of
variation in days and the regression coefficient. Yang et al. (1995) believed there were
shortcomings with the four calculation methods used, and provided mathematical
formulae to facilitate these calculations which were then tested on a selection of
vegetables to prove they could be used to provide an accurate base temperature.

13
Standard deviation in days, coefficient variation and regression coefficient methods all
gave similar results and were superior over to the standard deviation in GDD method
(Yang et al., 1995).
Finch-Savage et al. (1998) defined base temperature as the temperature at below which
germination does not occur, and calculated this in their experiment on carrot
germination with a threshold model. The point where the temperature axis was
intercepted was the base temperature (Tb), found by extrapolation of linear regression
(Figure 2.1).
Figure 2.1 The effect of constant temperature on the rate of germination for different germination percentages of the carrot seed population. Extrapolation of the linear regression fitted to data for the 50th percentile to the temperature axis (Tb) is shown (from Finch‐Savage et al., 1998).
In this data set, using extrapolation of linear regression, the base temperature of carrot
was found to be 2.15 °C. It is relevant to note however that this is under a constant
0
0.1
0.2
0.3
0.4
0.5
0.6
0.7
0 4 8 12 16 20 24 28
Rat
e o
f ge
rmin
atio
n (
1/t
(G))
Temperature °C
10%
20%
30%
40%
50%
60%
70%
80%

14
temperature, which is not realistic in field conditions, so it could be assumed this would
differ in diverse environments, and between cultivars.
Yang et al. (1995) stated that this method is simple and logical, but has serious limitations
statistically, as it is not acceptable to extrapolate in regression models. However, in the
regression method Yang et al. (1995) used, there was no extrapolation involved, as the
base temperature was found when the regression coefficient was zero (ie. no
development occurred). Zero was found by graphic interpolation. The method was
therefore statistically acceptable.
Angus et al. (1981) stated that for data where temperature has been controlled, the
simplest model for relating the rate of development (R) to temperature (t) is usually the
linear regression model (Equation 1).
Equation 1 ( )
Where E (R) denotes the expected value of R, and b0 and b1 are regression estimates of y
intercept and slope respectively related to the base temperature for emergence and the
number of degree days above the base temperature between sowing and emergence. To
determine base temperature Angus et al., (1980) used the following equation for base
temperature where equation 1 is solved for t when the linear regression intersects the x
axis;
Equation 2
In 1990 Atherton et al. reported that there appeared to be no other published literature
on cardinal temperatures for carrots.
2.4.3 Vegetable seed base temperatures
A range of base temperatures (Tb) have been determined for a selection of vegetables
(Table 2.5). Majority of the authors used linear regression methods to determine the base
temperature. An exception to this was Cho et al. (2008) who used a quadratic model.

15
Table 2.5 The base temperatures for a selection of vegetable species.
Species Growth stage Tb (°C) Reference
Cabbage (Brassica oleracea L. spp. capitata)
Vegetative 0 Feikea et al. (2010) Cotyledons horizontal
1 Bierhuizen and Wagenvoort (1974)
n/a 6.5 Brewster and Sutherland (1993) Carrot (Daucus carota L.) n/a 1 Brewster and Sutherland (1993)
Cotyledons horizontal
1.3 Bierhuizen and Wagenvoort (1974)
n/a 2.1 Whalley et al. (1999)
n/a 2.15 Finch-Savage et al. (1998) Chinese cabbage (Brassica rapa L. spp. pekinensis)
Vegetative 0 Feikea et al. (2010)
Onion (Allium cepa L.) Cotyledons
vertical 1.4 Bierhuizen and Wagenvoort (1974)
n/a 2.1 Whalley et al. (1999) Leaves 3-9
appearance 5 Lancaster et al. (1996)
n/a 5.9 Brewster and Sutherland (1993) Pak choi (Brassica rapa L. var. chinensis)
Radicle >1 mm
13.5 Cho et al. (2008)
Radish (Raphanus sativus L.)
Cotyledons horizontal
1.2 Bierhuizen and Wagenvoort (1974)
Red beet (Beta vulgaris L.)
Cotyledons horizontal
2.1 Bierhuizen and Wagenvoort (1974)
n/a 5.6 Brewster and Sutherland (1993) Note: n/a = information not available
Brewster and Sutherland (1993) found notably higher base temperatures than other
authors for cabbage, onion and red beet, with all being greater than 5 °C. It was not clear
how they calculated the base temperature of these vegetables or at what growth stage,
so comparison is difficult. It was apparent however that the vegetables were germinated
in glasshouses which had constant temperatures of 15-20 °C, so this may have had an
effect on the base temperature for development. The base temperature given for carrot
(1 °C) was consistent with Atherton et al. (1990) who stated that the minimum

16
temperature for growth in carrot is 0 °C, however Krug (1997) found that 5 °C was the
minimum temperature for growth. Suojala (2000) reviewed many of the same references
as listed above, and concluded that most literature appears to show a base temperature
for growth and development in the vegetative stage to be closer to 0 °C.
Pak-choi is an important cool-season leafy Asian vegetable. Cool-season vegetables in
general have been shown to have an optimum germination rate between 12.8-18.3 °C in
Asia, but the cardinal temperatures have not previously been published (Cho et al., 2008).
Cardinal temperatures are commonly defined by extrapolation of germination rates over
temperature range, but other models have also been applied to explain the effect of
temperature on germination rates (Cho et al., 2008). Cho et al. (2008) used a quadratic
model and a parabolic function to estimate base, optimum and maximum temperatures
for germination in pak-choi. Cho et al. (2008) reported that other literature stated
parabolic models have a fault of assuming a symmetrical response from the optimum
temperature, and they do not allow for any dipped curving close to the base
temperature, and that this too was the case with their data. Temperate species usually
have a base temperature between 0 and 5 °C (Cho et al., 2008), but in this experiment
the base temperature for pak-choi was calculated as 13.5 °C, and pak choi was stated to
be sensitive to low temperature. Such a high base temperature in comparison to other
temperate species may be due to the experimental method used by Cho et al. (2008), as
the pak choi seeds were germinated in growth chambers at constant temperature, but
the lowest temperature used was 15 °C. The base temperature was estimated by
regressing and extrapolating the inverse of time to 50% germination against a
temperature gradient, but 15 °C being the lowest temperature meant that the regression
line was likely to intercept the temperature axis at a much higher point than it would if
lower temperatures were used. Pak-choi and Chinese cabbage are both of the Brassica
rapa species, so in theory could have similar temperature requirements. The base
temperature given in Table 2.5 for Chinese cabbage was 0 °C, so perhaps under the same
growing conditions pak-choi would have a lower base temperature than that given in
experiments from Asia.

17
Bierhuizen and Wagenvoort (1974) found that brassica crops and leafy vegetables in
general have a low base temperature of around 1 °C. A similar conclusion was made for
root crops such as radish (1-2 °C base temperature) which can therefore be sown early in
the season due to their low temperature requirement and rapid germination. Root crops
such as carrot and onion have the same base temperature in general, but are much
slower to germinate and grow.
2.5 Vernalisation
2.5.1 Explaining vernalisation
The initiation and timing of flowering in certain plants such as the biennial vegetables and
perennial ryegrass species of interest in this review are determined by changes in
photoperiod and temperature, which are the two main environmental cues (Craigon et
al., 1995; Porter and Gawith, 1999; Streck et al., 2003 etc.). Temperature affects both
development and plant growth (Porter and Gawith, 1999). Vernalisation is a period of low
temperature which an imbibed seed or growing plant is exposed to, which gives them the
ability to become reproductive (stimulates flowering)(Kane et al., 2006; Taiz and Zeiger,
2010). Vernalisation research in wheat (Triticum aestivum L.) has shown temperature,
duration of low temperature, photoperiod and genotype to be factors which influence
the response to vernalisation (Wang et al., 1995).
It is commonly believed that dry seeds do not respond to a vernalisation period, as it is an
active metabolic process which requires the seed to have imbibed water (Taiz and Zeiger,
2010), however Wiebe (1990) stated that vernalisation may begin while the seed is still
on the mother plant in some species such as red beet. If a plant that requires
vernalisation does not receive a suitable cold period, then they are likely to remain in the
vegetative stage, or have delayed flowering (Wiebe, 1990; Robertson et al., 1996; Taiz
and Zeiger, 2010). Appropriate photoperiod conditions (long days for most vegetable
species) are sometimes required along with the achieved vernalisation saturation for
floral stimulation (Robertson et al., 1996; Kane et al., 2006; Mauseth, 2012).

18
Whether a plant has a vernalisation requirement or not can be demonstrated in Figure
2.2 with ryegrass (Lolium species)(Leopold and Kriedmann, 1975).
Figure 2.2 Vernalisation response in days to flowering in Ryegrass (Lolium) species (from
Leopold and Kriedmann, 1975).
L.temulentum had no response to vernalisation (number of days to flower stayed the
same regardless of vernalisation duration) which indicates this cultivar does not require a
cold period to initiate flowering. Both L.multiflorum and L.perenne hybrid cultivars
showed a decrease in the number of days until flowering occurred as duration at 4 °C
increased, so had a moderate vernalisation response. L.perenne had a substantial
response, with the number of days to flowering decreasing rapidly with vernalisation
duration until week 5, indicating it has a strong vernalisation requirement for flowering
(Leopold and Kriedmann, 1975).
Plants accumulate vernal degree days (VDD) until vernalisation saturation (Vsat)(fully
vernalised) is reached, where beyond this point further contributions do not increase the
effect of vernalisation anymore (Weir et al., 1984). This can be described by a function of
0
20
40
60
80
100
120
140
160
0 2 4 6 8 10 12 14 16 18
Day
s to
flo
wer
ing
Time (weeks) at 4 C
L.perenne
L.multiflorum perenne hybrid
L.multiflorum
L. temulentum

19
vernalisation (Fv), with an equation from the ‘Arcwheat’ model in Weir et al. (1984)
(Equation 3).
Equation 3 Fv = (VDD – Vbase) / (Vsat – Vbase)
Where Vbase is the number of consecutive cold days required before vernalisation begins,
and Vsat is when Fv ≥ 1 (plant is fully vernalised)(Weir et al., 1984). Temperature affects
the rate of VDD accumulated (Figure 2.3).
Figure 2.3 Temperature effectiveness on vernalisation (from Weir et al., 1984).
Vernalisation temperatures in this model are most effective between 3-10 °C, when the V
effectiveness equals one. At -4 °C and 17 °C the V effectiveness is zero, so no VDD are
accumulated. At about 0 °C V effectiveness is 0.5 which means the contribution to
vernalisation is about 50% of the temperature between 3 and 10 °C. Therefore, it would
take twice as many days at 0 °C to reach saturation than at 4 °C (Weir et al., 1984).
The main effect of vernalisation is a reduction of the duration of the leaf primordia
production (cells forming new leaves)(Robertson et al., 1996), as the number of leaves is
how plants delay development. This is due to the initiation of the collar primordium (final
leaf) being earlier than usual and therefore reducing the total number of leaves produced

20
on the main stem, which results in earlier flowering. The final leaf number is reduced,
given the assumption that the production of leaf primordial is dependent only on
temperature.
2.5.2 Juvenile stage
Many of the biennial plants which have an obligatory vernalisation requirement have to
have reached a certain size/stage in development before they can successfully receive
the cold stimulus (Wiebe, 1990). Prior to this stage in development, the plants are called
juveniles. The number of leaves is usually the measure for when a plant is past the
juvenile stage, and will respond to the cold stimulus.
Atherton et al. (1990) and Alessandro and Galmarini (2007) both state that for carrot
plants, once 8-10 leaves have been initiated and the storage root is 4-8mm in diameter, it
is no longer in the juvenile stage and becomes responsive to vernalising conditions.
Wiebe (1990) also reported eight or more leaves as the changing point for carrot, so this
seems to be consistent; however there is some variation on the root diameter. Dias-
Tagliacozzo and Valio (1994) reported that other authors consider the juvenile stage as
before the storage root reaches 10mm in diameter. A general conclusion could be made
that sensitivity to vernalisation increases with carrot seedling age (Dickson et al., 1961).
Receptiveness to cold may be harder to predict in Cabbage, as Wiebe (1990) reported the
leaf initiation number when the juvenile stage ends to be between 4-15 leaves which are
greater than 2 cm long.
Wiebe (1990) found when reviewing other literature that there is no set juvenile stage for
all vegetable species, and that some species can become receptive to vernalisation with
seed imbibition (Taiz and Zeiger, 2010) or when the radicle emerges at germination.
There are a small number of vegetable crops such as red beet, lettuce and peas that may
even become receptive during seed development on the mother plant (Chouard, 1960;
Wiebe, 1990). Chouard (1960) had a similar statement saying that in some beet species
vernalisation can be achieved in very young plants and even in seeds, but the
responsiveness increases with plant age. Yan and Hunt (1999) stated that based on their
present understanding, vernalisation experiments preferably treat germinated
seeds/growing plants as opposed to imbibed seeds yet to geminate. They do not explain

21
why this is preferable, but it could be assumed that it may be related to specific species
juvenile stages and when they become receptive to vernalisation. In carrot, vernalisation
response at different growth stages changes with cultivars, but in some it is possible as
imbibed seeds (Chouard, 1960). As cited by Chouard (1960), it was found that when some
carrot varieties from the southern region of the former Union of Soviet Socialist Republics
were chilled as wet seeds at 2 °C for 50-80 days, one third of the plants flowered in the
same year.
2.5.3 Optimum vernalisation
The optimum vernalisation temperature range for all obligatory plants has been widely
studied, with a variety of results (eg. Craigon et al., 1995; Brooking, 1996; Streck et al.,
2003; Taiz and Zeiger, 2010). Weir et al. (1984) proposed that the optimum vernalisation
temperature generally lies between 3 and 10 °C, and the effective range about -4 – 17 °C
(Figure 2.3). McDonald and Copeland (1997) reported that in America, carrot seed
production used to be located primarily in California, however it is now in colder areas
such as Washington as the necessary vernalisation temperature which they state to be
less than 7 °C was not consistently being met in California.
Yan and Hunt (1999) used an equation for optimum vernalisation temperature (Equation
4).
Equation 4 (
) (
)
Where;
is the daily rate of vernalisation progress
is temperature
is optimum temperature
is the maximum temperature for vernalisation
is the maximum rate of vernalisation on a daily basis and occurs at
The optimum temperature for vernalisation is generally agreed to be low, but the
effective range of temperatures and specific vernalisation requirements for different
plant species have contrasting opinions (Yan and Hunt, 1999). Wiebe (1990) defined

22
optimum vernalisation as the temperature which leads to the fastest flower induction.
Vernalisation itself has an invisible nature so can only be evaluated by its after-effects,
which are mainly related to final leaf number and days to flowering. These effects are
highly dependent on photoperiod and temperature conditions (Yan and Hunt, 1999). The
minimum, optimum and maximum temperatures for vernalisation that led to flower
generation for a range of vegetable species was published from a range of literature
gathered by Wiebe (1990), as well as the number of weeks required (Table 2.6).
Table 2.6 The minimum, optimum and maximum temperature range for vernalisation resulting in flowering, and the duration of cold exposure required in some important vegetable seed crops (adapted from Wiebe, 1990).
Species Inductive temp range (°C) Duration required (weeks)
Min Opt Max At Opt At Min/Max
Cabbage 0 4 - 7 12 4 20
Carrot 0 2 - 6 10 5 12
Chinese cabbage 0 5 - 8 20 1 4
Onion 2 9 - 13 18 4 12
Parsnip 0 2 10 6 10
Radish 0 5 - 8 15 1 4
Red beet 0 5 - 9 18 3 5
For most of the species in Table 2.6, if vernalisation doesn’t occur at the optimum
temperature then the duration of cold exposure needs to be at least doubled. Cabbage is
the most extreme example, with only four weeks of cold exposure needed if the
temperature is between 4 and 7 °C, but 20 weeks needed if the temperature is at 0 or 12
°C (Wiebe, 1990). The number of days to flowering after vernalisation was not stated, but
due to the definition given it could be assumed that the shortest number of days would
be associated with plants in the optimum temperature range.
The optimum vernalisation temperature and duration for carrots has been researched by
numerous authors with varying results, but all conclude an optimum temperature
between 0-10 °C (Atherton et al., 1990; Wiebe, 1990; Yan and Hunt, 1999; Alessandro
and Galmarini, 2007 etc). The extent of the response to chilling is cultivar dependent
(Atherton et al., 1990).

23
Yan & Hunt (1999) found the average optimum vernalisation temperature for the carrot
cultivar ‘Chantenay Red Cored’ was 6.6 °C, over 9-15 week exposure treatments. Similar
results were published by Atherton et al. (1990), where the most effective response to
vernalisation in terms of percentage of carrot plants flowering, were plants exposed to
temperatures of 5 °C and 7 °C for 12 and 15 week periods (Table 2.7). These were the
only treatments where 100% of the plants flowered. It is important however to note that
this was also for the carrot cultivar ‘Chantenay Red Cored’, so the results may differ for
other carrot cultivars.
Table 2.7 Effects of different constant temperatures, and length the plants were exposed to temperature, on subsequent flowering in the carrot cultivar ‘Chantenay Red Cored’ (From Atherton et al., 1990).
Temperature (°C) Duration (weeks) Plants flowering (%)
-1 9 0 12 0
15 0
3 9 33
12 92
15 83
5 9 50
12 100
15 100
7 9 67
12 100
15 100
10 9 33
12 67
15 67
12 9 8
12 50
15 58
16 9 0
12 0
15 0

24
The results in Table 2.7 are consistent with the information given previously by Wiebe
(1990) in terms of optimum temperature range being around 2-6 °C, and definitely below
10 °C. The duration however differs, as Wiebe (1990) reported that at optimum
vernalising temperature the duration should be about 5 weeks, whereas in Table 2.7
twelve weeks gave better flowering results than 9 weeks, which is still far greater than 5
weeks. Twelve weeks was given as the duration for minimum and maximum effective
vernalisation temperatures, but here it appears to be the optimum duration for
flowering. Differences may be due to different carrot cultivars being used.
It is important to note that many vernalisation experiments take place in a controlled
environment such as an incubator, where the exposure to cold is constant, which does
not mimic realistic field conditions (Sung and Amasino, 2005). This may change the
results as the vernal degree days accumulated over a period of time could differ
significantly, as temperature fluctuates in uncontrolled conditions.
2.5.4 De-vernalisation
The effectiveness of the cold period (in terms of seeds remaining vernalised after a de-
vernalising treatment) increases as duration increases (Figure 2.4). High temperatures
can reverse vernalisation (de-vernalising)(Purvis and Gregory, 1952; Wiebe, 1990). The
longer a plant or seed is exposed to cold temperature, the more permanent the effect is.
Purvis and Gregory (1952) hydrated winter rye (Secale cereale) seeds and exposed them
to 5 °C for different lengths of time, and then transferred them immediately to 35 °C for
three days. At a vernalisation period of 2 weeks, none of the seeds remained vernalised
(100% de-vernalised), whereas at 8 weeks approximately 95% of seeds retained their
vernalisation (Purvis and Gregory, 1952).

25
Figure 2.4 The percentage of winter rye seeds remaining vernalised vs. duration of vernalisation, after de-vernalising treatment (from Purvis and Gregory, 1952).
2.6 Photoperiod
2.6.1 Explaining photoperiod
Photoperiod is the length of daylight in a 24 hour period (Taiz and Zeiger, 2010). Day
length at the equator is equal to night length, and stays this way year round. As one
moves further towards the north and south poles from the equator, the day length
increases in summer and decreases in winter. Many plants have evolved the ability to
distinguish changes in day length in different seasons (Taiz and Zeiger, 2010). Photo-
periodism is the response to day length, or night length, and often acts as a seasonal
indicator for flowering in plants (Taiz and Zeiger, 2010; Mauseth, 2012). Specific
photoperiod responses are strongly related to the latitude of their origin.
Plants can be classed as long day, short day or day neutral plants. Long day plants can
have a qualitative response to photoperiod where flowering is only triggered with long
days, or a quantitative response where flowering is accelerated by long days (Taiz and
Zeiger, 2010). Short day plants are the opposite, where flowering is triggered by, or
accelerated with short days. Day neutral plants are ones which have no response to day
0
10
20
30
40
50
60
70
80
90
100
0 2 4 6 8 10
Perc
ent
(%)
rem
ian
ing
vern
alis
ed
Duration of cold treatment (weeks)

26
length. The essential differentiation between long day plants and short day plants is that
promotion of flowering is when a critical day length is exceeded for long day plants,
whereas in short day plants it needs to be less than the critical day length (Taiz and
Zeiger, 2010).
Technically, it is the length of dark not light which a plant measures and responds to
(Kendrick and Frankland, 1983; Taiz and Zeiger, 2010). Plants contain a photoreceptor
protein called phytochrome which senses changes in light. During daylight hours plants
accumulate the phytochrome form which absorbs red light (Pr), and this converts to the
phytochrome far-red light (Pfr) form, which is an active form that triggers flowering (see
Figure 2.5)(Hendricks and Borthwick, 1967). During dark hours Pfr converts back to Pr
which is inactive. The length of dark therefore determines flowering in plants. In long day
plants the night length needs to be short enough that a build-up of Pfr is created because
the dark hours are not long enough to convert all of the Pfr back to the inactive Pf form.
Short day plants are the opposite, and require a low concentration of Pfr to trigger
flowering (Kendrick and Frankland, 1983; Taiz and Zeiger, 2010).
Figure 2.5 An explanation of red light and far red light accumulation in plants (adapted
from Kendrick and Frankland, 1983).

27
2.6.2 Vegetable photoperiod examples
Carrots have been classified as both day-neutral plants (Sakr and Thompson, 1942; Hiller
and Kelly, 1979) and long day plants (Atherton et al., 1984). In an experiment by
Atherton et al. (1984), plants that had received their vernalisation requirement were
returned to warm (at least 16 °C) glasshouses with different photoperiod conditions. The
plants which were returned to long photoperiods (16h) flowered, but the plants returned
to short photoperiods (8h) remained vegetative. The experiment also showed that the
photoperiod conditions during the chilling period have an effect on the flowering
response. After the chilling period, when plants were in 16 hour photoperiod and warm
growing conditions, a reduction in the number of plants flowering was seen where a
photoperiod of greater than 12 hours was used during chilling. The shorter photoperiods
of 0h and 8h throughout the chilling resulted in faster flowering responses (28 and 29
days respectively compared to 33 and 47 days at 12h and 16h photoperiods)(Atherton et
al., 1984). There are obvious differences in literature, as Sakr & Thompson (1942) and
Hiller & Kelly (1979) showed carrots as being day neutral, even after chilling whereas the
results discussed above found that plants which were returned to short photoperiods
after chilling did not flower and those returned to long photoperiods did flower. Atherton
et al. (1984) suggests that differences in published literature may be due to varied plant
ages, and that from their results carrots appear to behave as a combination of short and
long-day plants with a vernalisation requirement to induce flowering. Red beet is a
quantitative long-day biennial with a cold requirement for flower initiation (George,
2009).
2.7 Conclusions
The seed industry is an important part of New Zealand’s economy and land based
industries, with carrots making up an average of $11.35 million per year.
Seed quality may be reflected by agronomic aspects such as seed maturity and
irrigation. Seed quality may also help to improve weed, pest and disease issues.

28
Biennial vegetable species for seed have a growing period greater than 12
months, which can enhance issues with weeds, pests and diseases. Carrot crops
are particular susceptible, but there could be potential to reduce these by altering
their vernalisation receptiveness and shortening their growing period.
Base temperature is the lowest temperature at which metabolic processes result
in plant growth and development, and therefore a gain in above ground biomass.
The base temperature of carrot generally lies between 1 and 5 °C. There is a lack
of literature on base temperature for a wide variety of vegetable species.
Photoperiod and temperature are the two main environmental cues for initiating
flowering. Most biennial vegetable species for seed production require a
vernalisation period to induce flowering, and the optimum vernalisation
temperature and duration generally lies between 3 and 10 °C, and the effective
range about -4 – 17 °C, depending on species.
Many of the biennial plants which have an obligatory vernalisation requirement
have to have reached a certain size/stage in development before they can
successfully receive the cold stimulus. The exact size/stage varies for species and
could be further investigated.

29
3 MATERIALS AND METHODS
3.1 Experiment 1: Determination of cardinal temperatures
3.1.1 Experimental design
The rate of germination at different temperatures was compared for ten vegetable
species and one perennial ryegrass cultivar. The vegetable species used were; Asian
radish, cabbage, carrot, Chinese cabbage, mustard, onion, pak choi, parsnip, red beet and
red radish (see Table 3.1 for variety and germination percent). Three replicates of 50
seeds per species were placed on moist filter paper in Petri dishes in unlit incubators at
constant set temperatures from 5.0 to 40.0 °C (± 0.5 °C) in 5 °C increments. Petri dishes
were organised randomly in the incubators. Filter paper was kept moist when necessary
with reverse osmosis (RO) water to ensure moisture was non-limiting for germination.
Table 3.1 The vegetable species used in this experiment, sourced from South Pacific Seeds Ltd (Darfield, NZ).
Species Variety Germination test result
Carrot Hybrid Carrot No 31 88%
Red beet
Cabbage
Mustard
Chinese cabbage
Pak choi
Red radish
Asian radish
Onion
Hybrid Red beet KR-333
Hybrid Cabbage No 164
Hybrid Chinese Mustard CMF-18
Hybrid Chinese Cabbage CCF-31
Hybrid Pak Choi No 4
Hybrid Radish No 108 3.75-4.0
Hybrid RR Radish N34514
OP Onion Baron >2.4
95%
97%
99%
98%
97%
97%
99%
96%
Parsnip seed was not available from South Pacific Seeds Ltd, so was purchased from Mitre
Ten gardening centre in Christchurch. The ryegrass seed used was sourced from the Field
Service Centre, Lincoln University, and was Samsung AR37 perennial ryegrass treated
with Gaucho insecticide/fungicide.
3.1.2 Measurements
Germination of the seeds was counted cumulatively and recorded daily, or twice daily for
the first 3 days in high temperatures (>25 °C). Once a seed had germinated it was
removed from the dish for ease of counting each day. Germination was counted as a seed

30
with a radicle of ≥ 1 mm. This measure was by eye, as measuring with any device was not
practical. Germination was counted until 50% of the seeds had germinated. In some cases
50% germination was not reached, so the experiment was ceased when no seeds had
germinated for more than five consecutive days.
3.1.3 Statistical analysis
The rate of germination was calculated for each temperature treatment for each species
when 50% of seeds had germinated. To determine the precise timing of 50% germination,
lines of regression were drawn. This consisted of a slope and intercept being calculated
using data points from each replicate where the value before 25/50 seeds had
germinated and the value at or after where 25/50 seeds had germinated (or closest to
25/50 for species which did not reach 50% germination). The precise point (number of
days) where 50% germination occurred was then calculated (See Equation 5).
Equation 5
The inverse of duration (1/days) represented the development rate. Multiple (minimum
of two) linear regression lines were fitted to mean data points (chosen on visual
slopes/changes in response) to determine the cardinal temperatures for each species
involved. The base temperature for germination was calculated where the regression for
the lower temperature treatments crossed the x axis. The optimum temperature was
determined where the regressions intersected at the highest rate of germination. The
maximum temperature was calculated where the regression for the higher temperatures
crossed the x axis.

31
3.2 Experiment 2: Determination of vernalisation requirement
3.2.1 Experimental design
Three vegetable species (cabbage, carrot and red beet) and perennial ryegrass were
selected for this vernalisation experiment. Imbibed seeds were exposed to a range of cold
period durations. The seeds used were from the same source as in experiment one. These
vegetable species were chosen as they have similar biennial lifecycles when grown for
seed, and ryegrass is a well-documented (successfully vernalised as an imbibed seed)
comparison.
This experiment took place in an incubator in the Field Service Centre at Lincoln
University. The duration treatments used in this experiment were 0, 2, 4, 6, 8, 10 and 12
weeks. The temperature used for vernalisation of all species was constant 4 °C (± 0.5 °C
either side). The experiment began with the longest vernalisation duration being set up
first. This consisted of 15 seeds of each species being placed in separate petri dishes on
wetted filter paper in the base. This was replicated six times, giving a total of 24 dishes
per duration treatment (four species x six replicates each = 24). Petri dishes were kept
moist with RO water when necessary.
The longest duration (12 weeks) was started on the 22nd March 2013, followed by the
declining durations being added into the incubator every two weeks, so that after 12
weeks all treatments had been in the incubator for the appropriate length of time. The
zero week vernalisation treatment was germinated at room temperature, so that no
vernalisation was accumulated. Three weeks into the vernalisation period some of the
species, particularly cabbage, germinated and began to develop leaves while still in the
petri dishes in the 4 °C incubator. The seedlings were planted into trays with potting mix
(same mix as used in glasshouse) and moved to another incubator still at 4 °C, but with 24
hour lighting. Light readings were taken with a Skye Spectro Sense at the top bottom and
middle of the incubator, and the average light reading was 2.8 µM/m2.
On completion of the vernalisation periods (Thursday 13th June, 2013), all seeds/seedlings
were planted into pots and kept in a glasshouse. Four seeds/seedlings were chosen from
the 15 seeds that were germinated in each petri dish for every species in each duration

32
treatment. The four seeds/seedlings were planted into a 2.5 L pot filled with a standard
potting mix which was a bark and pumice composite containing the following fertilisers
that last for 3-4 months (g/500 L potting mix); Osmocote exact (16-3.5-10) 1500 g,
Horticultural lime 500 g and Hydroflo 500 g. This was repeated for each replicate meaning
that there were 168 pots in total (4 species x 6 replicates x 7 duration treatments). The
pots were arranged in a complete randomised block design in the glasshouse with the
replicates blocked (see Appendix 1). Plants were watered when required by staff at the
glasshouse with a hand held sprinkler hose.
3.2.2 Temperature and lighting
Air temperature in the glasshouse was measured every two hours and computer logged.
The average temperature in the Fletcher glasshouse for each month the experiment ran
was between 18.1- 19.9 °C (Table 3.2).
Table 3.2 The average monthly temperature in Fletcher glasshouse, Lincoln University.
Month Average temperature (°C)
June (13th – 31st) 18.1 July 18.6 Aug 18.7 Sept 19.3 Oct (1st and 2nd) 19.9
The photoperiod was 20 hours consisting of natural and artificial lighting during daylight
hours, and artificial lighting during night hours. Each table had a large high pressure
sodium lamp hung approximately two meters above the centre of the table used for
artificial lighting.
3.2.3 Measurements
The number of days from when the vernalisation period finished (13th June when plants
were moved to the glasshouse) to anthesis (flowering) was measured. After flowering,
the plant was harvested by cutting off at the base, and the final main stem leaf number
was counted. In perennial ryegrass this measurement was taken from the main stem in
the primary tiller. These measurements were taken for each plant in each pot, and
numbered 1-4 in the order of which plant had flowered first.

33
3.2.4 Statistical analysis
The statistical analysis was only conducted on ryegrass and red beet species in this
experiment, as they were the only species to reach anthesis and therefore produce data.
The number of days from when the plants were potted into the glasshouse until anthesis
occurred was analysed in Genstat (15th edition, VSN International Ltd, Hemel Hempstead,
UK) individually for both species by a one-way ANOVA to assess if there were significant
vernalisation treatment effects, independently due to missing data points.
The number of main stem leaves produced was also analysed individually for ryegrass and
red beet by a one way ANOVA to assess if there were significant effects. The significant
differences between means for both days to anthesis and main stem leaf number were
separated using the least significant difference (LSD) at a 5% level. A regression analysis
was conducted on both the number of days to anthesis and the main stem leaf number
for red beet and ryegrass.

34
4 RESULTS
4.1 Base temperature experiment
4.1.1 Germination percentage
The rate and maximum cumulative germination percentage differed with temperature
(Figure 4.1 part 1 and 2). At 5 °C Asian radish, Chinese cabbage, mustard and pak choi did
not reach 50% germination. At 10 °C Asian radish, Chinese cabbage and mustard again
did not reach 50% germination. At 15 °C the only species not to reach 50% germination
was mustard. All species reached 50% germination in the 20 °C, 25 °C and 30 °C
experiments. At 30 °C onion was the only species not to reach 50% germination. At 35 °C
onion and parsnip did not reach 50% germination. At 40 °C the only species which
successfully reached 50% germination were Asian radish, Chinese cabbage and pak
choi. It is notable that these three were all species which did not reach 50% germination
at the lowest temperature (5 °C). Asian radish and Chinese cabbage showed similar
germination responses at all of the incubator temperatures. Some similarities can also be
seen between onion and parsnip with both not reaching high germination percentages
when exposed to temperatures >30 °C. Parsnip took at least five days before any
germination occurred at any temperature, and was the only species to show this
response. The 5 °C temperature was the treatment which showed the slowest
germination (longest amount of days for germination to begin), which was 23 days in
parsnip.

35
Figure 4.1 (1 of 2) The average cumulative germination percentage at temperature
treatments of 5 °C (●), 10 °C (○), 15 °C (▼), 20 °C (△), 25 °C (■), 30 °C (□),
35 °C (◆) and 40 °C (◇) for Asian radish (a), cabbage (b), carrot (c), Chinese cabbage (d), mustard (e) and onion (f). Time is the number of days from initial imbibition to germination. Error bars represent the standard error of the mean for the final germination percentages.
Time (days)
0 5 10 15 20 25
Cum
ulat
ive
germ
inat
ion
(%)
0
20
40
60
80
100
0 5 10 15 20 25 30
Cum
ulat
ive
germ
inat
ion
(%)
0
20
40
60
80
100
0 2 4 6 8 10 12 14 16 18 20
Cum
ulat
ive
germ
inat
ion
(%)
0
20
40
60
80
100
0 2 4 6 8
0
20
40
60
80
100
0 5 10 15 20 25 30
0
20
40
60
80
100
Time (days)
0 5 10 15 20 25 30
0
20
40
60
80
100
dc
e
ba
f

36
Figure 4.1 (2 of 2) The average cumulative germination percentage at temperature
treatments of 5 °C (●), 10 °C (○), 15 °C (▼), 20 °C (△), 25 °C (■), 30 °C (□),
35 °C (◆) and 40 °C (◇) for pak choi (g), parsnip (h), red beet (i), red radish (j) and perennial ryegrass (k). Time is the number of days from initial imbibition to germination. Error bars represent the standard error of the mean for the final germination percentages.
Time (days)
0 2 4 6 8 10 12 14 16 18
Cum
ulat
ive
germ
inat
ion
(%)
0
20
40
60
80
100Time (days)
0 2 4 6 8 10
0
20
40
60
80
100
0 2 4 6 8 10 12 14 16 18 20
Cum
ulat
ive
germ
inat
ion
(%)
0
20
40
60
80
100
0 10 20 30 40
0
20
40
60
80
100
0 5 10 15 20 25
Cu
mu
lati
ve g
erm
inat
ion
(%
)
0
20
40
60
80
100
hg
i j
k

37
4.1.2 Germination rate and estimation of cardinal temperatures
The rate of germination graphs were used to find the base, optimum and maximum
temperatures for germination for all of the species (Figure 4.2). These were tabulated for
ease of comparison (Table 4.1). The germination rates of the vegetable species and
perennial ryegrass tested increased linearly with temperature increases from the base
temperature up to an optimum. Germination rate declined linearly to zero at the
maximum temperature for germination.
The base temperatures of the species involved ranged from -0.2 °C to 6.1 °C. The
optimum temperatures ranged from 15.4 °C to 35.9 °C, but most of the species were
around 28-30 °C. The maximum temperatures ranged from 37.4 °C to 45.5 °C, but most of
the species maximum temperature for germination was around 40-42 °C.
Parsnip had the lowest cardinal temperatures, particularly the optimum temperature at
15.4 °C, which was almost half of that of all of the other species except for onion. Parsnip
and onion were the only species which had maximum temperatures of less than 40 °C.
Mustard had the highest base temperature at 6.1 °C, but had similar optimum and
maximum temperatures to other species. Red beet had the highest optimum
temperature at 35.9 °C and the second highest maximum temperature (44.4 °C) after pak
choi at 45.5 °C.

38
Figure 4.2 (1 of 2) Rate of germination (1/days) to 50% germination over a range of temperatures (°C) increasing in 5 °C increments used to find the base, optimum and maximum temperatures for germination for Asian radish (a), cabbage (b), carrot (c), Chinese cabbage (d), mustard (e) and onion (f).
0 5 10 15 20 25 30 35 40 45
0.0
0.5
1.0
1.5
2.0
0 5 10 15 20 25 30 35 40 45
Ger
min
atio
n ra
te (
1/da
ys)
0.00
0.05
0.10
0.15
0.20
0.25
0.30
0 5 10 15 20 25 30 35 40
0.0
0.2
0.4
0.6
0.8
1.0
5 10 15 20 25 30 35 40
Ger
min
atio
n ra
te (
1/da
ys)
0.0
0.5
1.0
1.5
2.0
a b
c d
Temperature (°C)
0 5 10 15 20 25 30 35 40 45
Ger
min
atio
n ra
te (
1/da
ys)
0.0
0.5
1.0
1.5
2.0e
Temperature (°C)
0 5 10 15 20 25 30 35 40 45
0.00
0.05
0.10
0.15
0.20
0.25
0.30
f

39
Figure 4.2 (2 of 2) Rate of germination (1/days) to 50% germination over a range of temperatures (°C) increasing in 5 °C increments used to find the base, optimum and maximum temperatures for germination for pak choi (g), parsnip (h), red beet (i), red radish (j) and perennial ryegrass (k).
Temperature (°C)
0 5 10 15 20 25 30 35 40 45
Ger
min
atio
n ra
te (
1/da
ys)
0.0
0.1
0.2
0.3
0.4
0 5 10 15 20 25 30 35 40 45
0.0
0.5
1.0
1.5
2.0
2.5
0 5 10 15 20 25 30 35 40 45 50
Ger
min
atio
n ra
te (
1/da
ys)
0.0
0.1
0.2
0.3
0.4
0.5
0.6
0.7
-5 0 5 10 15 20 25 30 35 40
0.00
0.02
0.04
0.06
0.08
0.10
Temperature (°C)
0 5 10 15 20 25 30 35 40 45 50
Ger
min
atio
n ra
te (
1/da
ys)
0.0
0.5
1.0
1.5
2.0
g h
i j
k

40
Table 4.1 The base, optimum and maximum temperature (°C) for germination determined by linear regression for the selected vegetable species and perennial ryegrass.
Species Base
temperature (°C) Optimum
temperature (°C) Maximum
temperature (°C)
Asian radish 3.3 29.7 41.3
Cabbage 1.4 30.7 41.9
Carrot 0.1 30.9 40.7
Chinese cabbage 4.6 35.2 42.9
Mustard 6.1 31.1 40.7
Onion 1.2 21.5 39.6
Pak choi 3.1 29.4 45.5
Parsnip -0.2 15.4 37.4
Red beet 4.2 35.9 44.4
Red radish 1.5 28.7 41.6
Ryegrass 1.1 29.3 40.4
4.2 Vernalisation experiment
Perennial ryegrass and red beet plants showed a positive response to the vernalisation
treatment as imbibed seeds, where flowering occurred in plant exposed to vernalisation
durations of ≥ 4 weeks (Plate 4.1). Three carrot plants flowered, but were from different
vernalisation durations (one each from 6 week, 8 week and 10 week treatments). There
were no visual differences for reproductive development among vernalisation durations
for carrot (Plate 4.2). No flowering occurred in cabbage plants (Plate 4.3).
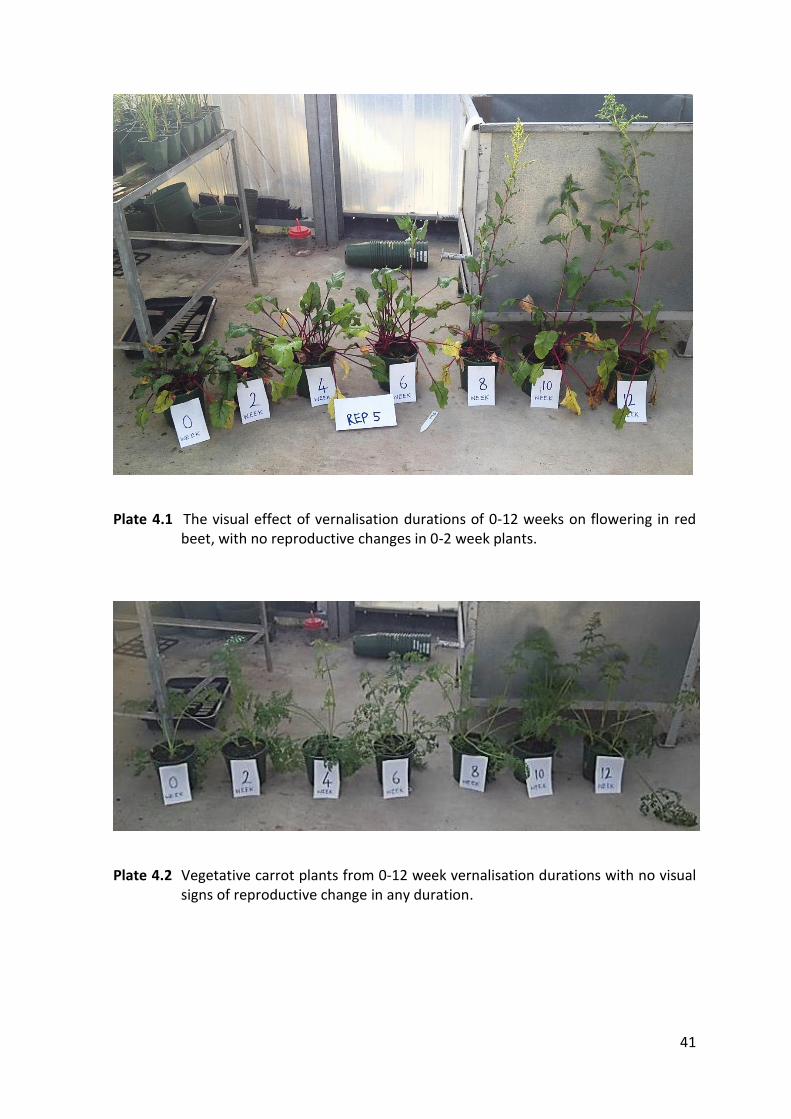
41
Plate 4.1 The visual effect of vernalisation durations of 0-12 weeks on flowering in red beet, with no reproductive changes in 0-2 week plants.
Plate 4.2 Vegetative carrot plants from 0-12 week vernalisation durations with no visual signs of reproductive change in any duration.

42
Plate 4.3 Vegetative cabbage plants from 0-12 week vernalisation durations with no visual signs of reproductive change in any duration.
4.2.1 The number of plants that flowered
The number of plants which flowered on average per pot (out of four) for perennial
ryegrass and red beet generally increased as the vernalisation duration increased (P
<0.001)(Figure 4.3). The interaction between red beet and ryegrass was not significant as
their response to vernalisation was the same. There was a significant difference in the
number of plants per pot that flowered between species (P <0.001), with ryegrass having
a higher number of plants at every vernalisation treatment. At zero and two week
vernalisation treatments, no flowering occurred in any plants from any replicate for red
beet. At the four week vernalisation treatment red beet plants began to show some
flowering, with one plant per pot on average flowering. This remained the same at the
six week treatment, but thereafter for the eight, 10 and 12 week vernalisation
treatments, flowering occurred in two to three plants per pot on average. Anthesis in the
ryegrass occurred in one plant on average in the zero and two week vernalisation
treatments, then increased to two plants in the four week treatment and three to four
plants in the six, eight and ten week treatments. At the twelve week treatment all four
ryegrass plants flowered in every pot.

43
Figure 4.3 The number of plants that flowered per pot (out of a possible 4) over
vernalisation durations of 0-12 weeks, for perennial ryegrass (○) and red beet
(●). The effect of vernalisation (LSD 0.537, p <0.001) and species (LSD 0.287, P <0.001) was significant with no interaction.
4.2.2 Vernalisation effect on the number of days to anthesis
The duration of the vernalisation period had a significant effect (P <0.001) on the average
number of days from when the vernalisation treatment ended to when anthesis occurred
in perennial ryegrass (Figure 4.4). Plants which were exposed to 12 weeks of vernalisation
flowered in the least amount of days on average (68 days). The number of days to
anthesis increased continually as vernalisation duration decreased. At the two week
vernalisation treatment ryegrass plants took 108 days on average to flower, which was 39
days longer than the 12 week treatment. The greatest change in the number of days to
anthesis occurred between two and four weeks of vernalisation (17 days difference). The
regression for the number of days to anthesis for ryegrass was significant (P <0.001),
explaining 78.6% of the data. The number of days to anthesis decreased by 3.6 days for
every one week increase in vernalisation duration.
Vernalisation treatment (weeks)
0 2 4 6 8 10 12
Num
ber
of p
lant
s
0
1
2
3
4
Species
Vernalisation

44
Figure 4.4 The number of days on average from the end of the vernalisation period until anthesis occurred in perennial ryegrass over a vernalisation range of 0-12 weeks. The vernalisation treatment had a significant effect on the number of days to anthesis (LSD 8.15, P <0.001).
The duration of the vernalisation period did not have a significant effect (P = 0.143) on
the average number of days from when the vernalisation treatment ended to when
flowering occurred in red beet (Figure 4.5). The analysis excluded zero and two week
vernalisation treatments because no flowering occurred. The number of days to flowering
did not change between the eight and twelve week vernalisation treatments. There was
an increase in days to flowering on average between the eight and four week treatments
(90 and 98 days respectively), but this difference was not significant. No flowering
occurred in the zero and two week vernalisation treatments in red beet, therefore it was
not included in the analysis. The regression for the number of days to anthesis for red
beet was significant (P = 0.034), however it only explains 15.2% of the data. The number
of days to anthesis decreased by 0.9 days for every one week increase in vernalisation
duration.
Vernalisation treatment (weeks)
0 2 4 6 8 10 12
Day
s to
ant
hesi
s
0
60
70
80
90
100
110

45
Figure 4.5 The number of days on average from the end of the vernalisation period until anthesis occurred in red beet over a vernalisation range of 0-12 weeks. The vernalisation treatment did not have a significant effect on the number of days to anthesis (P = 0.143).
4.2.3 Vernalisation effect on the number of main stem leaves produced
The duration of vernalisation had a significant effect on the average number of main stem
leaves produced in perennial ryegrass (P = 0.004)(Figure 4.6). There was little increase in
the main stem leaf number (<0.5 leaves) between twelve weeks and eight weeks of
vernalisation, but there was a 1.5 leaf increase between the six week and the two week
vernalisation treatment. The average main stem leaf number decreased from 5.3 at the
two week treatment to 4.9 at the zero week treatment. The regression for the number of
main stem leaves for ryegrass was significant (P <0.001), explaining 31% of the data. The
number of main stem leaves decreased by 0.1 leaves for every one week increase in
vernalisation duration.
Vernalisation treatment (weeks)
0 2 4 6 8 10 12
Day
s to
ant
hesi
s
0
60
65
70
75
80
85
90
95
100

46
Figure 4.6 The main stem leaf number for perennial ryegrass over vernalisation durations of 0-12 weeks. The vernalisation treatment had a significant effect on the number of main stem leaves (LSD 0.817, P = 0.004).
The duration of vernalisation did not have a significant effect on the average number of
main stem leaves produced in red beet (P = 0.323)(Figure 4.7). Between the 12 and four
week vernalisation treatments the average main stem leaf number of the red beet plants
remained between 29 and 33. No flowering occurred in the zero and two week
vernalisation treatments in red beet, therefore it was not included in the analysis. The
regression for main stem leaf number for red beet was not significant (P = 0.42).
Vernalisation treatment (weeks)
0 2 4 6 8 10 12
Mai
n st
em le
af n
umbe
r
0.0
3.5
4.0
4.5
5.0
5.5

47
Figure 4.7 The main stem leaf number for red beet over vernalisation durations of 0-12 weeks. The vernalisation treatment did not have a significant effect on the number of main stem leaves (P = 0.323).
Vernalisation treatment (weeks)
0 2 4 6 8 10 12
Mai
n st
em le
af n
umbe
r
0
5
10
15
20
25
30
35

48
5 DISCUSSION
5.1 Cardinal temperature experiment
5.1.1 Cumulative germination percentage
Seedling germination and emergence in the field is dependent on moisture, oxygen and
temperature, so it is important to sow when conditions are optimum. Soil temperatures
which seeds are sown into, and experience for germination and emergence fluctuate
both daily and seasonally (Moot et al., 2000). Knowledge of the base temperature of
different species is therefore important for matching the sowing date to when conditions
are most favourable for germination and emergence. The most favourable temperatures
for cumulative germination percent for all species were 20, 25 and 30 ° C, with these
being the only temperatures where all species reached ≥ 50% germination. Bierhuizen
and Wagenvoort (1974) stated that carrot and onion were generally slower than other
vegetables species to germinate in their experiment. This was consistent with the results
from the germination percentage graphs in this experiment, where both species took
between 3-5 days for 50% germination in middle range temperatures (15-25 °C) and most
other species reached ≥ 50% germination in 0.5-2.5 days. Red beet and ryegrass were not
included in the vegetables used in Bierhuizen and Wagenvoort’s (1974) experiment, but
they had similar germination time frames to carrot and onion for the selected
temperature range in this experiment. Parsnip was the slowest vegetable to germinate at
every temperature treatment in this experiment, with no germination occurring at any
temperature in less than 5 days. Parsnip is a slow germinating species which may give
weeds a competitive advantage at establishment (Monks et al., 2009), so they may
populate bare space and capture incoming radiation which compromises the
establishment of the slower establishing species.
The reasoning for slower germination in certain species is attributed to thermal time
requirements, as the combination of base temperature and heat sums (thermal time in
degree days) determines the germination period (Bierhuizen and Wagenvoort, 1974). The
heat sum for germination was calculated by integrating the difference between the
average daily soil temperature and the base temperature over the germination period.
This calculation would differ between constant temperature in a controlled environment,

49
and conditions in the field, therefore slow germination rates of species such as carrot,
onion and parsnip may be even slower or potentially faster in the field depending on
temperature fluctuations and degree days accumulated.
5.1.2 Germination rate and cardinal temperatures
5.1.2.1 Methods
The germination rate of the vegetable species and perennial ryegrass tested increased
linearly with temperature up to an optimum. Germination rate declined as temperature
moved away from the optimum, which was consistent with the favourable germination
percentages and fell close to 30 °C for many of the species.
The method which was used in this experiment of finding germination rate by defining
1/days to germination of a defined percentile in the sample is a widely adapted system
(Marshall and Squire, 1996). A survey by Angus et al. (1981) showed that responses to
temperature of 1/time to 50% of the seed sample were predominantly linear, especially
in cereals and legumes, but there were some curvilinear responses also. There was no
mention of specific vegetable seed results. Linearity allows extrapolation of rates
measured at only a few temperatures to a base temperature, and to an optimum and
maximum temperature if the range is wide enough, so is an important and widely used
method for the estimation of cardinal temperatures (Marshall and Squire, 1996).
Literature shows that variation studies within populations has sometimes revealed non-
linearities or inconsistencies (Marshall and Squire, 1996), similarly to what has been
found in this base temperature experiment. High germination percentiles often do not
occur at temperatures just above the base temperature. This is evident in the experiment
at hand where the percent of seeds germinated was less than 50% at low temperatures
(5 and 10 °C for some species) and at high temperature (35 and 40 °C). Marshall and
Squire (1996) stated that despite non-linearities being present, they are not great enough
to cause unacceptable error in linear models used to predict base temperature, and
therefore the method is valid and useful for defining and comparing non-dormant seed
lots of most species.

50
The decisions made in the analysis of data in this experiment are in contradiction of what
Marshall and Squire (1996) stated, as there was some exclusion of data points from the
germination rate analysis on the basis that they were outliers which would produce
inaccurate results. The 5 °C data was removed from the mustard analysis because it only
reached 12% germination, so the calculated 50% germination rate (0.01) was so low that
it was not realistic to include it as a point above base temperature in a linear regression.
If this point was included then the straight line linear regression would force the intercept
with the temperature axis to be lower than where the realistic base temperature for
where germination would begin to occur. Removing the lowest temperature point
however, also causes the estimation of base temperature to be higher than the point
where germination actually ceases. An appropriate base temperature is required for
practical reasons in the field when planting, as the difference between 5 and 10 °C soil
temperature is likely to change the sowing date by months and the establishment and
competitiveness of the crop against weeds for any species. For this reason, the removal
of unrealistic data points in this experiment improved the base temperature in a practical
sense. Using mustard as an example, if the 5 °C data point had not been removed then
the base temperature calculated would have been less than 5 °C and a farmer who
planted the crop at this lower temperature may only observe 12% germination, whereas
with the removal of this point the base temperature was lifted to 6.1 °C where a farmer
would observe higher germination rates.
No germination at all occurred at 35 or 40 °C for parsnip, so the 40 °C data point was
excluded from the analysis for a more accurate estimate of maximum germination
temperature. Similarly with onion, the 40 °C point was excluded from the linear
regression line, but was still plotted on the graph, as the rate of germination was
unusually high. The inclusion of this point would therefore make the intercept with the X
axis unusually high. This could be a limitation of using straight line regression analysis, as
a curved line could account for more variable germination rates, and give more accurate
estimations of cardinal temperatures. Curved line analysis however, is statistically more
difficult to perform and explain. Curved line analyses also has faults, for example in a

51
parabolic model as used by Cho et al. (2008) for pak choi, a symmetrical response about
the optimum temperature for germination is assumed which does not allow for concave
curvature near the base or maximum temperatures. Despite this pak choi experiment
using a parabolic model instead of a linear model, it is a useful representation of how the
base temperature estimation is high (13.5 °C) because the temperature range tested only
went as low as 15 ° C. Therefore, the fitted line intercepts the temperature axis at a much
higher point than if germination rate had been calculated for a wider range of low
temperatures.
Base temperature may sometimes be calculated to be below 0 °C, which is difficult to
explain biologically (Yang et al., 1995). The only species which was calculated in this
experiment to have a base temperature below zero was parsnip, at -0.2 °C.
The base temperature calculated in this experiment for carrot was 0.1 °C, which is
consistent with the literature where Suojala (2000) concluded most authors to have
found the base temperature for germination in carrots to be close to 0 °C. The calculated
base temperature however is lower than any of the base temperatures given in Table 2.5
for carrot. Differences could be related to the methods used by the author, although
most have also used regression analysis, or to genetic differences in carrot cultivars used.
5.1.2.2 Moisture
The rate of germination at high temperatures such as 35 and 40 °C may have been
negatively affected by moisture levels in the Petri dish. Imbibition in seeds is generally tri-
phasic, where the first phase includes an initial rapid increase in water content, the
second phase is a period of little change in water content, and the third phase has
another increase in water content when the radicle emerges and grows (Finch-Savage
and Phelps, 1993). At high temperatures metabolic processes may have been rapid, and
all of the available moisture is likely to have been used in the first phase of imbibition,
and/or evaporated. Moisture may then have not been adequate for radicle emergence.
Finch-Savage and Phelps (1993) found that in onion, the transition from phase two to
radicle emergence was extremely moisture sensitive and was a rate limiting step in
germination, as progress ceased when moisture was limiting. This may be the reasoning
52
for onion in this experiment not reaching levels higher than 30% germination for 30, 35
and 40 °C treatments. When moisture and oxygen are not limiting, temperature is the
main dependent of germination, however in this case poor germination rates were likely
to have been due to a combination of moisture constraints and heat damage.
Germination rates may have been higher if moisture levels were checked more than
twice daily, but it is likely to be a combination of these factors, not purely temperature or
moisture causing low germination rates.
5.1.2.3 Origin
It is possible that species origin may have an effect on their germination responses over a
range of temperatures. Asian radish, Chinese cabbage and pak choi are all likely to have a
more tropical origin in Asia than most of the other temperate species used, which could
be a factor contributing to their low germination rates at 5 and 10 °C, and superior
germination rates compared to all other species at 40 °C. Angus et al. (1981) defined the
base temperature differences among a range of temperate and tropical crops. It was
found that temperate species had a base temperature of less than 4 °C, where tropical
crops were all between 10 and 14 °C.
5.2 Vernalisation
5.2.1 Determining vernalisation response
Various methods of expressing changes in development induced by vernalisation have
been used in literature, and this experiment has used the number of days from the end of
the vernalisation period to anthesis, and the final number of leaves on the main stem.
The final number of leaves on the main stem has been stated as the most appropriate
approach because it directly reflects differences in the timing of the transition from the
vegetative phase to the reproductive phase in the apex (Wang et al., 1995; Robertson et
al., 1996). The final number of leaves on the main stem of a plant is determined by the
number of primordia that are initiated up until floral transition (Robertson et al., 1996),
therefore the final leaf number subsequently affects the rate of development to anthesis.
The number of days to anthesis is an after effect of vernalisation, so does not consider

53
the effects of continued development during vernalisation; however this can be reflected
in the final leaf number.
The effect of vernalisation on the number of leaves which are initiated on the shoot apex
at the time of vernalisation saturation can be illustrated by a function of the time taken
to reach saturation and the number of leaf primordia initiated during that time, plus the
number of leaf primordia present in a seed embryo at germination (Robertson et al.,
1996).
5.2.2 Cabbage
No flowering occurred in any cabbage plants from any vernalisation duration. This could
be assumed to be due to the imbibed seeds being insensitive to vernalisation (juvenile
stage not able to be overcome). This is supported by literature from Wiebe (1990) who
stated cabbage was only sensitive to vernalisation when a plant had 4-15 leaves initiated.
Other possibilities could include photoperiod effects or the vernalisation temperature
used (4 °C) not being cold enough. In a vernalisation experiment on carrots by Atherton
et al. (1984), it was stated that shorter photoperiods of 0 hours and 8 hours throughout
the chilling resulted in faster flowering responses than 12 hour and 16 hour
photoperiods. It is possible that this could be a reason why flowering in cabbage had not
been observed, as most of the cabbage plants were exposed to 24 hour photoperiods
while in the incubator. Robertson et al. (1996) stated that observation of leaf
development on the shoot apex of a plant can give an idea of its vegetative development
stage, and if there is going to be a transition to reproductive development. This was
performed in this experiment, with the growing point of cabbage plants from all
vernalisation treatments being assessed under a high powered microscope for signs of
the growing point changing from vegetative to reproductive. There was also no visual
evidence of cabbage plants from any vernalisation duration producing reproductive
organs (the growing point was dome like and continually producing new leaves)(Plate
5.1), which makes the previous theory related to photoperiod unlikely.

54
Plate 5.1 Microscopic view of the vegetative stage of the growing point (apex) of a cabbage plant exposed to 12 weeks of vernalisation (at 4 °C).
The effectiveness of vernalisation changes over temperature ranges, which was
illustrated by Weir et al. (1984) in the review of the literature. This was a general
illustration, and it could be a possibility that 4 °C was not cold enough for cabbage to be
vernalised. This suggestion however is not supported by literature from Wiebe (1990),
where cabbage is said to have an optimum vernalisation temperature of 4-7 °C, and at
this temperature vernalisation saturation should be reached in just four weeks. It could
therefore be concluded that the most explainable cause for no flowering in cabbage is
the inability to receive vernalisation as an imbibed seed.
5.2.3 Carrot
Three carrot plants out of the entire vernalisation experiment flowered, but there was no
consistency in results, as they were not from the same vernalisation treatment. It is
therefore hard to draw conclusions as to why these plants flowered. It is however notable
that the three plants that did flower were all from vernalisation durations of ≥ 6 weeks,
so perhaps there was some vernalisation effect. Kelly and George (1998) stated that

55
although most vegetables for seed production are biennial, there is occasionally a
tendency for a small number of plants to act as an annual and bolt (stem elongate)
prematurely. This could be a possible reason for the three carrot plants flowering. It may
also be due to genetic variation in the carrot seed used. Although information was very
limited, it was stated that some carrot cultivars in the past have been known to be able to
be vernalised as imbibed seeds (Chouard, 1960), which is contrasting to almost all other
literature, but suggests there may be potential for plant breeding to develop this trait.
Wang et al. (1995) stated that genotype had been shown to be a factor affecting the
vernalisation response in wheat, but techniques for the characterisation of genetic
variation were not well developed.
The reasoning for majority of the plants not flowering is likely to be the same as cabbage,
where imbibed seeds were not sensitive to accumulating vernal degree days. This was
supported again by Wiebe (1990) who stated that carrot required at least 8 leaves
initiated to be receptive to vernalisation. An experiment by Atherton et al. (1990) also
suggested that carrots have a strong juvenile period after plants which were 2 and 4
weeks old with less than three initiated leaves did not show any flowering after a 12
week vernalisation period at 5 °C. Plants older than six weeks with ≥ 7.5 leaves initiated
flowered and showed increases in the number of plants flowering as their age and
number of leaves increased. It is interesting to note that Wiebe (1990) reported that
carrots need short day photoperiods during the vernalisation period, and long day
photoperiod after vernalisation for flowering to occur, but this is a quantitative factor.
This means that vernalisation is the dominating influence and specific photoperiod will
decrease the time to flowering, but flowering would still occur eventually if photoperiod
was not optimum. This could have had an effect on the carrots used in this experiment
because some of the plants (particularly the long vernalisation durations) were shifted
into a 24 hour photoperiod when they began to grow and needed light while still under
the vernalisation treatment.
The apical meristem (growing point) of carrots from all vernalisation treatments were
also observed under a high powered microscope to assess if there were reproductive
organs present. As with cabbage, there was no sign of any of the treatments moving in to

56
the reproductive phase of development (the growing point was still producing leaf
primordia).
5.2.4 Red beet
5.2.4.1 Days to anthesis
The number of days to anthesis was not significantly affected by vernalisation duration in
red beet (P = 0.143), but it is important to note that this was over the 4-12 week
durations because no flowering occurred at all for the 0-2 week durations. This suggests
that imbibed red beet seeds cannot accumulate enough vernal degree days (VDD) in two
weeks at 4 °C to trigger flowering. The fact that there was no significant difference in the
number of days to anthesis between 4-12 week vernalisation durations also suggests that
4 weeks at 4 °C was enough time to accumulate the amount of VDD for vernalisation
saturation to be achieved. Beyond this point further contributions did not increase the
effect of vernalisation anymore, as described by Weir et al. (1984) in the literature for
wheat. Wiebe (1990) stated that when red beet is vernalised at its optimum temperature
of 5-9 °C it should only need to be exposed to the low temperature for three weeks to
initiate flowering. When vernalised at temperatures higher or lower than the optimum
range, exposure time for flowering is still low at only five weeks. The results gained in this
dissertation experiment were consistent with Wiebe’s (1990) information, as the
vernalisation temperature used (4 °C) was slightly lower than the optimum range given
for red beet, but flowering only occurred in plants from durations of four weeks and
greater. This confirmed that two weeks of cold exposure was not enough for red beet to
be fully vernalised and for flowering to occur. Red beet has an obligate vernalisation
requirement, so will not flower if it has not received a sufficient cold period.
Large statistical variance resulted in no significant difference in the number of days to
anthesis between vernalisation durations. The four plants in each pot of a vernalisation
duration, and replicate did not respond in time with each other, creating a large variance
in the number of days to flowering.

57
5.2.4.2 Main stem leaf number
As previously mentioned, the number of days to anthesis is affected by the final main
stem leaf number. The main stem leaf number did not change significantly over
vernalisation duration treatments in red beet plants, which is why there was also no
significant differences in the number of days to anthesis. This may be due to red beet
having a calculated base temperature of 4.2 °C, which was higher than the vernalisation
temperature the imbibed seeds were exposed to, therefore no development would have
begun while in the vernalisation treatment. Another possible reason for no significant
differences in the main stem leaf number could be due to a minimum number of leaves
possible being formed in all vernalisation treatments. The minimum number of leaves
which can be produced has been well document for wheat as seven main stem leaves,
but no literature was found for red beet.
Vernalisation studies on wheat have found photoperiod to have an effect on the final
main stem leaf number between when a plant is fully vernalised to when flowering
occurs (Wang et al., 1995). A decrease from a photoperiod of 17 hours to 9 hours
increased the final leaf number in wheat from 7 to 13.7. The photoperiod in the
glasshouse in the vernalisation experiment in this dissertation was a constant 20 hours,
so photoperiod would not have had any effect on the number of main stem leaves
produced in red beet or ryegrass.
5.2.5 Perennial ryegrass
5.2.5.1 Days to anthesis
The number of days to anthesis was significantly affected by vernalisation duration in
perennial ryegrass (P <0.001). There was less variance in the flowering date among
replicates and plants in each pot in the ryegrass compared to the red beet, which made
the response more linear and significantly different among the vernalisation durations.
The timing of anthesis depends on the number, and the rate of appearance of leaves
(Robertson et al., 1996).
The number of days to anthesis for ryegrass species was illustrated in the review of the
literature by Leopold and Kriedmann (1975), and perennial ryegrass showed a strong

58
vernalisation response with no flowering occurring in plants exposed to no vernalisation,
and plants exposed to two weeks vernalisation taking almost 160 days to flower. The
results gained from the vernalisation experiment in this dissertation (Figure 4.4) differ in
that there was some flowering in the zero week treatment, and flowering occurred after
about 105 days in the two week vernalisation treatment. Other than these differences,
the general response pattern was similar, with a reduction in days to anthesis with an
increase in vernalisation duration. The differences may be due to the vernalisation, and
glasshouse conditions, as well as differences in perennial ryegrass cultivars and if they
have an obligative or facultative vernalisation requirement, which is often unknown. It is
assumed that Leopold and Kriedmann (1975) would have used growth chambers with
constant temperature, whereas the glasshouse conditions used in this experiment were
not constant. For the zero week plants to flower, the glasshouse temperature must have
been cold enough for sufficient VDD to be accumulated for flowering to occur. A general
model for vernalisation effectiveness over a range of temperatures was given in the
review of the literature (Figure 2.3), which showed that some accumulation of VDD was
still possible up to 17 °C, however this was for wheat. The glasshouse average
temperature for the month of June when the plants were first entered in the glasshouse
was 18.1 °C, meaning that there were temperatures lower than this recorded. The
maximum temperature where VDD can still be accumulated varies for different species,
so this may be higher than 17 °C for perennial ryegrass. It is important to consider the
effect that the number of plants that flowered per pot (Figure 4.3) would have had on the
results. If more than one of the zero week ryegrass plants on average had flowered then
the results may have been more of a curved line response with zero weeks of
vernalisation taking the longest to reach anthesis, as opposed to the results gained where
zero weeks on average reached anthesis in fewer days than two week plants. The data
was restricted by time constraints of the experiment, and future flowering dates could
not be statistically estimated.
5.2.5.2 Main stem leaf number
Perennial ryegrass main stem leaf number increased as vernalisation duration decreased,
which is likely to be due to continued development and primordium production while in
the incubator. This caused a confounding effect between vernalisation effectiveness
59
lowering the final leaf number, and response of vegetative development to temperature
(Robertson et al., 1996). This also affected the number of days to anthesis. Continued
development is possible in the ryegrass in this case because the vernalisation
temperature used was 4 °C, and the base temperature for germination and development
in perennial ryegrass in the experiment was less than this, at 1.1 °C.
Development throughout vernalisation treatments has been reported occasionally in the
literature (eg. Robertson et al., 1996), but in young plants as opposed to imbibed seeds.
Craigon et al. (1995) considered the possibility of development in young wheat plants
during vernalisation treatment, and suggested that plants would advance towards
reproductive development at an increasing rate as vernalisation accumulated towards
saturation. It may be possible that this could also occur in imbibed seeds, with the
maximum number of primordia already developed on the apex by the end of the
vernalisation period (the seed is fully vernalised).
5.2.6 Application to the vegetable seed industry
Arable farmers which grow biennial vegetable seed crops such as cabbage, carrot and red
beet are often faced with crop rotation, weed, pest and disease issues related to the
length of time the crop is in the ground, and this period including winter. The positive
vernalisation response of imbibed red beet seeds suggests that there is potential for the
sowing date to be after winter, as opposed to late summer/early autumn for a seed crop.
This would shorten the lifecycle from greater than 12 months, to 7-8 months.
Vernalisation as imbibed seeds does not appear to be a solution for cabbage or carrot
seed crops. The ability of red beet seeds to be successfully vernalised means that this
process could take place in a controlled environment, and the seeds could be
transplanted into the field in optimum growing conditions in spring. The removal of the
winter period from the red beet lifecycle would potentially decrease the overall costs of
weed, pests and disease control, as this period is where many issues arise. The number of
species which could be included in the crop rotation may also be improved by changing
the sowing date of red beet seed crops to spring, as well as allowing for the opportunity
for other land uses over the winter period. Chouard (1960) stated that there must be a
reduction in the total number of leaves produced before flowering as the vernalisation

60
duration increases for a vernalisation response to be proven for a particular temperature,
which would suggest that a vernalisation response was not proven for red beet, but data
was not obtained from 0-2 week durations. The objective of this experiment however,
was to assess if imbibed seeds could be successfully vernalised, which proved to be
positive for red beet. Further research is required for logistics on the optimum
vernalisation temperature and duration for red beet seeds.

61
5.3 Conclusions
Cardinal temperatures were determined for a range of vegetable species. The
base temperature, optimum temperature and maximum temperature for
germination in carrot were 0.1, 30.9 and 40.7 °C respectively. Red beet cardinal
temperatures were 4.2, 35.9 and 44.4 °C.
Cabbage and carrot were not successfully vernalised as imbibed seeds, which was
most likely due to insensitivity to vernalisation as a juvenile seed or plant. Red
beet showed a positive vernalisation response as an imbibed seed, resulting in
anthesis in 4-12 week vernalisation durations.
Ryegrass also responded positively to vernalisation, as expected, with anthesis
occurring in all vernalisation durations, confirming the vernalisation technique.
The number of days from the end of the vernalisation period to anthesis differed
significantly in ryegrass, with a general decrease in days as vernalisation duration
increased. This is related to continued development and faster reproductive
changes with minimised leaf primordial production. Red beet did not have
significant differences in the number of days to anthesis between 4-12 week
vernalisation durations.
The final main stem leaf number links with the number of days to anthesis, so
showed similar patterns with significant differences in the number of leaves
produced between durations in ryegrass, but no significant differences in red
beet.
There is potential for the sowing date of red beet seed crops to be moved to
spring, resulting in decreased weed, pest and disease expenses, and the possibility
of opportunity cost of a short term winter crop.

62
ACKNOWLEDGEMENTS
Firstly, I would like to thank Professor Derrick Moot for finding me a well suited and
funded project. Thank you for all your encouragement throughout the year and for
making me believe I can do it!
Thank you to my supervisor, Dr. Jeff McCormick. Your patience, help and guidance with
my project this year has been excellent and is greatly appreciated. I would not have been
able to complete this without you.
I would like to thank the Foundation for Arable Research for funding my B.Agr.Sci
honours fourth year.
I would like to thank Judith Kidd for the use of laboratory space and equipment, and
Brent Richards and staff at the Nursery for the use of the glasshouse and for keeping the
experimental plants well watered.
Many thanks to Anna Mills for your help to not only myself, but all of the honours
students with data, endnote, formatting and all of the issues we encountered.
I would like to thank my parents, Graeme and Heather, my brother Andrew and other
family members for the support and encouragement I have received over the last four
years I’ve spent at Lincoln University.
Last, but not least I would like to thank my fellow honours students and my flat mates for
your patience, help and support over this year, it means a lot. In particular I would like to
thank my flat mate Woody for the many hours of help in the glasshouse and crop lab with
the practical and time consuming jobs, cheers!

63
REFERENCES
Alessandro, M. S. and Galmarini, C. R. 2007. Inheritance of vernalization requirement in carrot. Journal of the American Society for Horticultural Science, 132, 525-529.
Angus, J., Cunningham, R., Moncur, M. and Mackenzie, D. 1981. Phasic development in
field crops I. Thermal response in the seedling phase. Field Crops Research, 3, 365-378.
Atherton, J., Basher, E. and Brewster, J. 1984. The effects of photoperiod on flowering in
carrot. Journal of Horticultural Science, 59, 213-215. Atherton, J. G., Craigon, J. and Basher, E. A. 1990. Flowering and bolting in carrot. I.
Juvenility, cardinal temperatures and thermal times for vernalization. Journal of Horticultural Science, 65, 423-429.
Ben-Noon, E., Shtienberg, D., Shlevin, E., Vintal, H. and Dinoor, A. 2001. Optimization of
chemical suppression of Alternaria dauci, the causal agent of Alternaria leaf blight in carrots. Plant disease, 85, 1149-1156.
Bierhuizen, J. and Wagenvoort, W. 1974. Some aspects of seed germination in
vegetables. 1. The determination and application of heat sums and minimum temperature for germination. Scientia Horticulturae, 2, 213-219.
Black, A., Moot, D. and Lucas, R. 2006. Development and growth characteristics of
Caucasian and white clover seedlings, compared with perennial ryegrass. Grass and Forage Science, 61, 442-453.
Brewster, J. and Sutherland, R. 1993. The rapid determination in controlled environments
of parameters for predicting seedling growth rates in natural conditions. Annals of Applied Biology, 122, 123-133.
Brooking, I. R. 1996. Temperature response of vernalization in wheat: a developmental
analysis. Annals of Botany, 78, 507-512. Cho, Y. Y., Bae, J. H. and Son, J. E. 2008. Use of parabolic function to calculate cardinal
temperatures in pak-choi (Brassica campestris ssp. chinensis). Horticulture, Environment and Biotechnology, 49, 145-148.
Chouard, P. 1960. Vernalization and its relations to dormancy. Annual Review of Plant
Physiology, 11, 191-238. Craigon, J., Atherton, J. G. and Sweet, N. 1995. Modelling the effects of vernalization on
progress to final leaf appearance in winter wheat. Journal of Agricultural Science, 124, 369-377.

64
Dabney, S., Delgado, J. and Reeves, D. 2001. Using winter cover crops to improve soil and water quality. Communications in Soil Science and Plant Analysis, 32, 1221-1250.
Dias-Tagliacozzo, G. M. and Valio, I. F. 1994. Effect of vernalization on flowering of Daucus
carota (Cvs Nantes and Brasilia). Revista Brasileira de Fisiologia Vegetal, 6, 71-73. Dickson, M., Rieger, B. and Peterson, C. 1961. A cold unit system to evaluate bolting
resistance in carrots. Journal of the American Society for Horticultural Science, 71, 401-405.
Errakhi, R., Bouteau, F., Lebrihi, A. and Barakate, M. 2007. Evidences of biological control
capacities of Streptomyces spp. against Sclerotium rolfsii responsible for damping-off disease in sugar beet (Beta vulgaris L.). World Journal of Microbiology and Biotechnology, 23, 1503-1509.
Farrar, J. J., Pryor, B. M. and Davis, R. M. 2004. Alternaria diseases of carrot. The
American Phytopathological Society: Plant disease, 88, 776-784. Feikea, T., Pfenninga, J., Graeff-Hönningera, S., Chenb, Q. and Claupeina, W. 2010.
Adaptation of CROPGRO to Chinese cabbage I. Estimation of cardinal temperatures. Grasping the complexity of intercropping–developing and testing an integrated decision support system for vegetable production in the North China Plain, 23.
Finch-Savage, W. and Phelps, K. 1993. Onion (Allium cepa L.) seedling emergence
patterns can be explained by the influence of soil temperature and water potential on seed germination. Journal of Experimental Botany, 44, 407-414.
Finch‐Savage, W., Steckel, J. and Phelps, K. 1998. Germination and post‐germination
growth to carrot seedling emergence: predictive threshold models and sources of variation between sowing occasions. New Phytologist, 139, 505-516.
George, R. A. T. 2009. Vegetable seed production. Bodman, UK: CAB International Hampton, J., Trivedi, R. and Townshend, J. 2012. Can crop rotation reduce inoculum of
the carrot pathogen Alternaria radicina? In: Delivering Profitable, Sustainable and Resilient Farming Systems, 42nd Agronomy Society Conference, Lincoln University, Canterbury, New Zealand. Agronomy Society of New Zealand. Vol. 42. p 155-162.
Hendricks, S. and Borthwick, H. 1967. The function of phytochrome in regulation of plant
growth. Proceedings of the National Academy of Sciences of the United States of America, 58, 21-25.
Hiller, L. and Kelly, W. 1979. The effect of post-vernalization temperature on seedstalk
elongation and flowering in carrots. Journal American Society for Horticultural Science, 104, 17-24.

65
Kane, N., Danyluk, J. and Sarhan, F. 2006. Vernalization Genes in Winter Cereals. In: T. H. H. Chen, M. Uemura and S. Fujikawa (eds). Cold Hardiness in Plants: Molecular Genetics, Cell Biology and Physiology. Canada: CABI Publishing, 76-86.
Kelly, A. F. and George, R. A. 1998. Encyclopaedia of seed production of world crops
Chichester: John Wiley & Sons Kendrick, R. E. and Frankland, B. 1983. Phytochrome and plant growth. London: Edward
Arnold Lancaster, J., Triggs, C., De Ruiter, J. and Gandar, P. 1996. Bulbing in onions: photoperiod
and temperature requirements and prediction of bulb size and maturity. Annals of Botany, 78, 423-430.
Leopold, A. C. and Kriedmann, P. E. 1975. Plant Growth and Development (Second
Edition). McGraw Hill, New York. 120-123 pp. Marshall, B. and Squire, G. 1996. Non-linearity in rate-temperature relations of
germination in oilseed rape. Journal of Experimental Botany, 47, 1369-1375. Mauseth, J. D. 2012. Botany: an introduction to plant biology. Burlington, Massachusetts:
Jones & Bartlett Publishers McDonald, M. B. and Copeland, L. O. 1997. Seed production: principles and practices.
New York: Chapman & Hall Monks, D. P., SadatAsilan, K. and Moot, D. J. 2009. Cardinal temperatures and thermal
time requirements for germination of annual and perennial temperate pasture species. Agronomy New Zealand, 39, 95-110.
Moot, D., Scott, W., Roy, A. and Nicholls, A. 2000. Base temperature and thermal time
requirements for germination and emergence of temperate pasture species. New Zealand Journal of Agricultural Research, 43, 15-25.
Porter, J. R. and Gawith, M. 1999. Temperatures and the growth and development of
wheat: a review. European Journal of Agronomy, 10, 23-36. Purvis, O. and Gregory, F. 1952. Studies in Vernalisation XII. The Reversibility by High
Temperature of the Vernalised Condition in Petkus Winter Rye. Annals of Botany, 16, 1-21.
Robertson, M., Brooking, I. and Ritchie, J. 1996. Temperature response of vernalization in
wheat: modelling the effect on the final number of mainstem leaves. Annals of Botany, 78, 371-381.
66
Sakr, E. and Thompson, H. 1942. Effect of temperature and photoperiod on seed stalk development in carrot. In: Proceedings of the American Society of Horticultural Science. Vol. 41. p 343-346.
Sasnauskas, A., Kavaliauskaitė, D., Karklelienė, R. and Bobinas, C. 2012. Weed control by
herbicides and their combination in carrot crop. In: XXVIII International Horticultural Congress on Science and Horticulture for People (IHC2010): International Symposium on 936. p 295-298.
Shadbolt, C. A. and Holm, L. G. 1956. Some quantitative aspects of weed competition in
vegetable crops. Weeds, 4, 111-123. Soteros, I. 1979. Pathogenicity and control of Alternaria radicina and A. dauci in carrots.
New Zealand Journal of Agricultural Research, 22, 191-196. Streck, N. A., Weiss, A. and Baenziger, P. S. 2003. A generalized vernalization response
function for winter wheat. Agronomy journal, 95, 155-159. Sung, S. and Amasino, R. M. 2005. Remembering winter: toward a molecular
understanding of vernalization. Annual Review of Plant Biology, 56, 491-508. Suojala, T. 2000. Pre-and postharvest development of carrot yield and quality University
of Helsinki, Finland Taiz, L. and Zeiger, E. 2010. Plant Physiology (fifth Ed). Sunderland: Sinauer Associates Inc. Wang, S. Y., Ward, R. W., Ritchie, J. T., Fischer, R. A. and Schulthess, U. 1995.
Vernalization in wheat I. A model based on the interchangeability of plant age and vernalization duration. Field Crops Research, 41, 91-100.
Weir, A. H., Bragg, P. L., Porter, J. R. and Rayner, J. H. 1984. A winter wheat crop
simulation model without water or nutrient limitations. Journal of Agricultural Science, UK, 102, 371-382.
Whalley, W., Finch‐Savage, W., Cope, R., Rowse, H. and Bird, N. 1999. The response of
carrot (Daucus carota L.) and onion (Allium cepa L.) seedlings to mechanical impedance and water stress at sub‐optimal temperatures. Plant, Cell & Environment, 22, 229-242.
Wiebe, H. J. 1990. Vernalization of vegetable crops - a review. In. Acta Horticulturae, 323-
328. Yan, W. and Hunt, L. 1999. Reanalysis of vernalization data of wheat and carrot. Annals of
Botany, 84, 615-619.

67
Yang, S., Logan, J. and Coffey, D. L. 1995. Mathematical formulae for calculating the base temperature for growing degree days. Agricultural and Forest Meteorology, 74, 61-74.

68
APPENDICES
Appendix 1 The vernalisation experiment complete randomised block design for the layout of the pots in Fletcher glasshouse.
Row 1 Row 2 Row 3 Row 4 Row 5 Row 6 Row 7 Row 8
6 wk carrot 4 wk carrot 6 wk RG 12 wk RG 10 wk RG 0 wk cabbage 4 wk RG 10 wk red beet
2 wk RG 10 wk cabbage 8 wk red beet 2 wk cabbage 2 wk red beet 10 wk carrot 2 wk cabbage 0 wk carrot
12 wk carrot 6 wk cabbage 12 wk cabbage 0 wk carrot 0 wk red beet 4 wk cabbage 4 wk carrot 8 wk carrot
8 wk RG 4 wk RG 2 wk carrot 0 wk cabbage 12 wk carrot 6 wk cabbage 8 wk red beet 8 wk cabbage
8 wk carrot 10 wk red beet 2 wk red beet 12 wk red beet 6 wk red beet 2 wk RG 2 wk carrot 12 wk red beet
6 wk RG 10 wk carrot 8 wk cabbage 10 wk RG 8 wk RG 12 wk RG 12 wk cabbage 6 wk RG
4 wk cabbage 0 wk red beet 4 wk red beet 6 wk red beet 6 wk carrot 4 wk red beet 10 wk cabbage 0 wk RG
Row 9 Row 10 Row 11 Row 12 Row 13 Row 14 Row 15 Row 16
6 wk red beet 0 wk carrot 2 wk red beet 12 wk cabbage 6 wk carrot 2 wk carrot 6 wk cabbage 0 wk carrot
12 wk RG 8 wk RG 2 wk RG 8 wk carrot 0 wk red beet 2 wk RG 10 wk red beet 4 wk cabbage
0 wk red beet 4 wk RG 8 wk red beet 0 wk cabbage 12 wk cabbage 0 wk RG 2 wk cabbage 6 wk RG
10 wk cabbage 4 wk red beet 10 wk carrot 6 wk RG 12 wk red beet 4 wk carrot 8 wk carrot 10 wk cabbage
12 wk carrot 0 wk RG 6 wk cabbage 4 wk carrot 0 wk cabbage 2 wk red beet 10 wk RG 4 wk red beet
6 wk carrot 4 wk cabbage 10 wk red beet 2 wk cabbage 8 wk cabbage 12 wk carrot 10 wk carrot 8 wk RG
10 wk RG 2 wk carrot 8 wk cabbage 12 wk red beet 6 wk red beet 8 wk red beet 12 wk RG 4 wk RG
Row 17 Row 18 Row 19 Row 20 Row 21 Row 22 Row 23 Row 24
12 wk RG 6 wk RG 2 wk cabbage 2 wk red beet 0 wk cabbage 6 wk red beet 8 wk cabbage 2 wk RG
0 wk carrot 4 wk red beet 4 wk carrot 8 wk RG 10 wk carrot 12 wk red beet 8 wk red beet 10 wk red beet
10 wk red beet 8 wk cabbage 10 wk RG 0 wk cabbage 10 wk cabbage 0 wk carrot 4 wk cabbage 10 wk RG
6 wk red beet 0 wk RG 6 wk carrot 0 wk red beet 0 wk RG 4 wk RG 12 wk RG 2 wk cabbage
10 wk carrot 4 wk cabbage 12 wk red beet 6 wk cabbage 12 wk carrot 12 wk cabbage 4 wk carrot 2 wk carrot
2 wk carrot 12 wk cabbage 12 wk carrot 10 wk cabbage 8 wk RG 4 wk red beet 6 wk RG 6 wk cabbage
4 wk RG 2 wk RG 8 wk carrot 8 wk red beet 0 wk red beet 6 wk carrot 8 wk carrot 2 wk red beet
Block 6 (Reps 6)
Block 1 (Rep 1) Block 2 (Rep 2)
Block 3 (Rep 3) Block 4 (Rep 4)
Block 5 (Rep 5)