Cardinal Health Q2 2009 Earnings Presentation
24
Essential to care Q2FY2009 Investor/Analyst Call February 5, 2009
-
date post
21-Oct-2014 -
Category
Economy & Finance
-
view
576 -
download
2
description
Transcript of Cardinal Health Q2 2009 Earnings Presentation

Essential to care
Q2FY2009Investor/Analyst Call
February 5, 2009

2
Forward-looking statements and GAAP reconciliation
This presentation contains forward-looking statements addressing expectations, prospects, estimates
and other matters that are dependent upon future events or developments.
These matters are subject to risks and uncertainties that could
cause actual results to differ materially from those projected, anticipated or implied.
The most significant of these uncertainties are described in Cardinal Health's Form 10-K, Form 10-Q and Form 8-K reports (including all amendments to those reports) and exhibits to those reports, and include (but are not limited to) the following: uncertainties related to the deferral in hospital capital spending affecting Cardinal Health's Clinical and Medical Products segment and difficulties in forecasting the exact duration and potential long-term changes in hospital spending patterns; uncertainties regarding the planned spinoff of the clinical and medical products businesses as a new stand-alone entity, including the timing and terms of any such spinoff
and whether such spinoff will be completed, and uncertainties regarding the impact of the planned spinoff on Cardinal Health, the new clinical and medical products company and the potential market for their respective securities; competitive pressures in Cardinal Health's various lines of business; the loss of one or more key customer or supplier relationships or changes to
the terms of those relationships; uncertainties relating to timing of generic and branded pharmaceutical introductions and the frequency or rate of branded pharmaceutical price appreciation or generic pharmaceutical price deflation; changes in the distribution patterns or reimbursement rates for health-care products and/or services; the results, consequences, effects or timing of any inquiry or investigation by any regulatory authority or any legal or administrative proceedings; future actions of regulatory bodies or government authorities relating to Cardinal Health's manufacturing or sale of products and other costs or claims that
could arise from its manufacturing, compounding or repackaging operations or from its other services; the costs, difficulties and uncertainties related to the integration of acquired businesses; uncertainties related to the recent disruptions in the financial
markets, including uncertainties related to the availability and/or cost of credit for Cardinal Health; the potential impact on Cardinal Health’s customers and vendors of declining economic conditions, which could impact
Cardinal Health’s earnings and cash flow; and conditions in the pharmaceutical market and general economic and market conditions.
This presentation reflects management's views as of Feb.
5, 2009.
Except to the extent required by applicable law, Cardinal Health undertakes no obligation to update or revise any forward-looking statement. In addition, this presentation includes non-GAAP financial measures.
Cardinal Health provides definitions and reconciling information at the end of this presentation and on its investor relations page at www.cardinalhealth.com. A transcript of the conference call will be available on the investor relations page at www.cardinalhealth.com.

3
Agenda
Opening remarks
Kerry ClarkChairman and Chief Executive Officer
Financial overview
Jeff HendersonChief Financial Officer
HSCS comments
George BarrettVice Chairman and CEO Healthcare Supply Chain Services
CMP comments
Dave SchlotterbeckVice Chairman and CEOClinical and Medical Products
Q&A

4
Q2 FY2009 Results

5
Q2 FY2009 Financial Review
$25,100
$538
$319
$0.88
$271.5
15.8%
($M)
8%
4%
(2%)
(1%)
% Change1
GAAP Basis
$25,100
$565
$335
$0.93
16.6%
($M)
8%
7%
2%
3%
% Change1
Non-GAAP Basis
1% change over prior year quarter
Revenue
Operating earnings
Earnings from continuing ops
Diluted EPS from continuing ops
Operating cash flow
Return on equity

6
Operating Earnings ($M)
Diluted EPS from Continuing Operations
Operating Earnings ($M)
Diluted EPS from Continuing Operations
GAAP consolidated $538 $0.88 $519 $0.89
Special items (Note) $20 $0.04 $30 $0.05
Impairments, (gain)/loss on sale of assets and other, net (Note) $7 $0.01 ($23) ($0.04)Spinoff costs not included in special items or impairments, (gain)/loss on sale of assets and other, net (Note) $0.4 $0.00 - -
Non-GAAP consolidated $565 $0.93 $526 $0.90
Spinoff costs included in special items or impairments, (gain)/loss on sale of assets and other, net $14.1Spinoff costs not included in special items or impairments, (gain)/loss on sale of assets and other, net $0.4Total spinoff costs $14.5
Q2 FY 2009 Q2 FY 2008
Q2 FY2009 Operating Earnings and EPS
Note: Costs associated with the spinoff are as follows:
7
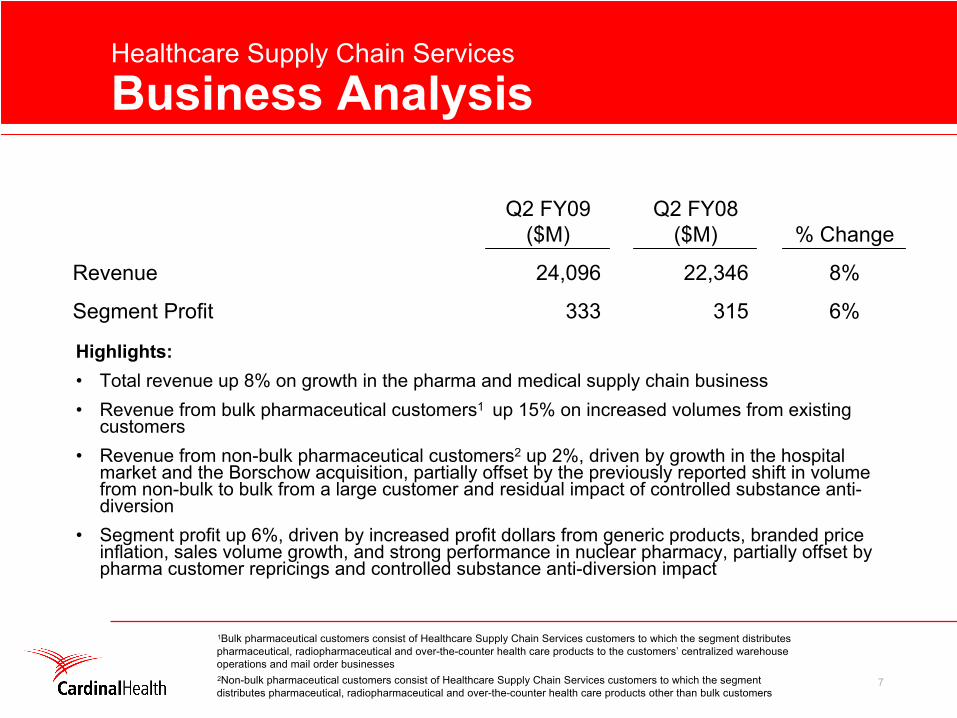
Healthcare Supply Chain Services
Business Analysis
Highlights: •
Total revenue up 8% on growth in the pharma and medical supply chain business•
Revenue from bulk pharmaceutical customers1 up 15% on increased volumes from existing customers
•
Revenue from non-bulk pharmaceutical customers2
up 2%, driven by growth in the hospital market and the Borschow
acquisition, partially offset by the previously reported shift in volume from non-bulk to bulk from a large customer and residual impact of controlled substance anti-
diversion•
Segment profit up 6%, driven by increased profit dollars from generic products, branded price inflation, sales volume growth, and strong performance in nuclear pharmacy, partially offset by pharma customer repricings
and controlled substance anti-diversion impact
Revenue
Segment Profit
24,096
333
Q2 FY09($M)
22,346
315
Q2 FY08($M)
8%
6%
% Change
1Bulk pharmaceutical customers consist of Healthcare Supply Chain
Services customers to which the segment distributes pharmaceutical, radiopharmaceutical and over-the-counter health care products to the customers’
centralized warehouse operations and mail order businesses2Non-bulk pharmaceutical customers consist of Healthcare Supply Chain
Services customers to which the segment distributes pharmaceutical, radiopharmaceutical and over-the-counter health care products other than bulk customers

8
Clinical and Medical Products
Business Analysis
Highlights:•
Segment revenue up 7% over prior year due to organic growth in dispensing, infusion, and infection prevention, and the Enturia
acquisition, partially offset by the negative impact of foreign
exchange•
Segment profit up 16% on the Enturia
acquisition and organic growth, significantly dampened by the impact of foreign exchange and the residual impact of the increases in the cost of raw materials
•
Enturia
performing above expectations
•
Committed contracts across infusion, dispensing, respiratory are
challenged due to hospital capital spending deferral
Revenue
Segment Profit
1,215
198
Q2 FY09($M)
1,133
171
Q2 FY08($M)
7%
16%
% Change

9
FY09 Financial Goals
February 5, 2009
Total revenue growth:6-7%
Non-GAAP EPS1: $3.50 -
$3.60
Segment RevenueGrowth
ProfitGrowth
Healthcare Supply Chain Services (HSCS) >6% Flat to (5%)
Clinical and Medical Products (CMP) Flat to better Flat to better
1 Non-GAAP diluted earnings per share from continuing operations

10
FY09 Assumptions Update: February 5, 2009•
Capital deployment–
Share repurchases to no more than offset equity compensation issuances
–
Expect to continue regular $0.14 quarterly dividend until spinoff is completed
•
Portfolio rationalization/review–
MedSystems
sale closed 8/29/08
–
Tecomet
sale closed 9/26/08
–
Review of Medicine Shoppe International and Pharmacy Services ongoing
•
Non-GAAP effective tax rate of ~34% for the year
•
Interest and other slightly above $200M for the year
•
Special items, impairment and other costs related to spinoff not
included in guidance–
Anticipate a significant portion of costs related to spinoff may
be classified as special items in accordance with company practices
–
May incur in the range of $200M -
$230M in expenditures in connection with the spinoff up to and including the effective date

11
HSCS Update
•
Pharmaceutical–
All controlled substances distribution centers on-line
–
Regaining momentum with non-bulk customers
–
Solid progress with generic programs
–
Strong nuclear pharmacy quarter, with new contracts signed
•
Medical–
Solid quarter in Med Supply Chain with double-digit profit growth
–
Continued focus on efficiency and SKU management

12
CMP Update
•
Q2 results solid despite challenging market climate–
Organic growth in dispensing, infusion, infection prevention
–
Strong contribution from Enturia
–
Substantial, negative impact from F/X, commodities
•
FY09(E) segment profit flat or better vs. FY08–
Disposables (~40% of sales) are steady, recurring stream
–
Hospitals deferring capital spending
–
Investment in R&D continues
•
Future growth drivers–
Pipeline of innovative, clinically differentiated products
–
Strong global expansion opportunities
–
Differentiated focus on patient safety

13
Summary

14
FY 2009 Priorities•
Continue to invest in enhancing quality and regulatory systems
• Return HSCS to steady growth
• Continue to invest in CMP growth
• Complete integrations (VIASYS®, Enturia, Borschow)
• Prepare organization for and execute spinoff

Q&A


17
Q2FY09 Trailing Five Quarters

18
Segment Analysis: Q2FY09
Q2FY08 Q3FY08 Q4FY08 Q1FY09 Q2FY09 Q2FY09/ Q2FY08% change
Revenue ($M)
$22,346 $21,923 $21,863 $23,418 $24,096 8%
Segment Profit ($M)
$315 $377 $324 $292 $333 6%
Healthcare Supply Chain Services
Q2FY08 Q3FY08 Q4FY08 Q1FY09 Q2FY09 Q2FY09/ Q2FY08% change
Revenue ($M)
$1,133 $1,170 $1,270 $1,155 $1,215 7%
Segment Profit ($M)
$171 $190 $229 $167 $198 16%
Clinical and Medical Products

19
Segment Analysis: Q2FY09
Q2FY08 Q3FY08 Q4FY08 Q1FY09 Q2FY09 Q2FY09/ Q2FY08% change
Revenue ($M)
$301 $308 $288 $273 $265 (12%)
Segment Profit ($M)
$25 $26 $27 $24 $31 25%
All Other Segment

20
GAAP to Non-GAAP Reconciliation Statements