Cardiac Rhythm Disease Management - Medtronic, World Leader in
166
2013 First Edition – Issue 68 Product Performance Report Important Patient Management Information for Physicians Cardiac Rhythm Disease Management
Transcript of Cardiac Rhythm Disease Management - Medtronic, World Leader in
2013 First Edition – Issue 68
Product Performance ReportImportant Patient Management Information for Physicians
Cardiac Rhythm Disease Management

This report is available online at www.medtronic.com/CRDMProductPerformance

March 2013Medtronic CRDM Product Performance Reportwww.medtronic.com/CRDMProductPerformance
A Message from the Vice President
Dear Customer,
At Medtronic, product quality and reliability have been and will continue to be a priority. For over 29 years, Medtronic has compiled and produced product performance reports with one primary goal, to provide you with the product information you need to best care for your patients.
Our commitment to you is best expressed in Medtronic’s mission: “To strive without reserve for the greatest possible reliability and quality in our products; to be the unsurpassed standard of comparison and to be recognized as a company of dedication, honesty, integrity, and service.” To this end, we continually explore new ways to expand, improve, and learn from our product performance systems and measures.
Our quality goals cannot be reached alone. We welcome your collaboration, insight, and recommendations. Please contact our Technical Services Department at 1 (800) 723-4636 with your feedback comments and any questions.
Your participation and assistance in returning explanted products are also critical. Returned products are tested and evaluated so that we can fully measure the performance of our devices. Please refer to the instructions on the next page for assistance in returning products to the Medtronic CRDM Returned Product Analysis Laboratory.
As we constantly strive to exceed your expectations, we thank you for your dedication to improving and saving the lives of those suffering from cardiac rhythm disorders.
With appreciation and warm regards,
Tim Samsel Vice President, Quality and Regulatory Medtronic Cardiac Rhythm Disease Management Medtronic, Inc.

March 2013Medtronic CRDM Product Performance Reportwww.medtronic.com/CRDMProductPerformance
Editorial StaffIndependent Physician Quality PanelSteven J. Compton, MD, Anchorage, AKJohn P. DiMarco, MD, PhD, Charlottesville, VAKevin Hackett, MD, Columbus, OHR. Hardwin Mead, MD, Palo Alto, CAN.A. Mark Estes, MD, Boston, MA
Editor Tim Samsel, Vice President, CRDM Quality and Regulatory
AuthorsJia Guo, Ph.D. Senior Statistician,Customer Quality Engineering Services, CRDMBecky DeBus, Senior Principal Clinical IT Developer,Medtronic Clinical Research Institute
Acknowledgement Sherice Nelson, Communications Specialist, Marketing Communications Christine Altenhofen-Sonner, Graphic Production, CRDM Carol Spooner, Proofreader, CRDM
We invite our customers to use these telephone numbers to call with suggestions, inquiries, or specific problems related to our products.
Contact Information
US Technical Services Department International Technical CentersPhone: 1 (800) 723-4636 (Tachy)
1 (800) 505-4636 (Brady)Fax: 1 (800) 824-2362www.medtronic.com/corporate/contact.jsp
Europe (Heerlen NL) +31-45-566-8844 Japan (Tokyo) +81-3-5753-4116
For questions related to this CRDM Product Performance Report, please call US Technical Services at the number above, or write to:
Jia Guo, Ph.D. Medtronic, Inc. 8200 Coral Sea Street NE MVN61 Mounds View, MN 55112 USA
Email: [email protected]
For questions related to returning explanted product or returning product that shows signs of malfunction, please contact:
Outside the United States: Your Medtronic representative or international technical center at the number above.
Within the United States: Your Medtronic representative or
CRDM Returned Product Analysis Laboratory
Phone: 1 (800) 328-2518, ext. 44800 Email: [email protected]
Trademarks of Medtronic, Inc.Adapta®Advisa®Advisa DR MRI™AT500®Attain®Attain Ability®Attain StarFix®CapSure®CapSure Sense®CapSureFix®CapSureFix Novus™Capture Management®CareLink®Concerto®Consulta®EnPulse®EnRhythm®EnRhythm MRI™Ensura MRI™EnTrust®EnTrust MRI™GEM®InSync®InSync ICD®InSync Marquis™
InSync II Marquis™InSync III Marquis™InSync Maximo®InSync II Protect™InSync III Protect™InSync Sentry®Intrinsic®Jewel®Kappa®Legend®Marquis®Maximo®Medtronic CareAlert®Medtronic CareLink®Micro JewelMicro MinixMinixMinuetMVP®Onyx®Patient Alert™PrevaPrevail®
ProdigyProtecta®Quick Look™Relia™Revo MRI®Secura®SelectSecure®Sensia®Sensing AssuranceSigma®SpectraflexSprint®Sprint Fidelis®Sprint Quattro®Sprint Quattro Secure®Sprint Quattro Secure S®SureFix®Syncra™ Target Tip®TenaxThera®-iTransveneVersa®Virtuoso®
March 2013 Perf
orm
ance
N
otes
Adv
isor
ies
ICD
Cha
rge
Tim
esLe
ads
IPG
ICD
CRT
CRDM Product Performance Report
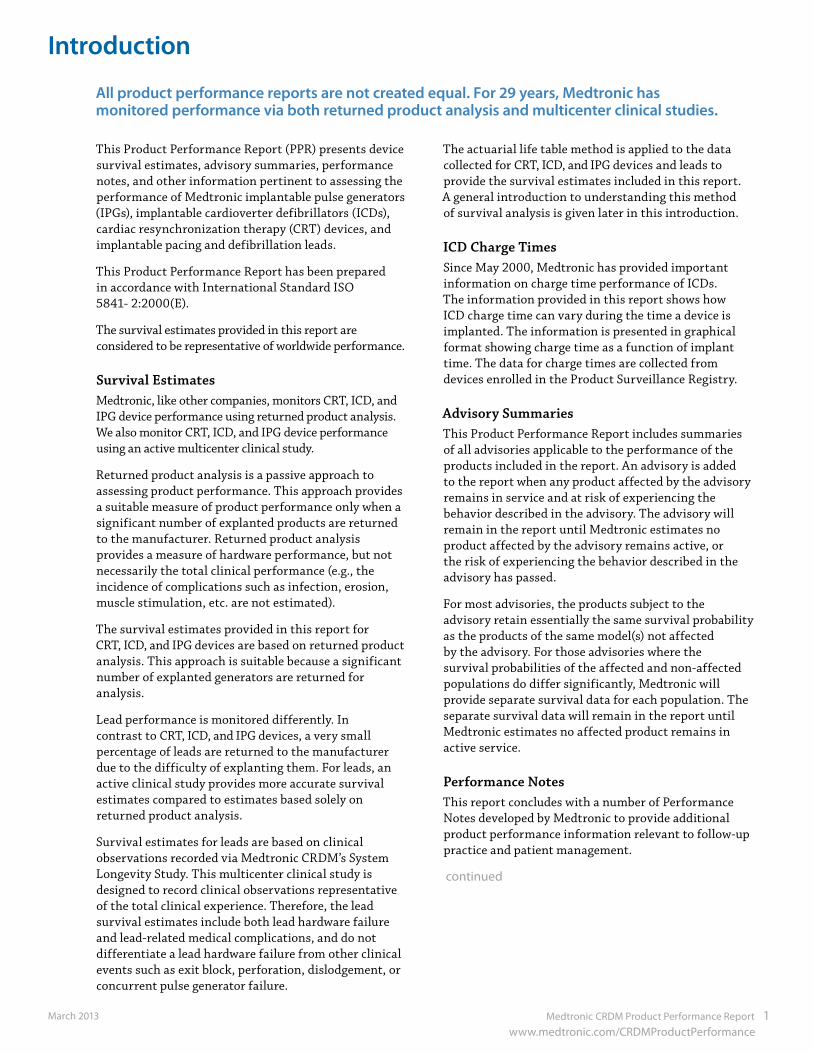
Introduction 1Method for Estimating CRT, ICD, and IPG Device Performance 6
CRT Cardiac Resynchronization Therapy 10CRT Survival Summary 18CRT Reference Chart 21
ICD Implantable Cardioverter Defibrillators 23ICD Survival Summary 36ICD Reference Chart 40ICD Connector Styles 42
IPG Implantable Pulse Generators 43IPG Survival Summary 67IPG Reference Chart 74
LeadsMethod for Estimating Lead Performance 77
Left-Heart Leads 82 Lead Survival Summary 86US Returned Product Analysis Summary 86US Reports of Acute Lead Observations 86Reference Chart 87
Defibrillation Leads 88 Lead Survival Summary 96US Returned Product Analysis Summary 97US Reports of Acute Lead Observations 97Reference Chart 98
Pacing Leads 99Lead Survival Summary 119US Returned Product Analysis Summary 122US Reports of Acute Lead Observations 123Reference Chart 124
ICD and CRT-D Charge Time Performance 131
Advisories 139(in order of communication date, from most recent to oldest)
Performance Notes 149Dual Chamber Pacemakers with Measurement Lock-up ERI Kappa 600, 700, 800, 900, EnPulse, Adapta, Versa, Sensia, Relia, and Vitatron Models E50A1, E60A1, and G70A1 149Helix Retraction of the Sprint Quattro Secure S 6935 and Sprint Quattro Secure 6947 150Potential Malfunction of CRT, ICD, and IPG Products due to Anomalies in MOSFET Integrated Circuit Technology 151Clinical Management of VCM near Elective Replacement 152 Ensuring the Accuracy of Battery Longevity Estimates 153 AT500 Pacing System Follow-Up Protocol 154Insertion of the Lead into the Device 155GEM II DR/VR and GEM III DR/VR/AT ICD Battery Discharge Behavior 156General Follow-Up and Replacement of ICD Leads 157Clinical Management of High-Voltage Lead System Oversensing 158Tests and Observations for Clinical Assessment of Chronic Pacing Leads 159
2013 First Edition Issue 68
Epi/Myocardial Pacing Leads 125Lead Survival Summary 127US Returned Product Analysis Summary 128US Reports of Acute Lead Observations 128Reference Chart 128
VDD Single Pass Pacing Leads 129Lead Survival Summary 130US Returned Product Analysis Summary 130US Reports of Acute Lead Observations 130Reference Chart 130
Date cutoff for this editionis March 12, 2013 for devicesand February 1, 2013 for PSRleads data
This report is available online at www.medtronic.com/CRDM ProductPerformance
Trademarks of Medtronic, Inc.

Medtronic CRDM Product Performance Report 1 www.medtronic.com/CRDMProductPerformance
March 2013
Introduction
All product performance reports are not created equal. For 29 years, Medtronic has monitored performance via both returned product analysis and multicenter clinical studies.
This Product Performance Report (PPR) presents device survival estimates, advisory summaries, performance notes, and other information pertinent to assessing the performance of Medtronic implantable pulse generators (IPGs), implantable cardioverter defibrillators (ICDs), cardiac resynchronization therapy (CRT) devices, and implantable pacing and defibrillation leads.
This Product Performance Report has been prepared in accordance with International Standard ISO 5841- 2:2000(E).
The survival estimates provided in this report are considered to be representative of worldwide performance.
Survival EstimatesMedtronic, like other companies, monitors CRT, ICD, and IPG device performance using returned product analysis. We also monitor CRT, ICD, and IPG device performance using an active multicenter clinical study.
Returned product analysis is a passive approach to assessing product performance. This approach provides a suitable measure of product performance only when a significant number of explanted products are returned to the manufacturer. Returned product analysis provides a measure of hardware performance, but not necessarily the total clinical performance (e.g., the incidence of complications such as infection, erosion, muscle stimulation, etc. are not estimated).
The survival estimates provided in this report for CRT, ICD, and IPG devices are based on returned product analysis. This approach is suitable because a significant number of explanted generators are returned for analysis.
Lead performance is monitored differently. In contrast to CRT, ICD, and IPG devices, a very small percentage of leads are returned to the manufacturer due to the difficulty of explanting them. For leads, an active clinical study provides more accurate survival estimates compared to estimates based solely on returned product analysis.
Survival estimates for leads are based on clinical observations recorded via Medtronic CRDM’s System Longevity Study. This multicenter clinical study is designed to record clinical observations representative of the total clinical experience. Therefore, the lead survival estimates include both lead hardware failure and lead-related medical complications, and do not differentiate a lead hardware failure from other clinical events such as exit block, perforation, dislodgement, or concurrent pulse generator failure.
The actuarial life table method is applied to the data collected for CRT, ICD, and IPG devices and leads to provide the survival estimates included in this report. A general introduction to understanding this method of survival analysis is given later in this introduction.
ICD Charge TimesSince May 2000, Medtronic has provided important information on charge time performance of ICDs. The information provided in this report shows how ICD charge time can vary during the time a device is implanted. The information is presented in graphical format showing charge time as a function of implant time. The data for charge times are collected from devices enrolled in the Product Surveillance Registry.
Advisory SummariesThis Product Performance Report includes summaries of all advisories applicable to the performance of the products included in the report. An advisory is added to the report when any product affected by the advisory remains in service and at risk of experiencing the behavior described in the advisory. The advisory will remain in the report until Medtronic estimates no product affected by the advisory remains active, or the risk of experiencing the behavior described in the advisory has passed.
For most advisories, the products subject to the advisory retain essentially the same survival probability as the products of the same model(s) not affected by the advisory. For those advisories where the survival probabilities of the affected and non-affected populations do differ significantly, Medtronic will provide separate survival data for each population. The separate survival data will remain in the report until Medtronic estimates no affected product remains in active service.
Performance NotesThis report concludes with a number of Performance Notes developed by Medtronic to provide additional product performance information relevant to follow-up practice and patient management.
continued
March 2013 2 Medtronic CRDM Product Performance Report www.medtronic.com/CRDMProductPerformance
Introduction continued
How You Can HelpMedtronic urges all physicians to return explanted products and to notify Medtronic when a product is no longer in use, regardless of the reason for explant or removal from use. The procedures for returning products vary by geographic location.
Mailer kits with prepaid US postage are available for use within the United States to send CRTs, ICDs, IPGs, and leads to Medtronic’s CRDM Returned Product Analysis Lab. These mailers are sized to accommodate the devices and leads from a single patient or clinical event and are designed to meet US postal regulations for mailing biohazard materials.
If the product being returned is located outside the United States, please contact your local Medtronic representative for instructions.
Medtronic also requests the return of explanted products from non-clinical sources, such as funeral homes, and will assume responsibility for storage and disposal of the product once received.
Mailer kits can be obtained by contacting the Returned Product Lab. For information on how to contact the Lab, refer to the Contact Information page of this report.
We continually strive to improve this CRDM Product Performance Report. In keeping with this philosophy, we ask for your suggestions on the content and format of this report, as well as any information you have regarding the performance of Medtronic products. For information on how to comment on this report, see the Contact Information page of this report.
Overview of Survival AnalysisMedtronic uses the Cutler-Ederer actuarial life table method to estimate the length of time over which devices and leads will perform within performance limits established by Medtronic. This probability to perform within performance limits over time is called the survival probability.
Devices and leads are followed until an event occurs where the device or lead ceases to operate within performance limits. The length of time from implant to the event is recorded for individual devices and leads in the population sample. The population sample for
CRT, ICD, and IPG devices is made up of patients whose devices are registered as implanted in the United States. For leads, the population sample is the patients enrolled in our multicenter, international prospective Product Surveillance Registry.
For IPGs and ICDs, the events can be normal battery depletion or a device malfunction. For leads, the events are complications as defined in the study protocol.
The actuarial life table method allows Medtronic to account for devices and leads removed from service for reasons unrelated to performance and for device and leads still in service. Devices and leads removed for reasons unrelated to performance or are still in service are said to be suspended. Examples of devices and leads removed from service for reasons unrelated to performance include: removed to upgrade the device or lead no longer in service due to the death of the patient for
reasons unrelated to the device or leads implanted in patients who are lost to follow-up
For each suspension, the device or lead has performed within performance limits for a period of time, after which its performance is unknown.
An ExampleThe following example describes the survival analysis method used to establish the survival probability estimates for Medtronic CRDM devices and leads. The example is intended to provide an overview of the analysis process. The definitions of malfunctions and complications, and other details specific to calculating device and lead survival estimates, are provided in the articles Method for Estimating CRT, ICD, and IPG Device Performance (page 6) and Method for Estimating Lead Performance (page 74).
continued
Medtronic urges all physicians to return explanted products and to notify Medtronic when a product is no longer in use, regardless of reason for explant or removal from use.
Medtronic CRDM Product Performance Report 3 www.medtronic.com/CRDMProductPerformance
March 2013
Introduction continued
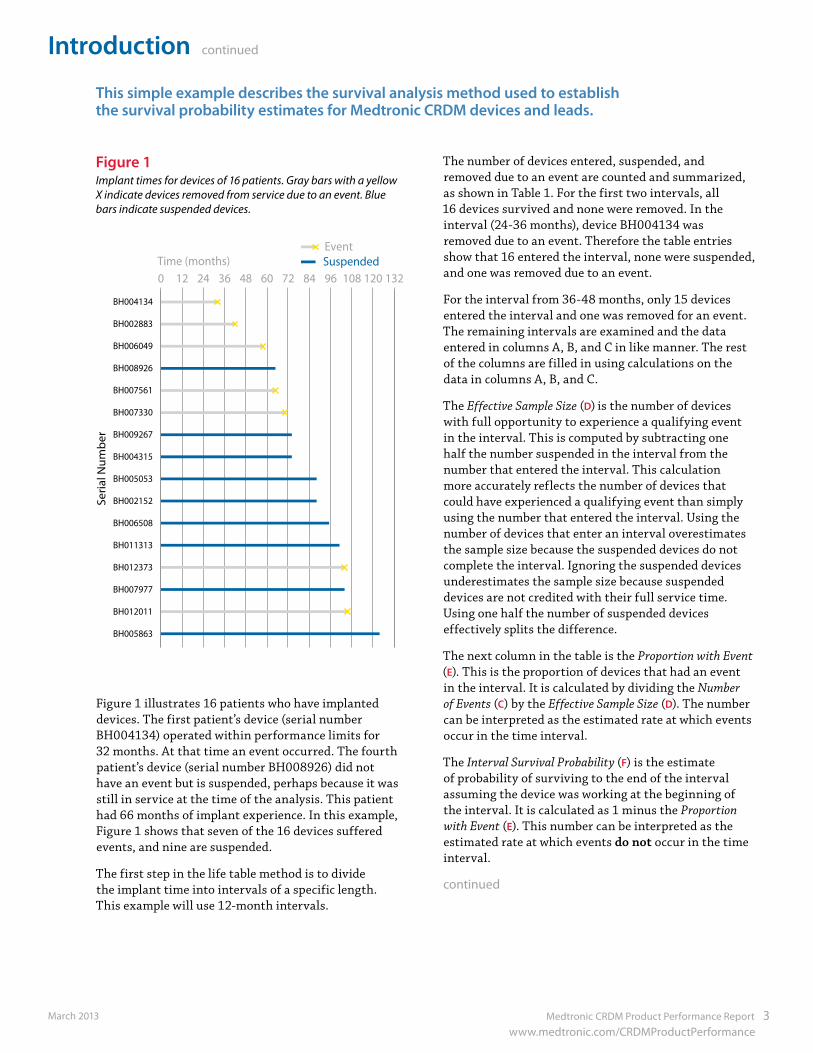
Figure 1 illustrates 16 patients who have implanted devices. The first patient’s device (serial number BH004134) operated within performance limits for 32 months. At that time an event occurred. The fourth patient’s device (serial number BH008926) did not have an event but is suspended, perhaps because it was still in service at the time of the analysis. This patient had 66 months of implant experience. In this example, Figure 1 shows that seven of the 16 devices suffered events, and nine are suspended.
The first step in the life table method is to divide the implant time into intervals of a specific length. This example will use 12-month intervals.
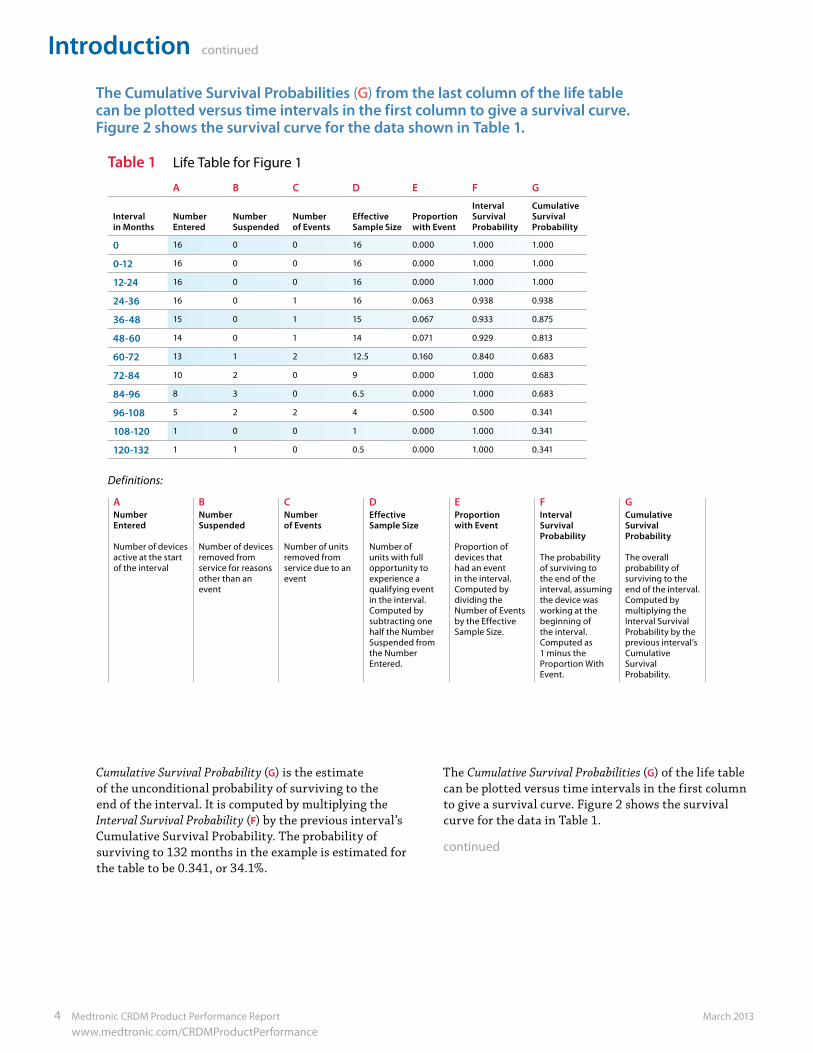
The number of devices entered, suspended, and removed due to an event are counted and summarized, as shown in Table 1. For the first two intervals, all 16 devices survived and none were removed. In the interval (24-36 months), device BH004134 was removed due to an event. Therefore the table entries show that 16 entered the interval, none were suspended, and one was removed due to an event.
For the interval from 36-48 months, only 15 devices entered the interval and one was removed for an event. The remaining intervals are examined and the data entered in columns A, B, and C in like manner. The rest of the columns are filled in using calculations on the data in columns A, B, and C.
The Effective Sample Size (D) is the number of devices with full opportunity to experience a qualifying event in the interval. This is computed by subtracting one half the number suspended in the interval from the number that entered the interval. This calculation more accurately reflects the number of devices that could have experienced a qualifying event than simply using the number that entered the interval. Using the number of devices that enter an interval overestimates the sample size because the suspended devices do not complete the interval. Ignoring the suspended devices underestimates the sample size because suspended devices are not credited with their full service time. Using one half the number of suspended devices effectively splits the difference.
The next column in the table is the Proportion with Event (E). This is the proportion of devices that had an event in the interval. It is calculated by dividing the Number of Events (C) by the Effective Sample Size (D). The number can be interpreted as the estimated rate at which events occur in the time interval.
The Interval Survival Probability (F) is the estimate of probability of surviving to the end of the interval assuming the device was working at the beginning of the interval. It is calculated as 1 minus the Proportion with Event (E). This number can be interpreted as the estimated rate at which events do not occur in the time interval.
continued
BH004134
BH002883
BH006049
BH008926
BH007561
BH007330
BH009267
BH004315
BH005053
BH002152
BH006508
BH011313
BH012373
BH007977
BH012011
BH005863
Seria
l Num
ber
Time (months)EventSuspended
0 12 24 36 48 60 72 84 96 108 120 132
This simple example describes the survival analysis method used to establish the survival probability estimates for Medtronic CRDM devices and leads.
Figure 1Implant times for devices of 16 patients. Gray bars with a yellow X indicate devices removed from service due to an event. Blue bars indicate suspended devices.
March 2013 4 Medtronic CRDM Product Performance Report www.medtronic.com/CRDMProductPerformance
Table 1 Life Table for Figure 1
A B C D E F G
Interval in Months
Number Entered
Number Suspended
Number of Events
Effective Sample Size
Proportion with Event
Interval Survival Probability
Cumulative Survival Probability
0 16 0 0 16 0.000 1.000 1.000
0-12 16 0 0 16 0.000 1.000 1.000
12-24 16 0 0 16 0.000 1.000 1.000
24-36 16 0 1 16 0.063 0.938 0.938
36-48 15 0 1 15 0.067 0.933 0.875
48-60 14 0 1 14 0.071 0.929 0.813
60-72 13 1 2 12.5 0.160 0.840 0.683
72-84 10 2 0 9 0.000 1.000 0.683
84-96 8 3 0 6.5 0.000 1.000 0.683
96-108 5 2 2 4 0.500 0.500 0.341
108-120 1 0 0 1 0.000 1.000 0.341
120-132 1 1 0 0.5 0.000 1.000 0.341
Definitions:
A B C D E F GNumber Entered
Number of devices active at the start of the interval
Number Suspended
Number of devices removed from service for reasons other than an event
Number of Events
Number of units removed from service due to an event
Effective Sample Size
Number of units with full opportunity to experience a qualifying event in the interval. Computed by subtracting one half the Number Suspended from the Number Entered.
Proportion with Event
Proportion of devices that had an event in the interval. Computed by dividing the Number of Events by the Effective Sample Size.
Interval Survival Probability
The probability of surviving to the end of the interval, assuming the device was working at the beginning of the interval. Computed as 1 minus the Proportion With Event.
Cumulative Survival Probability
The overall probability of surviving to the end of the interval. Computed by multiplying the Interval Survival Probability by the previous interval’s Cumulative Survival Probability.
Introduction continued
The Cumulative Survival Probabilities (G) from the last column of the life table
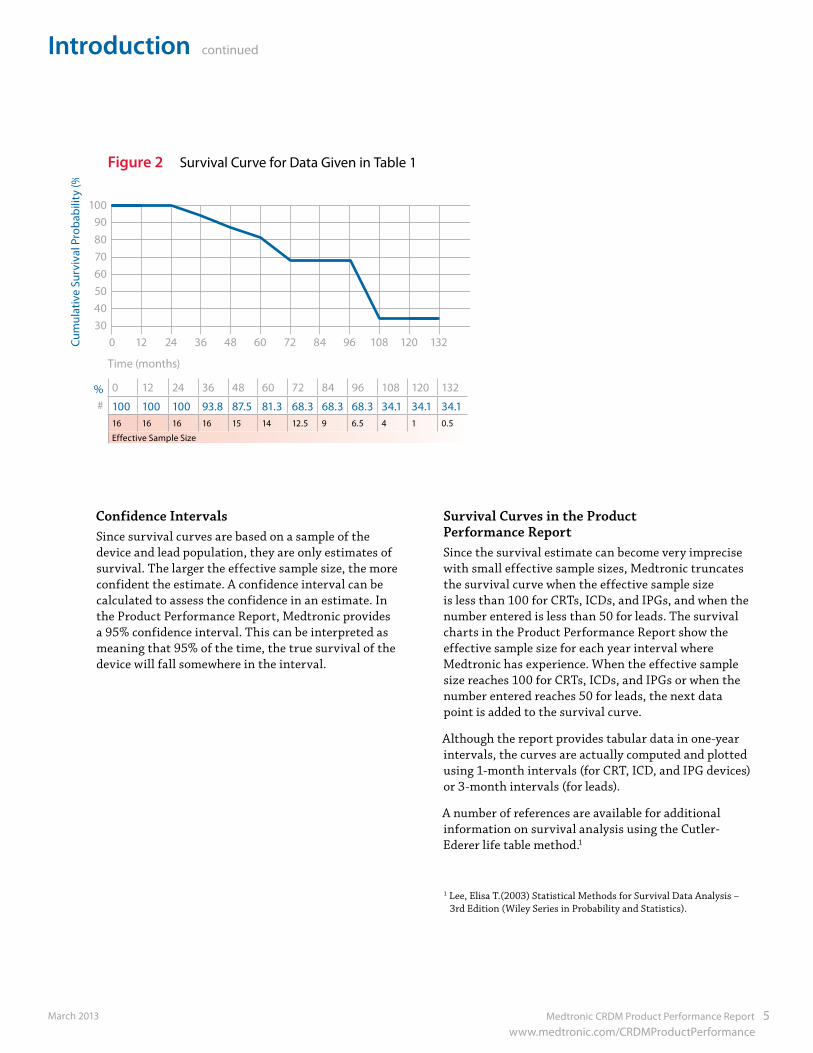
can be plotted versus time intervals in the first column to give a survival curve. Figure 2 shows the survival curve for the data shown in Table 1.
Cumulative Survival Probability (G) is the estimate of the unconditional probability of surviving to the end of the interval. It is computed by multiplying the Interval Survival Probability (F) by the previous interval’s Cumulative Survival Probability. The probability of surviving to 132 months in the example is estimated for the table to be 0.341, or 34.1%.
The Cumulative Survival Probabilities (G) of the life table can be plotted versus time intervals in the first column to give a survival curve. Figure 2 shows the survival curve for the data in Table 1.
continued
Medtronic CRDM Product Performance Report 5 www.medtronic.com/CRDMProductPerformance
March 2013
90100
807060504030
Cum
ulat
ive
Surv
ival
Pro
babi
lity
(%)
120967248240 13210884603612
Figure 2 Survival Curve for Data Given in Table 1
Time (months)
0 12 24 36 48 60 72 84 96 108 120 132
100 100 100 93.8 87.5 81.3 68.3 68.3 68.3 34.1 34.1 34.116 16 16 16 15 14 12.5 9 6.5 4 1 0.5
Effective Sample Size
%#
Confidence IntervalsSince survival curves are based on a sample of the device and lead population, they are only estimates of survival. The larger the effective sample size, the more confident the estimate. A confidence interval can be calculated to assess the confidence in an estimate. In the Product Performance Report, Medtronic provides a 95% confidence interval. This can be interpreted as meaning that 95% of the time, the true survival of the device will fall somewhere in the interval.
Survival Curves in the Product Performance ReportSince the survival estimate can become very imprecise with small effective sample sizes, Medtronic truncates the survival curve when the effective sample size is less than 100 for CRTs, ICDs, and IPGs, and when the number entered is less than 50 for leads. The survival charts in the Product Performance Report show the effective sample size for each year interval where Medtronic has experience. When the effective sample size reaches 100 for CRTs, ICDs, and IPGs or when the number entered reaches 50 for leads, the next data point is added to the survival curve.
Although the report provides tabular data in one-year intervals, the curves are actually computed and plotted using 1-month intervals (for CRT, ICD, and IPG devices) or 3-month intervals (for leads).
A number of references are available for additional information on survival analysis using the Cutler-Ederer life table method.1
1 Lee, Elisa T.(2003) Statistical Methods for Survival Data Analysis – 3rd Edition (Wiley Series in Probability and Statistics).
Introduction continued
March 2013 6 Medtronic CRDM Product Performance Report www.medtronic.com/CRDMProductPerformance
Method for Estimating CRT, ICD, and IPG Device Performance
The performance of CRT, ICD, and IPG devices is expressed in terms of device survival estimates, where “survival” refers to the function of the device, not the survival of the patient. These survival estimates are intended to illustrate the probability that a device will survive for a given number of years with neither malfunction nor battery depletion.
The survival estimates are determined from the analysis of Medtronic CRDM’s United States device registration data and US returned product analysis data. These data are presented graphically and numerically.
Because this analysis is based on returned product analysis, the performance data does not reflect any device-related medical complications such as erosion, infection, muscle stimulation, or muscle inhibition.
Categorization of Depleted and Malfunctioning Devices for Survival AnalysisFor survival estimation, every device returned to Medtronic CRDM and analyzed in the CRDM Returned Product Analysis laboratory is assigned to one of three categories. The device 1) is functioning normally, 2) has reached normal battery depletion, or 3) has malfunctioned. This categorization is combined with data from our device registry for the total number of implants and the implant durations to create the survival curves presented on the following pages.
Definition of Malfunction
Medtronic CRDM considers a device as having malfunctioned whenever the analysis shows that any parameter was outside the performance limits established by Medtronic while implanted and in service. To be considered a malfunction or battery depletion, the device must have been returned to Medtronic and analyzed.
Devices damaged after explant, damaged due to failure to heed warnings or contraindications in the labeling, or damaged due to interaction with other implanted devices (including leads) are not considered device malfunctions.
A device subject to a safety advisory is not considered to have malfunctioned unless it has been returned to Medtronic CRDM and found, through analysis, to actually have performed outside the performance limits established by Medtronic.
Not all malfunctions expose the patient to a loss of pacing or defibrillation therapy. Some malfunctions included in the following survival estimates may not have been detected at all by the physician or the patient. These malfunctions, however, are included in the survival estimates and provide important feedback to our product development organization.
To provide insight into the nature of malfunctions, each malfunction is categorized as Malfunction with Compromised Therapy Function or Malfunction without Compromised Therapy Function. A summary of these malfunctions is presented for the most recently market-released models.
For this report, Normal Battery Depletion, Malfunction with Compromised Therapy Function, and Malfunction without Compromised Therapy Function are defined as follows:
Normal Battery Depletion – The condition when:
(a) a device is returned with no associated complaint and the device has reached its elective replacement indicator(s) with implant time that meets or exceeds the nominal (50 percentile) predicted longevity at default (labeled) settings, or
(b) a device is returned and the device has reached its elective replacement indicator(s) with implant time exceeding 80% of the expected longevity calculated using the available device setting information.
Medtronic CRDM establishes expected longevity by statistically characterizing the power consumed by the device and the power available from the device battery. This characterization is applied to a number of parameter configurations to derive a statistical mean longevity value and standard deviation for each parameter configuration. The statistical mean value minus three standard deviations is used as the expected longevity for determining if a battery depleted normally.
continued
Medtronic urges all physicians to return explanted products and to notify Medtronic when a product is no longer in use, regardless of reason for explant or removal from use.
Medtronic CRDM Product Performance Report 7 www.medtronic.com/CRDMProductPerformance
March 2013
Method for Estimating CRT, ICD, and IPG Device Performance
The Standard Actuarial Method is used to estimate IPG and ICD survival. This product performance report has been prepared in accordance with International Standard ISO 5841-2:2000(E).
For reference purposes, the following pages include estimated longevities for each model. The actual longevity achieved for any device while implanted will depend on the actual programmed parameters and patient factors, and may differ significantly from these estimates.
Malfunction with Compromised Therapy Function
The condition when a device is found to have malfunctioned in a manner that compromised pacing or defibrillation therapy (including complete loss or partial degradation), while implanted and in service, as confirmed by returned product analysis.
Examples: Sudden loss of battery voltage; accelerated current drain such that low battery was not detected before loss of therapy; sudden malfunction during defibrillation therapy resulting in aborted delivery of therapy, intermittent malfunction where therapy is compromised while in the malfunction state.
Malfunction without Compromised Therapy Function
The condition when a device is found to have malfunctioned in a manner that did not compromise pacing or defibrillation therapy, while implanted and in service, as confirmed by returned product analysis.
Examples: Error affecting diagnostic functions, telemetry function, data storage; malfunction of a component that causes battery to lose power quickly enough to cause premature battery depletion, but slowly enough that the condition is detected through normal follow-up before therapy is lost; mechanical problems with connector header that do not affect therapy.
Expanded Malfunction DetailThe malfunctions are further divided into categories that identify the subject area of the malfunction. The malfunctions are divided into the following subject areas:
Electrical Component – Findings linked to electrical components such as integrated circuits, resistors, capacitors, diodes, etc.
Electrical Interconnect – Findings linked to the connections between electrical components such as wires, solder joints, wire bonds, etc.
Battery – Findings linked to the battery and its components
Software/Firmware – Findings linked to software or firmware function
Possible Early Battery Depletion – Findings where the actual reported implant time is less than 80% of the expected longevity calculated using the available device setting information with no device malfunction observed. There may not be sufficient device setting information to determine conclusively if battery depletion was normal or premature in the absence of a specific root cause finding. However, returned devices meeting the above criteria are conservatively classified as Possible Early Battery Depletion malfunctions.
Other – Findings related to other components such as insulators, grommets, setscrews, and packaging, and findings where analysis is inconclusive
Returned Product Analysis ProcessAnalysis of returned product is performed according to written procedures. These procedures determine the minimum analysis required. The analysis required varies depending on the type of device, age of the device, the associated information received with the device, actual experience with models of similar design, and other factors. Additional analysis is performed as necessary to investigate a performance concern from a customer, or to collect specific reliability data.
When a device is returned with a performance concern from a customer, the general analysis process includes a preliminary analysis of the device in its as-received condition, followed by an automated functional test using test equipment equivalent to the equipment used in manufacturing.
When a malfunction is identified, failure analysis is performed to provide the detailed information necessary to investigate possible causes and actions. Medtronic CRDM maintains in-house expertise and performs its failure analysis using facilities it owns and supports. This capability permits detailed failure analysis.
continued
continued
March 2013 8 Medtronic CRDM Product Performance Report www.medtronic.com/CRDMProductPerformance
Method for Estimating CRT, ICD, and IPG Device Performance
Medtronic CRDM adjusts all-cause survival estimates to account for underreporting. While this lowers our all-cause survival estimates, we feel it gives a more accurate perspective on real performance.
Statistical Methods for Survival AnalysisOf the several different statistical methods available for survival analysis, the Standard Actuarial Method, with suspensions assumed distributed evenly within the intervals (Cutler-Ederer Method), is used to determine estimates of IPG and ICD survival. This method is commonly used by medical researchers and clinicians.
Implant times are calculated from the implant date to the earlier of the explant date or the cutoff date of the report. From this data an estimate of the probability of device survival is calculated at each monthly interval.
On the following pages, each graph includes a survival curve where events include malfunctions and normal battery depletions. This survival curve is a good representation of the probability a device will survive a period of time without malfunction and without battery depletion. For example, if a device survival probability is 95% after 5 years of service, then the device has a 5% chance of being removed due to battery depletion or malfunction in the first 5 years following implant.
In addition, a second curve is included to show survival excluding normal battery depletion. This curve is a good representation of the probability for a device to survive without malfunction. This curve includes only malfunctions as events and excludes normal battery depletion.
Since the survival estimate can become very imprecise with small effective sample sizes, Medtronic truncates the survival curve when the effective sample size is less than 100 for CRT, ICD, and IPG devices. The survival charts in the Product Performance Report show the effective sample size for each year interval where we have experience. When the effective sample size reaches 100, the next data point is added to the survival curve.
Although the report provides tabular data in one-year intervals, the curves are actually computed and plotted using one-month intervals.
The data in the tables are rounded to the nearest tenth of one percent. Occasionally, a graph may show 100% survival, but have one or more malfunctions or battery depletions. This occurs because, even with the malfunctions or battery depletions, the data rounds to 100%.
The survival curves are statistical estimates. As performance experience accumulates, the estimation improves. Confidence intervals are provided as a way to indicate the degree of certainty of the estimates.
Greenwood’s formula is used to calculate corresponding 95% confidence intervals for the standard errors, and the complementary log-log method is used to produce the confidence bounds.
Sample Size and How the Population and Population Samples Are DefinedThe population sample from which the survival estimates are derived is comprised of the devices registered as implanted in the United States as of the report cutoff date. The number of registered implants, as well as an estimate of the number that remain in active service, is listed for each model. To be included in the population, the device must have been registered with Medtronic’s registration system and implanted for at least one day.
This sample based on US implants is considered to be representative of the worldwide population, and therefore the survival estimates shown in this report should be representative of the performance worldwide of these models.
A CRT, ICD, or IPG model or model family will be included in this report when it has accumulated at least 10,000 implant months and will remain in the report as long as at least 500 devices remain active.
Methods Used to Adjust for Underreporting of Malfunction and Battery DepletionThe tables on the following pages show the actual number of malfunctions and battery depletions recorded by the analysis lab for US registered devices. Since not all devices are returned to Medtronic CRDM for analysis, these numbers underestimate the true number of malfunctions and battery depletions. To more accurately estimate the all-cause device survival probabilities, the number of malfunctions and battery depletions used to plot each interval of the all-cause survival curves is adjusted (multiplied) by a factor that is based on an estimate of the magnitude of underreporting. The magnitude of underreporting is estimated by analyzing experience in Medtronic’s Device And Registrant Tracking (DART) system.
The DART system is an important element of Medtronic’s Quality System. The DART system is designed to meet or exceed the US FDA’s device tracking requirements set forth by the Safe Medical Devices Act. In the United States, over 98% of Medtronic’s CRT, ICD, and IPG implants become registered in the DART system.continued
continued
Medtronic CRDM Product Performance Report 9 www.medtronic.com/CRDMProductPerformance
March 2013
Because pacemakers do not cure the patient’s underlying health problem, when a pacemaker stops functioning (due to either normal battery replacement or malfunction) it is replaced with a new pacemaker. Therefore, the replacement recorded in the DART system is a good indication that the previous pacemaker experienced either battery depletion or malfunction. The fraction of replaced devices that are subsequently returned can be used to estimate the correction factor for the under reporting of the combination of battery depletion and malfunction.
Note that devices of patients who have expired do not factor into the calculation of the correction. It is possible some proportion of these device experienced battery depletion or malfunction. Since these are not counted into the correction factor based on the return rate of replaced devices, a correction factor based only on the return rate of replaced devices may still underestimate the true rate of battery depletion and malfunction. However, devices that are replaced because the patient is receiving a system upgrade or are removed because the patient no longer needs it (e.g., due to heart transplant) do contribute to the calculation of the correction factor and therefore impart an opposite bias.
Also note that this method of calculating the correction factor cannot distinguish between devices that are removed due to malfunction and those due to normal battery depletion. It might seem intuitive that devices that unexpectedly malfunction should be much more likely to be returned to the manufacturer than a device with ordinary normal battery depletion. But this has not been conclusively demonstrated. Therefore, this method only provides a correction factor reflecting the combination of battery depletion and malfunction.
No adjustment for underreporting is applied to the malfunction-free survival curve because a method for estimating malfunction-only underreporting has not been developed.
Adjustments to Registered Implants to Compensate for Unreported Devices Removed from ServiceDevices are at times removed from service for reasons other than device malfunction or battery depletion. Examples are devices removed from service due to non-device related patient mortality and devices removed due to changes in the patient’s medical condition. Because an accurate estimate of device survival depends on an accurate estimate of the number of devices in service, it is important not to overstate the number of devices in service.
To ensure the number of devices in service is not overstated, Medtronic addresses this underreporting in two ways. Regular updates obtained from the Social Security Administration about deceased persons is used to update Medtronic’s DART data about patients who have died but whose deaths had not been reported to Medtronic. In addition, the patient mortality rate derived from our DART system is monitored and compared to published mortality rates for comparable patient populations. If, during calculation of the survival curves, the patient mortality indicated by the data in DART is significantly different from published rates, an adjustment is applied to correct the difference.
Method for Estimating CRT, ICD, and IPG Device Performance
Inde
xIC
D C
harg
e Ti
mes
Lead
sIP
GIC
DCR
Tcontinued
CRT Cardiac Resynchronization Therapy
Source: Medtronic Device Registration and Returned Product Analysis Data as of March 12, 2013
10 Medtronic CRDM Product Performance Report www.medtronic.com/CRDMProductPerformance
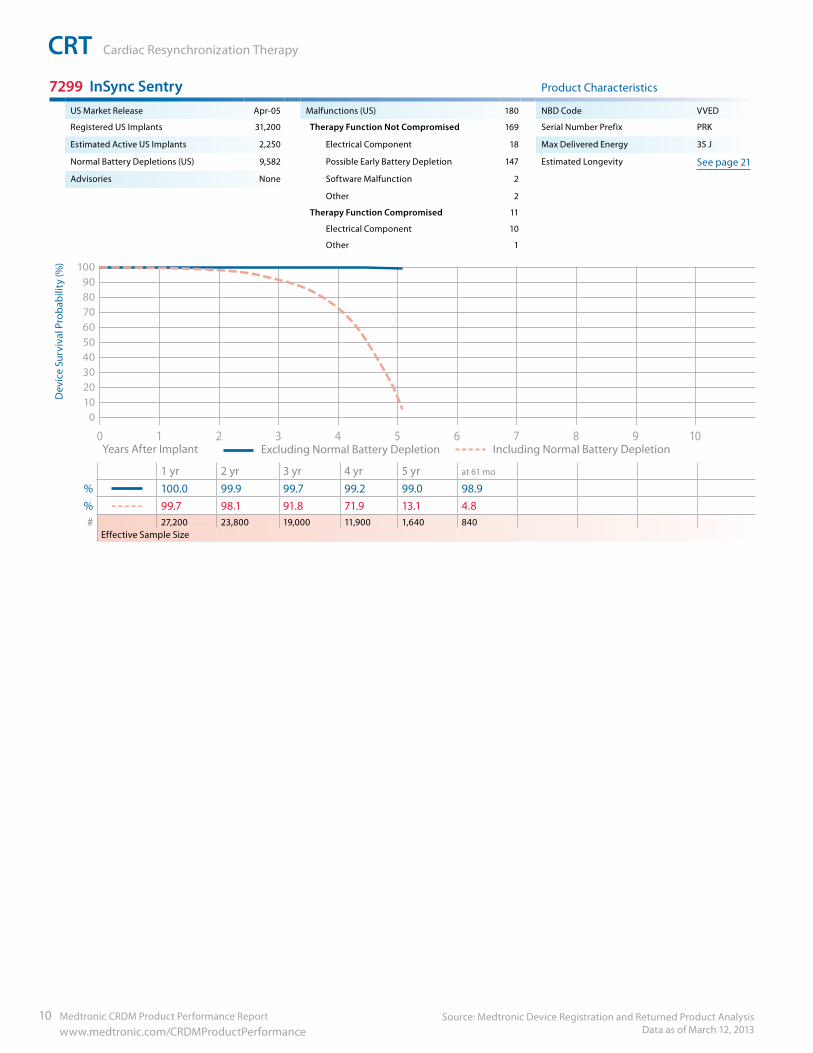
7299 InSync Sentry Product Characteristics
US Market Release Apr-05 Malfunctions (US) 180 NBD Code VVED
Registered US Implants 31,200 Therapy Function Not Compromised 169 Serial Number Prefix PRK
Estimated Active US Implants 2,250 Electrical Component 18 Max Delivered Energy 35 J
Normal Battery Depletions (US) 9,582 Possible Early Battery Depletion 147 Estimated Longevity See page 21
Advisories None Software Malfunction 2
Other 2
Therapy Function Compromised 11
Electrical Component 10
Other 1
90100
8070605040302010
0
109876543210 Years After Implant Excluding Normal Battery Depletion Including Normal Battery Depletion
1 yr 2 yr 3 yr 4 yr 5 yr at 61 mo
% 100.0 99.9 99.7 99.2 99.0 98.9% 99.7 98.1 91.8 71.9 13.1 4.8# 27,200 23,800 19,000 11,900 1,640 840
Effective Sample Size
Dev
ice
Surv
ival
Pro
babi
lity
(%)
Medtronic CRDM Product Performance Report 11 www.medtronic.com/CRDMProductPerformance
CRT Cardiac Resynchronization Therapy, continued
Source: Medtronic Device Registration and Returned Product Analysis Data as of March 12, 2013
CRT
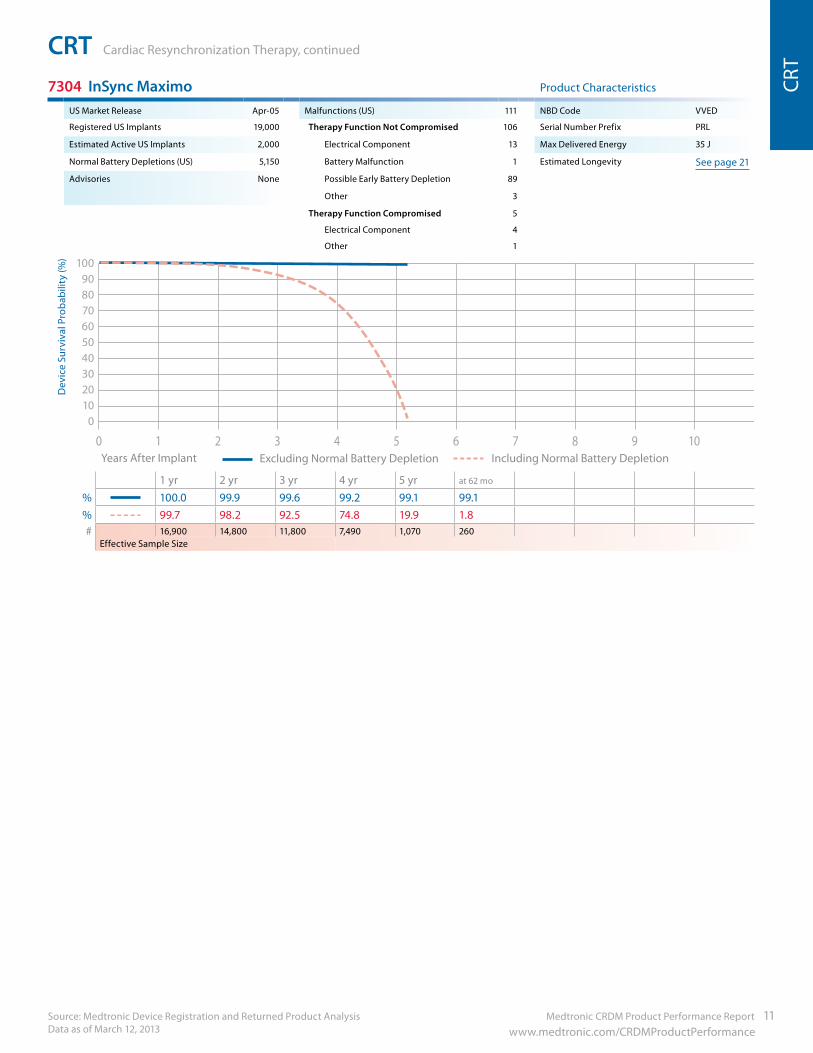
7304 InSync Maximo Product Characteristics
US Market Release Apr-05 Malfunctions (US) 111 NBD Code VVED
Registered US Implants 19,000 Therapy Function Not Compromised 106 Serial Number Prefix PRL
Estimated Active US Implants 2,000 Electrical Component 13 Max Delivered Energy 35 J
Normal Battery Depletions (US) 5,150 Battery Malfunction 1 Estimated Longevity See page 21
Advisories None Possible Early Battery Depletion 89
Other 3
Therapy Function Compromised 5
Electrical Component 4
Other 1
Survival Estimate of InSync II Marquis 7289 Jan 2009 109876543210
90100
8070605040302010
0
Years After Implant Excluding Normal Battery Depletion Including Normal Battery Depletion
1 yr 2 yr 3 yr 4 yr 5 yr at 62 mo
% 100.0 99.9 99.6 99.2 99.1 99.1% 99.7 98.2 92.5 74.8 19.9 1.8# 16,900 14,800 11,800 7,490 1,070 260
Effective Sample Size
Dev
ice
Surv
ival
Pro
babi
lity
(%)
Source: Medtronic Device Registration and Returned Product Analysis Data as of March 12, 2013
CRT Cardiac Resynchronization Therapy, continued
12 Medtronic CRDM Product Performance Report www.medtronic.com/CRDMProductPerformance
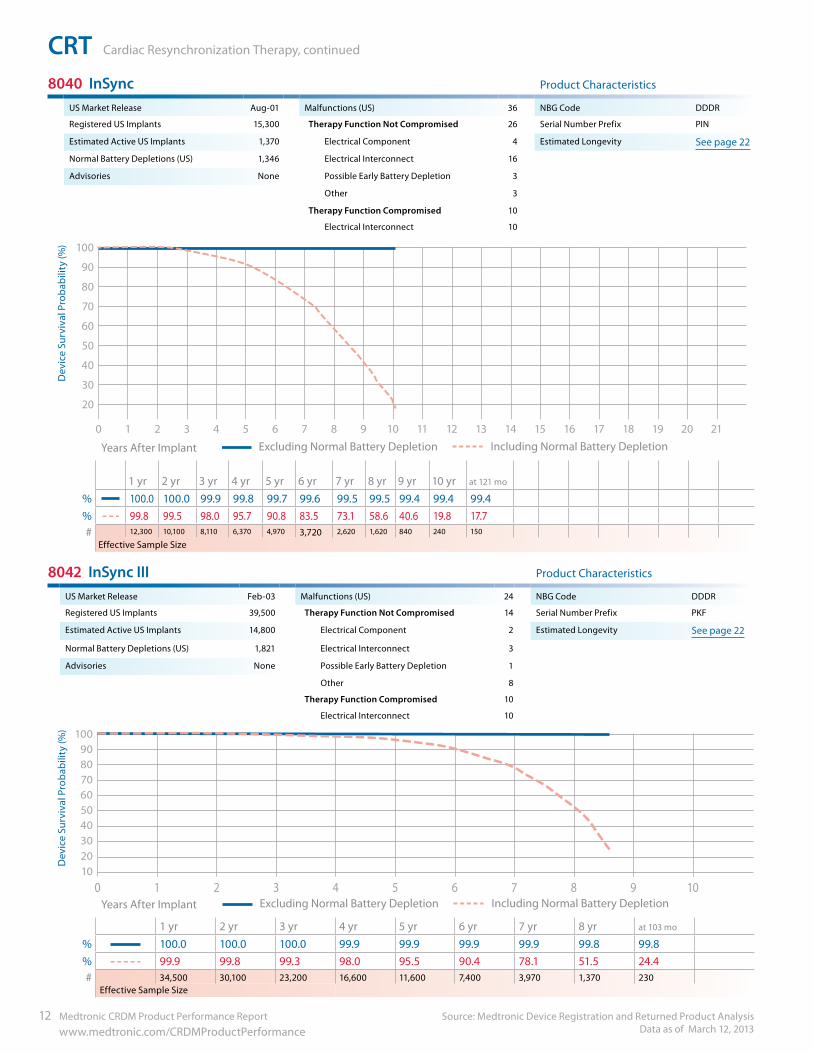
8040 InSync Product Characteristics
US Market Release Aug-01 Malfunctions (US) 36 NBG Code DDDR
Registered US Implants 15,300 Therapy Function Not Compromised 26 Serial Number Prefix PIN
Estimated Active US Implants 1,370 Electrical Component 4 Estimated Longevity See page 22
Normal Battery Depletions (US) 1,346 Electrical Interconnect 16
Advisories None Possible Early Battery Depletion 3
Other 3
Therapy Function Compromised 10
Electrical Interconnect 10
10
0
90
100
80
70
60
50
40
30
20
20181614121086420 21191715131197531
Years After Implant Excluding Normal Battery Depletion Including Normal Battery Depletion
1 yr 2 yr 3 yr 4 yr 5 yr 6 yr 7 yr 8 yr 9 yr 10 yr at 121 mo
% 100.0 100.0 99.9 99.8 99.7 99.6 99.5 99.5 99.4 99.4 99.4% 99.8 99.5 98.0 95.7 90.8 83.5 73.1 58.6 40.6 19.8 17.7# 12,300 10,100 8,110 6,370 4,970 3,720 2,620 1,620 840 240 150
Effective Sample Size
8042 InSync III Product Characteristics
US Market Release Feb-03 Malfunctions (US) 24 NBG Code DDDR
Registered US Implants 39,500 Therapy Function Not Compromised 14 Serial Number Prefix PKF
Estimated Active US Implants 14,800 Electrical Component 2 Estimated Longevity See page 22
Normal Battery Depletions (US) 1,821 Electrical Interconnect 3
Advisories None Possible Early Battery Depletion 1
Other 8
Therapy Function Compromised 10
Electrical Interconnect 10
109876543210
90100
8070605040302010
Years After Implant Excluding Normal Battery Depletion Including Normal Battery Depletion
1 yr 2 yr 3 yr 4 yr 5 yr 6 yr 7 yr 8 yr at 103 mo
% 100.0 100.0 100.0 99.9 99.9 99.9 99.9 99.8 99.8% 99.9 99.8 99.3 98.0 95.5 90.4 78.1 51.5 24.4# 34,500 30,100 23,200 16,600 11,600 7,400 3,970 1,370 230
Effective Sample Size
Dev
ice
Surv
ival
Pro
babi
lity
(%)
Dev
ice
Surv
ival
Pro
babi
lity
(%)
Medtronic CRDM Product Performance Report 13 www.medtronic.com/CRDMProductPerformance
CRT Cardiac Resynchronization Therapy, continued
Source: Medtronic Device Registration and Returned Product Analysis Data as of March 12, 2013
CRT
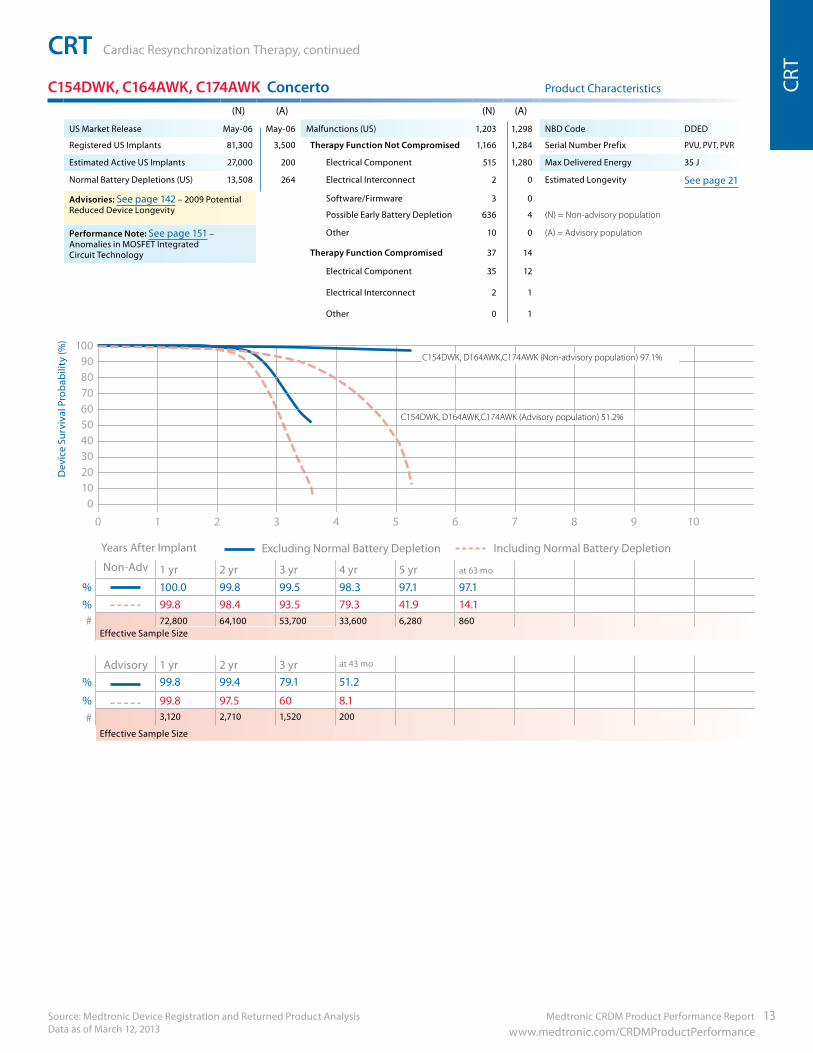
C154DWK, C164AWK, C174AWK Concerto Product Characteristics
(N) (A) (N) (A)
US Market Release May-06 May-06 Malfunctions (US) 1,203 1,298 NBD Code DDED
Registered US Implants 81,300 3,500 Therapy Function Not Compromised 1,166 1,284 Serial Number Prefix PVU, PVT, PVR
Estimated Active US Implants 27,000 200 Electrical Component 515 1,280 Max Delivered Energy 35 J
Normal Battery Depletions (US) 13,508 264 Electrical Interconnect 2 0 Estimated Longevity See page 21
Advisories: See page 142 – 2009 Potential Reduced Device Longevity
Software/Firmware 3 0
Possible Early Battery Depletion 636 4 (N) = Non-advisory population
Performance Note: See page 151 – Anomalies in MOSFET Integrated Circuit Technology
Other 10 0 (A) = Advisory population
Therapy Function Compromised 37 14
Electrical Component 35 12
Electrical Interconnect 2 1
Other 0 1
90100
8070605040302010
0
109876543210
Years After Implant Excluding Normal Battery Depletion Including Normal Battery Depletion
Non-Adv 1 yr 2 yr 3 yr 4 yr 5 yr at 63 mo
% 100.0 99.8 99.5 98.3 97.1 97.1% 99.8 98.4 93.5 79.3 41.9 14.1# 72,800 64,100 53,700 33,600 6,280 860
Effective Sample Size
Advisory 1 yr 2 yr 3 yr at 43 mo
% 99.8 99.4 79.1 51.2
% 99.8 97.5 60 8.1# 3,120 2,710 1,520 200
Effective Sample Size
Dev
ice
Surv
ival
Pro
babi
lity
(%)
C154DWK, D164AWK,C174AWK (Non-advisory population) 97.1%
C154DWK, D164AWK,C174AWK (Advisory population) 51.2%
Source: Medtronic Device Registration and Returned Product Analysis Data as of March 12, 2013
CRT Cardiac Resynchronization Therapy, continued
14 Medtronic CRDM Product Performance Report www.medtronic.com/CRDMProductPerformance
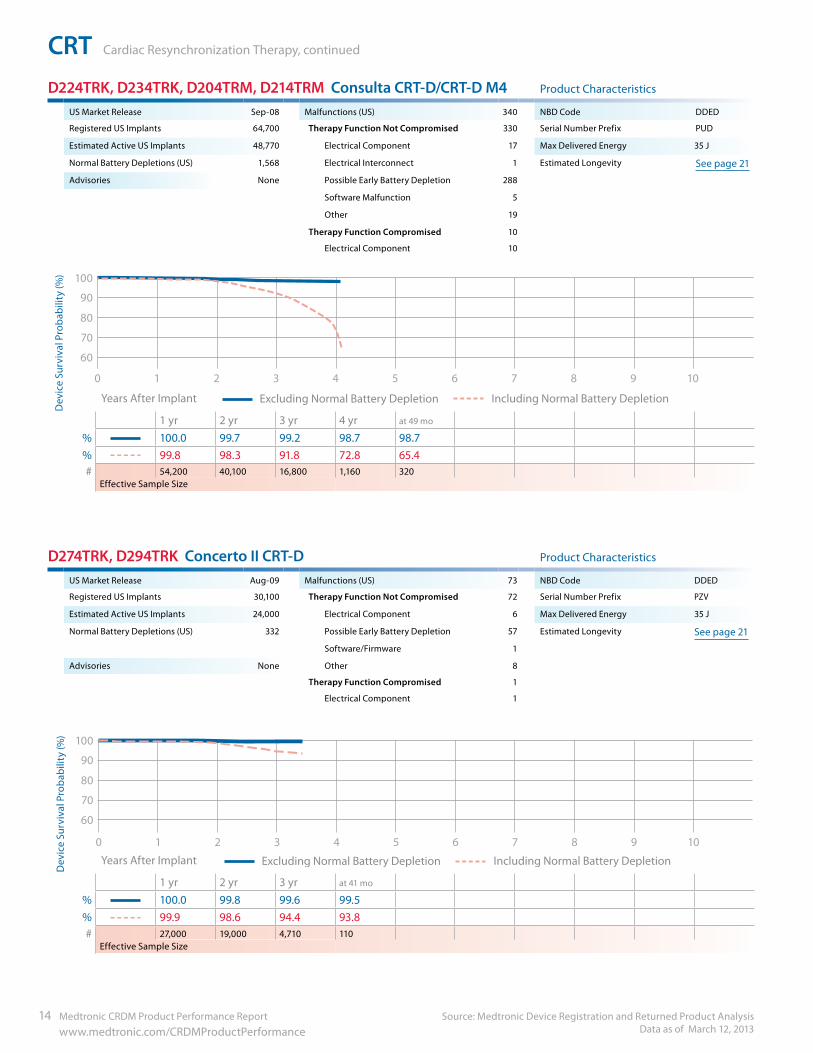
D224TRK, D234TRK, D204TRM, D214TRM Consulta CRT-D/CRT-D M4 Product Characteristics
US Market Release Sep-08 Malfunctions (US) 340 NBD Code DDED
Registered US Implants 64,700 Therapy Function Not Compromised 330 Serial Number Prefix PUD
Estimated Active US Implants 48,770 Electrical Component 17 Max Delivered Energy 35 J
Normal Battery Depletions (US) 1,568 Electrical Interconnect 1 Estimated Longevity See page 21
Advisories None Possible Early Battery Depletion 288
Software Malfunction 5
Other 19
Therapy Function Compromised 10
Electrical Component 10
90
100
80
70
60
50
40
30
20
10
109876543210
Years After Implant Excluding Normal Battery Depletion Including Normal Battery Depletion
1 yr 2 yr 3 yr 4 yr at 49 mo
% 100.0 99.7 99.2 98.7 98.7% 99.8 98.3 91.8 72.8 65.4# 54,200 40,100 16,800 1,160 320
Effective Sample Size
D274TRK, D294TRK Concerto II CRT-D Product Characteristics
US Market Release Aug-09 Malfunctions (US) 73 NBD Code DDED
Registered US Implants 30,100 Therapy Function Not Compromised 72 Serial Number Prefix PZV
Estimated Active US Implants 24,000 Electrical Component 6 Max Delivered Energy 35 J
Normal Battery Depletions (US) 332 Possible Early Battery Depletion
Software/Firmware
57
1
Estimated Longevity See page 21
Advisories None Other 8
Therapy Function Compromised 1
Electrical Component 1
90
100
80
70
60
50
40
30
20
10
109876543210
Years After Implant Excluding Normal Battery Depletion Including Normal Battery Depletion
1 yr 2 yr 3 yr at 41 mo
% 100.0 99.8 99.6 99.5% 99.9 98.6 94.4 93.8# 27,000 19,000 4,710 110
Effective Sample Size
Dev
ice
Surv
ival
Pro
babi
lity
(%)
Dev
ice
Surv
ival
Pro
babi
lity
(%)
Medtronic CRDM Product Performance Report 15 www.medtronic.com/CRDMProductPerformance
CRT Cardiac Resynchronization Therapy, continued
Source: Medtronic Device Registration and Returned Product Analysis Data as of March 12, 2013
CRT
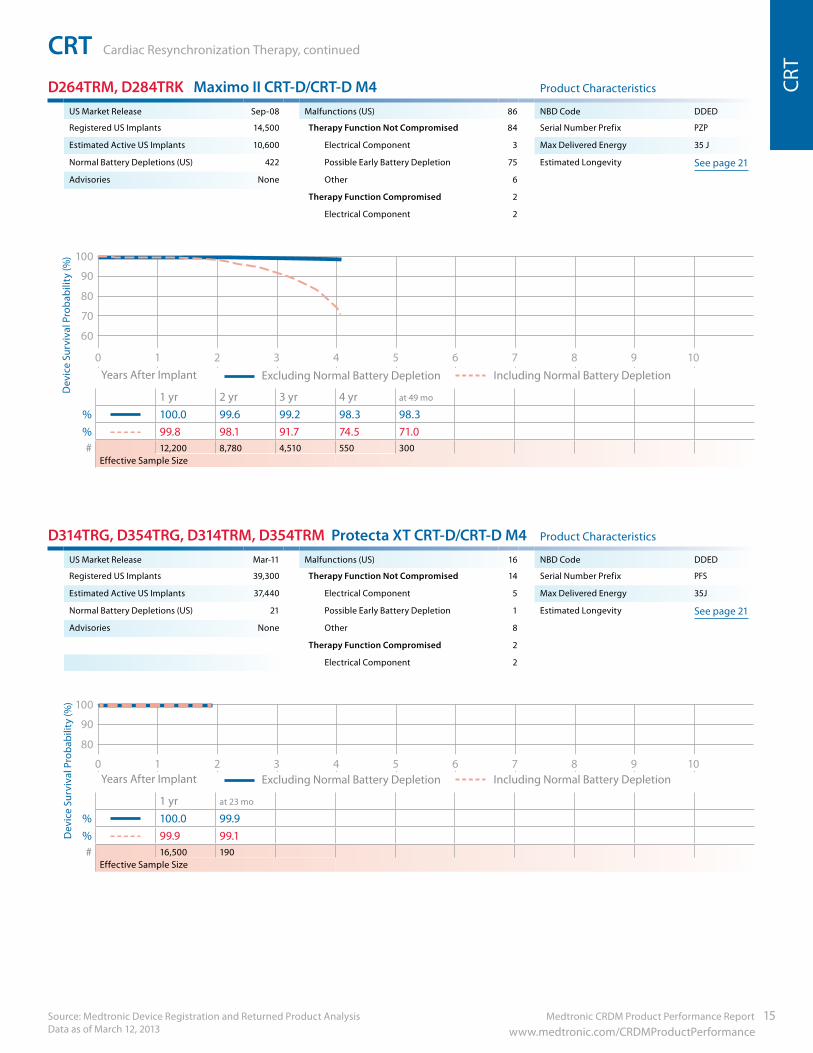
D264TRM, D284TRK Maximo II CRT-D/CRT-D M4 Product Characteristics
US Market Release Sep-08 Malfunctions (US) 86 NBD Code DDED
Registered US Implants 14,500 Therapy Function Not Compromised 84 Serial Number Prefix PZP
Estimated Active US Implants 10,600 Electrical Component 3 Max Delivered Energy 35 J
Normal Battery Depletions (US) 422 Possible Early Battery Depletion 75 Estimated Longevity See page 21
Advisories None Other 6
Therapy Function Compromised 2
Electrical Component 2
90
100
80
70
60
50
40
30
20
10
109876543210 Years After Implant Excluding Normal Battery Depletion Including Normal Battery Depletion
1 yr 2 yr 3 yr 4 yr at 49 mo
% 100.0 99.6 99.2 98.3 98.3% 99.8 98.1 91.7 74.5 71.0# 12,200 8,780 4,510 550 300
Effective Sample Size
D314TRG, D354TRG, D314TRM, D354TRM Protecta XT CRT-D/CRT-D M4 Product Characteristics
US Market Release Mar-11 Malfunctions (US) 16 NBD Code DDED
Registered US Implants 39,300 Therapy Function Not Compromised 14 Serial Number Prefix PFS
Estimated Active US Implants 37,440 Electrical Component 5 Max Delivered Energy 35J
Normal Battery Depletions (US) 21 Possible Early Battery Depletion 1 Estimated Longevity See page 21
Advisories None Other 8
Therapy Function Compromised 2
Electrical Component 2
90
100
80
70
60
50
40
30
109876543210 Years After Implant Excluding Normal Battery Depletion Including Normal Battery Depletion
1 yr at 23 mo
% 100.0 99.9% 99.9 99.1# 16,500 190
Effective Sample Size
Dev
ice
Surv
ival
Pro
babi
lity
(%)
Dev
ice
Surv
ival
Pro
babi
lity
(%)
Source: Medtronic Device Registration and Returned Product Analysis Data as of March 12, 2013
CRT Cardiac Resynchronization Therapy, continued
16 Medtronic CRDM Product Performance Report www.medtronic.com/CRDMProductPerformance
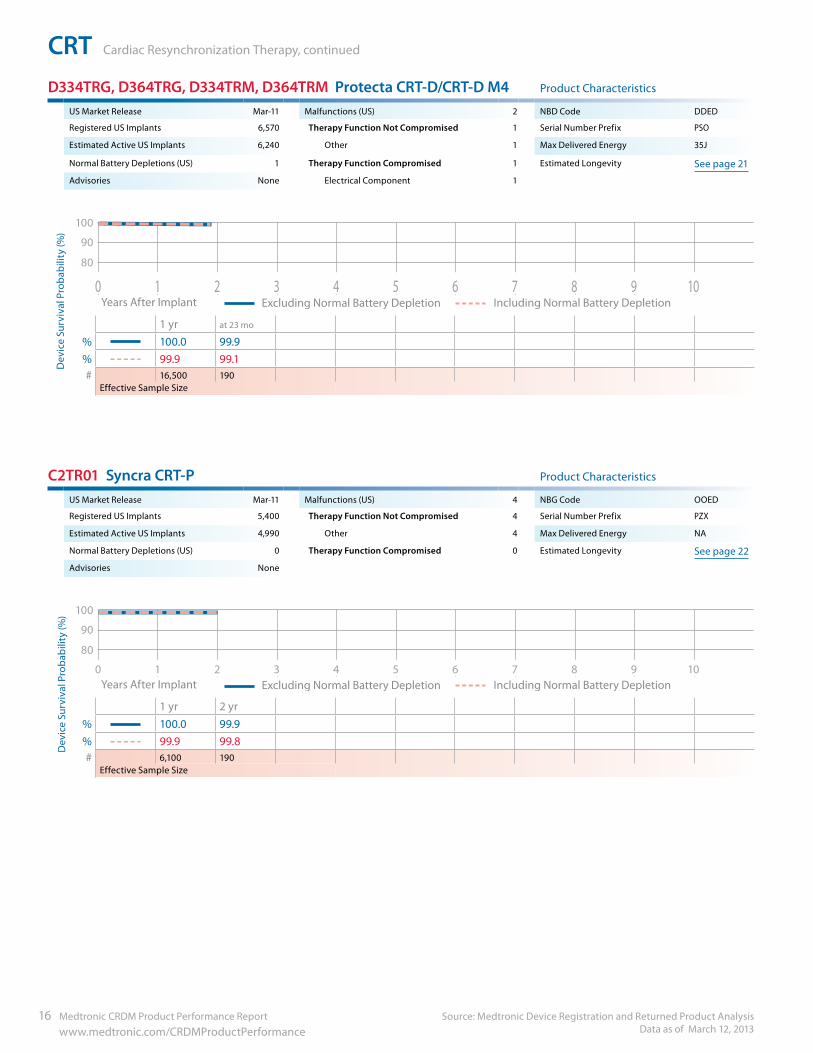
D334TRG, D364TRG, D334TRM, D364TRM Protecta CRT-D/CRT-D M4 Product Characteristics
US Market Release Mar-11 Malfunctions (US) 2 NBD Code DDED
Registered US Implants 6,570 Therapy Function Not Compromised 1 Serial Number Prefix PSO
Estimated Active US Implants 6,240 Other 1 Max Delivered Energy 35J
Normal Battery Depletions (US) 1 Therapy Function Compromised 1 Estimated Longevity See page 21
Advisories None Electrical Component 1
90
100
80
70
60
50
40
30
20
10
109876543210 Years After Implant Excluding Normal Battery Depletion Including Normal Battery Depletion
1 yr at 23 mo
% 100.0 99.9% 99.9 99.1# 16,500 190
Effective Sample Size
C2TR01 Syncra CRT-P Product Characteristics
US Market Release Mar-11 Malfunctions (US) 4 NBG Code OOED
Registered US Implants 5,400 Therapy Function Not Compromised 4 Serial Number Prefix PZX
Estimated Active US Implants 4,990 Other 4 Max Delivered Energy NA
Normal Battery Depletions (US) 0 Therapy Function Compromised 0 Estimated Longevity See page 22
Advisories None
90
100
80
70
60
50
40
30
20
10
109876543210 Years After Implant Excluding Normal Battery Depletion Including Normal Battery Depletion
1 yr 2 yr% 100.0 99.9% 99.9 99.8# 6,100 190
Effective Sample Size
Dev
ice
Surv
ival
Pro
babi
lity
(%)
Dev
ice
Surv
ival
Pro
babi
lity
(%)
Medtronic CRDM Product Performance Report 17 www.medtronic.com/CRDMProductPerformance
CRT Cardiac Resynchronization Therapy, continued
Source: Medtronic Device Registration and Returned Product Analysis Data as of March 12, 2013
CRT
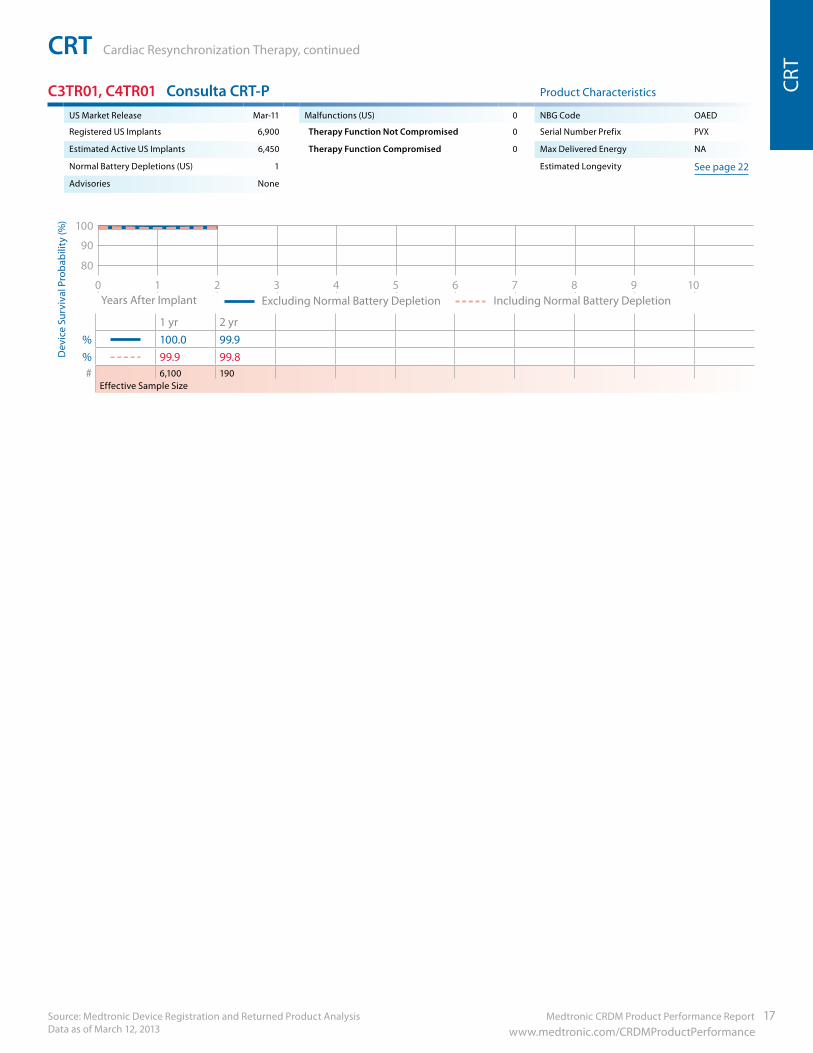
C3TR01, C4TR01 Consulta CRT-P Product Characteristics
US Market Release Mar-11 Malfunctions (US) 0 NBG Code OAED
Registered US Implants 6,900 Therapy Function Not Compromised 0 Serial Number Prefix PVX
Estimated Active US Implants 6,450 Therapy Function Compromised 0 Max Delivered Energy NA
Normal Battery Depletions (US) 1 Estimated Longevity See page 22
Advisories None
90
100
80
70
60
50
40
30
20
10
109876543210 Years After Implant Excluding Normal Battery Depletion Including Normal Battery Depletion
1 yr 2 yr% 100.0 99.9% 99.9 99.8# 6,100 190
Effective Sample Size
Dev
ice
Surv
ival
Pro
babi
lity
(%)
Source: Medtronic Device Registration and Returned Product Analysis Data as of March 12, 2013
CRT Cardiac Resynchronization Therapy, continued
18 Medtronic CRDM Product Performance Report www.medtronic.com/CRDMProductPerformance
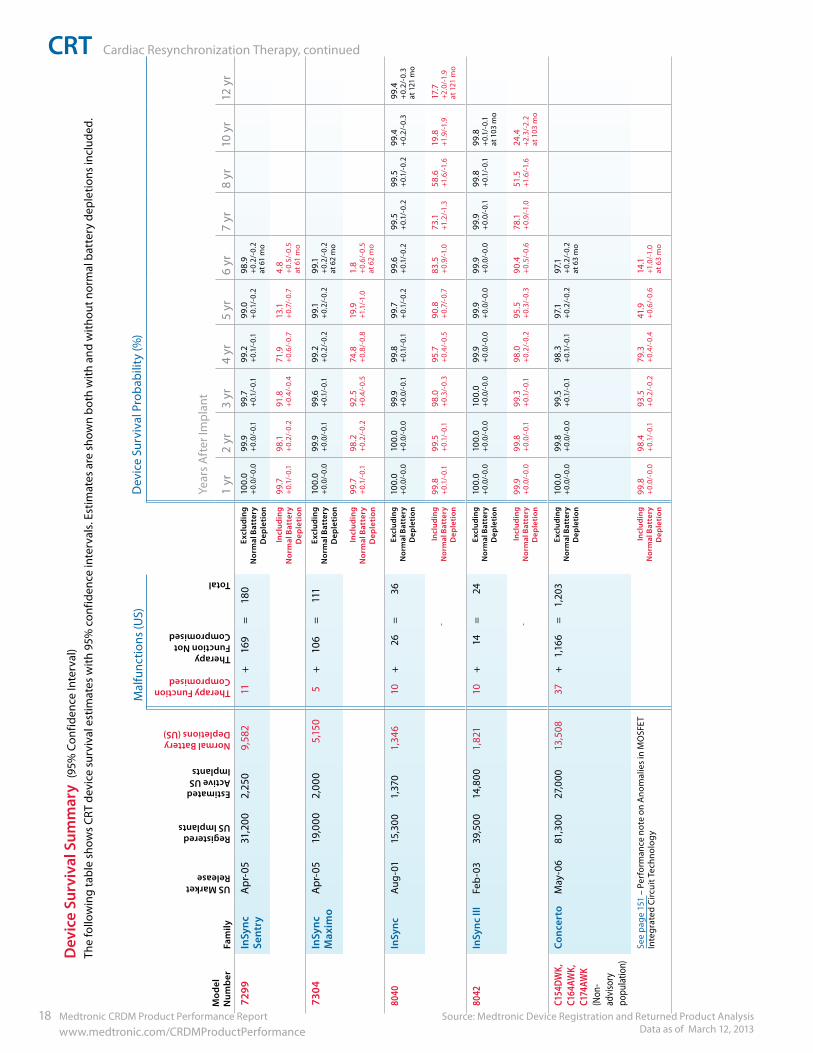
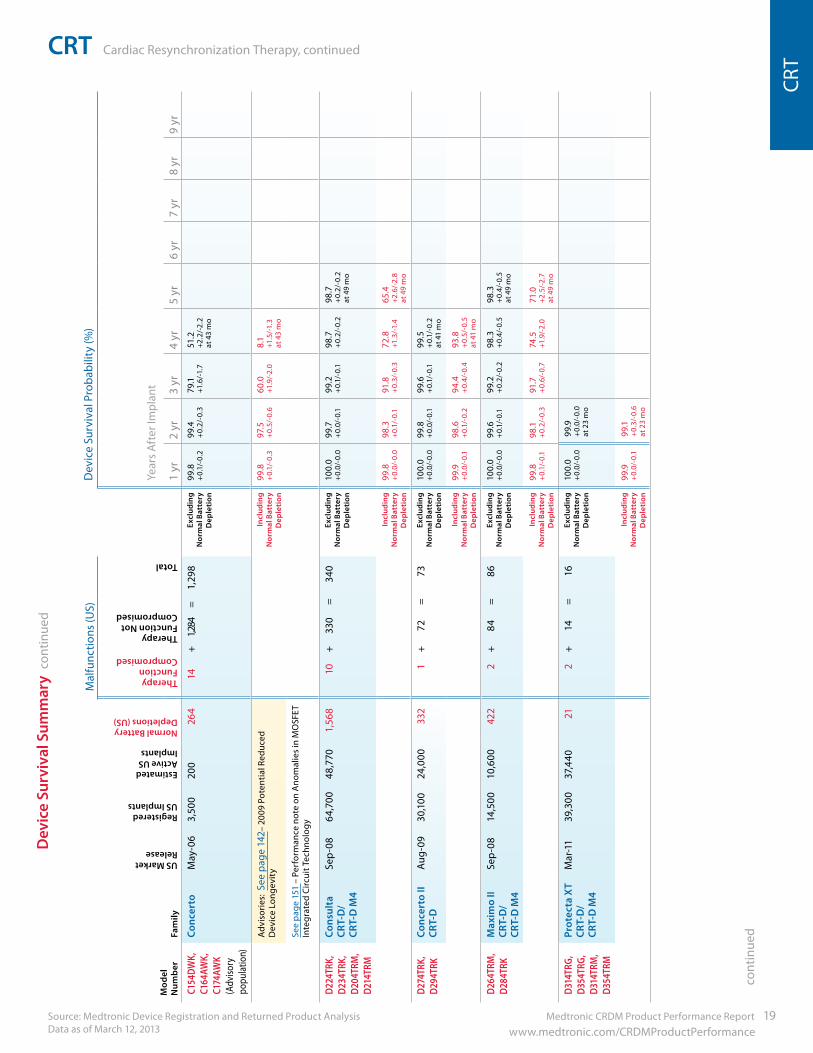
Dev
ice
Surv
ival
Sum
mar
y (9
5% C
onfid
ence
Inte
rval
) Th
e fo
llow
ing
tabl
e sh
ows
CRT
devi
ce s
urvi
val e
stim
ates
with
95%
con
fiden
ce in
terv
als.
Est
imat
es a
re s
how
n bo
th w
ith a
nd w
ithou
t nor
mal
bat
tery
dep
letio
ns in
clud
ed.
Mod
el
Num
ber
Fam
ily
US Market Release
Registered US Implants
Estimated Active US Implants
Normal Battery Depletions (US)
Mal
func
tions
(US)
Dev
ice
Surv
ival
Pro
babi
lity
(%)
Therapy Function Compromised
Therapy Function Not Compromised
Total
Year
s A
fter
Impl
ant
1 yr
2 yr
3 yr
4 yr
5 yr
6 yr
7 yr
8 yr
10 y
r12
yr
7299
InSy
nc
Sent
ryA
pr-0
531
,200
2,25
09,
582
11+
169
=18
0Ex
clud
ing
Nor
mal
Bat
tery
D
eple
tion
100.
0 +
0.0/
-0.0
99.9
+
0.0/
-0.1
99.7
+
0.1/
-0.1
99.2
+
0.1/
-0.1
99.0
+
0.1/
-0.2
98.9
+
0.2/
-0.2
at
61
mo
Incl
udin
g N
orm
al B
atte
ry
Dep
leti
on
99.7
+
0.1/
-0.1
98.1
+
0.2/
-0.2
91.8
+
0.4/
-0.4
71.9
+
0.6/
-0.7
13.1
+
0.7/
-0.7
4.8
+0.
5/-0
.5
at 6
1 m
o
7304
InSy
nc
Max
imo
Apr
-05
19,0
002,
000
5,15
05
+10
6=
111
Excl
udin
g N
orm
al B
atte
ry
Dep
leti
on
100.
0 +
0.0/
-0.0
99.9
+
0.0/
-0.1
99.6
+
0.1/
-0.1
99.2
+
0.2/
-0.2
99.1
+
0.2/
-0.2
99.1
+
0.2/
-0.2
at
62
mo
Incl
udin
g N
orm
al B
atte
ry
Dep
leti
on
99.7
+
0.1/
-0.1
98.2
+
0.2/
-0.2
92.5
+
0.4/
-0.5
74.8
+
0.8/
-0.8
19.9
+1
.1/-1
.01.
8
+0.
6/-0
.5
at 6
2 m
o
8040
InSy
ncA
ug-0
115
,300
1,37
01,
346
10+
26=
36Ex
clud
ing
Nor
mal
Bat
tery
D
eple
tion
100.
0
+0.
0/-0
.010
0.0
+
0.0/
-0.0
99.9
+
0.0/
-0.1
99.8
+
0.1/
-0.1
99.7
+
0.1/
-0.2
99.6
+
0.1/
-0.2
99.5
+
0.1/
-0.2
99.5
+
0.1/
-0.2
99.4
+
0.2/
-0.3
99.4
+
0.2/
-0.3
at
121
mo
In
clud
ing
Nor
mal
Bat
tery
D
eple
tion
99.8
+
0.1/
-0.1
99.5
+
0.1/
-0.1
98.0
+
0.3/
-0.3
95.7
+
0.4/
-0.5
90.8
+
0.7/
-0.7
83.5
+
0.9/
-1.0
73.1
+1
.2/-1
.358
.6
+1.6
/-1.6
19.8
+1
.9/-1
.917
.7
+2.0
/-1.9
at
121
mo
8042
InSy
nc II
IFe
b-0
339
,500
14,8
001,
821
10+
14=
24Ex
clud
ing
Nor
mal
Bat
tery
D
eple
tion
100.
0 +
0.0/
-0.0
100.
0
+0.
0/-0
.010
0.0
+
0.0/
-0.0
99.9
+
0.0/
-0.0
99.9
+
0.0/
-0.0
99.9
+
0.0/
-0.0
99.9
+
0.0/
-0.1
99.8
+
0.1/
-0.1
99.8
+
0.1/
-0.1
at
103
mo
In
clud
ing
Nor
mal
Bat
tery
D
eple
tion
99.9
+
0.0/
-0.0
99.8
+
0.0/
-0.1
99.3
+
0.1/
-0.1
98.0
+
0.2/
-0.2
95.5
+
0.3/
-0.3
90.4
+
0.5/
-0.6
78.1
+
0.9/
-1.0
51.5
+1
.6/-1
.624
.4
+2.3
/-2.
2
at 1
03 m
o
C154
DWK,
C1
64AW
K,
C174
AWK
(Non
-ad
viso
ry
popu
latio
n)
Conc
erto
May
-06
81,3
0027
,000
13,5
0837
+1,
166
=1,
203
Excl
udin
g N
orm
al B
atte
ry
Dep
leti
on
100.
0
+0.
0/-0
.099
.8
+0.
0/-0
.099
.5
+0.
1/-0
.198
.3
+0.
1/-0
.197
.1
+0.
2/-0
.297
.1
+0.
2/-0
.2
at 6
3 m
o
See
page
151
– P
erfo
rman
ce n
ote
on A
nom
alie
s in
MO
SFET
In
tegr
ated
Circ
uit T
echn
olog
yIn
clud
ing
Nor
mal
Bat
tery
D
eple
tion
99.8
+
0.0/
-0.0
98.4
+
0.1/
-0.1
93.5
+
0.2/
-0.2
79.3
+
0.4/
-0.4
41.9
+
0.6/
-0.6
14.1
+1
.0/-1
.0
at 6
3 m
o
Medtronic CRDM Product Performance Report 19 www.medtronic.com/CRDMProductPerformance
CRT Cardiac Resynchronization Therapy, continued
Source: Medtronic Device Registration and Returned Product Analysis Data as of March 12, 2013
CRT
Dev
ice
Surv
ival
Sum
mar
y co
ntin
ued
Mod
el
Num
ber
Fam
ilyUS Market Release
Registered US Implants
Estimated Active US Implants
Normal Battery Depletions (US)
Mal
func
tions
(US)
Dev
ice
Surv
ival
Pro
babi
lity
(%)
Therapy Function Compromised
Therapy Function Not Compromised
Total
Year
s A
fter
Impl
ant
1 yr
2 yr
3 yr
4 yr
5 yr
6 yr
7 yr
8 yr
9 yr
C154
DWK,
C1
64AW
K,
C174
AWK
(Adv
isory
po
pula
tion)
Conc
erto
May
-06
3,50
020
026
414
+1,2
84=
1,29
8Ex
clud
ing
Nor
mal
Bat
tery
D
eple
tion
99.8
+
0.1/
-0.2
99.4
+
0.2/
-0.3
79.1
+1
.6/-1
.751
.2
+2.2
/-2.
2
at 4
3 m
o
Adv
isor
ies:
See
pag
e 14
2– 2
009
Pote
ntia
l Red
uced
D
evic
e Lo
ngev
ity
Incl
udin
g N
orm
al B
atte
ry
Dep
leti
on
99.8
+
0.1/
-0.3
97.5
+
0.5/
-0.6
60.0
+1
.9/-
2.0
8.1
+1
.5/-1
.3
at 4
3 m
o
See
page
151
– P
erfo
rman
ce n
ote
on A
nom
alie
s in
MO
SFET
In
tegr
ated
Circ
uit T
echn
olog
y
D224
TRK,
D2
34TR
K,
D204
TRM
, D2
14TR
M
Cons
ulta
CR
T-D
/CR
T-D
M4
Sep
-08
64,7
0048
,770
1,56
810
+33
0=
340
Excl
udin
g N
orm
al B
atte
ry
Dep
leti
on
100.
0
+0.
0/-0
.099
.7
+0.
0/-0
.199
.2
+0.
1/-0
.198
.7
+0.
2/-0
.298
.7
+0.
2/-0
.2
at 4
9 m
o
In
clud
ing
Nor
mal
Bat
tery
D
eple
tion
99.8
+
0.0/
-0.0
98.3
+
0.1/
-0.1
91.8
+
0.3/
-0.3
72.8
+1
.3/-1
.465
.4
+2.6
/-2.
8
at 4
9 m
o
D274
TRK,
D2
94TR
KCo
ncer
to II
CR
T-D
Aug
-09
30,1
0024
,000
332
1+
72=
73Ex
clud
ing
Nor
mal
Bat
tery
D
eple
tion
100.
0
+0.
0/-0
.099
.8
+0.
0/-0
.199
.6
+0.
1/-0
.199
.5
+0.
1/-0
.2
at 4
1 m
o
In
clud
ing
Nor
mal
Bat
tery
D
eple
tion
99.9
+
0.0/
-0.1
98.6
+
0.1/
-0.2
94.4
+
0.4/
-0.4
93.8
+
0.5/
-0.5
at
41
mo
D264
TRM
, D2
84TR
K M
axim
o II
CR
T-D
/CR
T-D
M4
Sep
-08
14,5
0010
,600
422
2+
84=
86Ex
clud
ing
Nor
mal
Bat
tery
D
eple
tion
100.
0
+0.
0/-0
.099
.6
+0.
1/-0
.199
.2
+0.
2/-0
.298
.3
+0.
4/-0
.598
.3
+0.
4/-0
.5
at 4
9 m
o
Incl
udin
g N
orm
al B
atte
ry
Dep
leti
on
99.8
+
0.1/
-0.1
98.1
+
0.2/
-0.3
91.7
+
0.6/
-0.7
74.5
+1
.9/-
2.0
71.0
+2
.5/-
2.7
at
49
mo
D314
TRG,
D3
54TR
G,
D314
TRM
, D3
54TR
M
Prot
ecta
XT
CR
T-D
/CR
T-D
M4
Mar
-11
39,3
0037
,440
212
+14
=16
Excl
udin
g N
orm
al B
atte
ry
Dep
leti
on
100.
0
+0.
0/-0
.099
.9
+0.
0/-0
.0
at 2
3 m
o
Incl
udin
g N
orm
al B
atte
ry
Dep
leti
on
99.9
+
0.0/
-0.1
99.1
+
0.3/
-0.6
at
23
mo
cont
inue
d
Source: Medtronic Device Registration and Returned Product Analysis Data as of March 12, 2013
CRT Cardiac Resynchronization Therapy, continued
20 Medtronic CRDM Product Performance Report www.medtronic.com/CRDMProductPerformance
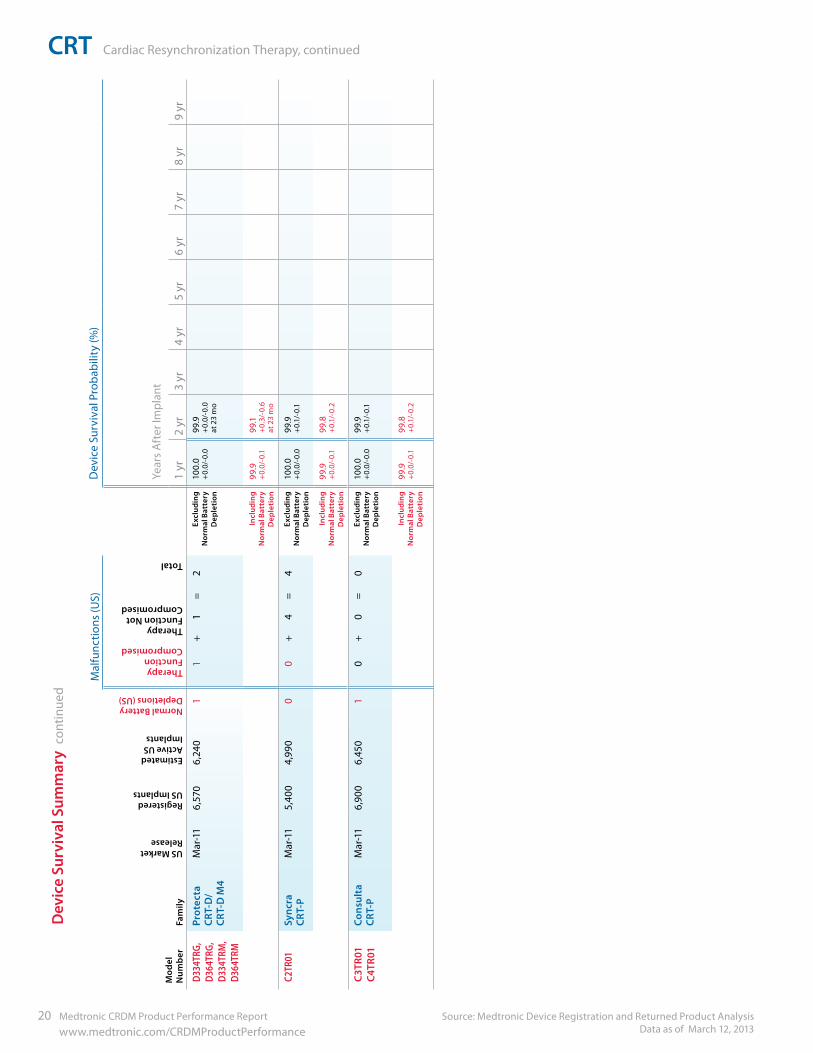
Dev
ice
Surv
ival
Sum
mar
y co
ntin
ued
Mod
el
Num
ber
Fam
ily
US Market Release
Registered US Implants
Estimated Active US Implants
Normal Battery Depletions (US)
Mal
func
tions
(US)
Dev
ice
Surv
ival
Pro
babi
lity
(%)
Therapy Function Compromised
Therapy Function Not Compromised
Total
Year
s A
fter
Impl
ant
1 yr
2 yr
3 yr
4 yr
5 yr
6 yr
7 yr
8 yr
9 yr
D334
TRG,
D3
64TR
G,
D334
TRM
, D3
64TR
M
Prot
ecta
CR
T-D
/CR
T-D
M4
Mar
-11
6,57
06,
240
11
+1
=2
Excl
udin
g N
orm
al B
atte
ry
Dep
leti
on
100.
0
+0.
0/-0
.099
.9
+0.
0/-0
.0
at 2
3 m
o
Incl
udin
g N
orm
al B
atte
ry
Dep
leti
on
99.9
+
0.0/
-0.1
99.1
+
0.3/
-0.6
at
23
mo
C2TR
01
Sync
ra
CRT-
PM
ar-1
15,
400
4,99
00
0+
4=
4Ex
clud
ing
Nor
mal
Bat
tery
D
eple
tion
100.
0
+0.
0/-0
.099
.9
+0.
1/-0
.1
Incl
udin
g N
orm
al B
atte
ry
Dep
leti
on
99.9
+
0.0/
-0.1
99.8
+
0.1/
-0.2
C3TR
01
C4TR
01
Cons
ulta
CR
T-P
Mar
-11
6,90
06,
450
10
+0
=0
Excl
udin
g N
orm
al B
atte
ry
Dep
leti
on
100.
0
+0.
0/-0
.099
.9
+0.
1/-0
.1
Incl
udin
g N
orm
al B
atte
ry
Dep
leti
on
99.9
+
0.0/
-0.1
99.8
+
0.1/
-0.2
Medtronic CRDM Product Performance Report 21 www.medtronic.com/CRDMProductPerformance
CRT Cardiac Resynchronization Therapy, continued
Source: Medtronic Device Registration and Returned Product Analysis Data as of March 12, 2013
CRT
Estimated LongevityElective Replacement
(ERI)***
ModelNumber Family
Connector Style
Volume/ Mass*
Delivered Energy Ch
argi
ng
Freq
uenc
y**
100%
Pa
cing
‡
50%
Pa
cing
‡
15%
Pa
cing
‡
100%
Se
nsin
g
End of Life (EOL) Battery VoltageBa
tter
y Vo
ltag
e
Char
ge
Tim
e
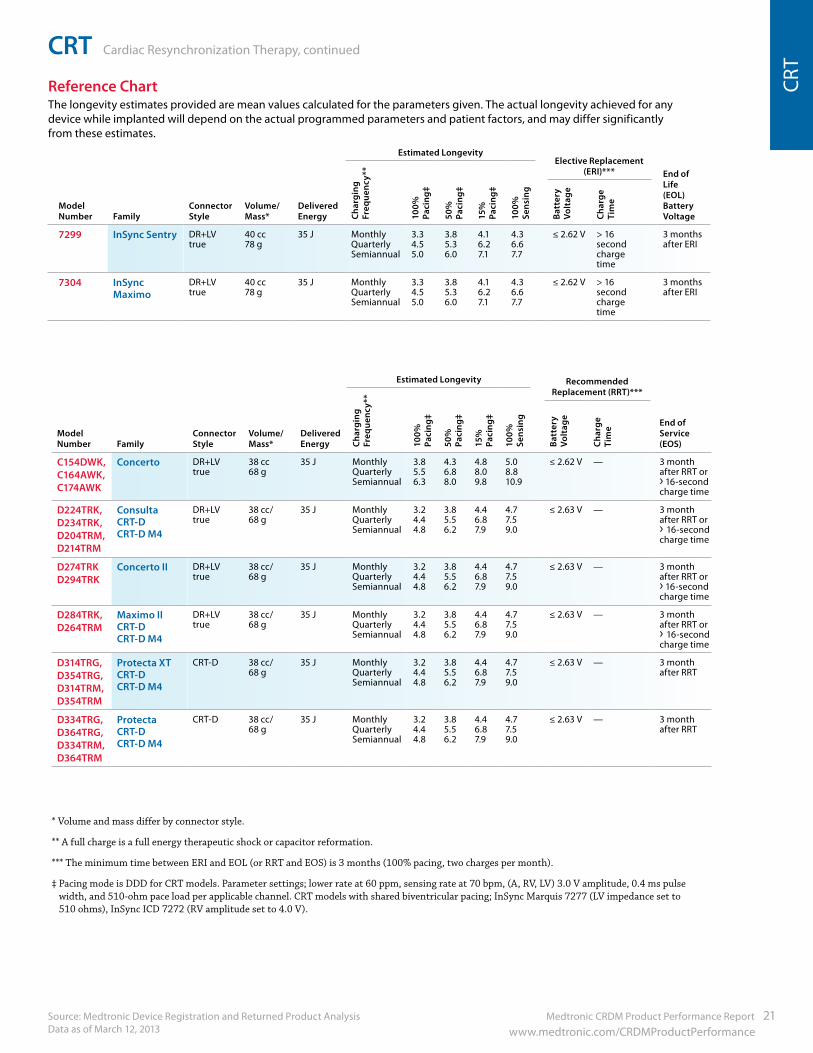
7299 InSync Sentry DR+LV true
40 cc 78 g
35 J Monthly Quarterly Semiannual
3.3 4.5 5.0
3.8 5.3 6.0
4.1 6.2 7.1
4.3 6.6 7.7
≤ 2.62 V > 16 second charge time
3 months after ERI
7304 InSync Maximo
DR+LV true
40 cc 78 g
35 J Monthly Quarterly Semiannual
3.3 4.5 5.0
3.8 5.3 6.0
4.1 6.2 7.1
4.3 6.6 7.7
≤ 2.62 V > 16 second charge time
3 months after ERI
Reference ChartThe longevity estimates provided are mean values calculated for the parameters given. The actual longevity achieved for any device while implanted will depend on the actual programmed parameters and patient factors, and may differ significantly from these estimates.
Estimated Longevity Recommended Replacement (RRT)***
ModelNumber Family
Connector Style
Volume/ Mass*
Delivered Energy Ch
argi
ng
Freq
uenc
y**
100%
Pa
cing
‡
50%
Pa
cing
‡
15%
Pa
cing
‡
100%
Se
nsin
g
End of Service(EOS)Ba
tter
y Vo
ltag
e
Char
ge
Tim
e
C154DWK, C164AWK, C174AWK
Concerto DR+LV true
38 cc 68 g
35 J Monthly Quarterly Semiannual
3.8 5.5 6.3
4.3 6.8 8.0
4.8 8.0 9.8
5.0 8.8 10.9
≤ 2.62 V — 3 month after RRT or › 16-second charge time
D224TRK, D234TRK, D204TRM, D214TRM
Consulta CRT-D CRT-D M4
DR+LV true
38 cc/ 68 g
35 J Monthly Quarterly Semiannual
3.2 4.4 4.8
3.8 5.5 6.2
4.4 6.8 7.9
4.7 7.5 9.0
≤ 2.63 V — 3 month after RRT or › 16-second charge time
D274TRKD294TRK
Concerto II DR+LV true
38 cc/ 68 g
35 J Monthly Quarterly Semiannual
3.2 4.4 4.8
3.8 5.5 6.2
4.4 6.8 7.9
4.7 7.5 9.0
≤ 2.63 V — 3 month after RRT or › 16-second charge time
D284TRK, D264TRM
Maximo II CRT-D CRT-D M4
DR+LV true
38 cc/ 68 g
35 J Monthly Quarterly Semiannual
3.2 4.4 4.8
3.8 5.5 6.2
4.4 6.8 7.9
4.7 7.5 9.0
≤ 2.63 V — 3 month after RRT or › 16-second charge time
D314TRG, D354TRG, D314TRM, D354TRM
Protecta XT CRT-D CRT-D M4
CRT-D 38 cc/ 68 g
35 J Monthly Quarterly Semiannual
3.24.44.8
3.85.56.2
4.46.87.9
4.77.59.0
≤ 2.63 V — 3 month after RRT
D334TRG, D364TRG, D334TRM, D364TRM
Protecta CRT-D CRT-D M4
CRT-D 38 cc/ 68 g
35 J Monthly Quarterly Semiannual
3.24.44.8
3.85.56.2
4.46.87.9
4.77.59.0
≤ 2.63 V — 3 month after RRT
* Volume and mass differ by connector style.
** A full charge is a full energy therapeutic shock or capacitor reformation.
*** The minimum time between ERI and EOL (or RRT and EOS) is 3 months (100% pacing, two charges per month).
‡ Pacing mode is DDD for CRT models. Parameter settings; lower rate at 60 ppm, sensing rate at 70 bpm, (A, RV, LV) 3.0 V amplitude, 0.4 ms pulse width, and 510-ohm pace load per applicable channel. CRT models with shared biventricular pacing; InSync Marquis 7277 (LV impedance set to 510 ohms), InSync ICD 7272 (RV amplitude set to 4.0 V).
Source: Medtronic Device Registration and Returned Product Analysis Data as of March 12, 2013
CRT Cardiac Resynchronization Therapy, continued
22 Medtronic CRDM Product Performance Report www.medtronic.com/CRDMProductPerformance
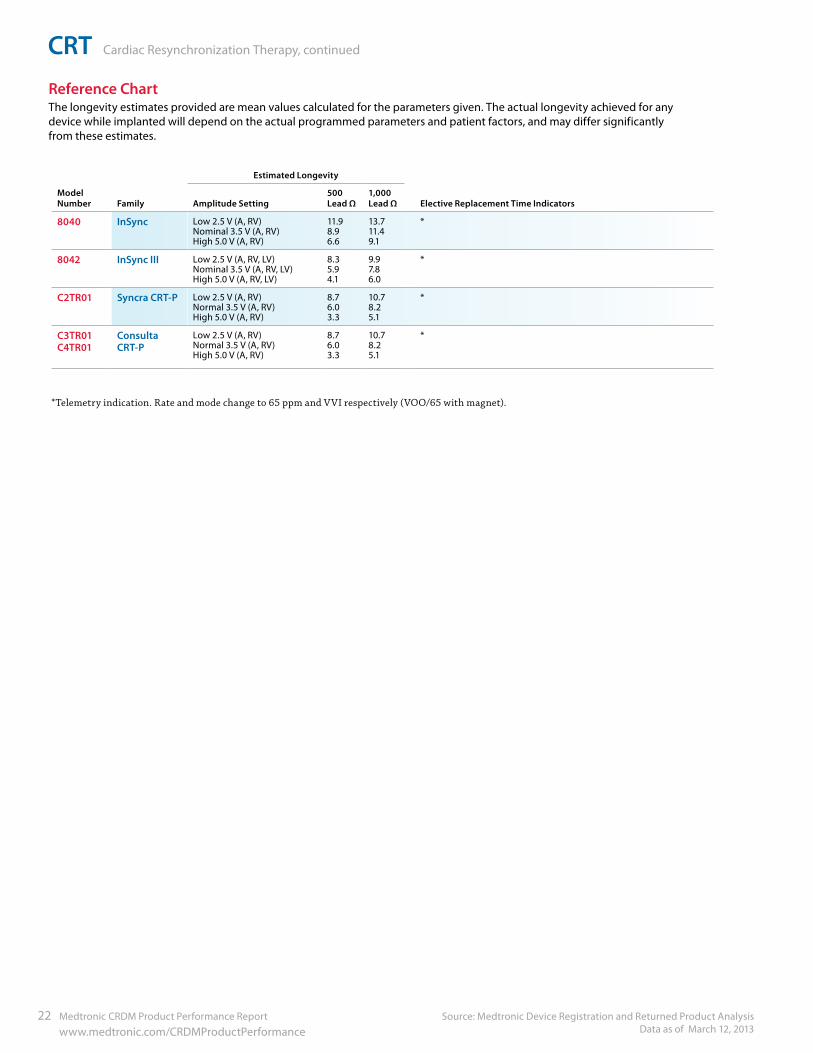
ModelNumber Family
Estimated Longevity
Elective Replacement Time IndicatorsAmplitude Setting500 Lead Ω
1,000 Lead Ω
8040 InSync Low 2.5 V (A, RV) Nominal 3.5 V (A, RV) High 5.0 V (A, RV)
11.9 8.9 6.6
13.7 11.4 9.1
*
8042 InSync III Low 2.5 V (A, RV, LV) Nominal 3.5 V (A, RV, LV) High 5.0 V (A, RV, LV)
8.3 5.9 4.1
9.9 7.8 6.0
*
C2TR01 Syncra CRT-P Low 2.5 V (A, RV)Normal 3.5 V (A, RV)High 5.0 V (A, RV)
8.76.03.3
10.78.25.1
*
C3TR01 C4TR01
Consulta CRT-P
Low 2.5 V (A, RV)Normal 3.5 V (A, RV)High 5.0 V (A, RV)
8.76.03.3
10.78.25.1
*
*Telemetry indication. Rate and mode change to 65 ppm and VVI respectively (VOO/65 with magnet).
Reference ChartThe longevity estimates provided are mean values calculated for the parameters given. The actual longevity achieved for any device while implanted will depend on the actual programmed parameters and patient factors, and may differ significantly from these estimates.
Medtronic CRDM Product Performance Report 23 www.medtronic.com/CRDMProductPerformance
ICD Implantable Cardioverter Defibrillators, continued
Source: Medtronic Device Registration and Returned Product Analysis Data as of March 12, 2013
ICD
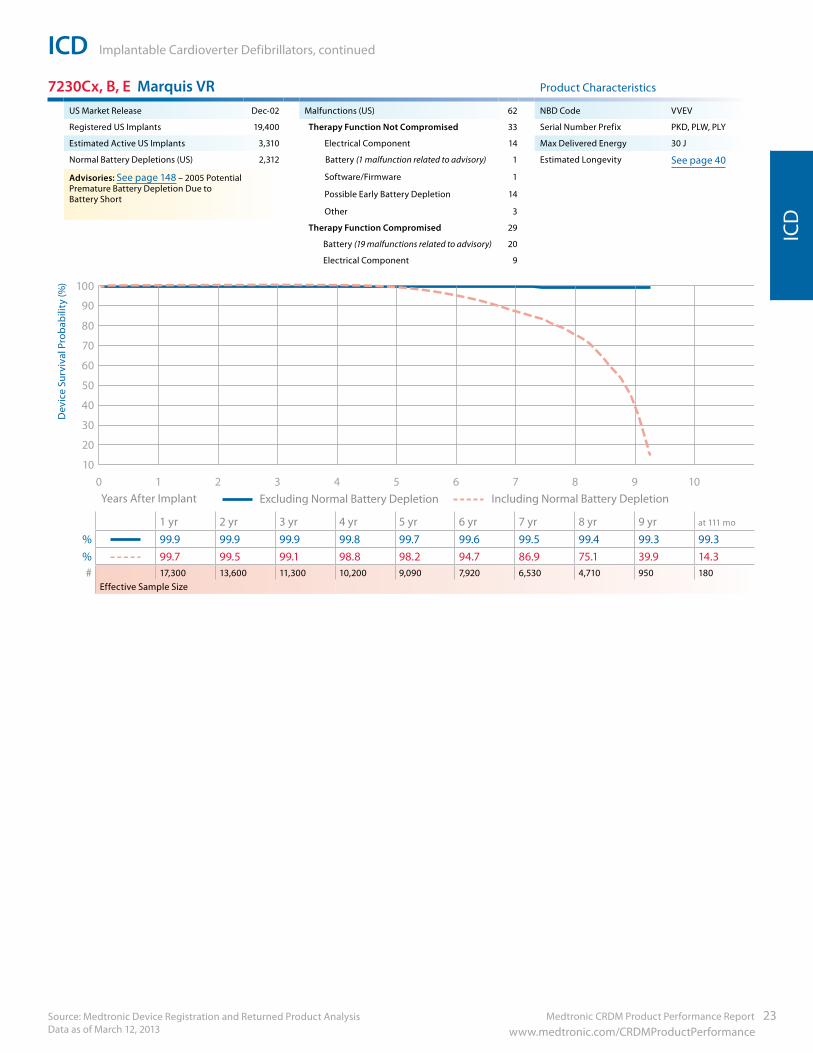
7230Cx, B, E Marquis VR Product Characteristics
US Market Release Dec-02 Malfunctions (US) 62 NBD Code VVEV
Registered US Implants 19,400 Therapy Function Not Compromised 33 Serial Number Prefix PKD, PLW, PLY
Estimated Active US Implants 3,310 Electrical Component 14 Max Delivered Energy 30 J
Normal Battery Depletions (US) 2,312 Battery (1 malfunction related to advisory) 1 Estimated Longevity See page 40
Advisories: See page 148 – 2005 Potential Premature Battery Depletion Due to Battery Short
Software/Firmware 1
Possible Early Battery Depletion 14
Other 3
Therapy Function Compromised 29
Battery (19 malfunctions related to advisory) 20
Electrical Component 9
90
100
80
70
60
50
40
30
20
10109876543210
Years After Implant Excluding Normal Battery Depletion Including Normal Battery Depletion
1 yr 2 yr 3 yr 4 yr 5 yr 6 yr 7 yr 8 yr 9 yr at 111 mo
% 99.9 99.9 99.9 99.8 99.7 99.6 99.5 99.4 99.3 99.3% 99.7 99.5 99.1 98.8 98.2 94.7 86.9 75.1 39.9 14.3# 17,300 13,600 11,300 10,200 9,090 7,920 6,530 4,710 950 180
Effective Sample Size
Dev
ice
Surv
ival
Pro
babi
lity
(%)
ICD Implantable Cardioverter Defibrillators, continued
Source: Medtronic Device Registration and Returned Product Analysis Data as of March 12, 2013
24 Medtronic CRDM Product Performance Report www.medtronic.com/CRDMProductPerformance
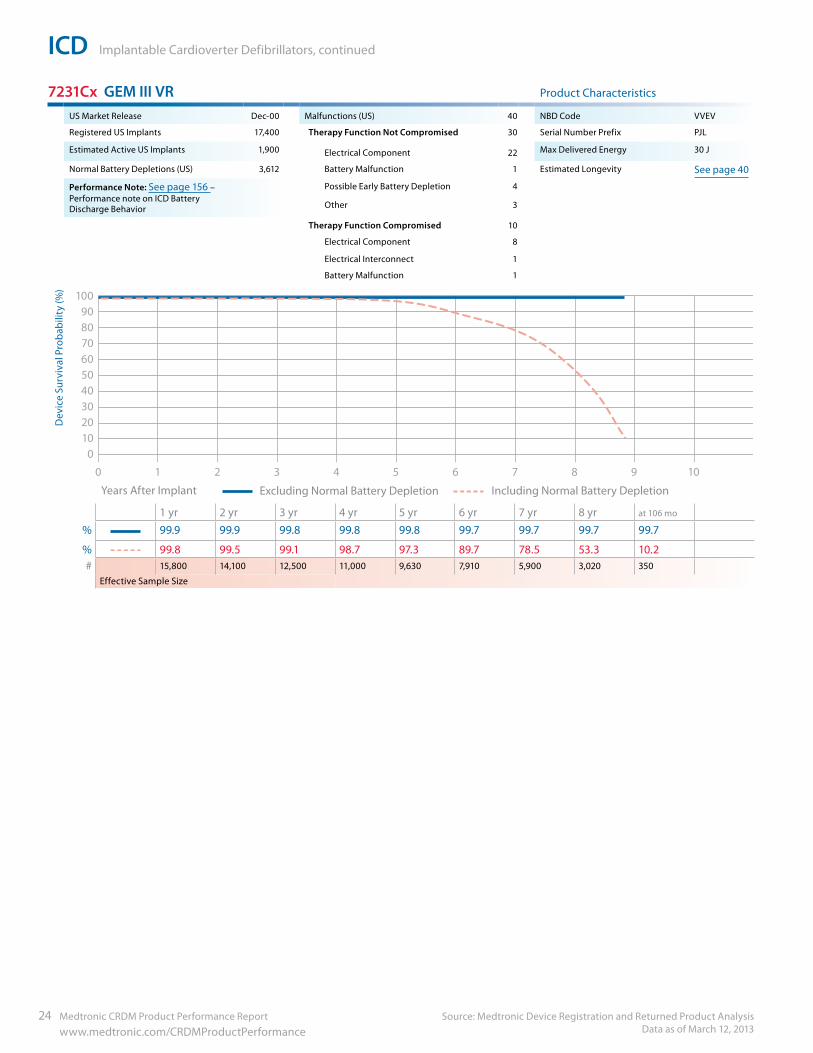
7231Cx GEM III VR Product Characteristics
US Market Release Dec-00 Malfunctions (US) 40 NBD Code VVEV
Registered US Implants 17,400 Therapy Function Not Compromised 30 Serial Number Prefix PJL
Estimated Active US Implants 1,900 Electrical Component 22 Max Delivered Energy 30 J
Normal Battery Depletions (US) 3,612 Battery Malfunction 1 Estimated Longevity See page 40
Performance Note: See page 156 – Performance note on ICD Battery Discharge Behavior
Possible Early Battery Depletion 4
Other 3
Therapy Function Compromised 10
Electrical Component 8
Electrical Interconnect 1
Battery Malfunction 1
90100
8070605040302010
0
109876543210
Years After Implant Excluding Normal Battery Depletion Including Normal Battery Depletion
1 yr 2 yr 3 yr 4 yr 5 yr 6 yr 7 yr 8 yr at 106 mo
% 99.9 99.9 99.8 99.8 99.8 99.7 99.7 99.7 99.7
% 99.8 99.5 99.1 98.7 97.3 89.7 78.5 53.3 10.2# 15,800 14,100 12,500 11,000 9,630 7,910 5,900 3,020 350
Effective Sample Size
Dev
ice
Surv
ival
Pro
babi
lity
(%)
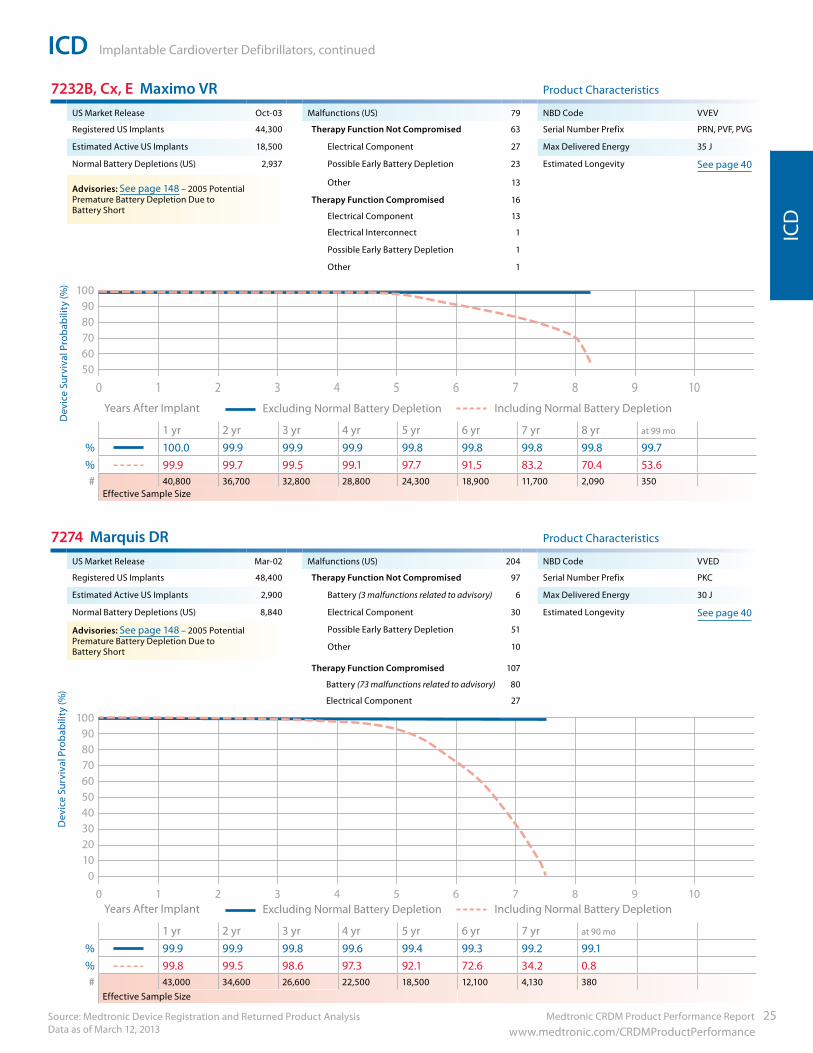
Medtronic CRDM Product Performance Report 25 www.medtronic.com/CRDMProductPerformance
ICD Implantable Cardioverter Defibrillators, continued
Source: Medtronic Device Registration and Returned Product Analysis Data as of March 12, 2013
ICD
7232B, Cx, E Maximo VR Product Characteristics
US Market Release Oct-03 Malfunctions (US) 79 NBD Code VVEV
Registered US Implants 44,300 Therapy Function Not Compromised 63 Serial Number Prefix PRN, PVF, PVG
Estimated Active US Implants 18,500 Electrical Component 27 Max Delivered Energy 35 J
Normal Battery Depletions (US) 2,937 Possible Early Battery Depletion 23 Estimated Longevity See page 40
Advisories: See page 148 – 2005 PotentialPremature Battery Depletion Due to Battery Short
Other 13
Therapy Function Compromised 16
Electrical Component 13
Electrical Interconnect 1
Possible Early Battery Depletion 1
Other 1
90100
8070605040 109876543210
Years After Implant Excluding Normal Battery Depletion Including Normal Battery Depletion
1 yr 2 yr 3 yr 4 yr 5 yr 6 yr 7 yr 8 yr at 99 mo
% 100.0 99.9 99.9 99.9 99.8 99.8 99.8 99.8 99.7% 99.9 99.7 99.5 99.1 97.7 91.5 83.2 70.4 53.6# 40,800 36,700 32,800 28,800 24,300 18,900 11,700 2,090 350
Effective Sample Size
7274 Marquis DR Product Characteristics
US Market Release Mar-02 Malfunctions (US) 204 NBD Code VVED
Registered US Implants 48,400 Therapy Function Not Compromised 97 Serial Number Prefix PKC
Estimated Active US Implants 2,900 Battery (3 malfunctions related to advisory) 6 Max Delivered Energy 30 J
Normal Battery Depletions (US) 8,840 Electrical Component 30 Estimated Longevity See page 40
Advisories: See page 148 – 2005 Potential Premature Battery Depletion Due to Battery Short
Possible Early Battery Depletion 51
Other 10
Therapy Function Compromised 107
Battery (73 malfunctions related to advisory) 80
Electrical Component 27
90100
8070605040302010
0
109876543210 Years After Implant Excluding Normal Battery Depletion Including Normal Battery Depletion
1 yr 2 yr 3 yr 4 yr 5 yr 6 yr 7 yr at 90 mo
% 99.9 99.9 99.8 99.6 99.4 99.3 99.2 99.1% 99.8 99.5 98.6 97.3 92.1 72.6 34.2 0.8# 43,000 34,600 26,600 22,500 18,500 12,100 4,130 380
Effective Sample Size
Dev
ice
Surv
ival
Pro
babi
lity
(%)
Dev
ice
Surv
ival
Pro
babi
lity
(%)
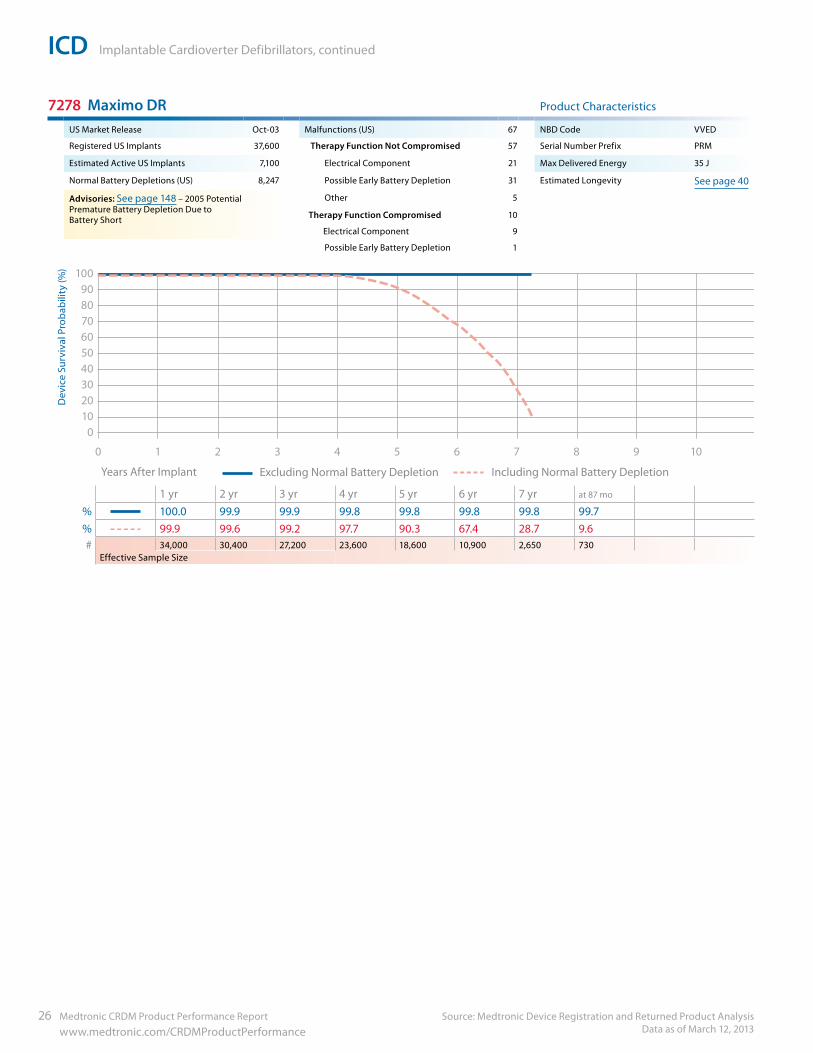
ICD Implantable Cardioverter Defibrillators, continued
Source: Medtronic Device Registration and Returned Product Analysis Data as of March 12, 2013
26 Medtronic CRDM Product Performance Report www.medtronic.com/CRDMProductPerformance
7278 Maximo DR Product Characteristics
US Market Release Oct-03 Malfunctions (US) 67 NBD Code VVED
Registered US Implants 37,600 Therapy Function Not Compromised 57 Serial Number Prefix PRM
Estimated Active US Implants 7,100 Electrical Component 21 Max Delivered Energy 35 J
Normal Battery Depletions (US) 8,247 Possible Early Battery Depletion 31 Estimated Longevity See page 40
Advisories: See page 148 – 2005 Potential Premature Battery Depletion Due to Battery Short
Other 5
Therapy Function Compromised 10
Electrical Component 9
Possible Early Battery Depletion 1
90100
8070605040302010
0
109876543210
Years After Implant Excluding Normal Battery Depletion Including Normal Battery Depletion
1 yr 2 yr 3 yr 4 yr 5 yr 6 yr 7 yr at 87 mo
% 100.0 99.9 99.9 99.8 99.8 99.8 99.8 99.7% 99.9 99.6 99.2 97.7 90.3 67.4 28.7 9.6# 34,000 30,400 27,200 23,600 18,600 10,900 2,650 730
Effective Sample Size
Dev
ice
Surv
ival
Pro
babi
lity
(%)
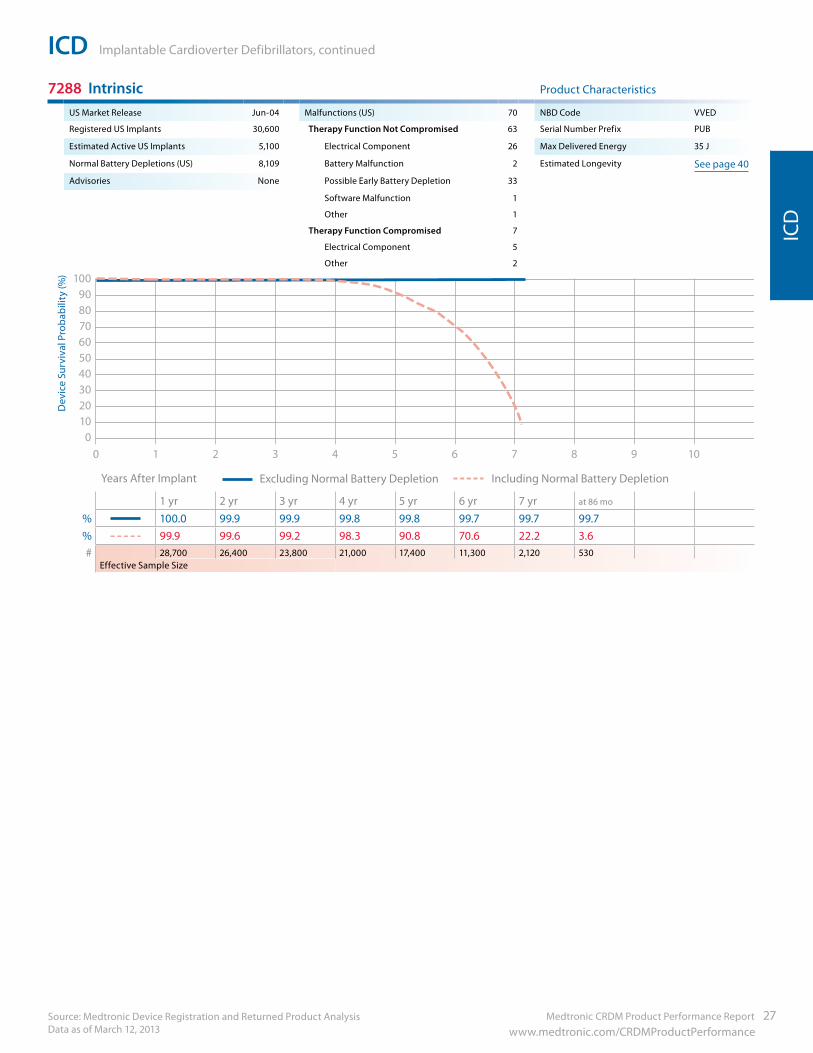
Medtronic CRDM Product Performance Report 27 www.medtronic.com/CRDMProductPerformance
ICD Implantable Cardioverter Defibrillators, continued
Source: Medtronic Device Registration and Returned Product Analysis Data as of March 12, 2013
ICD
7288 Intrinsic Product Characteristics
US Market Release Jun-04 Malfunctions (US) 70 NBD Code VVED
Registered US Implants 30,600 Therapy Function Not Compromised 63 Serial Number Prefix PUB
Estimated Active US Implants 5,100 Electrical Component 26 Max Delivered Energy 35 J
Normal Battery Depletions (US) 8,109 Battery Malfunction 2 Estimated Longevity See page 40
Advisories None Possible Early Battery Depletion 33
Software Malfunction 1
Other 1
Therapy Function Compromised 7
Electrical Component 5
Other 2
90100
8070605040302010
0109876543210
Years After Implant Excluding Normal Battery Depletion Including Normal Battery Depletion
1 yr 2 yr 3 yr 4 yr 5 yr 6 yr 7 yr at 86 mo
% 100.0 99.9 99.9 99.8 99.8 99.7 99.7 99.7% 99.9 99.6 99.2 98.3 90.8 70.6 22.2 3.6# 28,700 26,400 23,800 21,000 17,400 11,300 2,120 530
Effective Sample Size
Dev
ice
Surv
ival
Pro
babi
lity
(%)
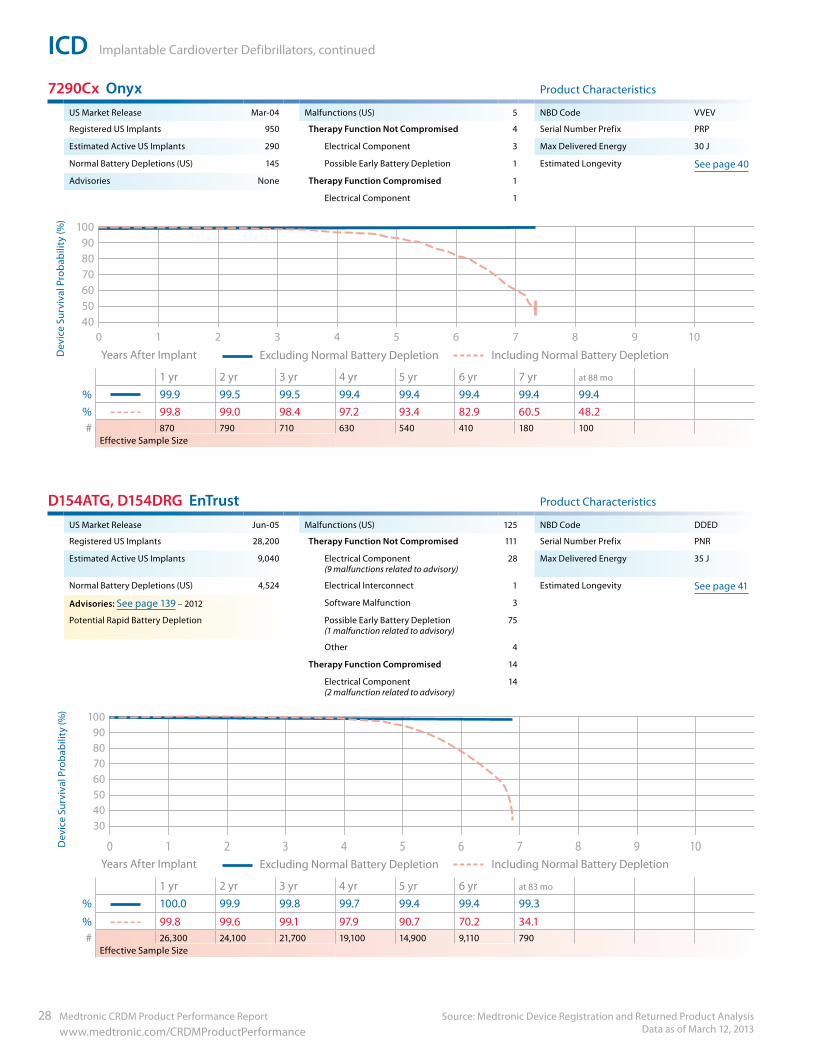
ICD Implantable Cardioverter Defibrillators, continued
Source: Medtronic Device Registration and Returned Product Analysis Data as of March 12, 2013
28 Medtronic CRDM Product Performance Report www.medtronic.com/CRDMProductPerformance
7290Cx Onyx Product Characteristics
US Market Release Mar-04 Malfunctions (US) 5 NBD Code VVEV
Registered US Implants 950 Therapy Function Not Compromised 4 Serial Number Prefix PRP
Estimated Active US Implants 290 Electrical Component 3 Max Delivered Energy 30 J
Normal Battery Depletions (US) 145 Possible Early Battery Depletion 1 Estimated Longevity See page 40
Advisories None Therapy Function Compromised 1
Electrical Component 1
90100
8070605040302010
0
109876543210
Years After Implant Excluding Normal Battery Depletion Including Normal Battery Depletion
1 yr 2 yr 3 yr 4 yr 5 yr 6 yr 7 yr at 88 mo
% 99.9 99.5 99.5 99.4 99.4 99.4 99.4 99.4% 99.8 99.0 98.4 97.2 93.4 82.9 60.5 48.2# 870 790 710 630 540 410 180 100
Effective Sample Size
D154ATG, D154DRG EnTrust Product Characteristics
US Market Release Jun-05 Malfunctions (US) 125 NBD Code DDED
Registered US Implants 28,200 Therapy Function Not Compromised 111 Serial Number Prefix PNR
Estimated Active US Implants 9,040 Electrical Component (9 malfunctions related to advisory)
28 Max Delivered Energy 35 J
Normal Battery Depletions (US) 4,524 Electrical Interconnect 1 Estimated Longevity See page 41
Advisories: See page 139 – 2012 Software Malfunction 3
Potential Rapid Battery Depletion Possible Early Battery Depletion (1 malfunction related to advisory)
75
Other 4
Therapy Function Compromised 14
Electrical Component (2 malfunction related to advisory)
14
109876543210
90100
807060504030
Years After Implant Excluding Normal Battery Depletion Including Normal Battery Depletion
1 yr 2 yr 3 yr 4 yr 5 yr 6 yr at 83 mo
% 100.0 99.9 99.8 99.7 99.4 99.4 99.3
% 99.8 99.6 99.1 97.9 90.7 70.2 34.1# 26,300 24,100 21,700 19,100 14,900 9,110 790
Effective Sample Size
Dev
ice
Surv
ival
Pro
babi
lity
(%)
Dev
ice
Surv
ival
Pro
babi
lity
(%)
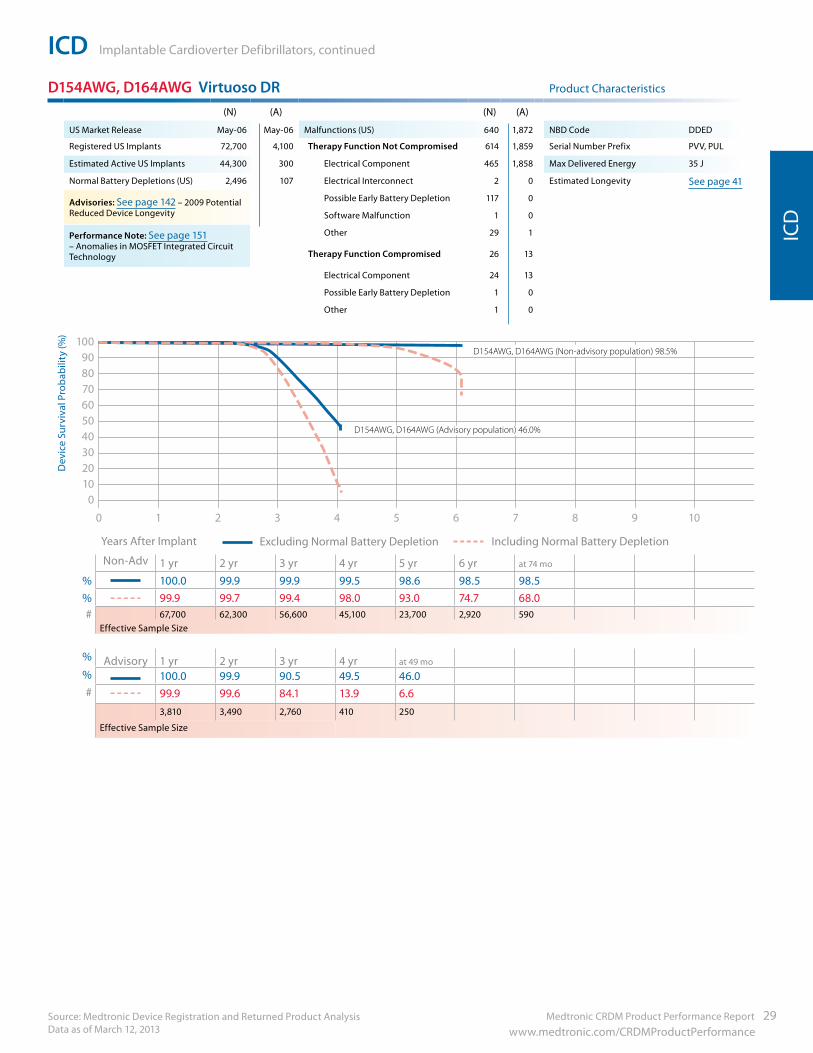
Medtronic CRDM Product Performance Report 29 www.medtronic.com/CRDMProductPerformance
ICD Implantable Cardioverter Defibrillators, continued
Source: Medtronic Device Registration and Returned Product Analysis Data as of March 12, 2013
ICD
D154AWG, D164AWG Virtuoso DR Product Characteristics
(N) (A) (N) (A)
US Market Release May-06 May-06 Malfunctions (US) 640 1,872 NBD Code DDED
Registered US Implants 72,700 4,100 Therapy Function Not Compromised 614 1,859 Serial Number Prefix PVV, PUL
Estimated Active US Implants 44,300 300 Electrical Component 465 1,858 Max Delivered Energy 35 J
Normal Battery Depletions (US) 2,496 107 Electrical Interconnect 2 0 Estimated Longevity See page 41
Advisories: See page 142 – 2009 Potential Reduced Device Longevity
Possible Early Battery Depletion 117 0
Software Malfunction 1 0
Performance Note: See page 151 – Anomalies in MOSFET Integrated Circuit Technology
Other 29 1
Therapy Function Compromised 26 13
Electrical Component 24 13
Possible Early Battery Depletion 1 0
Other 1 0
90100
8070605040302010
0
109876543210
Years After Implant Excluding Normal Battery Depletion Including Normal Battery Depletion
Non-Adv 1 yr 2 yr 3 yr 4 yr 5 yr 6 yr at 74 mo
% 100.0 99.9 99.9 99.5 98.6 98.5 98.5% 99.9 99.7 99.4 98.0 93.0 74.7 68.0# 67,700 62,300 56,600 45,100 23,700 2,920 590
Effective Sample Size
% Advisory 1 yr 2 yr 3 yr 4 yr at 49 mo% 100.0 99.9 90.5 49.5 46.0# 99.9 99.6 84.1 13.9 6.6
3,810 3,490 2,760 410 250
Effective Sample Size
Dev
ice
Surv
ival
Pro
babi
lity
(%)
D154AWG, D164AWG (Non-advisory population) 98.5%
D154AWG, D164AWG (Advisory population) 46.0%
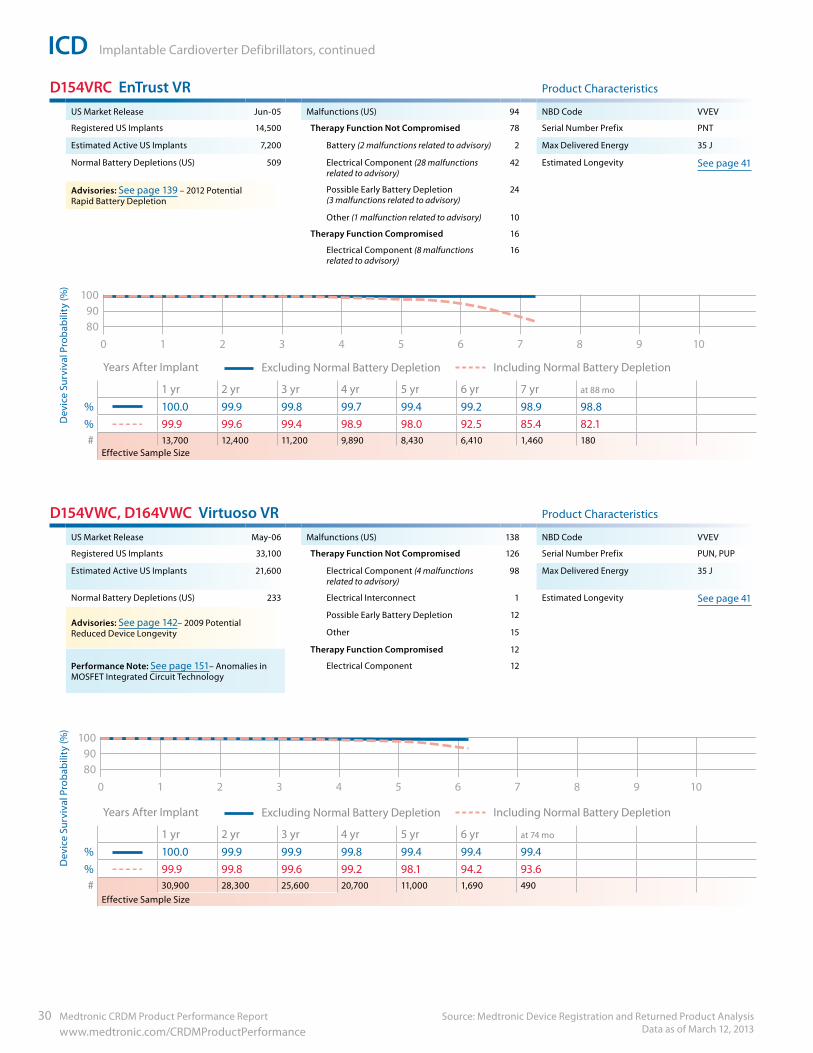
ICD Implantable Cardioverter Defibrillators, continued
Source: Medtronic Device Registration and Returned Product Analysis Data as of March 12, 2013
30 Medtronic CRDM Product Performance Report www.medtronic.com/CRDMProductPerformance
D154VRC EnTrust VR Product Characteristics
US Market Release Jun-05 Malfunctions (US) 94 NBD Code VVEV
Registered US Implants 14,500 Therapy Function Not Compromised 78 Serial Number Prefix PNT
Estimated Active US Implants 7,200 Battery (2 malfunctions related to advisory) 2 Max Delivered Energy 35 J
Normal Battery Depletions (US) 509 Electrical Component (28 malfunctions related to advisory)
42 Estimated Longevity See page 41
Advisories: See page 139 – 2012 Potential Rapid Battery Depletion
Possible Early Battery Depletion (3 malfunctions related to advisory)
24
Other (1 malfunction related to advisory) 10
Therapy Function Compromised 16
Electrical Component (8 malfunctions related to advisory)
16
90100
80109876543210
Years After Implant Excluding Normal Battery Depletion Including Normal Battery Depletion
1 yr 2 yr 3 yr 4 yr 5 yr 6 yr 7 yr at 88 mo
% 100.0 99.9 99.8 99.7 99.4 99.2 98.9 98.8% 99.9 99.6 99.4 98.9 98.0 92.5 85.4 82.1# 13,700 12,400 11,200 9,890 8,430 6,410 1,460 180
Effective Sample Size
D154VWC, D164VWC Virtuoso VR Product Characteristics
US Market Release May-06 Malfunctions (US) 138 NBD Code VVEV
Registered US Implants 33,100 Therapy Function Not Compromised 126 Serial Number Prefix PUN, PUP
Estimated Active US Implants 21,600 Electrical Component (4 malfunctions related to advisory)
98 Max Delivered Energy 35 J
Normal Battery Depletions (US) 233 Electrical Interconnect 1 Estimated Longevity See page 41
Advisories: See page 142– 2009 Potential Reduced Device Longevity
Possible Early Battery Depletion 12
Other 15
Therapy Function Compromised 12
Performance Note: See page 151– Anomalies in MOSFET Integrated Circuit Technology
Electrical Component 12
90100
80109876543210
Years After Implant Excluding Normal Battery Depletion Including Normal Battery Depletion
1 yr 2 yr 3 yr 4 yr 5 yr 6 yr at 74 mo
% 100.0 99.9 99.9 99.8 99.4 99.4 99.4% 99.9 99.8 99.6 99.2 98.1 94.2 93.6# 30,900 28,300 25,600 20,700 11,000 1,690 490
Effective Sample Size
Dev
ice
Surv
ival
Pro
babi
lity
(%)
Dev
ice
Surv
ival
Pro
babi
lity
(%)
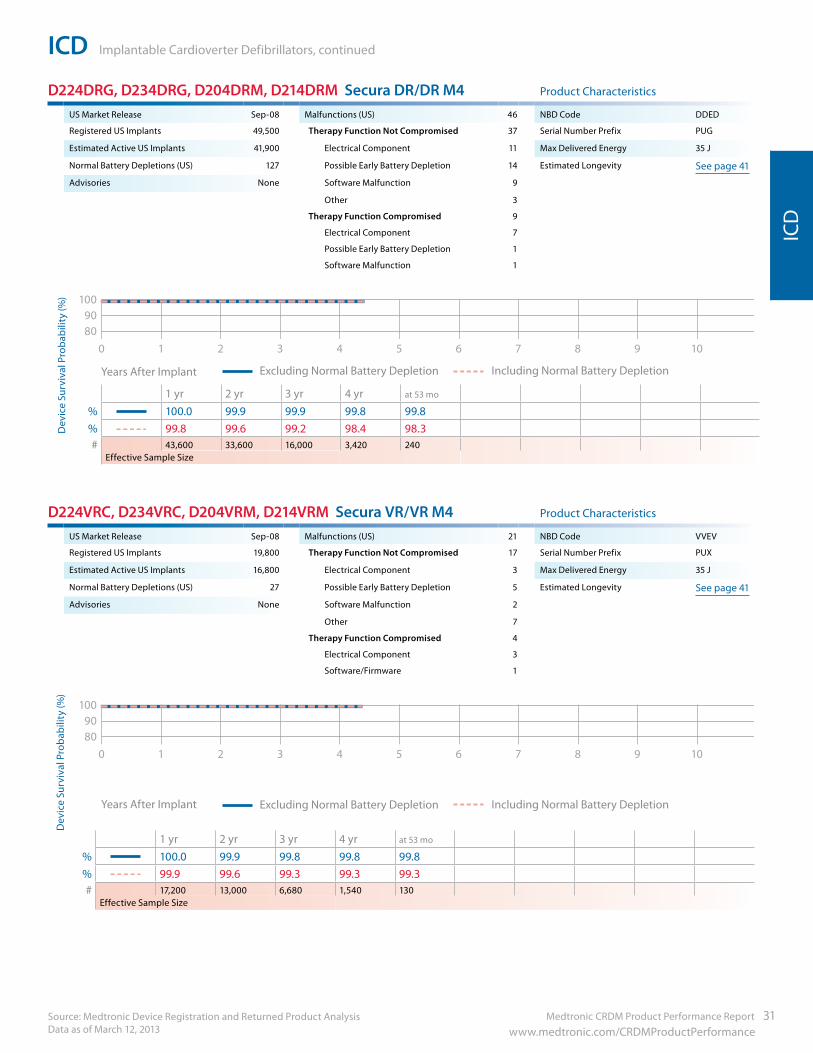
Medtronic CRDM Product Performance Report 31 www.medtronic.com/CRDMProductPerformance
ICD Implantable Cardioverter Defibrillators, continued
Source: Medtronic Device Registration and Returned Product Analysis Data as of March 12, 2013
ICD
D224DRG, D234DRG, D204DRM, D214DRM Secura DR/DR M4 Product Characteristics
US Market Release Sep-08 Malfunctions (US) 46 NBD Code DDED
Registered US Implants 49,500 Therapy Function Not Compromised 37 Serial Number Prefix PUG
Estimated Active US Implants 41,900 Electrical Component 11 Max Delivered Energy 35 J
Normal Battery Depletions (US) 127 Possible Early Battery Depletion 14 Estimated Longevity See page 41
Advisories None Software Malfunction 9
Other 3
Therapy Function Compromised 9
Electrical Component 7
Possible Early Battery Depletion 1
Software Malfunction 1
90100
80109876543210
Years After Implant Excluding Normal Battery Depletion Including Normal Battery Depletion
1 yr 2 yr 3 yr 4 yr at 53 mo
% 100.0 99.9 99.9 99.8 99.8% 99.8 99.6 99.2 98.4 98.3# 43,600 33,600 16,000 3,420 240
Effective Sample Size
D224VRC, D234VRC, D204VRM, D214VRM Secura VR/VR M4 Product Characteristics
US Market Release Sep-08 Malfunctions (US) 21 NBD Code VVEV
Registered US Implants 19,800 Therapy Function Not Compromised 17 Serial Number Prefix PUX
Estimated Active US Implants 16,800 Electrical Component 3 Max Delivered Energy 35 J
Normal Battery Depletions (US) 27 Possible Early Battery Depletion 5 Estimated Longevity See page 41
Advisories None Software Malfunction 2
Other 7
Therapy Function Compromised 4
Electrical Component 3
Software/Firmware 1
90100
80109876543210
Years After Implant Excluding Normal Battery Depletion Including Normal Battery Depletion
1 yr 2 yr 3 yr 4 yr at 53 mo
% 100.0 99.9 99.8 99.8 99.8% 99.9 99.6 99.3 99.3 99.3# 17,200 13,000 6,680 1,540 130
Effective Sample Size
Dev
ice
Surv
ival
Pro
babi
lity
(%)
Dev
ice
Surv
ival
Pro
babi
lity
(%)
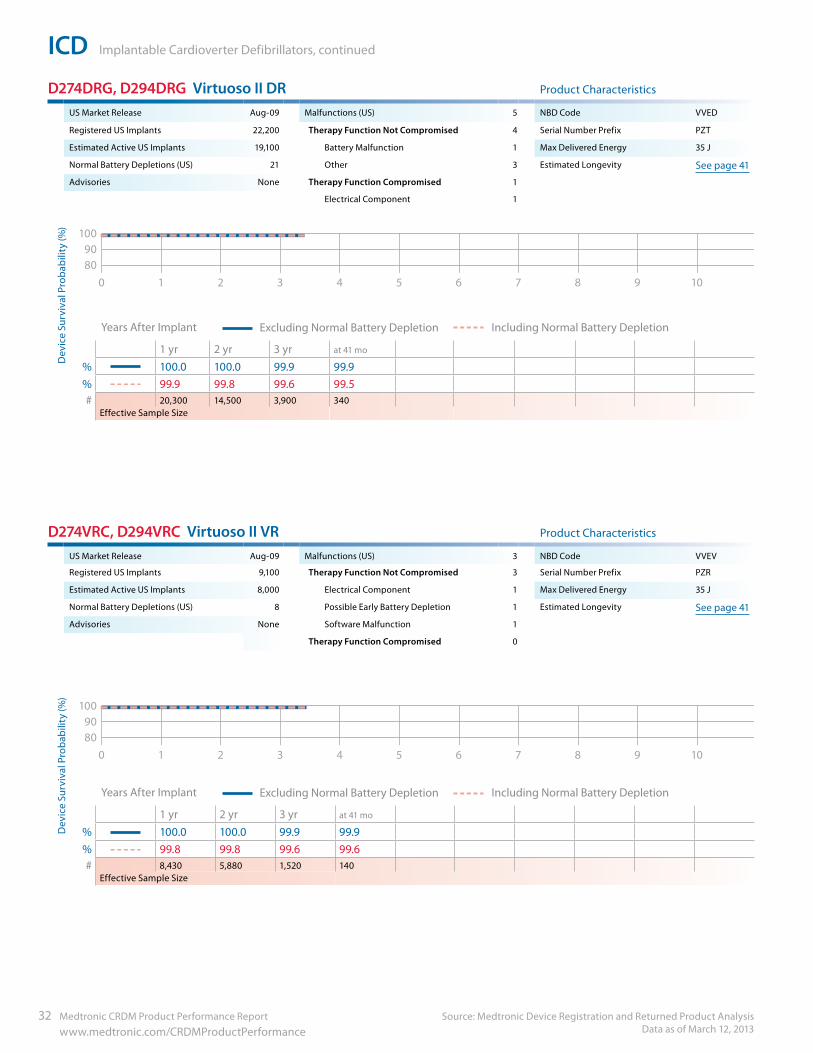
ICD Implantable Cardioverter Defibrillators, continued
Source: Medtronic Device Registration and Returned Product Analysis Data as of March 12, 2013
32 Medtronic CRDM Product Performance Report www.medtronic.com/CRDMProductPerformance
D274DRG, D294DRG Virtuoso II DR Product Characteristics
US Market Release Aug-09 Malfunctions (US) 5 NBD Code VVED
Registered US Implants 22,200 Therapy Function Not Compromised 4 Serial Number Prefix PZT
Estimated Active US Implants 19,100 Battery Malfunction 1 Max Delivered Energy 35 J
Normal Battery Depletions (US) 21 Other 3 Estimated Longevity See page 41
Advisories None Therapy Function Compromised 1
Electrical Component 1
90100
80109876543210
Years After Implant Excluding Normal Battery Depletion Including Normal Battery Depletion
1 yr 2 yr 3 yr at 41 mo
% 100.0 100.0 99.9 99.9% 99.9 99.8 99.6 99.5# 20,300 14,500 3,900 340
Effective Sample Size
D274VRC, D294VRC Virtuoso II VR Product Characteristics
US Market Release Aug-09 Malfunctions (US) 3 NBD Code VVEV
Registered US Implants 9,100 Therapy Function Not Compromised 3 Serial Number Prefix PZR
Estimated Active US Implants 8,000 Electrical Component 1 Max Delivered Energy 35 J
Normal Battery Depletions (US) 8 Possible Early Battery Depletion 1 Estimated Longevity See page 41
Advisories None Software Malfunction 1
Therapy Function Compromised 0
90100
80109876543210
Years After Implant Excluding Normal Battery Depletion Including Normal Battery Depletion
1 yr 2 yr 3 yr at 41 mo
% 100.0 100.0 99.9 99.9% 99.8 99.8 99.6 99.6# 8,430 5,880 1,520 140
Effective Sample Size
Dev
ice
Surv
ival
Pro
babi
lity
(%)
Dev
ice
Surv
ival
Pro
babi
lity
(%)
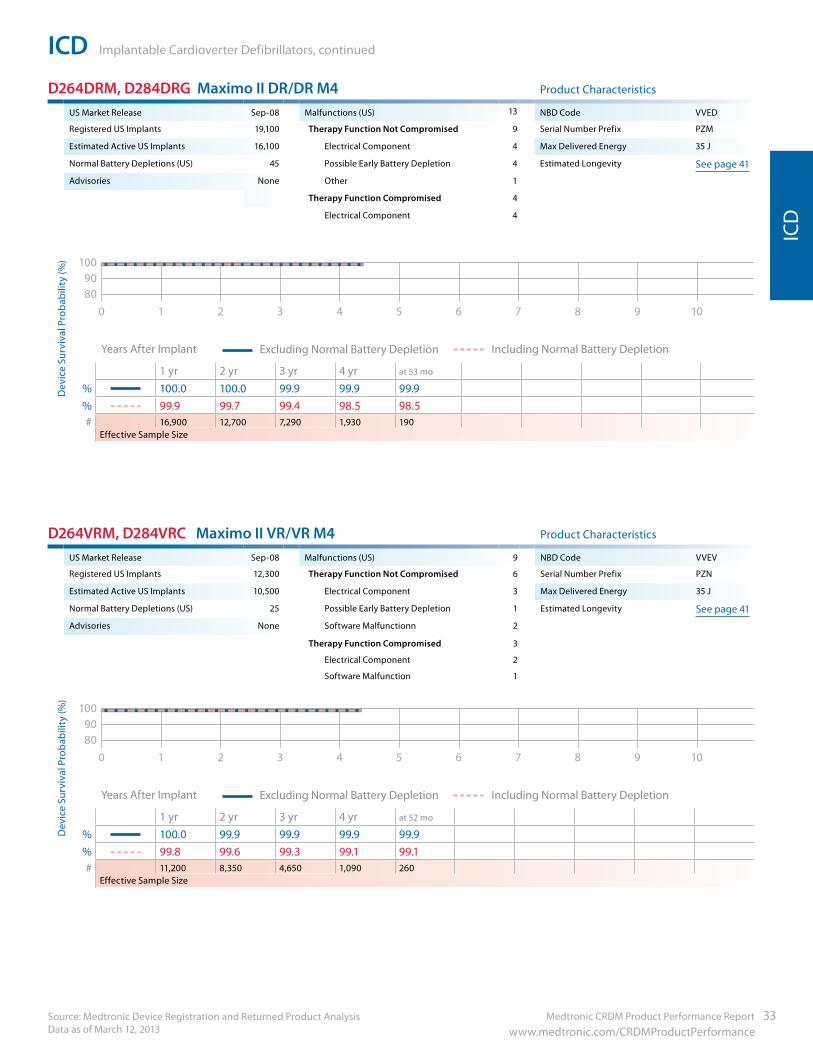
Medtronic CRDM Product Performance Report 33 www.medtronic.com/CRDMProductPerformance
ICD Implantable Cardioverter Defibrillators, continued
Source: Medtronic Device Registration and Returned Product Analysis Data as of March 12, 2013
ICD
D264DRM, D284DRG Maximo II DR/DR M4 Product Characteristics
US Market Release Sep-08 Malfunctions (US) 13 NBD Code VVED
Registered US Implants 19,100 Therapy Function Not Compromised 9 Serial Number Prefix PZM
Estimated Active US Implants 16,100 Electrical Component 4 Max Delivered Energy 35 J
Normal Battery Depletions (US) 45 Possible Early Battery Depletion 4 Estimated Longevity See page 41
Advisories None Other 1
Therapy Function Compromised 4
Electrical Component 4
90100
80109876543210
Years After Implant Excluding Normal Battery Depletion Including Normal Battery Depletion
1 yr 2 yr 3 yr 4 yr at 53 mo
% 100.0 100.0 99.9 99.9 99.9% 99.9 99.7 99.4 98.5 98.5# 16,900 12,700 7,290 1,930 190
Effective Sample Size
D264VRM, D284VRC Maximo II VR/VR M4 Product Characteristics
US Market Release Sep-08 Malfunctions (US) 9 NBD Code VVEV
Registered US Implants 12,300 Therapy Function Not Compromised 6 Serial Number Prefix PZN
Estimated Active US Implants 10,500 Electrical Component 3 Max Delivered Energy 35 J
Normal Battery Depletions (US) 25 Possible Early Battery Depletion 1 Estimated Longevity See page 41
Advisories None Software Malfunctionn 2
Therapy Function Compromised 3
Electrical Component 2
Software Malfunction 1
90100
80109876543210
Years After Implant Excluding Normal Battery Depletion Including Normal Battery Depletion
1 yr 2 yr 3 yr 4 yr at 52 mo
% 100.0 99.9 99.9 99.9 99.9% 99.8 99.6 99.3 99.1 99.1# 11,200 8,350 4,650 1,090 260
Effective Sample Size
Dev
ice
Surv
ival
Pro
babi
lity
(%)
Dev
ice
Surv
ival
Pro
babi
lity
(%)
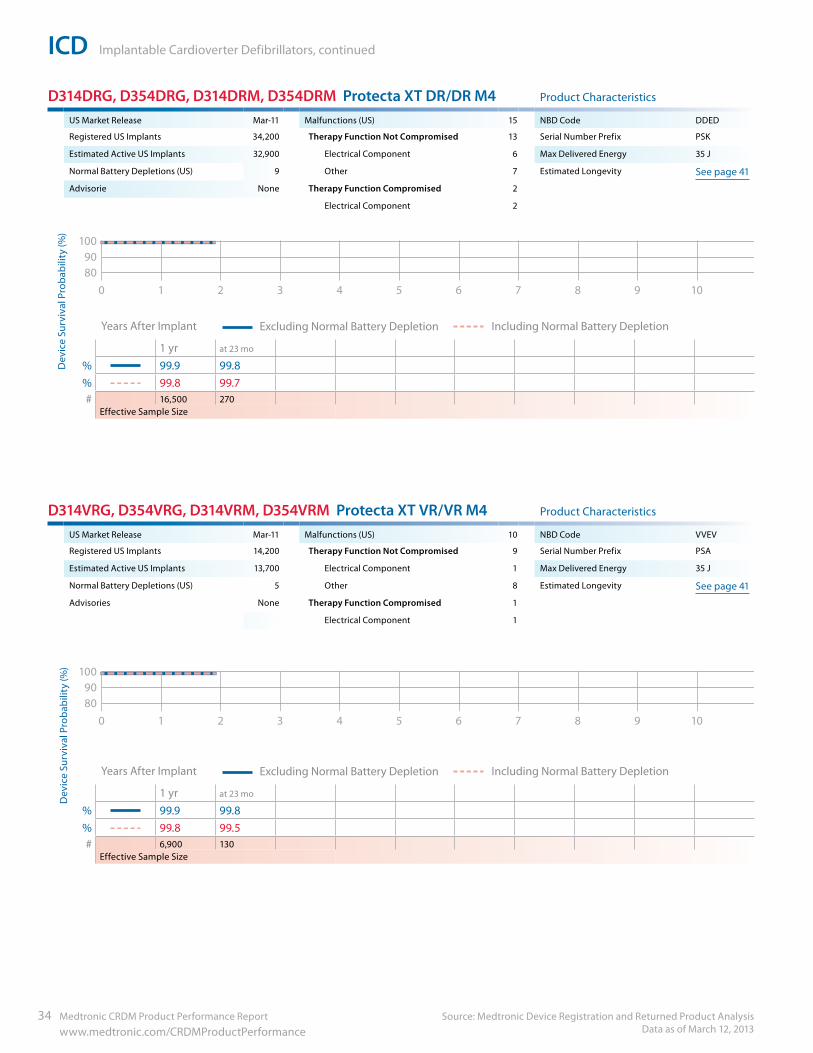
ICD Implantable Cardioverter Defibrillators, continued
Source: Medtronic Device Registration and Returned Product Analysis Data as of March 12, 2013
34 Medtronic CRDM Product Performance Report www.medtronic.com/CRDMProductPerformance
D314DRG, D354DRG, D314DRM, D354DRM Protecta XT DR/DR M4 Product Characteristics
US Market Release Mar-11 Malfunctions (US) 15 NBD Code DDED
Registered US Implants 34,200 Therapy Function Not Compromised 13 Serial Number Prefix PSK
Estimated Active US Implants 32,900 Electrical Component 6 Max Delivered Energy 35 J
Normal Battery Depletions (US) 9 Other 7 Estimated Longevity See page 41
Advisorie None Therapy Function Compromised 2
Electrical Component 2
Survival Estimate of InSync II Marquis 7289 Jan 2009
90100
80109876543210
Years After Implant Excluding Normal Battery Depletion Including Normal Battery Depletion
1 yr at 23 mo
% 99.9 99.8% 99.8 99.7# 16,500 270
Effective Sample Size
D314VRG, D354VRG, D314VRM, D354VRM Protecta XT VR/VR M4 Product Characteristics
US Market Release Mar-11 Malfunctions (US) 10 NBD Code VVEV
Registered US Implants 14,200 Therapy Function Not Compromised 9 Serial Number Prefix PSA
Estimated Active US Implants 13,700 Electrical Component 1 Max Delivered Energy 35 J
Normal Battery Depletions (US) 5 Other 8 Estimated Longevity See page 41
Advisories None Therapy Function Compromised 1
Electrical Component 1
Survival Estimate of InSync II Marquis 7289 Jan 2009
90100
80109876543210
Years After Implant Excluding Normal Battery Depletion Including Normal Battery Depletion
1 yr at 23 mo
% 99.9 99.8% 99.8 99.5# 6,900 130
Effective Sample Size
Dev
ice
Surv
ival
Pro
babi
lity
(%)
Dev
ice
Surv
ival
Pro
babi
lity
(%)
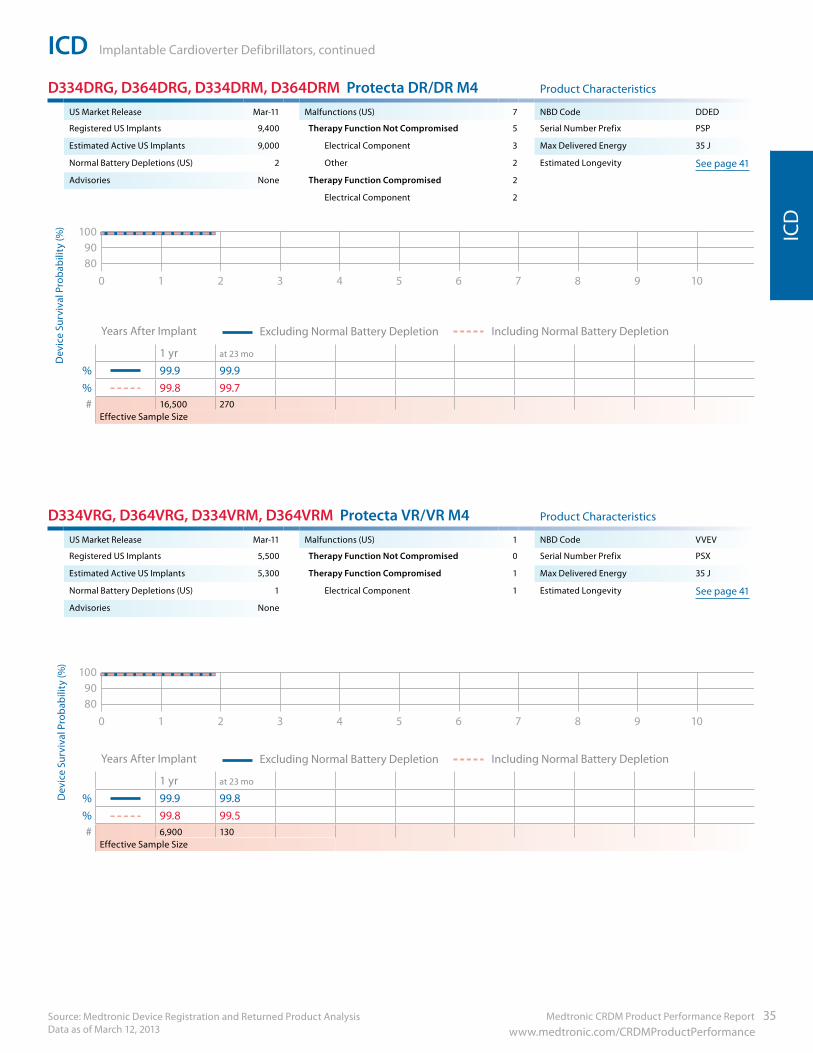
Medtronic CRDM Product Performance Report 35 www.medtronic.com/CRDMProductPerformance
ICD Implantable Cardioverter Defibrillators, continued
Source: Medtronic Device Registration and Returned Product Analysis Data as of March 12, 2013
ICD
D334DRG, D364DRG, D334DRM, D364DRM Protecta DR/DR M4 Product Characteristics
US Market Release Mar-11 Malfunctions (US) 7 NBD Code DDED
Registered US Implants 9,400 Therapy Function Not Compromised 5 Serial Number Prefix PSP
Estimated Active US Implants 9,000 Electrical Component 3 Max Delivered Energy 35 J
Normal Battery Depletions (US) 2 Other 2 Estimated Longevity See page 41
Advisories None Therapy Function Compromised 2
Electrical Component 2
Survival Estimate of InSync II Marquis 7289 Jan 2009
90100
80109876543210
Years After Implant Excluding Normal Battery Depletion Including Normal Battery Depletion
1 yr at 23 mo
% 99.9 99.9% 99.8 99.7# 16,500 270
Effective Sample Size
D334VRG, D364VRG, D334VRM, D364VRM Protecta VR/VR M4 Product Characteristics
US Market Release Mar-11 Malfunctions (US) 1 NBD Code VVEV
Registered US Implants 5,500 Therapy Function Not Compromised 0 Serial Number Prefix PSX
Estimated Active US Implants 5,300 Therapy Function Compromised 1 Max Delivered Energy 35 J
Normal Battery Depletions (US) 1 Electrical Component 1 Estimated Longevity See page 41
Advisories None
Survival Estimate of InSync II Marquis 7289 Jan 2009
90100
80109876543210
Years After Implant Excluding Normal Battery Depletion Including Normal Battery Depletion
1 yr at 23 mo
% 99.9 99.8% 99.8 99.5# 6,900 130
Effective Sample Size
Dev
ice
Surv
ival
Pro
babi
lity
(%)
Dev
ice
Surv
ival
Pro
babi
lity
(%)
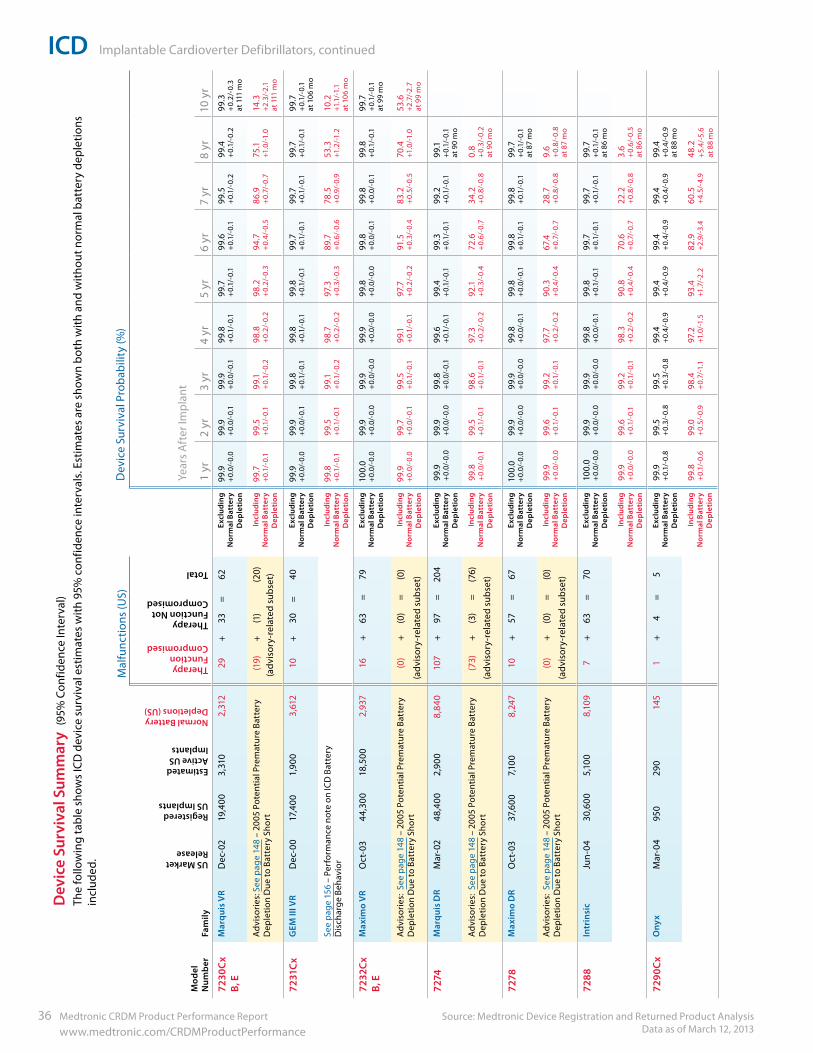
ICD Implantable Cardioverter Defibrillators, continued
Source: Medtronic Device Registration and Returned Product Analysis Data as of March 12, 2013
36 Medtronic CRDM Product Performance Report www.medtronic.com/CRDMProductPerformance
Dev
ice
Surv
ival
Sum
mar
y (9
5% C
onfid
ence
Inte
rval
) Th
e fo
llow
ing
tabl
e sh
ows
ICD
dev
ice
surv
ival
est
imat
es w
ith 9
5% c
onfid
ence
inte
rval
s. E
stim
ates
are
sho
wn
both
with
and
with
out n
orm
al b
atte
ry d
eple
tions
in
clud
ed.
Mod
el
Num
ber
Fam
ily
US Market Release
Registered US Implants
Estimated Active US Implants
Normal Battery Depletions (US)
Mal
func
tions
(US)
Dev
ice
Surv
ival
Pro
babi
lity
(%)
Therapy Function Compromised
Therapy Function Not Compromised
Total
Year
s A
fter
Impl
ant
1 yr
2 yr
3 yr
4 yr
5 yr
6 yr
7 yr
8 yr
10 y
r72
30C
xB,
EM
arqu
is V
RD
ec-0
219
,400
3,31
02,
312
29+
33=
62Ex
clud
ing
Nor
mal
Bat
tery
D
eple
tion
99.9
+
0.0/
-0.0
99.9
+
0.0/
-0.1
99.9
+
0.0/
-0.1
99.8
+
0.1/
-0.1
99.7
+
0.1/
-0.1
99.6
+
0.1/
-0.1
99.5
+
0.1/
-0.2
99.4
+
0.1/
-0.2
99.3
+
0.2/
-0.3
at
111
mo
Adv
isor
ies:
See
pag
e 14
8 –
2005
Pot
entia
l Pre
mat
ure
Batt
ery
Dep
letio
n D
ue to
Bat
tery
Sho
rt(1
9)+
(1)
(20)
Incl
udin
g N
orm
al B
atte
ry
Dep
leti
on
99.7
+
0.1/
-0.1
99.5
+
0.1/
-0.1
99.1
+
0.1/
-0.2
98.8
+
0.2/
-0.2
98.2
+
0.2/
-0.3
94.7
+
0.4/
-0.5
86.9
+
0.7/
-0.7
75.1
+1
.0/-1
.014
.3
+2.3
/-2.
1
at 1
11 m
o (a
dvis
ory-
rela
ted
subs
et)
7231
Cx
GEM
III V
RD
ec-0
017
,400
1,90
03,
612
10+
30=
40Ex
clud
ing
Nor
mal
Bat
tery
D
eple
tion
99.9
+
0.0/
-0.0
99.9
+
0.0/
-0.1
99.8
+
0.1/
-0.1
99.8
+
0.1/
-0.1
99.8
+
0.1/
-0.1
99.7
+
0.1/
-0.1
99.7
+
0.1/
-0.1
99.7
+
0.1/
-0.1
99.7
+
0.1/
-0.1
at
106
mo
See
page
156
– P
erfo
rman
ce n
ote
on IC
D B
atte
ry
Dis
char
ge B
ehav
ior
Incl
udin
g N
orm
al B
atte
ry
Dep
leti
on
99.8
+
0.1/
-0.1
99.5
+
0.1/
-0.1
99.1
+
0.1/
-0.2
98.7
+
0.2/
-0.2
97.3
+
0.3/
-0.3
89.7
+
0.6/
-0.6
78.5
+
0.9/
-0.9
53.3
+1
.2/-1
.210
.2
+1.1
/-1.1
at
106
mo
7232
Cx
B, E
Max
imo
VR
Oct
-03
44,3
0018
,500
2,93
716
+63
=79
Excl
udin
g N
orm
al B
atte
ry
Dep
leti
on
100.
0
+0.
0/-0
.099
.9
+0.
0/-0
.099
.9
+0.
0/-0
.099
.9
+0.
0/-0
.099
.8
+0.
0/-0
.099
.8
+0.
0/-0
.199
.8
+0.
0/-0
.199
.8
+0.
1/-0
.199
.7
+0.
1/-0
.1
at 9
9 m
o
Adv
isor
ies:
See
pag
e 14
8 –
2005
Pot
entia
l Pre
mat
ure
Batt
ery
Dep
letio
n D
ue to
Bat
tery
Sho
rt(0
)+
(0)
=(0
)In
clud
ing
Nor
mal
Bat
tery
D
eple
tion
99.9
+
0.0/
-0.0
99.7
+
0.0/
-0.1
99.5
+
0.1/
-0.1
99.1
+
0.1/
-0.1
97.7
+
0.2/
-0.2
91.5
+
0.3/
-0.4
83.2
+
0.5/
-0.5
70.4
+1
.0/-1
.053
.6
+2.7
/-2.
7
at 9
9 m
o (a
dvis
ory-
rela
ted
subs
et)
7274
Mar
quis
DR
Mar
-02
48,4
002,
900
8,84
010
7+
97=
204
Excl
udin
g N
orm
al B
atte
ry
Dep
leti
on
99.9
+
0.0/
-0.0
99.9
+
0.0/
-0.0
99.8
+
0.0/
-0.1
99.6
+
0.1/
-0.1
99.4
+
0.1/
-0.1
99.3
+
0.1/
-0.1
99.2
+
0.1/
-0.1
99.1
+
0.1/
-0.1
at
90
mo
Adv
isor
ies:
See
pag
e 14
8 –
2005
Pot
entia
l Pre
mat
ure
Batt
ery
Dep
letio
n D
ue to
Bat
tery
Sho
rt(7
3)+
(3)
=(7
6)In
clud
ing
Nor
mal
Bat
tery
D
eple
tion
99.8
+
0.0/
-0.1
99.5
+
0.1/
-0.1
98.6
+
0.1/
-0.1
97.3
+
0.2/
-0.2
92.1
+
0.3/
-0.4
72.6
+
0.6/
-0.7
34.2
+
0.8/
-0.8
0.8
+
0.3/
-0.2
at
90
mo
(adv
isor
y-re
late
d su
bset
)
7278
Max
imo
DR
Oct
-03
37,6
007,1
008,
247
10+
57=
67Ex
clud
ing
Nor
mal
Bat
tery
D
eple
tion
100.
0
+0.
0/-0
.099
.9
+0.
0/-0
.099
.9
+0.
0/-0
.099
.8
+0.
0/-0
.199
.8
+0.
0/-0
.199
.8
+0.
1/-0
.199
.8
+0.
1/-0
.199
.7
+0.
1/-0
.1
at 8
7 m
o
Adv
isor
ies:
See
pag
e 14
8 –
2005
Pot
entia
l Pre
mat
ure
Batt
ery
Dep
letio
n D
ue to
Bat
tery
Sho
rt (0
)+
(0)
=(0
)In
clud
ing
Nor
mal
Bat
tery
D
eple
tion
99.9
+
0.0/
-0.0
99.6
+
0.1/
-0.1
99.2
+
0.1/
-0.1
97.7
+
0.2/
-0.2
90.3
+
0.4/
-0.4
67.4
+
0.7/
-0.7
28.7
+
0.8/
-0.8
9.6
+
0.8/
-0.8
at
87
mo
(adv
isor
y-re
late
d su
bset
)
7288
Intr
insi
cJu
n-04
30,6
005,
100
8,10
97
+63
=70
Excl
udin
g N
orm
al B
atte
ry
Dep
leti
on
100.
0
+0.
0/-0
.099
.9
+0.
0/-0
.099
.9
+0.
0/-0
.099
.8
+0.
0/-0
.199
.8
+0.
1/-0
.199
.7
+0.
1/-0
.199
.7
+0.
1/-0
.199
.7
+0.
1/-0
.1
at 8
6 m
o
Incl
udin
g N
orm
al B
atte
ry
Dep
leti
on
99.9
+
0.0/
-0.0
99.6
+
0.1/
-0.1
99.2
+
0.1/
-0.1
98.3
+
0.2/
-0.2
90.8
+
0.4/
-0.4
70.6
+
0.7/
-0.7
22.2
+
0.8/
-0.8
3.6
+
0.6/
-0.5
at
86
mo
7290
Cx
Ony
xM
ar-0
495
029
014
51
+4
=5
Excl
udin
g N
orm
al B
atte
ry
Dep
leti
on
99.9
+
0.1/
-0.8
99.5
+
0.3/
-0.8
99.5
+
0.3/
-0.8
99.4
+
0.4/
-0.9
99.4
+
0.4/
-0.9
99.4
+
0.4/
-0.9
99.4
+
0.4/
-0.9
99.4
+
0.4/
-0.9
at
88
mo
Incl
udin
g N
orm
al B
atte
ry
Dep
leti
on
99.8
+
0.1/
-0.6
99.0
+
0.5/
-0.9
98.4
+
0.7/
-1.1
97.2
+1
.0/-1
.593
.4
+1.7
/-2.
282
.9
+2.9
/-3.
460
.5
+4.
5/-4
.948
.2
+5.4
/-5.
6
at 8
8 m
o
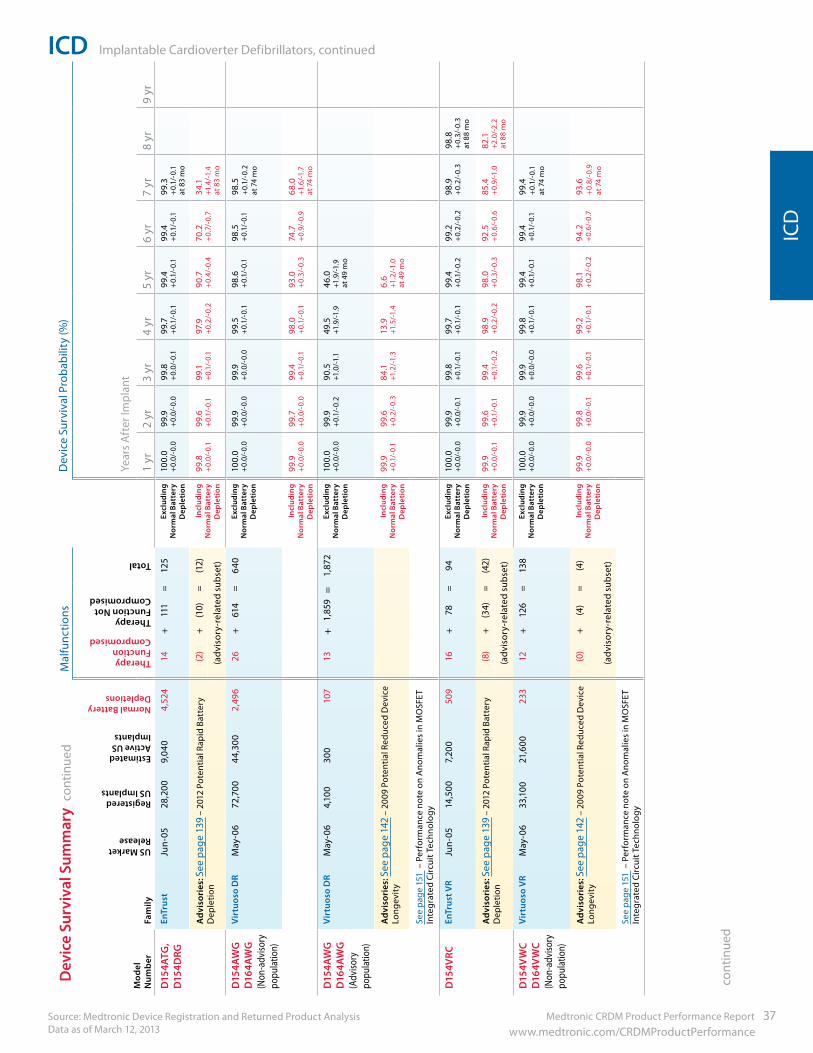
Medtronic CRDM Product Performance Report 37 www.medtronic.com/CRDMProductPerformance
ICD Implantable Cardioverter Defibrillators, continued
Source: Medtronic Device Registration and Returned Product Analysis Data as of March 12, 2013
ICD
cont
inue
d
Dev
ice
Surv
ival
Sum
mar
y co
ntin
ued
Mod
el
Num
ber
Fam
ily
US Market Release
Registered US Implants
Estimated Active US Implants
Normal Battery Depletions
Mal
func
tions
Dev
ice
Surv
ival
Pro
babi
lity
(%)
Therapy Function Compromised
Therapy Function Not Compromised
Total
Year
s A
fter
Impl
ant
1 yr
2 yr
3 yr
4 yr
5 yr
6 yr
7 yr
8 yr
9 yr
D15
4ATG
, D
154D
RGEn
Trus
tJu
n-05
28,2
009,
040
4,52
414
+11
1=
125
Excl
udin
g N
orm
al B
atte
ry
Dep
leti
on
100.
0
+0.
0/-0
.099
.9
+0.
0/-0
.099
.8
+0.
0/-0
.199
.7
+0.
1/-0
.199
.4
+0.
1/-0
.199
.4
+0.
1/-0
.199
.3
+0.
1/-0
.1
at 8
3 m
o
Adv
isor
ies:
See
pag
e 13
9 –
2012
Pot
entia
l Rap
id B
atte
ry
Dep
letio
n(2
)+
(10)
=(1
2)In
clud
ing
Nor
mal
Bat
tery
D
eple
tion
99.8
+
0.0/
-0.1
99.6
+
0.1/
-0.1
99.1
+
0.1/
-0.1
97.9
+
0.2/
-0.2
90.7
+
0.4/
-0.4
70.2
+
0.7/
-0.7
34.1
+1
.4/-1
.4
at 8
3 m
o(a
dvis
ory-
rela
ted
subs
et)
D15
4AW
G
D16
4AW
G
(Non
-adv
isory
po
pula
tion)
Vir
tuos
o D
RM
ay-0
672
,700
44,3
002,
496
26+
614
=64
0Ex
clud
ing
Nor
mal
Bat
tery
D
eple
tion
100.
0
+0.
0/-0
.099
.9
+0.
0/-0
.099
.9
+0.
0/-0
.099
.5
+0.
1/-0
.198
.6
+0.
1/-0
.198
.5
+0.
1/-0
.198
.5
+0.
1/-0
.2
at 7
4 m
o
Incl
udin
g N
orm
al B
atte
ry
Dep
leti
on
99.9
+
0.0/
-0.0
99.7
+
0.0/
-0.0
99.4
+
0.1/
-0.1
98.0
+
0.1/
-0.1
93.0
+
0.3/
-0.3
74.7
+
0.9/
-0.9
68.0
+1
.6/-1
.7
at 7
4 m
o
D15
4AW
G
D16
4AW
G
(Adv
isory
po
pula
tion)
Vir
tuos
o D
RM
ay-0
64,
100
300
107
13+
1,85
9=
1,87
2Ex
clud
ing
Nor
mal
Bat
tery
D
eple
tion
100.
0
+0.
0/-0
.099
.9
+0.
1/-0
.290
.5
+1.0
/-1.1
49.5
+1
.9/-1
.946
.0
+1.9
/-1.9
at
49
mo
Adv
isor
ies:
See
pag
e 14
2 –
2009
Pot
entia
l Red
uced
Dev
ice
Long
evit
yIn
clud
ing
Nor
mal
Bat
tery
D
eple
tion
99.9
+
0.1/
-0.1
99.6
+
0.2/
-0.3
84.1
+1
.2/-1
.313
.9
+1.5
/-1.4
6.6
+1
.2/-1
.0
at 4
9 m
o
See
page
151
– P
erfo
rman
ce n
ote
on A
nom
alie
s in
MO
SFET
In
tegr
ated
Circ
uit T
echn
olog
y
D15
4VRC
EnTr
ust V
RJu
n-05
14,5
007,
200
509
16+
78=
94Ex
clud
ing
Nor
mal
Bat
tery
D
eple
tion
100.
0
+0.
0/-0
.099
.9
+0.
0/-0
.199
.8
+0.
1/-0
.199
.7
+0.
1/-0
.199
.4
+0.
1/-0
.299
.2
+0.
2/-0
.298
.9
+0.
2/-0
.398
.8
+0.
3/-0
.3
at 8
8 m
o
Adv
isor
ies:
See
pag
e 13
9 –
2012
Pot
entia
l Rap
id B
atte
ry
Dep
letio
n(8
)+
(34)
=(4
2)In
clud
ing
Nor
mal
Bat
tery
D
eple
tion
99.9
+
0.0/
-0.1
99.6
+
0.1/
-0.1
99.4
+
0.1/
-0.2
98.9
+
0.2/
-0.2
98.0
+
0.3/
-0.3
92.5
+
0.6/
-0.6
85.4
+
0.9/
-1.0
82.1
+2
.0/-
2.2
at
88
mo
(adv
isor
y-re
late
d su
bset
)
D15
4VW
C
D16
4VW
C (N
on-a
dviso
ry
popu
latio
n)
Vir
tuos
o V
RM
ay-0
633
,100
21,6
0023
312
+12
6=
138
Excl
udin
g N
orm
al B
atte
ry
Dep
leti
on
100.
0
+0.
0/-0
.099
.9
+0.
0/-0
.099
.9
+0.
0/-0
.099
.8
+0.
1/-0
.199
.4
+0.
1/-0
.199
.4
+0.
1/-0
.199
.4
+0.
1/-0
.1
at 7
4 m
o
Adv
isor
ies:
See
pag
e 14
2 –
2009
Pot
entia
l Red
uced
Dev
ice
Long
evit
y(0
)+
(4)
=(4
)In
clud
ing
Nor
mal
Bat
tery
D
eple
tion
99.9
+
0.0/
-0.0
99.8
+
0.0/
-0.1
99.6
+
0.1/
-0.1
99.2
+
0.1/
-0.1
98.1
+
0.2/
-0.2
94.2
+
0.6/
-0.7
93.6
+
0.8/
-0.9
at
74
mo
(adv
isor
y-re
late
d su
bset
)
See
page
151
– P
erfo
rman
ce n
ote
on A
nom
alie
s in
MO
SFET
In
tegr
ated
Circ
uit T
echn
olog
y
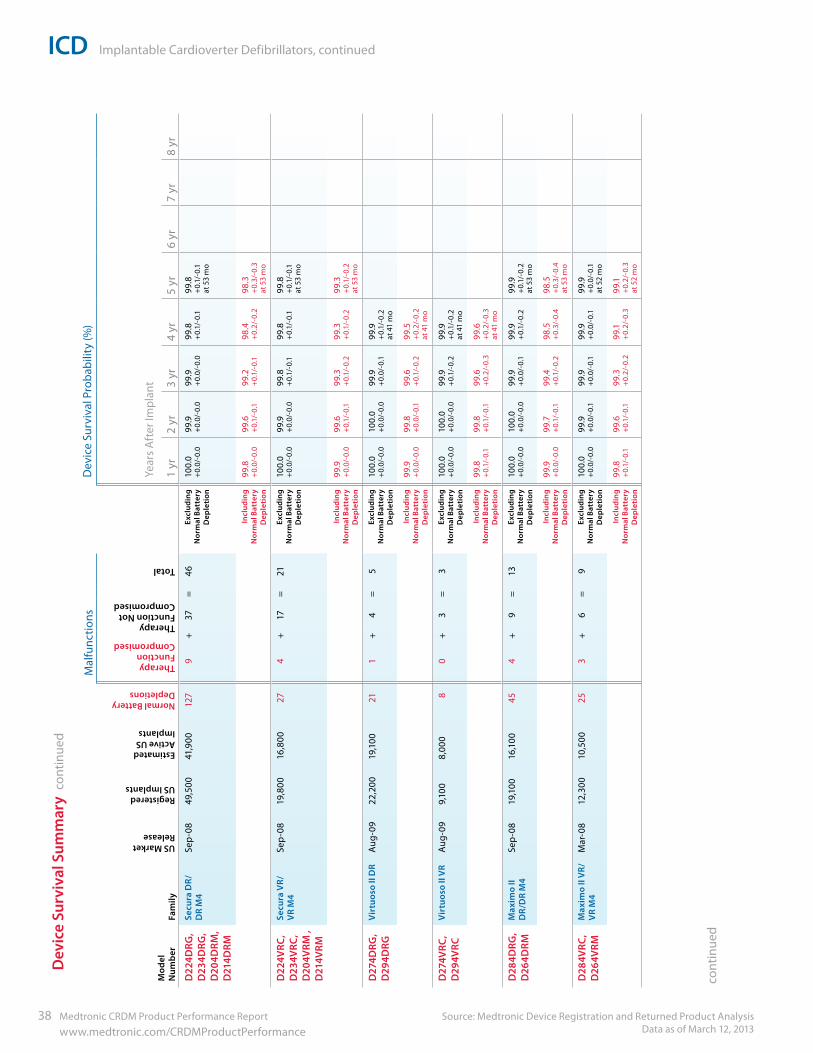
ICD Implantable Cardioverter Defibrillators, continued
Source: Medtronic Device Registration and Returned Product Analysis Data as of March 12, 2013
38 Medtronic CRDM Product Performance Report www.medtronic.com/CRDMProductPerformance
Dev
ice
Surv
ival
Sum
mar
y co
ntin
ued
Mod
el
Num
ber
Fam
ily
US Market Release
Registered US Implants
Estimated Active US Implants
Normal Battery Depletions
Mal
func
tions
Dev
ice
Surv
ival
Pro
babi
lity
(%)
Therapy Function Compromised
Therapy Function Not Compromised
Total
Year
s A
fter
Impl
ant
1 yr
2 yr
3 yr
4 yr
5 yr
6 yr
7 yr
8 yr
D22
4DRG
, D
234D
RG,
D20
4DRM
, D
214D
RM
Secu
ra D
R/D
R M
4Se
p-0
849
,500
41,9
0012
79
+37
=46
Excl
udin
g N
orm
al B
atte
ry
Dep
leti
on
100.
0
+0.
0/-0
.099
.9
+0.
0/-0
.099
.9
+0.
0/-0
.099
.8
+0.
1/-0
.199
.8
+0.
1/-0
.1
at 5
3 m
o
Incl
udin
g N
orm
al B
atte
ry
Dep
leti
on
99.8
+
0.0/
-0.0
99.6
+
0.1/
-0.1
99.2
+
0.1/
-0.1
98.4
+
0.2/
-0.2
98.3
+
0.3/
-0.3
at
53
mo
D22
4VRC
, D
234V
RC,
D20
4VRM
, D
214V
RM
Secu
ra V
R/
VR
M4
Sep
-08
19,8
0016
,800
274
+17
=21
Excl
udin
g N
orm
al B
atte
ry
Dep
leti
on
100.
0
+0.
0/-0
.099
.9
+0.
0/-0
.099
.8
+0.
1/-0
.199
.8
+0.
1/-0
.199
.8
+0.
1/-0
.1
at 5
3 m
o
Incl
udin
g N
orm
al B
atte
ry
Dep
leti
on
99.9
+
0.0/
-0.0
99.6
+
0.1/
-0.1
99.3
+
0.1/
-0.2
99.3
+
0.1/
-0.2
99.3
+
0.1/
-0.2
at
53
mo
D27
4DRG
, D
294D
RGV
irtu
oso
II D
RA
ug-0
922
,200
19,1
0021
1+
4=
5Ex
clud
ing
Nor
mal
Bat
tery
D
eple
tion
100.
0
+0.
0/-0
.010
0.0
+
0.0/
-0.0
99.9
+
0.0/
-0.1
99.9
+
0.1/
-0.2
at
41
mo
Incl
udin
g N
orm
al B
atte
ry
Dep
leti
on
99.9
+
0.0/
-0.0
99.8
+
0.0/
-0.1
99.6
+
0.1/
-0.2
99.5
+
0.2/
-0.2
at
41
mo
D27
4VRC
, D
294V
RCV
irtu
oso
II V
RA
ug-0
99,
100
8,00
08
0+
3=
3Ex
clud
ing
Nor
mal
Bat
tery
D
eple
tion
100.
0
+0.
0/-0
.010
0.0
+
0.0/
-0.0
99.9
+
0.1/
-0.2
99.9
+
0.1/
-0.2
at
41
mo
Incl
udin
g N
orm
al B
atte
ry
Dep
leti
on
99.8
+
0.1/
-0.1
99.8
+
0.1/
-0.1
99.6
+
0.2/
-0.3
99.6
+
0.2/
-0.3
at
41
mo
D28
4DRG
, D
264D
RM
Max
imo
II D
R/D
R M
4Se
p-0
819
,100
16,1
0045
4+
9=
13Ex
clud
ing
Nor
mal
Bat
tery
D
eple
tion
100.
0
+0.
0/-0
.010
0.0
+
0.0/
-0.0
99.9
+
0.0/
-0.1
99.9
+
0.1/
-0.2
99.9
+
0.1/
-0.2
at
53
mo
Incl
udin
g N
orm
al B
atte
ry
Dep
leti
on
99.9
+
0.0/
-0.0
99.7
+
0.1/
-0.1
99.4
+
0.1/
-0.2
98.5
+
0.3/
-0.4
98.5
+
0.3/
-0.4
at
53
mo
D28
4VRC
, D
264V
RM
Max
imo
II V
R/V
R M
4M
ar-0
812
,300
10,5
0025
3+
6=
9Ex
clud
ing
Nor
mal
Bat
tery
D
eple
tion
100.
0
+0.
0/-0
.099
.9
+0.
0/-0
.199
.9
+0.
0/-0
.199
.9
+0.
0/-0
.199
.9
+0.
0/-0
.1
at 5
2 m
o
Incl
udin
g N
orm
al B
atte
ry
Dep
leti
on
99.8
+
0.1/
-0.1
99.6
+
0.1/
-0.1
99.3
+
0.2/
-0.2
99.1
+
0.2/
-0.3
99.1
+
0.2/
-0.3
at
52
mo
cont
inue
d
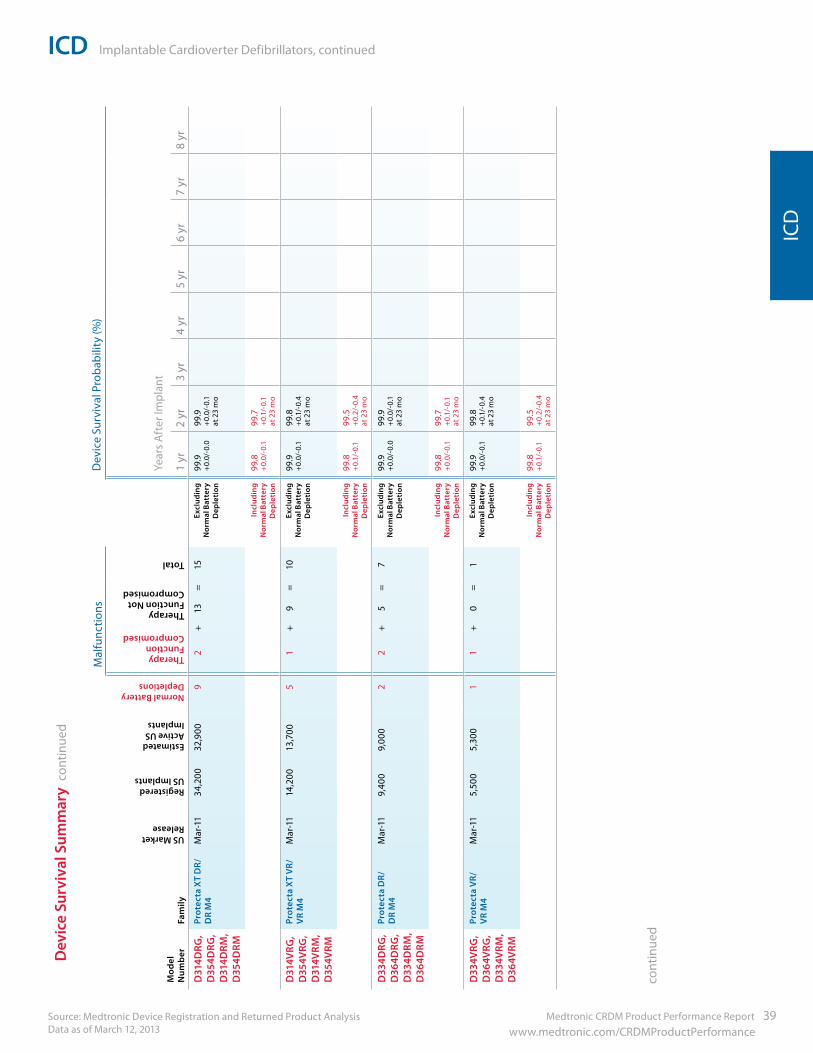
Medtronic CRDM Product Performance Report 39 www.medtronic.com/CRDMProductPerformance
ICD Implantable Cardioverter Defibrillators, continued
Source: Medtronic Device Registration and Returned Product Analysis Data as of March 12, 2013
ICD
Mod
el
Num
ber
Fam
ily
US Market Release
Registered US Implants
Estimated Active US Implants
Normal Battery Depletions
Mal
func
tions
Dev
ice
Surv
ival
Pro
babi
lity
(%)
Therapy Function Compromised
Therapy Function Not Compromised
Total
Year
s A
fter
Impl
ant
1 yr
2 yr
3 yr
4 yr
5 yr
6 yr
7 yr
8 yr
D31
4DRG
, D
354D
RG,
D31
4DRM
, D
354D
RM
Prot
ecta
XT
DR/
D
R M
4M
ar-1
134
,200
32,9
009
2+
13=
15Ex
clud
ing
Nor
mal
Bat
tery
D
eple
tion
99.9
+
0.0/
-0.0
99.9
+
0.0/
-0.1
at
23
mo
Incl
udin
g N
orm
al B
atte
ry
Dep
leti
on
99.8
+
0.0/
-0.1
99.7
+
0.1/
-0.1
at
23
mo
D31
4VRG
, D
354V
RG,
D31
4VRM
, D
354V
RM
Prot
ecta
XT
VR/
V
R M
4M
ar-1
114
,200
13,7
005
1+
9=
10Ex
clud
ing
Nor
mal
Bat
tery
D
eple
tion
99.9
+
0.0/
-0.1
99.8
+
0.1/
-0.4
at
23
mo
Incl
udin
g N
orm
al B
atte
ry
Dep
leti
on
99.8
+
0.1/
-0.1
99.5
+
0.2/
-0.4
at
23
mo
D33
4DRG
, D
364D
RG,
D33
4DRM
, D
364D
RM
Prot
ecta
DR/
D
R M
4M
ar-1
19,
400
9,00
02
2+
5=
7Ex
clud
ing
Nor
mal
Bat
tery
D
eple
tion
99.9
+
0.0/
-0.0
99.9
+
0.0/
-0.1
at
23
mo
Incl
udin
g N
orm
al B
atte
ry
Dep
leti
on
99.8
+
0.0/
-0.1
99.7
+
0.1/
-0.1
at
23
mo
D33
4VRG
, D
364V
RG,
D33
4VRM
, D
364V
RM
Prot
ecta
VR/
V
R M
4M
ar-1
15,
500
5,30
01
1+
0=
1Ex
clud
ing
Nor
mal
Bat
tery
D
eple
tion
99.9
+
0.0/
-0.1
99.8
+
0.1/
-0.4
at
23
mo
Incl
udin
g N
orm
al B
atte
ry
Dep
leti
on
99.8
+
0.1/
-0.1
99.5
+
0.2/
-0.4
at
23
mo
Dev
ice
Surv
ival
Sum
mar
y co
ntin
ued
cont
inue
d
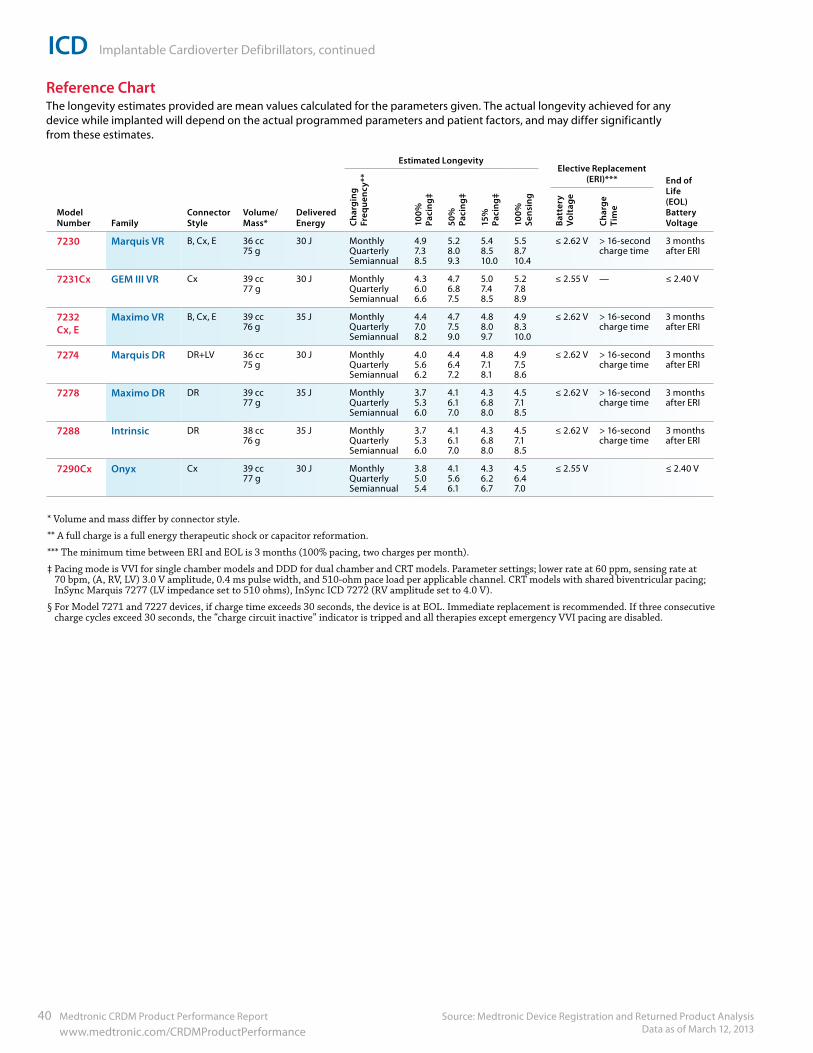
ICD Implantable Cardioverter Defibrillators, continued
Source: Medtronic Device Registration and Returned Product Analysis Data as of March 12, 2013
40 Medtronic CRDM Product Performance Report www.medtronic.com/CRDMProductPerformance
Reference ChartThe longevity estimates provided are mean values calculated for the parameters given. The actual longevity achieved for any device while implanted will depend on the actual programmed parameters and patient factors, and may differ significantly from these estimates.
* Volume and mass differ by connector style.
** A full charge is a full energy therapeutic shock or capacitor reformation.
*** The minimum time between ERI and EOL is 3 months (100% pacing, two charges per month).
‡ Pacing mode is VVI for single chamber models and DDD for dual chamber and CRT models. Parameter settings; lower rate at 60 ppm, sensing rate at 70 bpm, (A, RV, LV) 3.0 V amplitude, 0.4 ms pulse width, and 510-ohm pace load per applicable channel. CRT models with shared biventricular pacing; InSync Marquis 7277 (LV impedance set to 510 ohms), InSync ICD 7272 (RV amplitude set to 4.0 V).
§ For Model 7271 and 7227 devices, if charge time exceeds 30 seconds, the device is at EOL. Immediate replacement is recommended. If three consecutive charge cycles exceed 30 seconds, the “charge circuit inactive” indicator is tripped and all therapies except emergency VVI pacing are disabled.
Estimated LongevityElective Replacement
(ERI)***
ModelNumber Family
Connector Style
Volume/ Mass*
Delivered Energy Ch
argi
ng
Freq
uenc
y**
100%
Pa
cing
‡
50%
Pa
cing
‡
15%
Pa
cing
‡
100%
Se
nsin
g
End of Life (EOL) Battery VoltageBa
tter
y Vo
ltag
e
Char
ge
Tim
e
7230 Marquis VR B, Cx, E 36 cc 75 g
30 J Monthly Quarterly Semiannual
4.9 7.3 8.5
5.2 8.0 9.3
5.4 8.5 10.0
5.5 8.7 10.4
≤ 2.62 V > 16-second charge time
3 months after ERI
7231Cx GEM III VR Cx 39 cc 77 g
30 J Monthly Quarterly Semiannual
4.3 6.0 6.6
4.7 6.8 7.5
5.0 7.4 8.5
5.2 7.8 8.9
≤ 2.55 V — ≤ 2.40 V
7232 Cx, E
Maximo VR B, Cx, E 39 cc 76 g
35 J Monthly Quarterly Semiannual
4.4 7.0 8.2
4.7 7.5 9.0
4.8 8.0 9.7
4.9 8.3 10.0
≤ 2.62 V > 16-second charge time
3 months after ERI
7274 Marquis DR DR+LV 36 cc 75 g
30 J Monthly Quarterly Semiannual
4.0 5.6 6.2
4.4 6.4 7.2
4.8 7.1 8.1
4.9 7.5 8.6
≤ 2.62 V > 16-second charge time
3 months after ERI
7278 Maximo DR DR 39 cc 77 g
35 J Monthly Quarterly Semiannual
3.7 5.3 6.0
4.1 6.1 7.0
4.3 6.8 8.0
4.5 7.1 8.5
≤ 2.62 V > 16-second charge time
3 months after ERI
7288 Intrinsic DR 38 cc 76 g
35 J Monthly Quarterly Semiannual
3.7 5.3 6.0
4.1 6.1 7.0
4.3 6.8 8.0
4.5 7.1 8.5
≤ 2.62 V > 16-second charge time
3 months after ERI
7290Cx Onyx Cx 39 cc 77 g
30 J Monthly Quarterly Semiannual
3.8 5.0 5.4
4.1 5.6 6.1
4.3 6.2 6.7
4.5 6.4 7.0
≤ 2.55 V ≤ 2.40 V
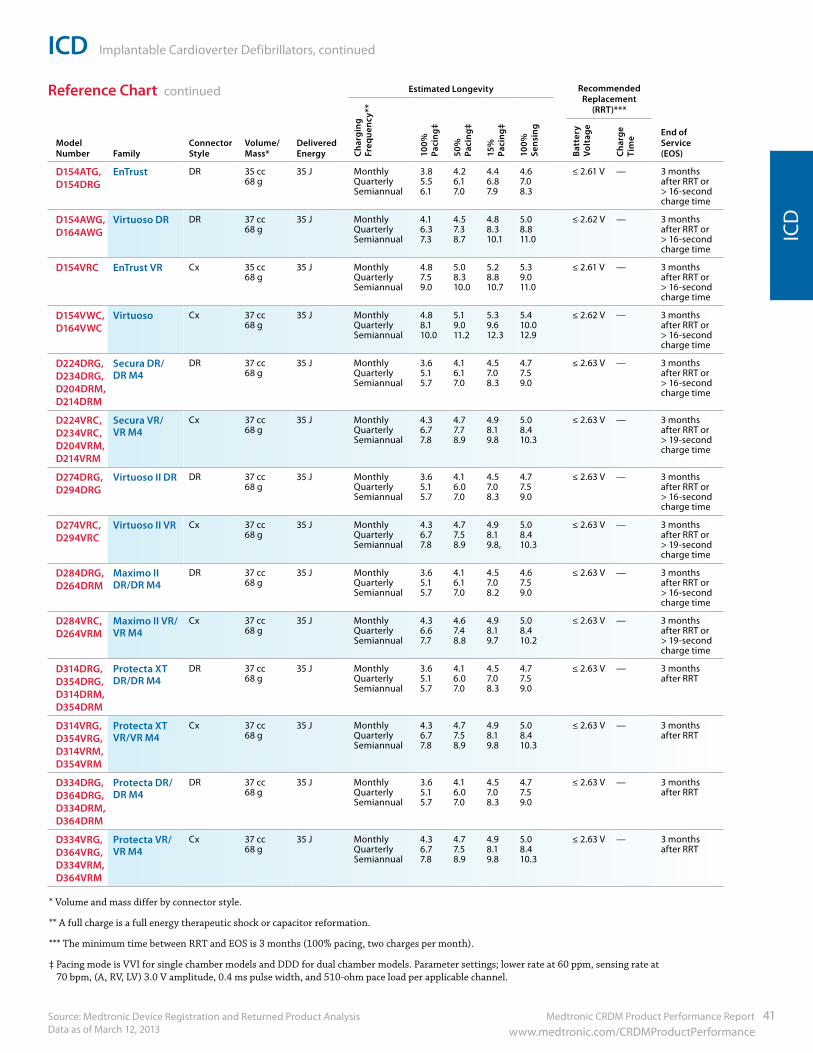
Medtronic CRDM Product Performance Report 41 www.medtronic.com/CRDMProductPerformance
ICD Implantable Cardioverter Defibrillators, continued
Source: Medtronic Device Registration and Returned Product Analysis Data as of March 12, 2013
ICD
Reference Chart continued
* Volume and mass differ by connector style.
** A full charge is a full energy therapeutic shock or capacitor reformation.
*** The minimum time between RRT and EOS is 3 months (100% pacing, two charges per month).
‡ Pacing mode is VVI for single chamber models and DDD for dual chamber models. Parameter settings; lower rate at 60 ppm, sensing rate at 70 bpm, (A, RV, LV) 3.0 V amplitude, 0.4 ms pulse width, and 510-ohm pace load per applicable channel.
Estimated Longevity Recommended Replacement
(RRT)***
ModelNumber Family
Connector Style
Volume/ Mass*
Delivered Energy Ch
argi
ng
Freq
uenc
y**
100%
Pa
cing
‡
50%
Pa
cing
‡
15%
Pa
cing
‡
100%
Se
nsin
g
End of Service(EOS)Ba
tter
y Vo
ltag
e
Char
ge
Tim
e
D154ATG, D154DRG
EnTrust DR 35 cc 68 g
35 J Monthly Quarterly Semiannual
3.8 5.5 6.1
4.2 6.1 7.0
4.4 6.8 7.9
4.6 7.0 8.3
≤ 2.61 V — 3 months after RRT or > 16-second charge time
D154AWG, D164AWG
Virtuoso DR DR 37 cc 68 g
35 J Monthly Quarterly Semiannual
4.1 6.3 7.3
4.5 7.3 8.7
4.8 8.3 10.1
5.0 8.8 11.0
≤ 2.62 V — 3 months after RRT or > 16-second charge time
D154VRC EnTrust VR Cx 35 cc 68 g
35 J Monthly Quarterly Semiannual
4.8 7.5 9.0
5.0 8.3 10.0
5.2 8.8 10.7
5.3 9.0 11.0
≤ 2.61 V — 3 months after RRT or > 16-second charge time
D154VWC, D164VWC
Virtuoso Cx 37 cc 68 g
35 J Monthly Quarterly Semiannual
4.8 8.1 10.0
5.1 9.0 11.2
5.3 9.6 12.3
5.4 10.0 12.9
≤ 2.62 V — 3 months after RRT or > 16-second charge time
D224DRG, D234DRG, D204DRM, D214DRM
Secura DR/ DR M4
DR 37 cc 68 g
35 J Monthly Quarterly Semiannual
3.6 5.1 5.7
4.1 6.1 7.0
4.5 7.0 8.3
4.7 7.5 9.0
≤ 2.63 V — 3 months after RRT or > 16-second charge time
D224VRC, D234VRC,D204VRM, D214VRM
Secura VR/ VR M4
Cx 37 cc 68 g
35 J Monthly Quarterly Semiannual
4.3 6.7 7.8
4.7 7.7 8.9
4.9 8.1 9.8
5.0 8.4 10.3
≤ 2.63 V — 3 months after RRT or > 19-second charge time
D274DRG, D294DRG
Virtuoso II DR DR 37 cc 68 g
35 J Monthly Quarterly Semiannual
3.6 5.1 5.7
4.1 6.0 7.0
4.5 7.0 8.3
4.7 7.5 9.0
≤ 2.63 V — 3 months after RRT or > 16-second charge time
D274VRC, D294VRC
Virtuoso II VR Cx 37 cc 68 g
35 J Monthly Quarterly Semiannual
4.3 6.7 7.8
4.7 7.5 8.9
4.9 8.1 9.8,
5.0 8.4 10.3
≤ 2.63 V — 3 months after RRT or > 19-second charge time
D284DRG, D264DRM
Maximo II DR/DR M4
DR 37 cc 68 g
35 J Monthly Quarterly Semiannual
3.6 5.1 5.7
4.1 6.1 7.0
4.5 7.0 8.2
4.6 7.5 9.0
≤ 2.63 V — 3 months after RRT or > 16-second charge time
D284VRC, D264VRM
Maximo II VR/VR M4
Cx 37 cc 68 g
35 J Monthly Quarterly Semiannual
4.3 6.6 7.7
4.6 7.4 8.8
4.9 8.1 9.7
5.0 8.4 10.2
≤ 2.63 V — 3 months after RRT or > 19-second charge time
D314DRG, D354DRG, D314DRM, D354DRM
Protecta XT DR/DR M4
DR 37 cc 68 g
35 J Monthly Quarterly Semiannual
3.65.15.7
4.16.07.0
4.57.08.3
4.77.59.0
≤ 2.63 V — 3 months after RRT
D314VRG, D354VRG, D314VRM, D354VRM
Protecta XT VR/VR M4
Cx 37 cc 68 g
35 J Monthly Quarterly Semiannual
4.36.77.8
4.77.58.9
4.98.19.8
5.08.410.3
≤ 2.63 V — 3 months after RRT
D334DRG, D364DRG, D334DRM, D364DRM
Protecta DR/ DR M4
DR 37 cc 68 g
35 J Monthly Quarterly Semiannual
3.65.15.7
4.16.07.0
4.57.08.3
4.77.59.0
≤ 2.63 V — 3 months after RRT
D334VRG, D364VRG, D334VRM, D364VRM
Protecta VR/ VR M4
Cx 37 cc 68 g
35 J Monthly Quarterly Semiannual
4.36.77.8
4.77.58.9
4.98.19.8
5.08.410.3
≤ 2.63 V — 3 months after RRT
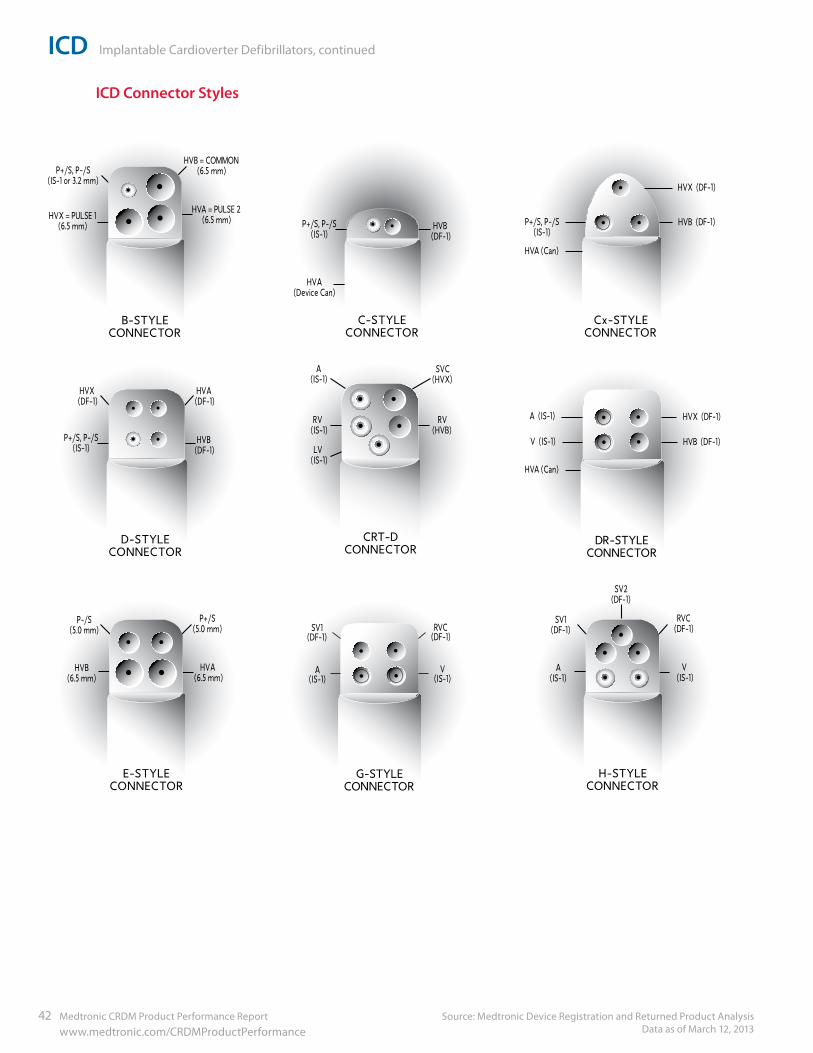
ICD Implantable Cardioverter Defibrillators, continued
Source: Medtronic Device Registration and Returned Product Analysis Data as of March 12, 2013
42 Medtronic CRDM Product Performance Report www.medtronic.com/CRDMProductPerformance
CRT-D CONNECTOR
HVA = PULSE 2 (6.5 mm)
HVX = PULSE 1
(6.5 mm)
HVB = COMMON (6.5 mm)
P+/S, P-/S
(IS-1 or 3.2 mm)
B-STYLE CONNECTOR
HVB (DF-1)
P+/S, P-/S (IS-1)
HVA (Device Can)
HVA (6.5 mm)
P+/S (5.0 mm)
C-STYLE CONNECTOR
HVB (DF-1)
P+/S, P-/S (IS-1)
HVA (DF-1)
HVX (DF-1)
E-STYLE CONNECTOR
D-STYLE CONNECTOR
HVB (DF-1) V (IS-1)
A (IS-1) HVX (DF-1)
HVA (Can)
DR-STYLE CONNECTOR
V (IS-1)
A (IS-1)
SV1 (DF-1)
RVC (DF-1)
G-STYLE CONNECTOR
HVB (DF-1) P+/S, P-/S (IS-1)
HVX (DF-1)
HVA (Can)
Cx-STYLE CONNECTOR
V (IS-1)
A (IS-1)
RVC (DF-1)
SV2 (DF-1)
SV1
(DF-1)
H-STYLE CONNECTOR
RV (HVB)
SVC (HVX)
RV (IS-1)
A (IS-1)
LV (IS-1)
HVB (6.5 mm)
P-/S (5.0 mm)
ICD Connector Styles
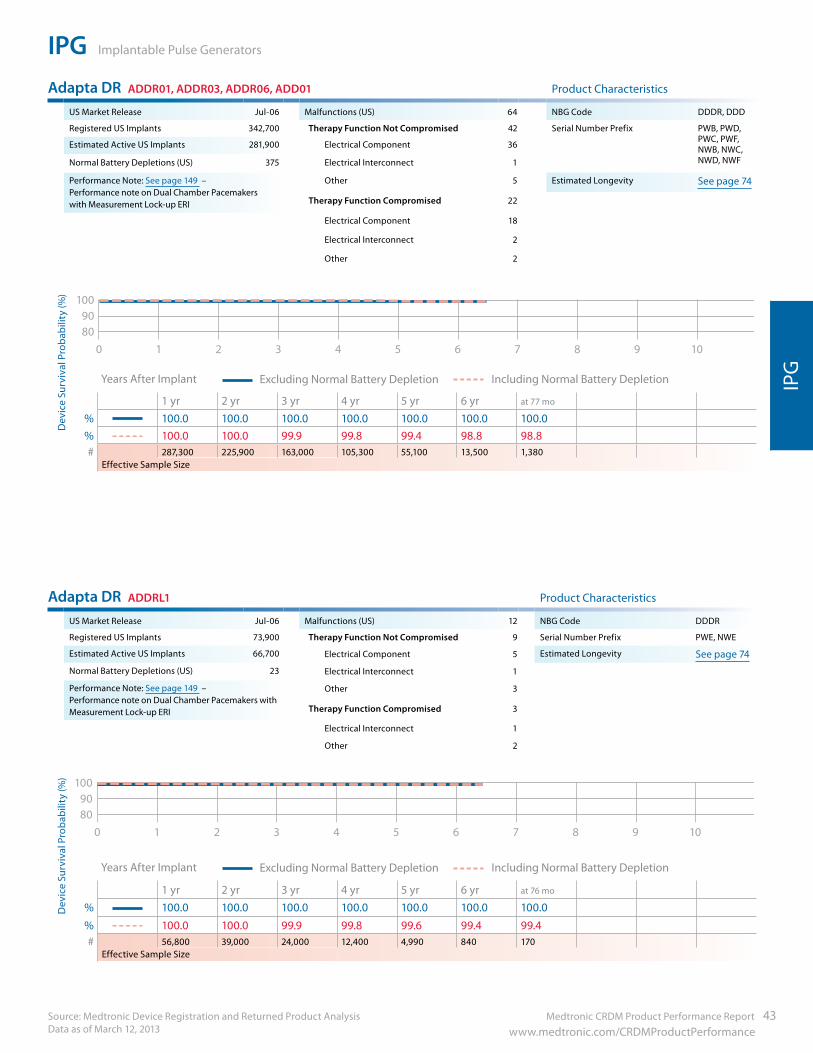
Medtronic CRDM Product Performance Report 43 www.medtronic.com/CRDMProductPerformance
IPG Implantable Pulse Generators
IPG
Source: Medtronic Device Registration and Returned Product Analysis Data as of March 12, 2013
Adapta DR ADDR01, ADDR03, ADDR06, ADD01 Product Characteristics
US Market Release Jul-06 Malfunctions (US) 64 NBG Code DDDR, DDD
Registered US Implants 342,700 Therapy Function Not Compromised 42 Serial Number Prefix PWB, PWD, PWC, PWF, NWB, NWC, NWD, NWF
Estimated Active US Implants 281,900 Electrical Component 36
Normal Battery Depletions (US) 375 Electrical Interconnect 1
Performance Note: See page 149 – Performance note on Dual Chamber Pacemakers with Measurement Lock-up ERI
Other 5 Estimated Longevity See page 74
Therapy Function Compromised 22
Electrical Component 18
Electrical Interconnect 2
Other 2
Survival Estimate of InSync II Marquis 7289 Jan 2009
90100
80109876543210
Years After Implant Excluding Normal Battery Depletion Including Normal Battery Depletion
1 yr 2 yr 3 yr 4 yr 5 yr 6 yr at 77 mo
% 100.0 100.0 100.0 100.0 100.0 100.0 100.0% 100.0 100.0 99.9 99.8 99.4 98.8 98.8# 287,300 225,900 163,000 105,300 55,100 13,500 1,380
Effective Sample Size
Adapta DR ADDRL1 Product Characteristics
US Market Release Jul-06 Malfunctions (US) 12 NBG Code DDDR
Registered US Implants 73,900 Therapy Function Not Compromised 9 Serial Number Prefix PWE, NWE
Estimated Active US Implants 66,700 Electrical Component 5 Estimated Longevity See page 74
Normal Battery Depletions (US) 23 Electrical Interconnect 1
Performance Note: See page 149 – Performance note on Dual Chamber Pacemakers with Measurement Lock-up ERI
Other 3
Therapy Function Compromised 3
Electrical Interconnect 1
Other 2
Survival Estimate of InSync II Marquis 7289 Jan 2009
90100
80109876543210
Years After Implant Excluding Normal Battery Depletion Including Normal Battery Depletion
1 yr 2 yr 3 yr 4 yr 5 yr 6 yr at 76 mo
% 100.0 100.0 100.0 100.0 100.0 100.0 100.0% 100.0 100.0 99.9 99.8 99.6 99.4 99.4# 56,800 39,000 24,000 12,400 4,990 840 170
Effective Sample Size
Dev
ice
Surv
ival
Pro
babi
lity
(%)
Dev
ice
Surv
ival
Pro
babi
lity
(%)
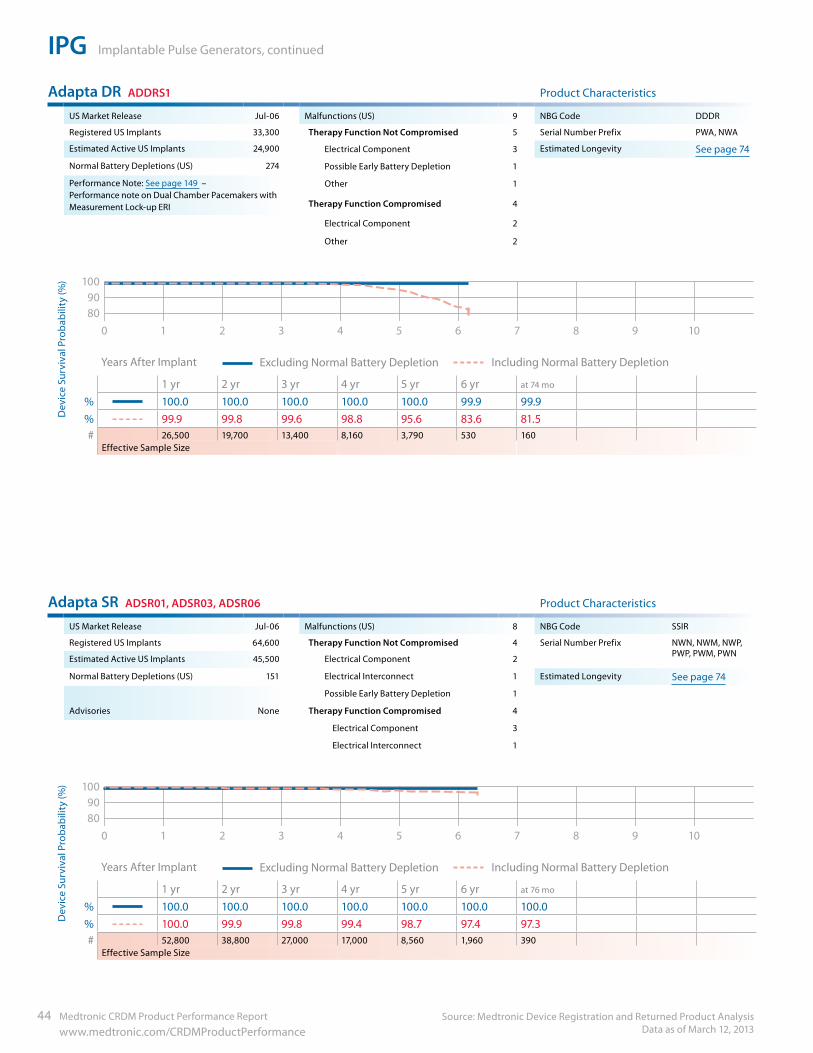
IPG Implantable Pulse Generators, continued
Source: Medtronic Device Registration and Returned Product Analysis Data as of March 12, 2013
44 Medtronic CRDM Product Performance Report www.medtronic.com/CRDMProductPerformance
Adapta DR ADDRS1 Product Characteristics
US Market Release Jul-06 Malfunctions (US) 9 NBG Code DDDR
Registered US Implants 33,300 Therapy Function Not Compromised 5 Serial Number Prefix PWA, NWA
Estimated Active US Implants 24,900 Electrical Component 3 Estimated Longevity See page 74
Normal Battery Depletions (US) 274 Possible Early Battery Depletion 1
Performance Note: See page 149 – Performance note on Dual Chamber Pacemakers with Measurement Lock-up ERI
Other 1
Therapy Function Compromised 4
Electrical Component 2
Other 2
Survival Estimate of InSync II Marquis 7289 Jan 2009
90100
80109876543210
Years After Implant Excluding Normal Battery Depletion Including Normal Battery Depletion
1 yr 2 yr 3 yr 4 yr 5 yr 6 yr at 74 mo
% 100.0 100.0 100.0 100.0 100.0 99.9 99.9% 99.9 99.8 99.6 98.8 95.6 83.6 81.5# 26,500 19,700 13,400 8,160 3,790 530 160
Effective Sample Size
Adapta SR ADSR01, ADSR03, ADSR06 Product Characteristics
US Market Release Jul-06 Malfunctions (US) 8 NBG Code SSIR
Registered US Implants 64,600 Therapy Function Not Compromised 4 Serial Number Prefix NWN, NWM, NWP, PWP, PWM, PWN
Estimated Active US Implants 45,500 Electrical Component 2
Normal Battery Depletions (US) 151 Electrical Interconnect 1 Estimated Longevity See page 74
Possible Early Battery Depletion 1
Advisories None Therapy Function Compromised 4
Electrical Component 3
Electrical Interconnect 1
Survival Estimate of InSync II Marquis 7289 Jan 2009
90100
80109876543210
Years After Implant Excluding Normal Battery Depletion Including Normal Battery Depletion
1 yr 2 yr 3 yr 4 yr 5 yr 6 yr at 76 mo
% 100.0 100.0 100.0 100.0 100.0 100.0 100.0% 100.0 99.9 99.8 99.4 98.7 97.4 97.3# 52,800 38,800 27,000 17,000 8,560 1,960 390
Effective Sample Size
Dev
ice
Surv
ival
Pro
babi
lity
(%)
Dev
ice
Surv
ival
Pro
babi
lity
(%)
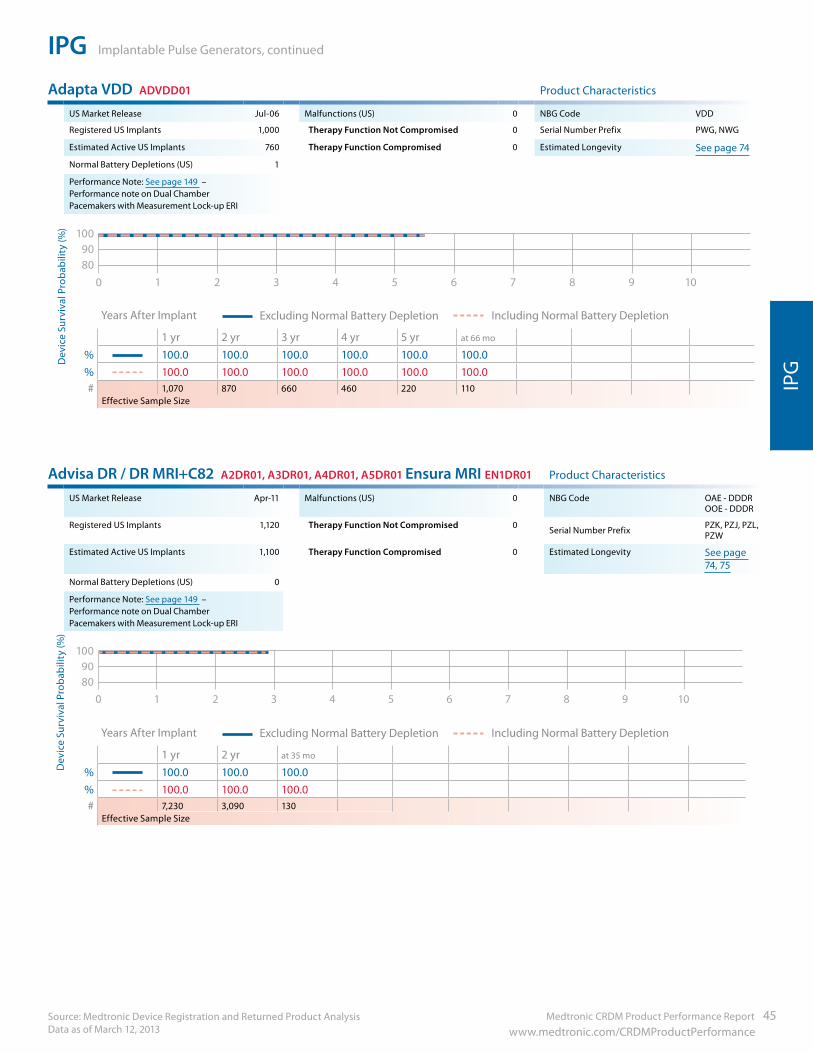
Medtronic CRDM Product Performance Report 45 www.medtronic.com/CRDMProductPerformance
IPG Implantable Pulse Generators, continued
Source: Medtronic Device Registration and Returned Product Analysis Data as of March 12, 2013
IPG
Adapta VDD ADVDD01 Product Characteristics
US Market Release Jul-06 Malfunctions (US) 0 NBG Code VDD
Registered US Implants 1,000 Therapy Function Not Compromised 0 Serial Number Prefix PWG, NWG
Estimated Active US Implants 760 Therapy Function Compromised 0 Estimated Longevity See page 74
Normal Battery Depletions (US) 1
Performance Note: See page 149 – Performance note on Dual Chamber Pacemakers with Measurement Lock-up ERI
90100
80109876543210
Years After Implant Excluding Normal Battery Depletion Including Normal Battery Depletion
1 yr 2 yr 3 yr 4 yr 5 yr at 66 mo
% 100.0 100.0 100.0 100.0 100.0 100.0% 100.0 100.0 100.0 100.0 100.0 100.0# 1,070 870 660 460 220 110
Effective Sample Size
Advisa DR / DR MRI+C82 A2DR01, A3DR01, A4DR01, A5DR01 Ensura MRI EN1DR01 Product Characteristics
US Market Release Apr-11 Malfunctions (US) 0 NBG Code OAE - DDDR OOE - DDDR
Registered US Implants 1,120 Therapy Function Not Compromised 0 Serial Number Prefix PZK, PZJ, PZL, PZW
Estimated Active US Implants 1,100 Therapy Function Compromised 0 Estimated Longevity See page 74, 75
Normal Battery Depletions (US) 0
Performance Note: See page 149 – Performance note on Dual Chamber Pacemakers with Measurement Lock-up ERI
Survival Estimate of InSync II Marquis 7289 Jan 2009
90100
80109876543210
Years After Implant Excluding Normal Battery Depletion Including Normal Battery Depletion
1 yr 2 yr at 35 mo
% 100.0 100.0 100.0% 100.0 100.0 100.0# 7,230 3,090 130
Effective Sample Size
Dev
ice
Surv
ival
Pro
babi
lity
(%)
Dev
ice
Surv
ival
Pro
babi
lity
(%)
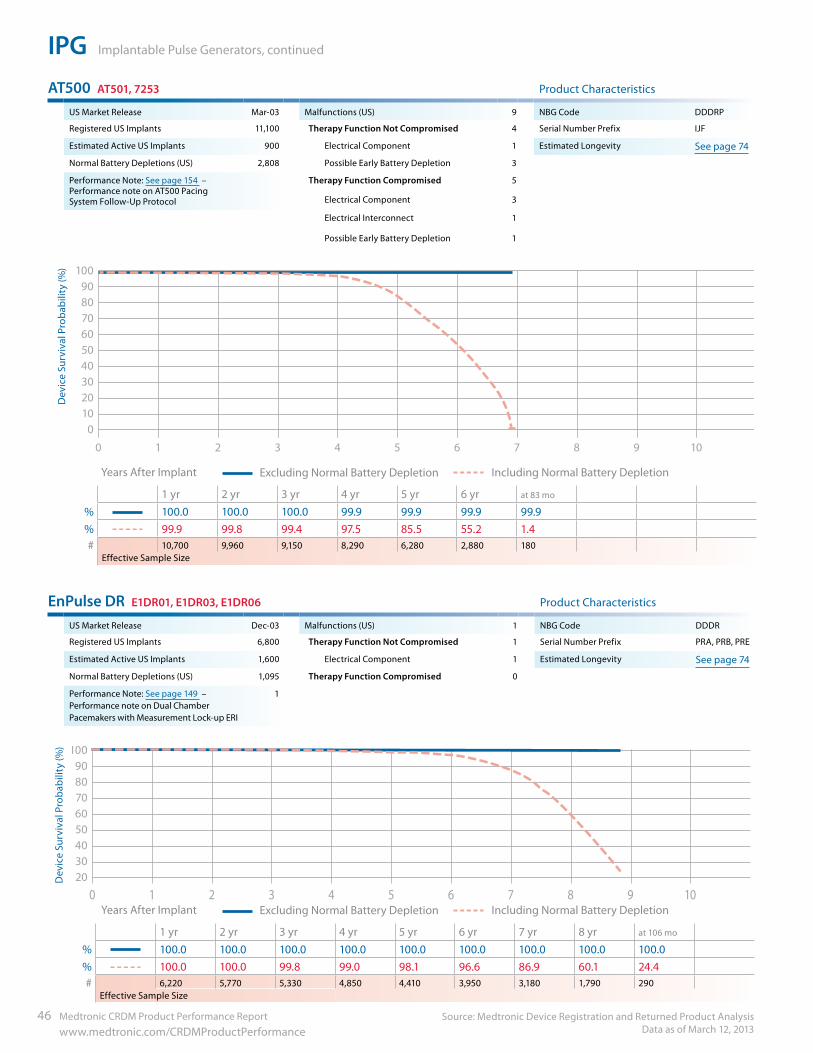
IPG Implantable Pulse Generators, continued
Source: Medtronic Device Registration and Returned Product Analysis Data as of March 12, 2013
46 Medtronic CRDM Product Performance Report www.medtronic.com/CRDMProductPerformance
AT500 AT501, 7253 Product Characteristics
US Market Release Mar-03 Malfunctions (US) 9 NBG Code DDDRP
Registered US Implants 11,100 Therapy Function Not Compromised 4 Serial Number Prefix IJF
Estimated Active US Implants 900 Electrical Component 1 Estimated Longevity See page 74
Normal Battery Depletions (US) 2,808 Possible Early Battery Depletion 3
Performance Note: See page 154 – Performance note on AT500 Pacing System Follow-Up Protocol
Therapy Function Compromised 5
Electrical Component 3
Electrical Interconnect 1
Possible Early Battery Depletion 1
Survival Estimate of InSync II Marquis 7289 Jan 2009
90100
8070605040302010
0
109876543210
Years After Implant Excluding Normal Battery Depletion Including Normal Battery Depletion
1 yr 2 yr 3 yr 4 yr 5 yr 6 yr at 83 mo
% 100.0 100.0 100.0 99.9 99.9 99.9 99.9% 99.9 99.8 99.4 97.5 85.5 55.2 1.4# 10,700 9,960 9,150 8,290 6,280 2,880 180
Effective Sample Size
EnPulse DR E1DR01, E1DR03, E1DR06 Product Characteristics
US Market Release Dec-03 Malfunctions (US) 1 NBG Code DDDR
Registered US Implants 6,800 Therapy Function Not Compromised 1 Serial Number Prefix PRA, PRB, PRE
Estimated Active US Implants 1,600 Electrical Component 1 Estimated Longevity See page 74
Normal Battery Depletions (US) 1,095 Therapy Function Compromised 0
Performance Note: See page 149 – Performance note on Dual Chamber Pacemakers with Measurement Lock-up ERI
1
90100
8070605040302010
0109876543210
Years After Implant Excluding Normal Battery Depletion Including Normal Battery Depletion
1 yr 2 yr 3 yr 4 yr 5 yr 6 yr 7 yr 8 yr at 106 mo
% 100.0 100.0 100.0 100.0 100.0 100.0 100.0 100.0 100.0% 100.0 100.0 99.8 99.0 98.1 96.6 86.9 60.1 24.4# 6,220 5,770 5,330 4,850 4,410 3,950 3,180 1,790 290
Effective Sample Size
Dev
ice
Surv
ival
Pro
babi
lity
(%)
Dev
ice
Surv
ival
Pro
babi
lity
(%)

Medtronic CRDM Product Performance Report 47 www.medtronic.com/CRDMProductPerformance
IPG Implantable Pulse Generators, continued
Source: Medtronic Device Registration and Returned Product Analysis Data as of March 12, 2013
IPG
EnPulse DR E1DR21 Product Characteristics
US Market Release Dec-03 Malfunctions (US) 0 NBG Code DDDR
Registered US Implants 1,900 Therapy Function Not Compromised 0 Serial Number Prefix PPT
Estimated Active US Implants 160 Therapy Function Compromised 0 Estimated Longevity See page 74
Normal Battery Depletions (US) 373
Performance Note: See page 149 – Performance note on Dual Chamber Pacemakers with Measurement Lock-up ERI
90100
8070605040302010
0109876543210
Years After Implant Excluding Normal Battery Depletion Including Normal Battery Depletion
1 yr 2 yr 3 yr 4 yr 5 yr 6 yr at 80 mo
% 100.0 100.0 100.0 100.0 100.0 100.0 100.0% 100.0 99.6 98.6 96.2 91.9 61.3 23.4# 1,640 1,490 1,330 1,160 970 460 110
Effective Sample Size
Dev
ice
Surv
ival
Pro
babi
lity
(%)
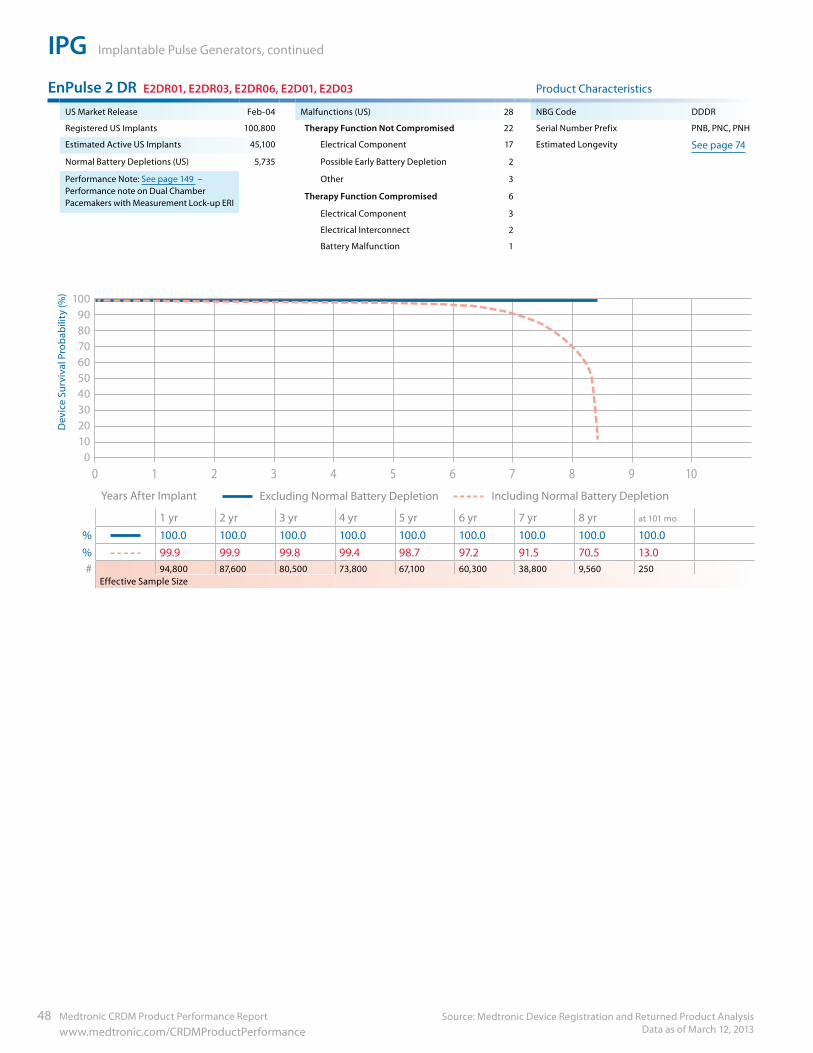
IPG Implantable Pulse Generators, continued
Source: Medtronic Device Registration and Returned Product Analysis Data as of March 12, 2013
48 Medtronic CRDM Product Performance Report www.medtronic.com/CRDMProductPerformance
EnPulse 2 DR E2DR01, E2DR03, E2DR06, E2D01, E2D03 Product Characteristics
US Market Release Feb-04 Malfunctions (US) 28 NBG Code DDDR
Registered US Implants 100,800 Therapy Function Not Compromised 22 Serial Number Prefix PNB, PNC, PNH
Estimated Active US Implants 45,100 Electrical Component 17 Estimated Longevity See page 74
Normal Battery Depletions (US) 5,735 Possible Early Battery Depletion 2
Performance Note: See page 149 – Performance note on Dual Chamber Pacemakers with Measurement Lock-up ERI
Other 3
Therapy Function Compromised 6
Electrical Component 3
Electrical Interconnect 2
Battery Malfunction 1
90100
8070605040302010
0109876543210
Years After Implant Excluding Normal Battery Depletion Including Normal Battery Depletion
1 yr 2 yr 3 yr 4 yr 5 yr 6 yr 7 yr 8 yr at 101 mo
% 100.0 100.0 100.0 100.0 100.0 100.0 100.0 100.0 100.0% 99.9 99.9 99.8 99.4 98.7 97.2 91.5 70.5 13.0# 94,800 87,600 80,500 73,800 67,100 60,300 38,800 9,560 250
Effective Sample Size
Dev
ice
Surv
ival
Pro
babi
lity
(%)
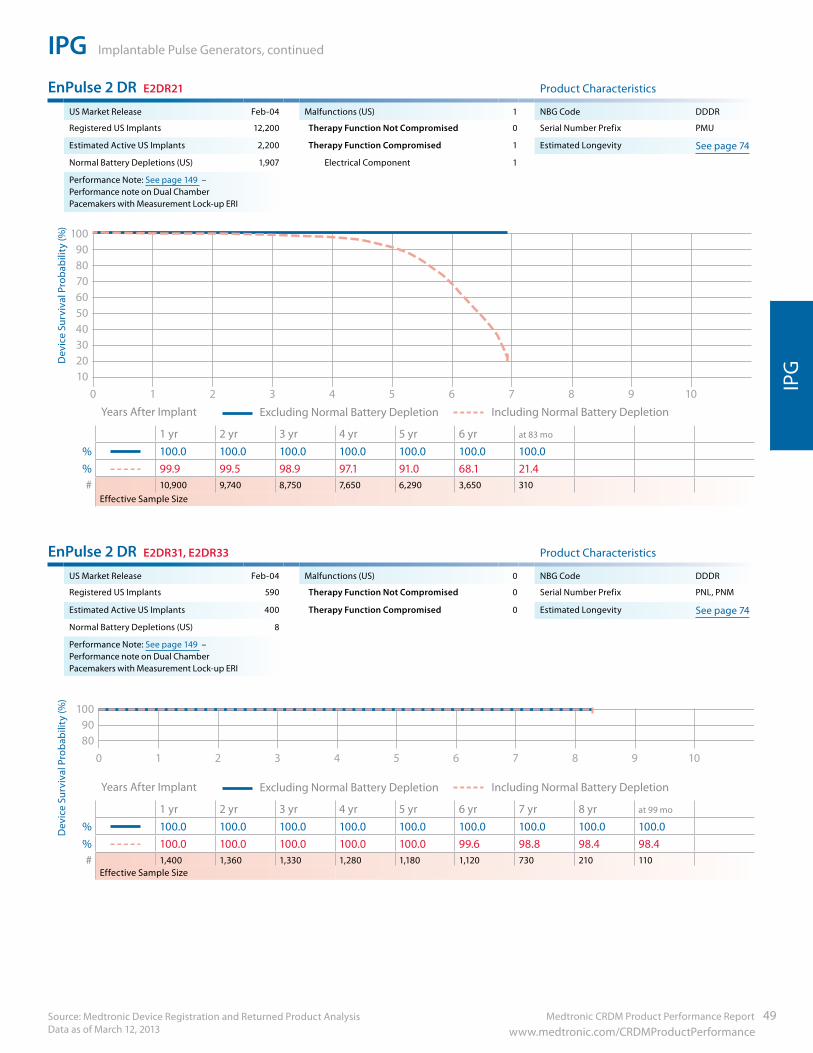
Medtronic CRDM Product Performance Report 49 www.medtronic.com/CRDMProductPerformance
IPG Implantable Pulse Generators, continued
Source: Medtronic Device Registration and Returned Product Analysis Data as of March 12, 2013
IPG
EnPulse 2 DR E2DR21 Product Characteristics
US Market Release Feb-04 Malfunctions (US) 1 NBG Code DDDR
Registered US Implants 12,200 Therapy Function Not Compromised 0 Serial Number Prefix PMU
Estimated Active US Implants 2,200 Therapy Function Compromised 1 Estimated Longevity See page 74
Normal Battery Depletions (US) 1,907 Electrical Component 1
Performance Note: See page 149 – Performance note on Dual Chamber Pacemakers with Measurement Lock-up ERI
8070605040302010
0 109876543210
90100
Years After Implant Excluding Normal Battery Depletion Including Normal Battery Depletion
1 yr 2 yr 3 yr 4 yr 5 yr 6 yr at 83 mo
% 100.0 100.0 100.0 100.0 100.0 100.0 100.0% 99.9 99.5 98.9 97.1 91.0 68.1 21.4# 10,900 9,740 8,750 7,650 6,290 3,650 310
Effective Sample Size
EnPulse 2 DR E2DR31, E2DR33 Product Characteristics
US Market Release Feb-04 Malfunctions (US) 0 NBG Code DDDR
Registered US Implants 590 Therapy Function Not Compromised 0 Serial Number Prefix PNL, PNM
Estimated Active US Implants 400 Therapy Function Compromised 0 Estimated Longevity See page 74
Normal Battery Depletions (US) 8
Performance Note: See page 149 – Performance note on Dual Chamber Pacemakers with Measurement Lock-up ERI
90100
80109876543210
Years After Implant Excluding Normal Battery Depletion Including Normal Battery Depletion
1 yr 2 yr 3 yr 4 yr 5 yr 6 yr 7 yr 8 yr at 99 mo
% 100.0 100.0 100.0 100.0 100.0 100.0 100.0 100.0 100.0% 100.0 100.0 100.0 100.0 100.0 99.6 98.8 98.4 98.4# 1,400 1,360 1,330 1,280 1,180 1,120 730 210 110
Effective Sample Size
Dev
ice
Surv
ival
Pro
babi
lity
(%)
Dev
ice
Surv
ival
Pro
babi
lity
(%)
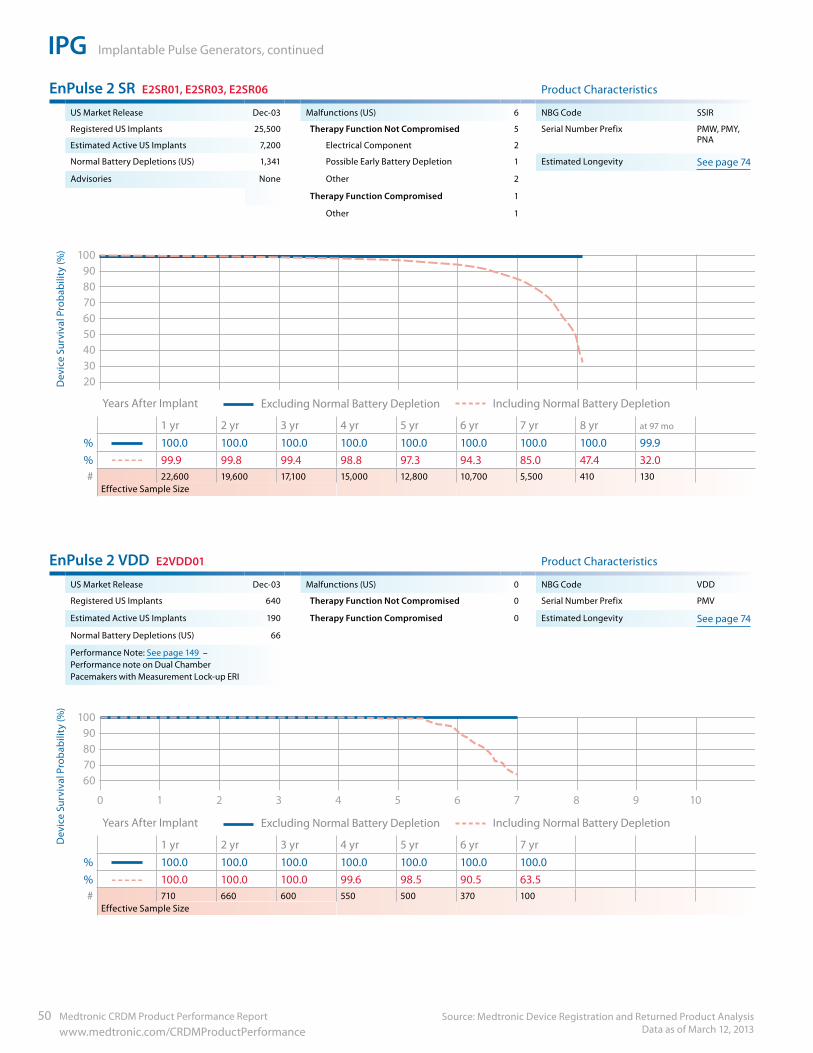
IPG Implantable Pulse Generators, continued
Source: Medtronic Device Registration and Returned Product Analysis Data as of March 12, 2013
50 Medtronic CRDM Product Performance Report www.medtronic.com/CRDMProductPerformance
EnPulse 2 SR E2SR01, E2SR03, E2SR06 Product Characteristics
US Market Release Dec-03 Malfunctions (US) 6 NBG Code SSIR
Registered US Implants 25,500 Therapy Function Not Compromised 5 Serial Number Prefix PMW, PMY, PNA
Estimated Active US Implants 7,200 Electrical Component 2
Normal Battery Depletions (US) 1,341 Possible Early Battery Depletion 1 Estimated Longevity See page 74
Advisories None Other 2
Therapy Function Compromised 1
Other 1
90100
8070605040302010
0
109876543210
109876543210 Years After Implant Excluding Normal Battery Depletion Including Normal Battery Depletion
1 yr 2 yr 3 yr 4 yr 5 yr 6 yr 7 yr 8 yr at 97 mo
% 100.0 100.0 100.0 100.0 100.0 100.0 100.0 100.0 99.9% 99.9 99.8 99.4 98.8 97.3 94.3 85.0 47.4 32.0# 22,600 19,600 17,100 15,000 12,800 10,700 5,500 410 130
Effective Sample Size
EnPulse 2 VDD E2VDD01 Product Characteristics
US Market Release Dec-03 Malfunctions (US) 0 NBG Code VDD
Registered US Implants 640 Therapy Function Not Compromised 0 Serial Number Prefix PMV
Estimated Active US Implants 190 Therapy Function Compromised 0 Estimated Longevity See page 74
Normal Battery Depletions (US) 66
Performance Note: See page 149 – Performance note on Dual Chamber Pacemakers with Measurement Lock-up ERI
90100
8070605040302010
0
109876543210
109876543210
Years After Implant Excluding Normal Battery Depletion Including Normal Battery Depletion
1 yr 2 yr 3 yr 4 yr 5 yr 6 yr 7 yr% 100.0 100.0 100.0 100.0 100.0 100.0 100.0% 100.0 100.0 100.0 99.6 98.5 90.5 63.5# 710 660 600 550 500 370 100
Effective Sample Size
Dev
ice
Surv
ival
Pro
babi
lity
(%)
Dev
ice
Surv
ival
Pro
babi
lity
(%)

Medtronic CRDM Product Performance Report 51 www.medtronic.com/CRDMProductPerformance
IPG Implantable Pulse Generators, continued
Source: Medtronic Device Registration and Returned Product Analysis Data as of March 12, 2013
IPG
EnRhythm DR P1501DR Product Characteristics
US Market Release May-05 Malfunctions (US) 5,950 NBG Code DDDRP
Registered US Implants 110,100 Therapy Function Not Compromised 5,897 Serial Number Prefix PNP
Estimated Active US Implants 67,300 Battery (215 malfunctions related to advisory) 5,763 Estimated Longevity See page 74
Normal Battery Depletions (US) 1,013 Electrical Component (2 malfunctions related to advisory)
38
Possible Early Battery Depletion 37
Electrical Interconnect 2
Other 57
Therapy Function Compromised 53
Electrical Component 37
Electrical Interconnect 4
Battery Malfunction 5
Possible Early Battery Depletion 2
Other 5
90100
8070605040302010
0
109876543210
109876543210 Years After Implant Excluding Normal Battery Depletion Including Normal Battery Depletion
1 yr 2 yr 3 yr 4 yr 5 yr 6 yr 7 yr at 86 mo
% 100.0 100.0 99.9 99.1 96.2 89.4 85.4 85.0% 99.9 99.9 99.6 97.9 91.8 76.8 61.1 54.6# 103,900 94,200 78,300 61,600 44,500 25,100 4,460 1,300
Effective Sample Size
Dev
ice
Surv
ival
Pro
babi
lity
(%)
Advisories: See page 140 – 2010 Low Battery Voltage Displayed at Device Interrogation
Performance Note: See page 151 – Anomalies in MOSFET Integrated Circuit Technology
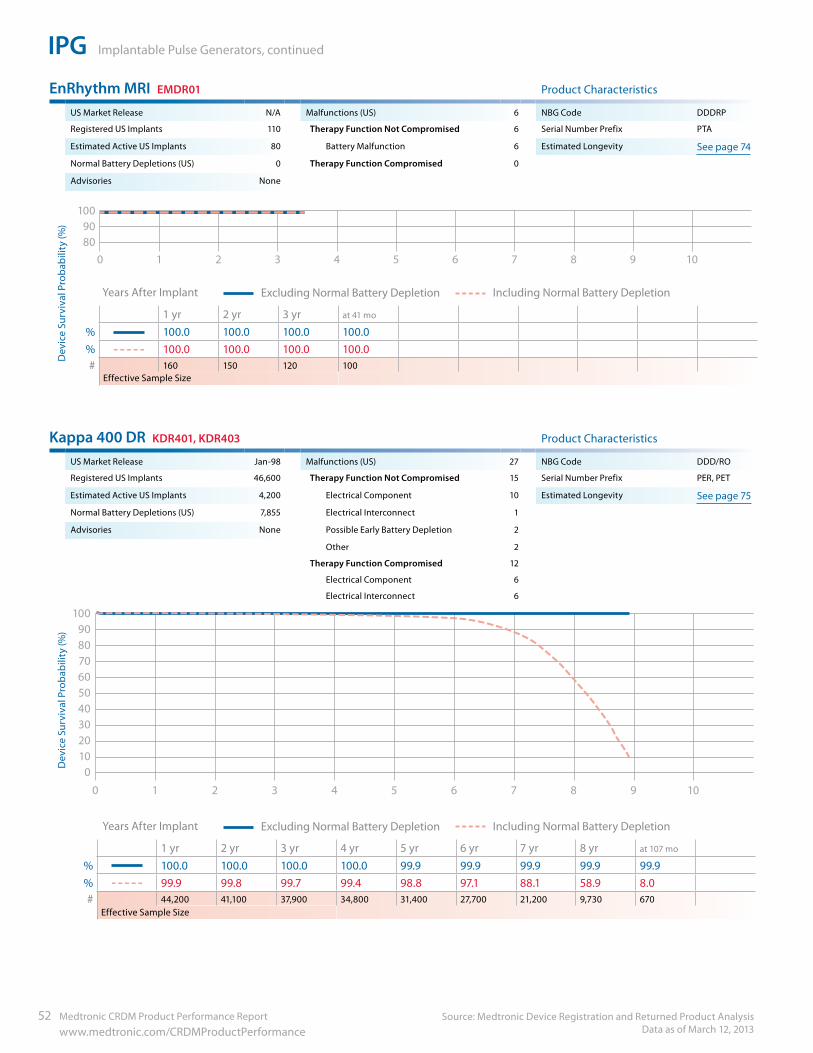
IPG Implantable Pulse Generators, continued
Source: Medtronic Device Registration and Returned Product Analysis Data as of March 12, 2013
52 Medtronic CRDM Product Performance Report www.medtronic.com/CRDMProductPerformance
EnRhythm MRI EMDR01 Product Characteristics
US Market Release N/A Malfunctions (US) 6 NBG Code DDDRP
Registered US Implants 110 Therapy Function Not Compromised 6 Serial Number Prefix PTA
Estimated Active US Implants 80 Battery Malfunction 6 Estimated Longevity See page 74
Normal Battery Depletions (US) 0 Therapy Function Compromised 0
Advisories None
90100
80109876543210
Years After Implant Excluding Normal Battery Depletion Including Normal Battery Depletion
1 yr 2 yr 3 yr at 41 mo
% 100.0 100.0 100.0 100.0% 100.0 100.0 100.0 100.0# 160 150 120 100
Effective Sample Size
Kappa 400 DR KDR401, KDR403 Product Characteristics
US Market Release Jan-98 Malfunctions (US) 27 NBG Code DDD/RO
Registered US Implants 46,600 Therapy Function Not Compromised 15 Serial Number Prefix PER, PET
Estimated Active US Implants 4,200 Electrical Component 10 Estimated Longevity See page 75
Normal Battery Depletions (US) 7,855 Electrical Interconnect 1
Advisories None Possible Early Battery Depletion 2
Other 2
Therapy Function Compromised 12
Electrical Component 6
Electrical Interconnect 6
90100
8070605040302010
0
109876543210
Years After Implant Excluding Normal Battery Depletion Including Normal Battery Depletion
1 yr 2 yr 3 yr 4 yr 5 yr 6 yr 7 yr 8 yr at 107 mo
% 100.0 100.0 100.0 100.0 99.9 99.9 99.9 99.9 99.9% 99.9 99.8 99.7 99.4 98.8 97.1 88.1 58.9 8.0# 44,200 41,100 37,900 34,800 31,400 27,700 21,200 9,730 670
Effective Sample Size
Dev
ice
Surv
ival
Pro
babi
lity
(%)
Dev
ice
Surv
ival
Pro
babi
lity
(%)
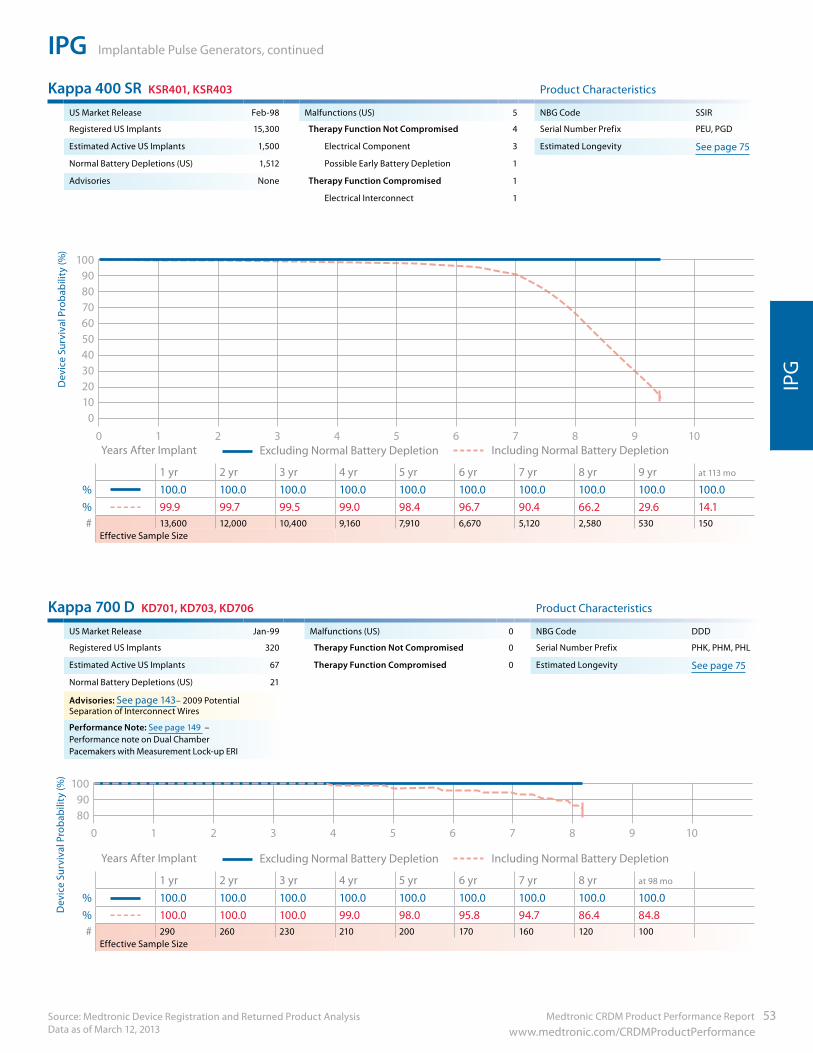
Medtronic CRDM Product Performance Report 53 www.medtronic.com/CRDMProductPerformance
IPG Implantable Pulse Generators, continued
Source: Medtronic Device Registration and Returned Product Analysis Data as of March 12, 2013
IPG
Kappa 400 SR KSR401, KSR403 Product Characteristics
US Market Release Feb-98 Malfunctions (US) 5 NBG Code SSIR
Registered US Implants 15,300 Therapy Function Not Compromised 4 Serial Number Prefix PEU, PGD
Estimated Active US Implants 1,500 Electrical Component 3 Estimated Longevity See page 75
Normal Battery Depletions (US) 1,512 Possible Early Battery Depletion 1
Advisories None Therapy Function Compromised 1
Electrical Interconnect 1
90100
8070605040302010
0
109876543210 Years After Implant Excluding Normal Battery Depletion Including Normal Battery Depletion
1 yr 2 yr 3 yr 4 yr 5 yr 6 yr 7 yr 8 yr 9 yr at 113 mo
% 100.0 100.0 100.0 100.0 100.0 100.0 100.0 100.0 100.0 100.0% 99.9 99.7 99.5 99.0 98.4 96.7 90.4 66.2 29.6 14.1# 13,600 12,000 10,400 9,160 7,910 6,670 5,120 2,580 530 150
Effective Sample Size
Kappa 700 D KD701, KD703, KD706 Product Characteristics
US Market Release Jan-99 Malfunctions (US) 0 NBG Code DDD
Registered US Implants 320 Therapy Function Not Compromised 0 Serial Number Prefix PHK, PHM, PHL
Estimated Active US Implants 67 Therapy Function Compromised 0 Estimated Longevity See page 75
Normal Battery Depletions (US) 21
Advisories: See page 143– 2009 Potential Separation of Interconnect Wires
Performance Note: See page 149 – Performance note on Dual Chamber Pacemakers with Measurement Lock-up ERI
90100
80109876543210
Years After Implant Excluding Normal Battery Depletion Including Normal Battery Depletion
1 yr 2 yr 3 yr 4 yr 5 yr 6 yr 7 yr 8 yr at 98 mo
% 100.0 100.0 100.0 100.0 100.0 100.0 100.0 100.0 100.0% 100.0 100.0 100.0 99.0 98.0 95.8 94.7 86.4 84.8# 290 260 230 210 200 170 160 120 100
Effective Sample Size
Dev
ice
Surv
ival
Pro
babi
lity
(%)
Dev
ice
Surv
ival
Pro
babi
lity
(%)
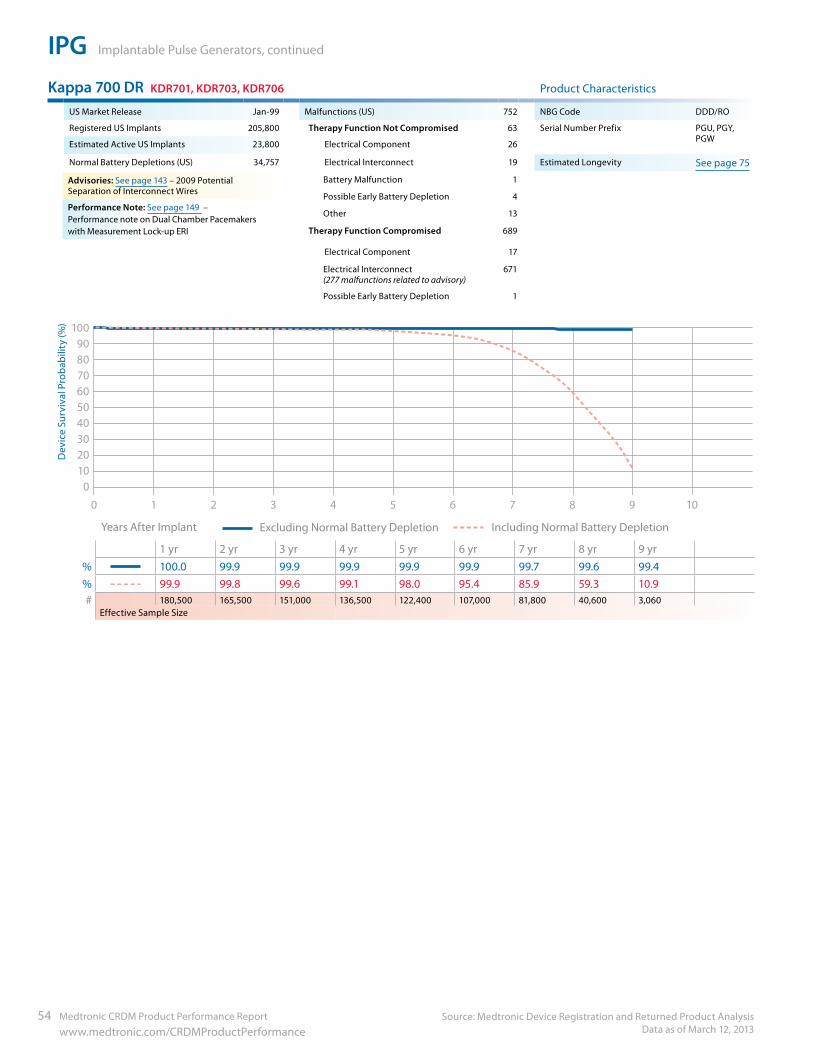
IPG Implantable Pulse Generators, continued
Source: Medtronic Device Registration and Returned Product Analysis Data as of March 12, 2013
54 Medtronic CRDM Product Performance Report www.medtronic.com/CRDMProductPerformance
Kappa 700 DR KDR701, KDR703, KDR706 Product Characteristics
US Market Release Jan-99 Malfunctions (US) 752 NBG Code DDD/RO
Registered US Implants 205,800 Therapy Function Not Compromised 63 Serial Number Prefix PGU, PGY, PGW
Estimated Active US Implants 23,800 Electrical Component 26
Normal Battery Depletions (US) 34,757 Electrical Interconnect 19 Estimated Longevity See page 75
Battery Malfunction 1
Possible Early Battery Depletion 4
Other 13
Therapy Function Compromised 689
Electrical Component 17
Electrical Interconnect (277 malfunctions related to advisory)
671
Possible Early Battery Depletion 1
90100
8070605040302010
0
109876543210
Years After Implant Excluding Normal Battery Depletion Including Normal Battery Depletion
1 yr 2 yr 3 yr 4 yr 5 yr 6 yr 7 yr 8 yr 9 yr% 100.0 99.9 99.9 99.9 99.9 99.9 99.7 99.6 99.4% 99.9 99.8 99.6 99.1 98.0 95.4 85.9 59.3 10.9# 180,500 165,500 151,000 136,500 122,400 107,000 81,800 40,600 3,060
Effective Sample Size
Dev
ice
Surv
ival
Pro
babi
lity
(%)
Advisories: See page 143 – 2009 Potential Separation of Interconnect Wires
Performance Note: See page 149 – Performance note on Dual Chamber Pacemakers with Measurement Lock-up ERI
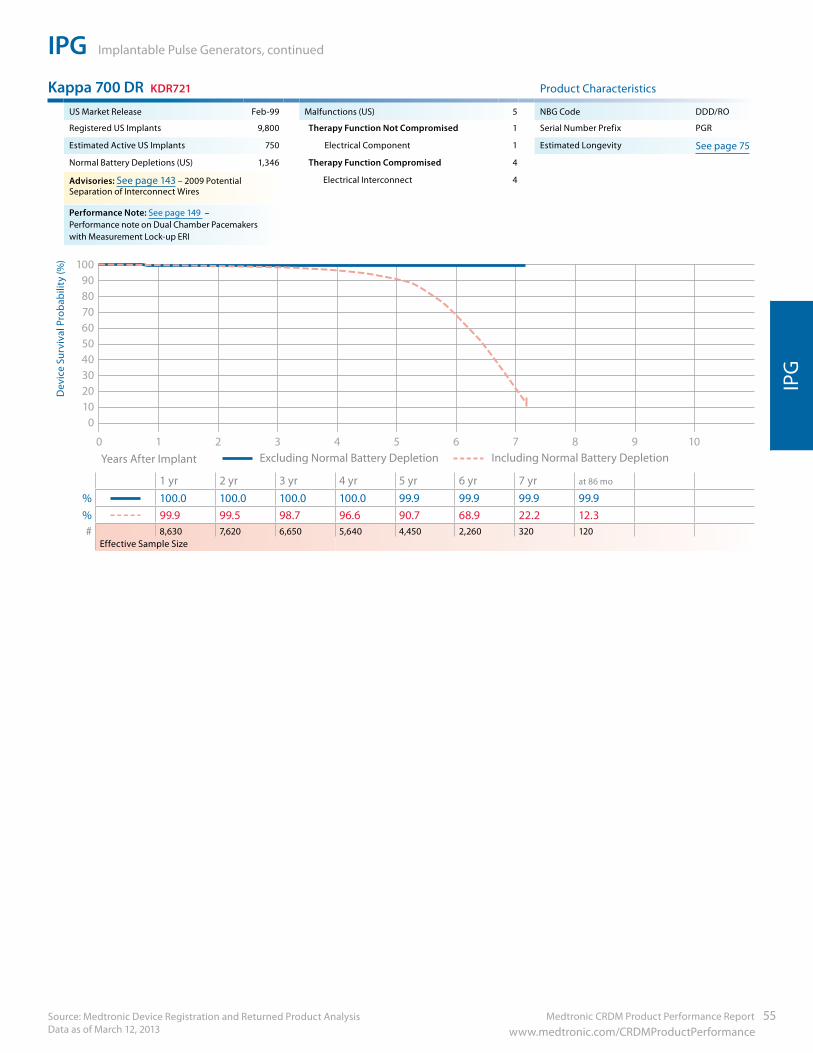
Medtronic CRDM Product Performance Report 55 www.medtronic.com/CRDMProductPerformance
IPG Implantable Pulse Generators, continued
Source: Medtronic Device Registration and Returned Product Analysis Data as of March 12, 2013
IPG
Kappa 700 DR KDR721 Product Characteristics
US Market Release Feb-99 Malfunctions (US) 5 NBG Code DDD/RO
Registered US Implants 9,800 Therapy Function Not Compromised 1 Serial Number Prefix PGR
Estimated Active US Implants 750 Electrical Component 1 Estimated Longevity See page 75
Normal Battery Depletions (US) 1,346 Therapy Function Compromised 4
Advisories: See page 143 – 2009 Potential Separation of Interconnect Wires
Electrical Interconnect 4
Performance Note: See page 149 – Performance note on Dual Chamber Pacemakers with Measurement Lock-up ERI
90100
8070605040302010
0
109876543210 Years After Implant Excluding Normal Battery Depletion Including Normal Battery Depletion
1 yr 2 yr 3 yr 4 yr 5 yr 6 yr 7 yr at 86 mo
% 100.0 100.0 100.0 100.0 99.9 99.9 99.9 99.9% 99.9 99.5 98.7 96.6 90.7 68.9 22.2 12.3# 8,630 7,620 6,650 5,640 4,450 2,260 320 120
Effective Sample Size
Dev
ice
Surv
ival
Pro
babi
lity
(%)
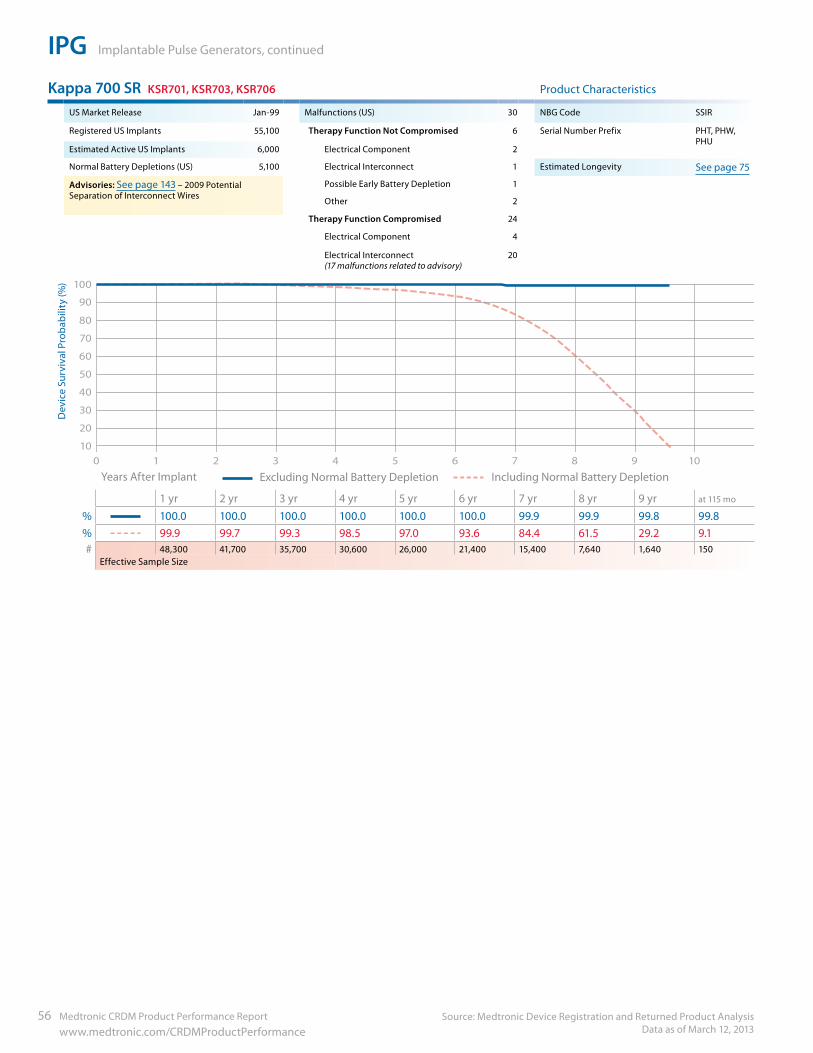
IPG Implantable Pulse Generators, continued
Source: Medtronic Device Registration and Returned Product Analysis Data as of March 12, 2013
56 Medtronic CRDM Product Performance Report www.medtronic.com/CRDMProductPerformance
Kappa 700 SR KSR701, KSR703, KSR706 Product Characteristics
US Market Release Jan-99 Malfunctions (US) 30 NBG Code SSIR
Registered US Implants 55,100 Therapy Function Not Compromised 6 Serial Number Prefix PHT, PHW, PHU
Estimated Active US Implants 6,000 Electrical Component 2
Normal Battery Depletions (US) 5,100 Electrical Interconnect 1 Estimated Longevity See page 75
Advisories: See page 143 – 2009 Potential Separation of Interconnect Wires
Possible Early Battery Depletion 1
Other 2
Therapy Function Compromised 24
Electrical Component 4
Electrical Interconnect (17 malfunctions related to advisory)
20
90
100
80
70
60
50
40
30
20
10109876543210
Years After Implant Excluding Normal Battery Depletion Including Normal Battery Depletion
1 yr 2 yr 3 yr 4 yr 5 yr 6 yr 7 yr 8 yr 9 yr at 115 mo
% 100.0 100.0 100.0 100.0 100.0 100.0 99.9 99.9 99.8 99.8% 99.9 99.7 99.3 98.5 97.0 93.6 84.4 61.5 29.2 9.1# 48,300 41,700 35,700 30,600 26,000 21,400 15,400 7,640 1,640 150
Effective Sample Size
Dev
ice
Surv
ival
Pro
babi
lity
(%)
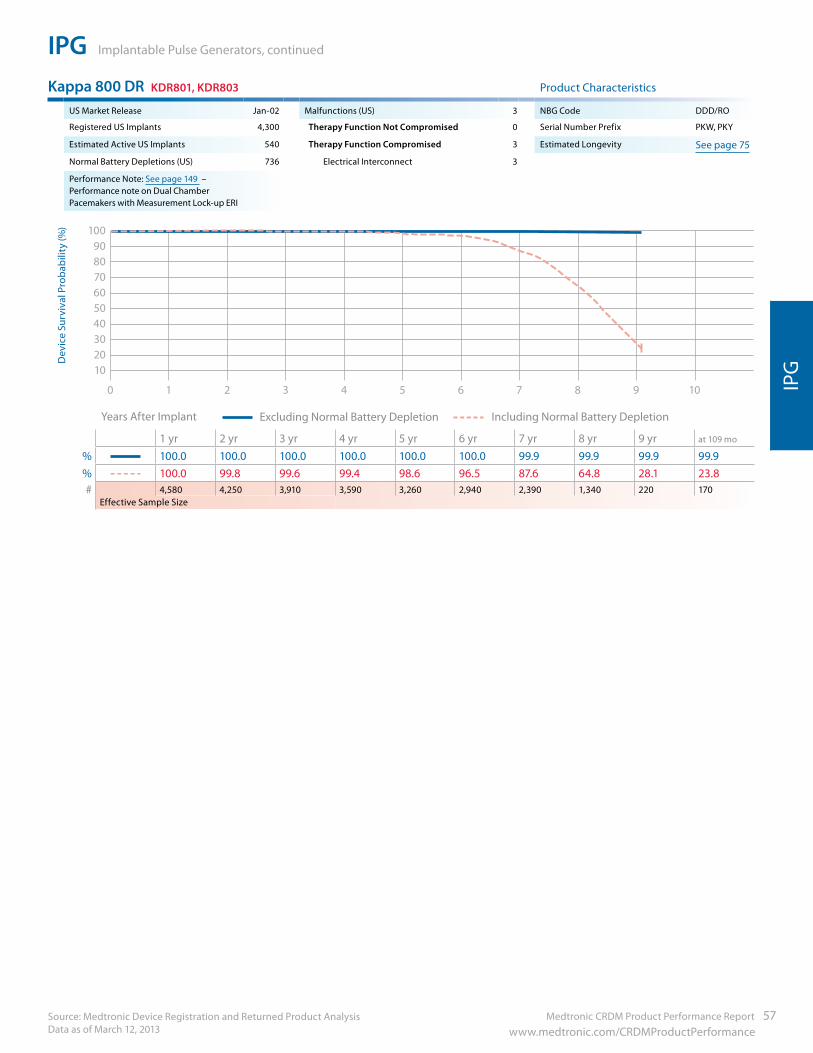
Medtronic CRDM Product Performance Report 57 www.medtronic.com/CRDMProductPerformance
IPG Implantable Pulse Generators, continued
Source: Medtronic Device Registration and Returned Product Analysis Data as of March 12, 2013
IPG
Kappa 800 DR KDR801, KDR803 Product Characteristics
US Market Release Jan-02 Malfunctions (US) 3 NBG Code DDD/RO
Registered US Implants 4,300 Therapy Function Not Compromised 0 Serial Number Prefix PKW, PKY
Estimated Active US Implants 540 Therapy Function Compromised 3 Estimated Longevity See page 75
Normal Battery Depletions (US) 736 Electrical Interconnect 3
Performance Note: See page 149 – Performance note on Dual Chamber Pacemakers with Measurement Lock-up ERI
90100
8070605040302010
0 109876543210
Years After Implant Excluding Normal Battery Depletion Including Normal Battery Depletion
1 yr 2 yr 3 yr 4 yr 5 yr 6 yr 7 yr 8 yr 9 yr at 109 mo
% 100.0 100.0 100.0 100.0 100.0 100.0 99.9 99.9 99.9 99.9% 100.0 99.8 99.6 99.4 98.6 96.5 87.6 64.8 28.1 23.8# 4,580 4,250 3,910 3,590 3,260 2,940 2,390 1,340 220 170
Effective Sample Size
Dev
ice
Surv
ival
Pro
babi
lity
(%)
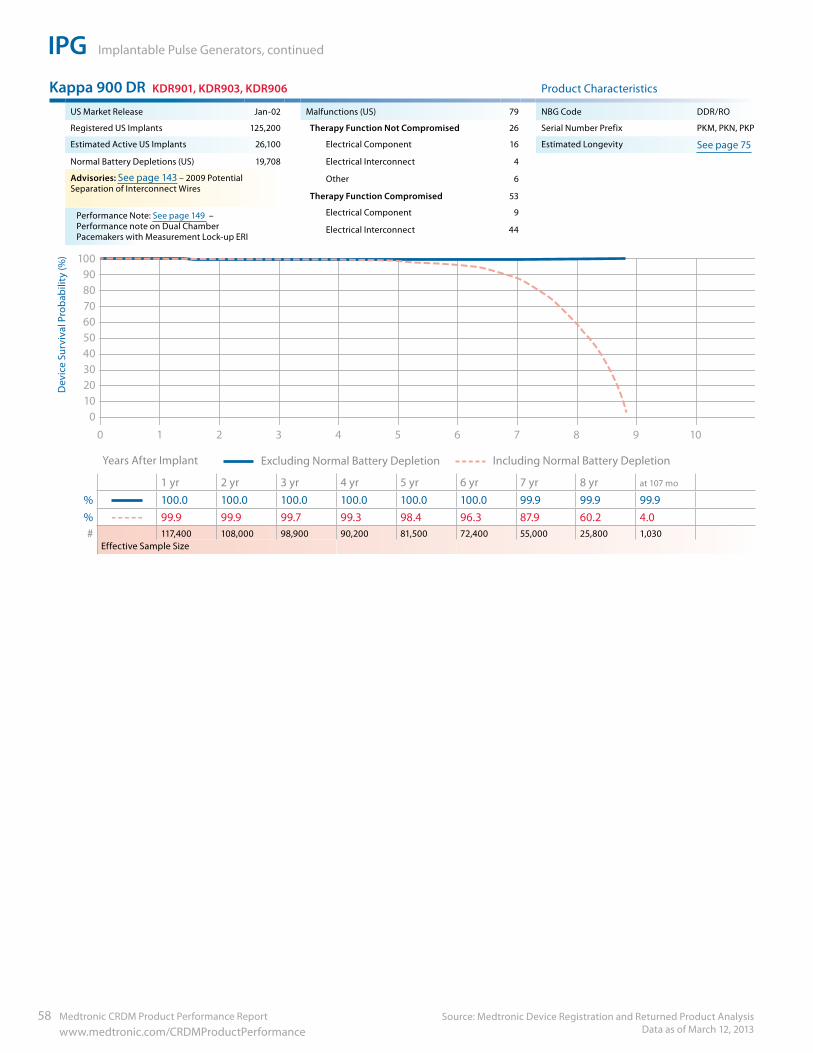
IPG Implantable Pulse Generators, continued
Source: Medtronic Device Registration and Returned Product Analysis Data as of March 12, 2013
58 Medtronic CRDM Product Performance Report www.medtronic.com/CRDMProductPerformance
Kappa 900 DR KDR901, KDR903, KDR906 Product Characteristics
US Market Release Jan-02 Malfunctions (US) 79 NBG Code DDR/RO
Registered US Implants 125,200 Therapy Function Not Compromised 26 Serial Number Prefix PKM, PKN, PKP
Estimated Active US Implants 26,100 Electrical Component 16 Estimated Longevity See page 75
Normal Battery Depletions (US) 19,708 Electrical Interconnect 4
Other 6
Therapy Function Compromised 53
Electrical Component 9
Electrical Interconnect 44
90100
8070605040302010
0
109876543210
Years After Implant Excluding Normal Battery Depletion Including Normal Battery Depletion
1 yr 2 yr 3 yr 4 yr 5 yr 6 yr 7 yr 8 yr at 107 mo
% 100.0 100.0 100.0 100.0 100.0 100.0 99.9 99.9 99.9% 99.9 99.9 99.7 99.3 98.4 96.3 87.9 60.2 4.0# 117,400 108,000 98,900 90,200 81,500 72,400 55,000 25,800 1,030
Effective Sample Size
Dev
ice
Surv
ival
Pro
babi
lity
(%)
Advisories: See page 143 – 2009 PotentialSeparation of Interconnect Wires
Performance Note: See page 149 – Performance note on Dual Chamber Pacemakers with Measurement Lock-up ERI

Medtronic CRDM Product Performance Report 59 www.medtronic.com/CRDMProductPerformance
IPG Implantable Pulse Generators, continued
Source: Medtronic Device Registration and Returned Product Analysis Data as of March 12, 2013
IPG
Kappa 900 SR KSR901, KSR903, KSR906 Product Characteristics
US Market Release Jan-02 Malfunctions (US) 17 NBG Code SSIR
Registered US Implants 37,000 Therapy Function Not Compromised 8 Serial Number Prefix PLF, PLG, PLH
Estimated Active US Implants 6,200 Electrical Component 7 Estimated Longevity See page 75
Normal Battery Depletions (US) 3,176 Possible Early Battery Depletion 1
Advisories: See page 143 – 2009 Potential Separation of Interconnect Wires
Therapy Function Compromised
Electrical Interconnect (8 malfunctions related to advisory)
9
9
90100
8070605040302010
0 109876543210
Years After Implant Excluding Normal Battery Depletion Including Normal Battery Depletion
1 yr 2 yr 3 yr 4 yr 5 yr 6 yr 7 yr 8 yr at 106 mo
% 100.0 100.0 100.0 100.0 100.0 99.9 99.9 99.9 99.9% 99.9 99.7 99.4 98.7 97.4 94.5 85.2 56.3 15.6# 32,000 27,600 24,000 20,700 17,700 14,900 9,880 3,670 270
Effective Sample Size
Dev
ice
Surv
ival
Pro
babi
lity
(%)
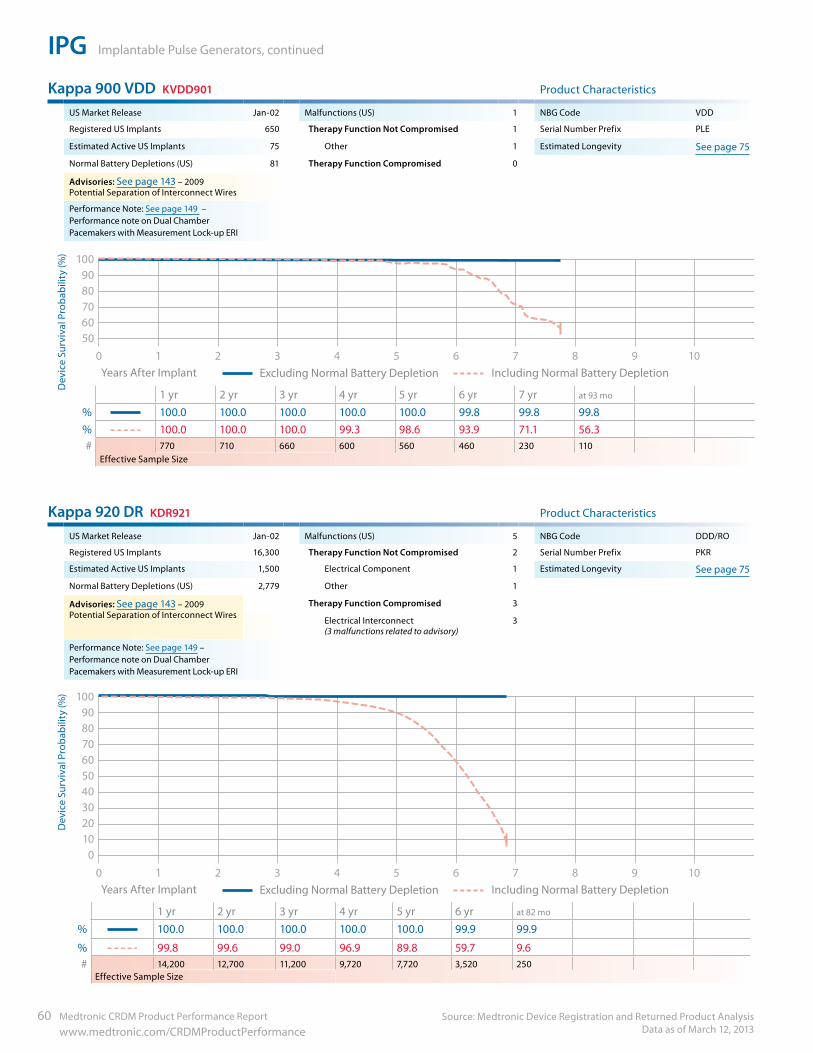
IPG Implantable Pulse Generators, continued
Source: Medtronic Device Registration and Returned Product Analysis Data as of March 12, 2013
60 Medtronic CRDM Product Performance Report www.medtronic.com/CRDMProductPerformance
Kappa 900 VDD KVDD901 Product Characteristics
US Market Release Jan-02 Malfunctions (US) 1 NBG Code VDD
Registered US Implants 650 Therapy Function Not Compromised 1 Serial Number Prefix PLE
Estimated Active US Implants 75 Other 1 Estimated Longevity See page 75
Normal Battery Depletions (US) 81 Therapy Function Compromised 0
Advisories: See page 143 – 2009 Potential Separation of Interconnect Wires
Performance Note: See page 149 – Performance note on Dual Chamber Pacemakers with Measurement Lock-up ERI
90100
80706050
109876543210 Years After Implant Excluding Normal Battery Depletion Including Normal Battery Depletion
1 yr 2 yr 3 yr 4 yr 5 yr 6 yr 7 yr at 93 mo
% 100.0 100.0 100.0 100.0 100.0 99.8 99.8 99.8% 100.0 100.0 100.0 99.3 98.6 93.9 71.1 56.3# 770 710 660 600 560 460 230 110
Effective Sample Size
Kappa 920 DR KDR921 Product Characteristics
US Market Release Jan-02 Malfunctions (US) 5 NBG Code DDD/RO
Registered US Implants 16,300 Therapy Function Not Compromised 2 Serial Number Prefix PKR
Estimated Active US Implants 1,500 Electrical Component 1 Estimated Longevity See page 75
Normal Battery Depletions (US) 2,779 Other 1
Advisories: See page 143 – 2009 Potential Separation of Interconnect Wires
Therapy Function Compromised 3
Electrical Interconnect (3 malfunctions related to advisory)
3
Performance Note: See page 149 – Performance note on Dual Chamber Pacemakers with Measurement Lock-up ERI
90100
8070605040302010
0
109876543210 Years After Implant Excluding Normal Battery Depletion Including Normal Battery Depletion
1 yr 2 yr 3 yr 4 yr 5 yr 6 yr at 82 mo
% 100.0 100.0 100.0 100.0 100.0 99.9 99.9
% 99.8 99.6 99.0 96.9 89.8 59.7 9.6# 14,200 12,700 11,200 9,720 7,720 3,520 250
Effective Sample Size
Dev
ice
Surv
ival
Pro
babi
lity
(%)
Dev
ice
Surv
ival
Pro
babi
lity
(%)
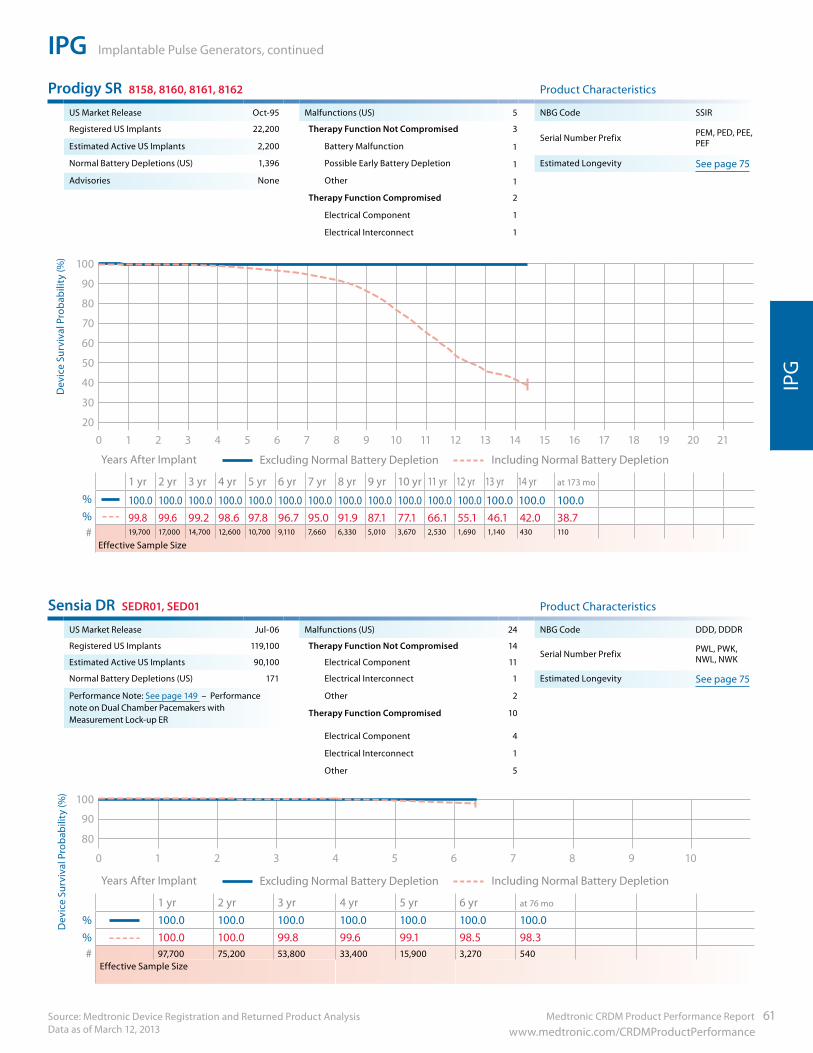
Medtronic CRDM Product Performance Report 61 www.medtronic.com/CRDMProductPerformance
IPG Implantable Pulse Generators, continued
Source: Medtronic Device Registration and Returned Product Analysis Data as of March 12, 2013
IPG
Prodigy SR 8158, 8160, 8161, 8162 Product Characteristics
US Market Release Oct-95 Malfunctions (US) 5 NBG Code SSIR
Registered US Implants 22,200 Therapy Function Not Compromised 3Serial Number Prefix PEM, PED, PEE,
PEFEstimated Active US Implants 2,200 Battery Malfunction 1
Normal Battery Depletions (US) 1,396 Possible Early Battery Depletion 1 Estimated Longevity See page 75
Advisories None Other 1
Therapy Function Compromised 2
Electrical Component 1
Electrical Interconnect 1
10
0
90
100
80
70
60
50
40
30
2020181614121086420 21191715131197531
Years After Implant Excluding Normal Battery Depletion Including Normal Battery Depletion
1 yr 2 yr 3 yr 4 yr 5 yr 6 yr 7 yr 8 yr 9 yr 10 yr 11 yr 12 yr 13 yr 14 yr at 173 mo
% 100.0 100.0 100.0 100.0 100.0 100.0 100.0 100.0 100.0 100.0 100.0 100.0 100.0 100.0 100.0% 99.8 99.6 99.2 98.6 97.8 96.7 95.0 91.9 87.1 77.1 66.1 55.1 46.1 42.0 38.7# 19,700 17,000 14,700 12,600 10,700 9,110 7,660 6,330 5,010 3,670 2,530 1,690 1,140 430 110
Effective Sample Size
Sensia DR SEDR01, SED01 Product Characteristics
US Market Release Jul-06 Malfunctions (US) 24 NBG Code DDD, DDDR
Registered US Implants 119,100 Therapy Function Not Compromised 14Serial Number Prefix PWL, PWK,
NWL, NWKEstimated Active US Implants 90,100 Electrical Component 11
Normal Battery Depletions (US) 171 Electrical Interconnect 1 Estimated Longevity See page 75
Performance Note: See page 149 – Performance note on Dual Chamber Pacemakers with Measurement Lock-up ER
Other 2
Therapy Function Compromised 10
Electrical Component 4
Electrical Interconnect 1
Other 5
90
100
80
109876543210
Years After Implant Excluding Normal Battery Depletion Including Normal Battery Depletion
1 yr 2 yr 3 yr 4 yr 5 yr 6 yr at 76 mo
% 100.0 100.0 100.0 100.0 100.0 100.0 100.0% 100.0 100.0 99.8 99.6 99.1 98.5 98.3# 97,700 75,200 53,800 33,400 15,900 3,270 540
Effective Sample Size
Dev
ice
Surv
ival
Pro
babi
lity
(%)
Dev
ice
Surv
ival
Pro
babi
lity
(%)
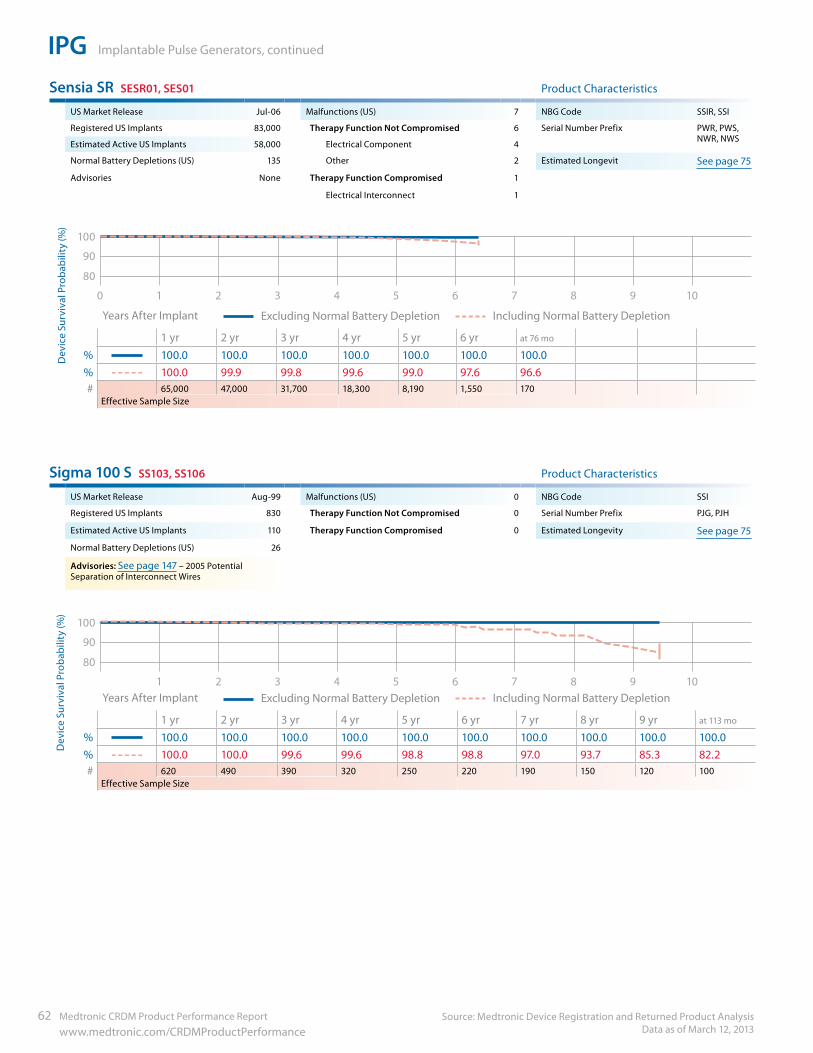
IPG Implantable Pulse Generators, continued
Source: Medtronic Device Registration and Returned Product Analysis Data as of March 12, 2013
62 Medtronic CRDM Product Performance Report www.medtronic.com/CRDMProductPerformance
Sensia SR SESR01, SES01 Product Characteristics
US Market Release Jul-06 Malfunctions (US) 7 NBG Code SSIR, SSI
Registered US Implants 83,000 Therapy Function Not Compromised 6 Serial Number Prefix PWR, PWS, NWR, NWS
Estimated Active US Implants 58,000 Electrical Component 4
Normal Battery Depletions (US) 135 Other 2 Estimated Longevit See page 75
Advisories None Therapy Function Compromised 1
Electrical Interconnect 1
90
100
80
109876543210
Years After Implant Excluding Normal Battery Depletion Including Normal Battery Depletion
1 yr 2 yr 3 yr 4 yr 5 yr 6 yr at 76 mo
% 100.0 100.0 100.0 100.0 100.0 100.0 100.0% 100.0 99.9 99.8 99.6 99.0 97.6 96.6# 65,000 47,000 31,700 18,300 8,190 1,550 170
Effective Sample Size
Sigma 100 S SS103, SS106 Product Characteristics
US Market Release Aug-99 Malfunctions (US) 0 NBG Code SSI
Registered US Implants 830 Therapy Function Not Compromised 0 Serial Number Prefix PJG, PJH
Estimated Active US Implants 110 Therapy Function Compromised 0 Estimated Longevity See page 75
Normal Battery Depletions (US) 26
Advisories: See page 147 – 2005 Potential Separation of Interconnect Wires
90
100
80
10987654321 Years After Implant Excluding Normal Battery Depletion Including Normal Battery Depletion
1 yr 2 yr 3 yr 4 yr 5 yr 6 yr 7 yr 8 yr 9 yr at 113 mo
% 100.0 100.0 100.0 100.0 100.0 100.0 100.0 100.0 100.0 100.0% 100.0 100.0 99.6 99.6 98.8 98.8 97.0 93.7 85.3 82.2# 620 490 390 320 250 220 190 150 120 100
Effective Sample Size
Dev
ice
Surv
ival
Pro
babi
lity
(%)
Dev
ice
Surv
ival
Pro
babi
lity
(%)
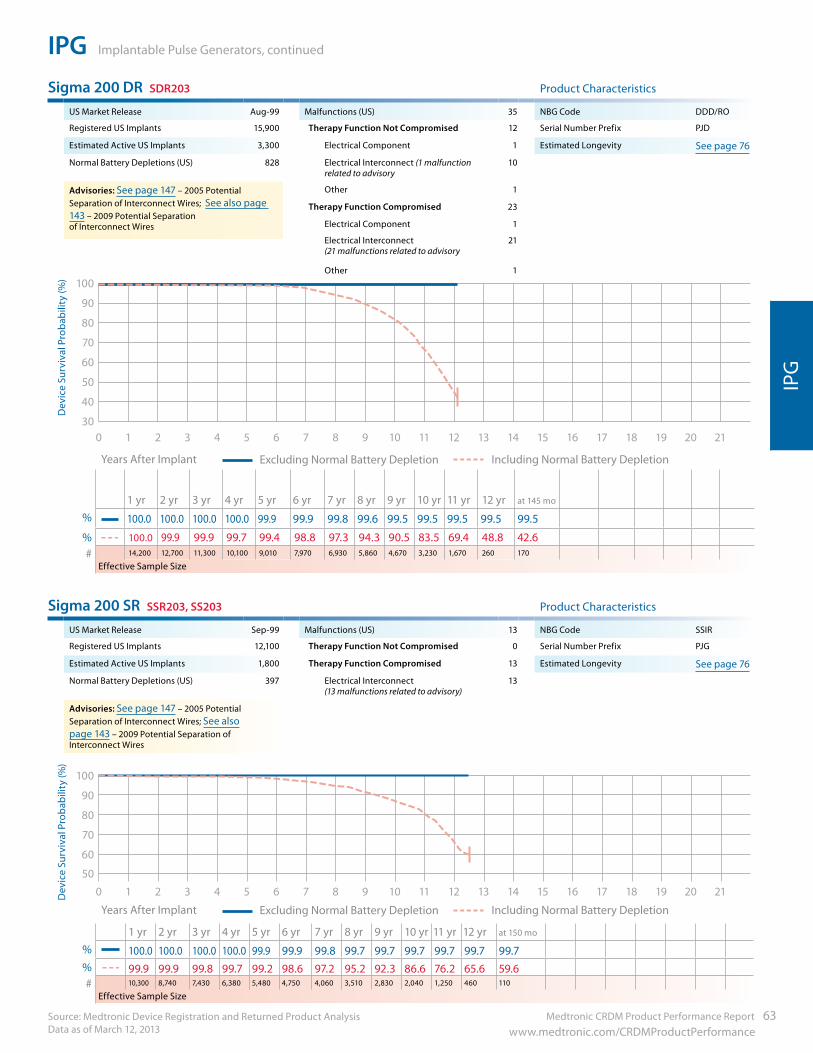
Medtronic CRDM Product Performance Report 63 www.medtronic.com/CRDMProductPerformance
IPG Implantable Pulse Generators, continued
Source: Medtronic Device Registration and Returned Product Analysis Data as of March 12, 2013
IPG
Sigma 200 DR SDR203 Product Characteristics
US Market Release Aug-99 Malfunctions (US) 35 NBG Code DDD/RO
Registered US Implants 15,900 Therapy Function Not Compromised 12 Serial Number Prefix PJD
Estimated Active US Implants 3,300 Electrical Component 1 Estimated Longevity See page 76
Normal Battery Depletions (US) 828 Electrical Interconnect (1 malfunction related to advisory
10
Advisories: See page 147 – 2005 Potential Separation of Interconnect Wires; See also page 143 – 2009 Potential Separation of Interconnect Wires
Other 1
Therapy Function Compromised 23
Electrical Component 1
Electrical Interconnect (21 malfunctions related to advisory
21
Other 1
90
100
80
70
60
50
40
3020181614121086420 21191715131197531
Years After Implant Excluding Normal Battery Depletion Including Normal Battery Depletion
1 yr 2 yr 3 yr 4 yr 5 yr 6 yr 7 yr 8 yr 9 yr 10 yr 11 yr 12 yr at 145 mo
% 100.0 100.0 100.0 100.0 99.9 99.9 99.8 99.6 99.5 99.5 99.5 99.5 99.5
% 100.0 99.9 99.9 99.7 99.4 98.8 97.3 94.3 90.5 83.5 69.4 48.8 42.6# 14,200 12,700 11,300 10,100 9,010 7,970 6,930 5,860 4,670 3,230 1,670 260 170
Effective Sample Size
Sigma 200 SR SSR203, SS203 Product Characteristics
US Market Release Sep-99 Malfunctions (US) 13 NBG Code SSIR
Registered US Implants 12,100 Therapy Function Not Compromised 0 Serial Number Prefix PJG
Estimated Active US Implants 1,800 Therapy Function Compromised 13 Estimated Longevity See page 76
Normal Battery Depletions (US) 397 Electrical Interconnect (13 malfunctions related to advisory)
13
Advisories: See page 147 – 2005 Potential Separation of Interconnect Wires; See also page 143 – 2009 Potential Separation of Interconnect Wires
90
100
80
70
60
50
20181614121086420 21191715131197531
Years After Implant Excluding Normal Battery Depletion Including Normal Battery Depletion
1 yr 2 yr 3 yr 4 yr 5 yr 6 yr 7 yr 8 yr 9 yr 10 yr 11 yr 12 yr at 150 mo
% 100.0 100.0 100.0 100.0 99.9 99.9 99.8 99.7 99.7 99.7 99.7 99.7 99.7% 99.9 99.9 99.8 99.7 99.2 98.6 97.2 95.2 92.3 86.6 76.2 65.6 59.6# 10,300 8,740 7,430 6,380 5,480 4,750 4,060 3,510 2,830 2,040 1,250 460 110
Effective Sample Size
Dev
ice
Surv
ival
Pro
babi
lity
(%)
Dev
ice
Surv
ival
Pro
babi
lity
(%)
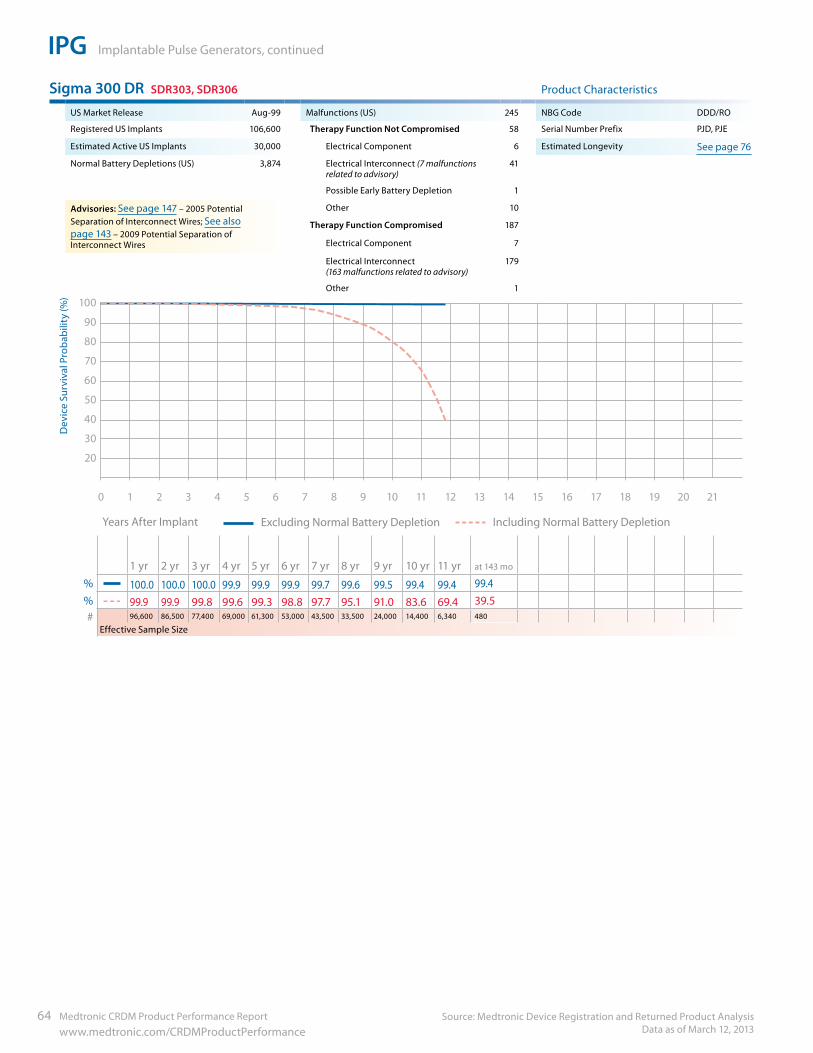
IPG Implantable Pulse Generators, continued
Source: Medtronic Device Registration and Returned Product Analysis Data as of March 12, 2013
64 Medtronic CRDM Product Performance Report www.medtronic.com/CRDMProductPerformance
Sigma 300 DR SDR303, SDR306 Product Characteristics
US Market Release Aug-99 Malfunctions (US) 245 NBG Code DDD/RO
Registered US Implants 106,600 Therapy Function Not Compromised 58 Serial Number Prefix PJD, PJE
Estimated Active US Implants 30,000 Electrical Component 6 Estimated Longevity See page 76
Normal Battery Depletions (US) 3,874 Electrical Interconnect (7 malfunctions related to advisory)
41
Possible Early Battery Depletion 1
Advisories: See page 147 – 2005 Potential Separation of Interconnect Wires; See also page 143 – 2009 Potential Separation of Interconnect Wires
Other 10
Therapy Function Compromised 187
Electrical Component 7
Electrical Interconnect (163 malfunctions related to advisory)
179
Other 1
90
100
80
70
60
50
40
30
20
20181614121086420 21191715131197531
Years After Implant Excluding Normal Battery Depletion Including Normal Battery Depletion
1 yr 2 yr 3 yr 4 yr 5 yr 6 yr 7 yr 8 yr 9 yr 10 yr 11 yr at 143 mo
% 100.0 100.0 100.0 99.9 99.9 99.9 99.7 99.6 99.5 99.4 99.4 99.4% 99.9 99.9 99.8 99.6 99.3 98.8 97.7 95.1 91.0 83.6 69.4 39.5# 96,600 86,500 77,400 69,000 61,300 53,000 43,500 33,500 24,000 14,400 6,340 480
Effective Sample Size
Dev
ice
Surv
ival
Pro
babi
lity
(%)
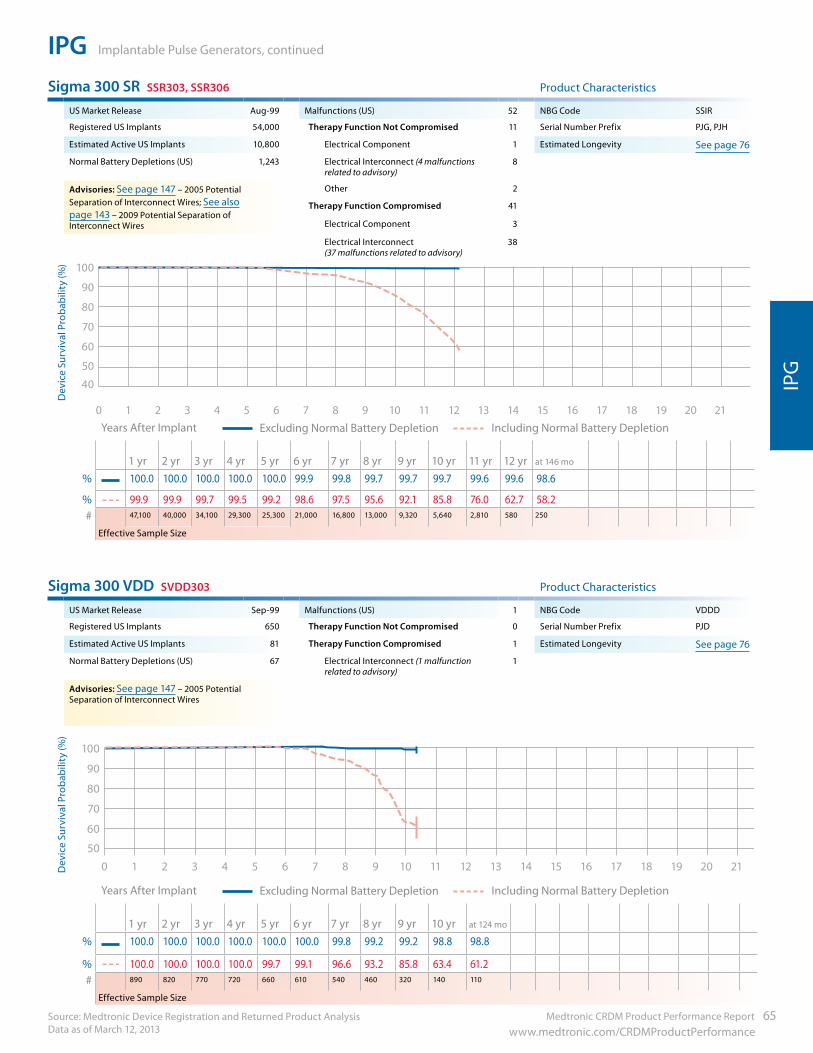
Medtronic CRDM Product Performance Report 65 www.medtronic.com/CRDMProductPerformance
IPG Implantable Pulse Generators, continued
Source: Medtronic Device Registration and Returned Product Analysis Data as of March 12, 2013
IPG
Sigma 300 SR SSR303, SSR306 Product Characteristics
US Market Release Aug-99 Malfunctions (US) 52 NBG Code SSIR
Registered US Implants 54,000 Therapy Function Not Compromised 11 Serial Number Prefix PJG, PJH
Estimated Active US Implants 10,800 Electrical Component 1 Estimated Longevity See page 76
Normal Battery Depletions (US) 1,243 Electrical Interconnect (4 malfunctions related to advisory)
8
Advisories: See page 147 – 2005 Potential Separation of Interconnect Wires; See also page 143 – 2009 Potential Separation of Interconnect Wires
Other 2
Therapy Function Compromised 41
Electrical Component 3
Electrical Interconnect (37 malfunctions related to advisory)
38
90
100
80
70
60
20181614121086420 21191715131197531
50
40
Years After Implant Excluding Normal Battery Depletion Including Normal Battery Depletion
1 yr 2 yr 3 yr 4 yr 5 yr 6 yr 7 yr 8 yr 9 yr 10 yr 11 yr 12 yr at 146 mo
% 100.0 100.0 100.0 100.0 100.0 99.9 99.8 99.7 99.7 99.7 99.6 99.6 98.6
% 99.9 99.9 99.7 99.5 99.2 98.6 97.5 95.6 92.1 85.8 76.0 62.7 58.2# 47,100 40,000 34,100 29,300 25,300 21,000 16,800 13,000 9,320 5,640 2,810 580 250
Effective Sample Size
Sigma 300 VDD SVDD303 Product Characteristics
US Market Release Sep-99 Malfunctions (US) 1 NBG Code VDDD
Registered US Implants 650 Therapy Function Not Compromised 0 Serial Number Prefix PJD
Estimated Active US Implants 81 Therapy Function Compromised 1 Estimated Longevity See page 76
Normal Battery Depletions (US) 67 Electrical Interconnect (1 malfunction related to advisory)
1
Advisories: See page 147 – 2005 Potential Separation of Interconnect Wires
90
100
80
70
60
50
20181614121086420 21191715131197531
Years After Implant Excluding Normal Battery Depletion Including Normal Battery Depletion
1 yr 2 yr 3 yr 4 yr 5 yr 6 yr 7 yr 8 yr 9 yr 10 yr at 124 mo
% 100.0 100.0 100.0 100.0 100.0 100.0 99.8 99.2 99.2 98.8 98.8
% 100.0 100.0 100.0 100.0 99.7 99.1 96.6 93.2 85.8 63.4 61.2# 890 820 770 720 660 610 540 460 320 140 110
Effective Sample Size
Dev
ice
Surv
ival
Pro
babi
lity
(%)
Dev
ice
Surv
ival
Pro
babi
lity
(%)
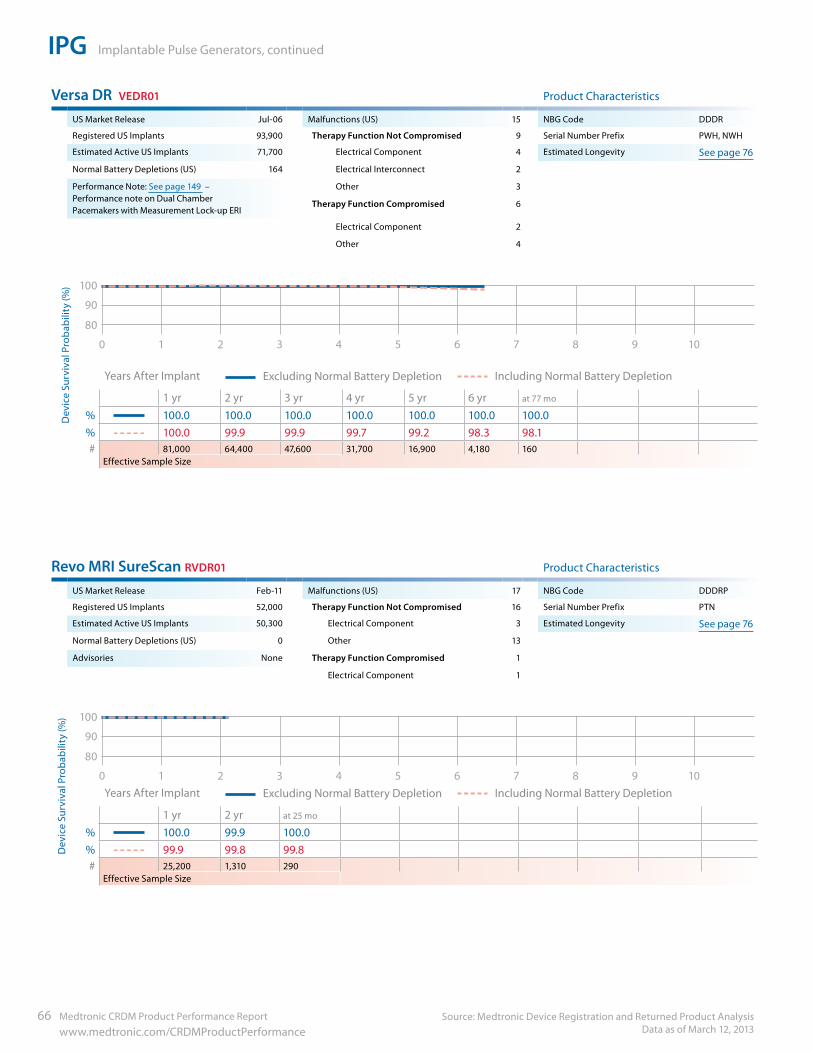
IPG Implantable Pulse Generators, continued
Source: Medtronic Device Registration and Returned Product Analysis Data as of March 12, 2013
66 Medtronic CRDM Product Performance Report www.medtronic.com/CRDMProductPerformance
Versa DR VEDR01 Product Characteristics
US Market Release Jul-06 Malfunctions (US) 15 NBG Code DDDR
Registered US Implants 93,900 Therapy Function Not Compromised 9 Serial Number Prefix PWH, NWH
Estimated Active US Implants 71,700 Electrical Component 4 Estimated Longevity See page 76
Normal Battery Depletions (US) 164 Electrical Interconnect 2
Performance Note: See page 149 – Performance note on Dual Chamber Pacemakers with Measurement Lock-up ERI
Other 3
Therapy Function Compromised 6
Electrical Component 2
Other 4
90
100
80
109876543210
Years After Implant Excluding Normal Battery Depletion Including Normal Battery Depletion
1 yr 2 yr 3 yr 4 yr 5 yr 6 yr at 77 mo
% 100.0 100.0 100.0 100.0 100.0 100.0 100.0% 100.0 99.9 99.9 99.7 99.2 98.3 98.1# 81,000 64,400 47,600 31,700 16,900 4,180 160
Effective Sample Size
Revo MRI SureScan RVDR01 Product Characteristics
US Market Release Feb-11 Malfunctions (US) 17 NBG Code DDDRP
Registered US Implants 52,000 Therapy Function Not Compromised 16 Serial Number Prefix PTN
Estimated Active US Implants 50,300 Electrical Component 3 Estimated Longevity See page 76
Normal Battery Depletions (US) 0 Other 13
Advisories None Therapy Function Compromised 1
Electrical Component 1
90
100
80
109876543210 Years After Implant Excluding Normal Battery Depletion Including Normal Battery Depletion
1 yr 2 yr at 25 mo
% 100.0 99.9 100.0% 99.9 99.8 99.8# 25,200 1,310 290
Effective Sample Size
Dev
ice
Surv
ival
Pro
babi
lity
(%)
Dev
ice
Surv
ival
Pro
babi
lity
(%)
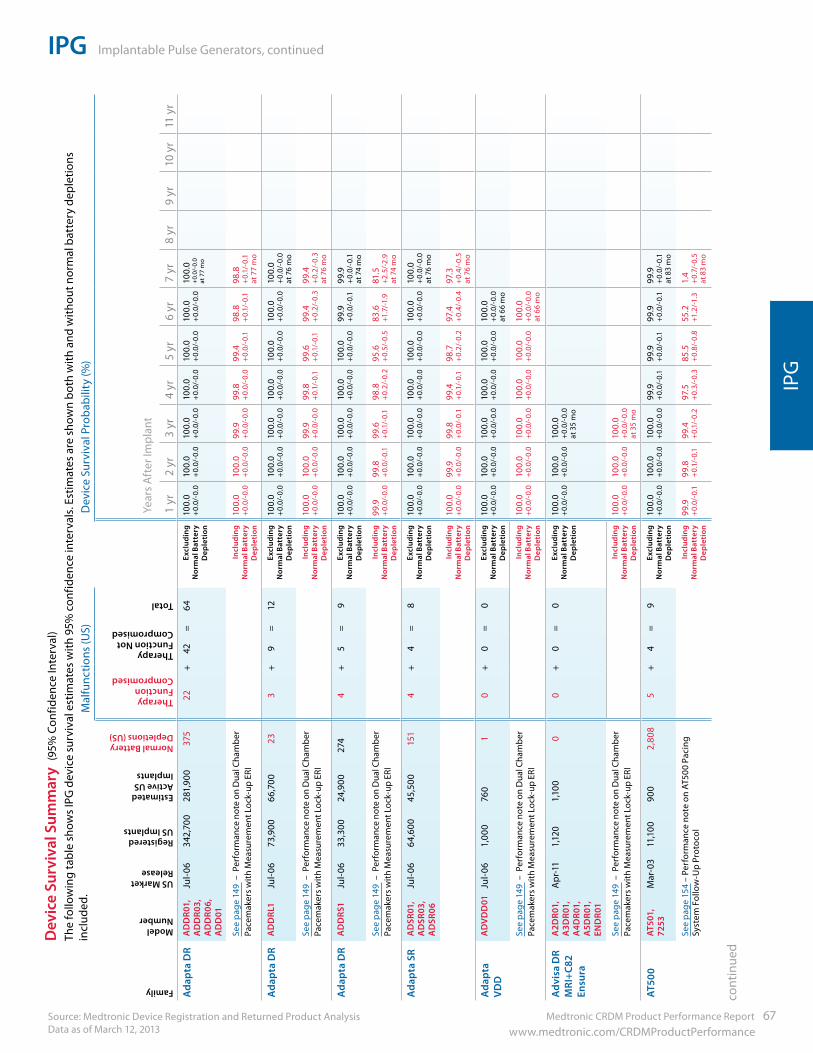
Medtronic CRDM Product Performance Report 67 www.medtronic.com/CRDMProductPerformance
IPG Implantable Pulse Generators, continued
Source: Medtronic Device Registration and Returned Product Analysis Data as of March 12, 2013
IPG
cont
inue
d
Dev
ice
Surv
ival
Sum
mar
y (9
5% C
onfid
ence
Inte
rval
) Th
e fo
llow
ing
tabl
e sh
ows
IPG
dev
ice
surv
ival
est
imat
es w
ith 9
5% c
onfid
ence
inte
rval
s. E
stim
ates
are
sho
wn
both
with
and
with
out n
orm
al b
atte
ry d
eple
tions
in
clud
ed.
Family
Model Number
US Market Release
Registered US Implants
Estimated Active US Implants
Normal Battery Depletions (US)
Mal
func
tions
(US)
Dev
ice
Surv
ival
Pro
babi
lity
(%)
Therapy Function Compromised
Therapy Function Not Compromised
Total
Year
s A
fter
Impl
ant
1 yr
2 yr
3 yr
4 yr
5 yr
6 yr
7 yr
8 yr
9 yr
10 y
r11
yr
Ada
pta
DR
AD
DR0
1,
AD
DR0
3,
AD
DR0
6,
AD
D01
Jul-
0634
2,70
028
1,90
037
522
+42
=64
Excl
udin
g N
orm
al B
atte
ry
Dep
leti
on
100.
0
+0.
0/-0
.010
0.0
+
0.0/
-0.0
100.
0
+0.
0/-0
.010
0.0
+
0.0/
-0.0
100.
0
+0.
0/-0
.010
0.0
+
0.0/
-0.0
100.
0
+0.
0/-0
.0
at 7
7 m
o
See
page
149
– P
erfo
rman
ce n
ote
on D
ual C
ham
ber
Pace
mak
ers w
ith M
easu
rem
ent L
ock-
up E
RI
In
clud
ing
Nor
mal
Bat
tery
D
eple
tion
100.
0
+0.
0/-0
.010
0.0
+
0.0/
-0.0
99.9
+
0.0/
-0.0
99.8
+
0.0/
-0.0
99.4
+
0.0/
-0.1
98.8
+
0.1/
-0.1
98.8
+
0.1/
-0.1
at
77
mo
Ada
pta
DR
AD
DRL
1Ju
l-06
73,9
0066
,700
233
+9
=12
Excl
udin
g N
orm
al B
atte
ry
Dep
leti
on
100.
0
+0.
0/-0
.010
0.0
+
0.0/
-0.0
100.
0
+0.
0/-0
.010
0.0
+
0.0/
-0.0
100.
0
+0.
0/-0
.010
0.0
+
0.0/
-0.0
100.
0
+0.
0/-0
.0
at 7
6 m
o
See
page
149
– P
erfo
rman
ce n
ote
on D
ual C
ham
ber
Pace
mak
ers w
ith M
easu
rem
ent L
ock-
up E
RI
In
clud
ing
Nor
mal
Bat
tery
D
eple
tion
100.
0
+0.
0/-0
.010
0.0
+
0.0/
-0.0
99.9
+
0.0/
-0.0
99.8
+
0.1/
-0.1
99.6
+
0.1/
-0.1
99.4
+
0.2/
-0.3
99.4
+
0.2/
-0.3
at
76
mo
Ada
pta
DR
AD
DRS
1Ju
l-06
33,3
0024
,900
274
4+
5=
9Ex
clud
ing
Nor
mal
Bat
tery
D
eple
tion
100.
0
+0.
0/-0
.010
0.0
+
0.0/
-0.0
100.
0
+0.
0/-0
.010
0.0
+
0.0/
-0.0
100.
0
+0.
0/-0
.099
.9
+0.
0/-0
.199
.9
+0.
0/-0
.1
at 7
4 m
o
See
page
149
– P
erfo
rman
ce n
ote
on D
ual C
ham
ber
Pace
mak
ers w
ith M
easu
rem
ent L
ock-
up E
RI
In
clud
ing
Nor
mal
Bat
tery
D
eple
tion
99.9
+
0.0/
-0.0
99.8
+
0.0/
-0.1
99.6
+
0.1/
-0.1
98.8
+
0.2/
-0.2
95.6
+
0.5/
-0.5
83.6
+1
.7/-1
.981
.5
+2.5
/-2.
9
at 7
4 m
o
Ada
pta
SRA
DSR
01,
AD
SR03
, A
DSR
06
Jul-
0664
,600
45,5
0015
14
+4
=8
Excl
udin
g N
orm
al B
atte
ry
Dep
leti
on
100.
0
+0.
0/-0
.010
0.0
+
0.0/
-0.0
100.
0
+0.
0/-0
.010
0.0
+
0.0/
-0.0
100.
0
+0.
0/-0
.010
0.0
+
0.0/
-0.0
100.
0
+0.
0/-0
.0
at 7
6 m
o
Incl
udin
g N
orm
al B
atte
ry
Dep
leti
on
100.
0
+0.
0/-0
.099
.9
+0.
0/-0
.099
.8
+0.
0/-0
.199
.4
+0.
1/-0
.198
.7
+0.
2/-0
.297
.4
+0.
4/-0
.497
.3
+0.
4/-0
.5
at 7
6 m
o
Ada
pta
VD
DA
DV
DD
01Ju
l-06
1,00
076
01
0+
0=
0Ex
clud
ing
Nor
mal
Bat
tery
D
eple
tion
100.
0
+0.
0/-0
.010
0.0
+
0.0/
-0.0
100.
0
+0.
0/-0
.010
0.0
+
0.0/
-0.0
100.
0
+0.
0/-0
.010
0.0
+
0.0/
-0.0
at
66
mo
See
page
149
– P
erfo
rman
ce n
ote
on D
ual C
ham
ber
Pace
mak
ers w
ith M
easu
rem
ent L
ock-
up E
RI
In
clud
ing
Nor
mal
Bat
tery
D
eple
tion
100.
0
+0.
0/-0
.010
0.0
+
0.0/
-0.0
100.
0
+0.
0/-0
.010
0.0
+
0.0/
-0.0
100.
0
+0.
0/-0
.010
0.0
+
0.0/
-0.0
at
66
mo
Adv
isa
DR
MRI
+C82
Ensu
ra
A2D
R01,
A
3DR0
1,
A4D
R01,
A
5DR0
1,EN
DR0
1
Apr
-11
1,12
01,
100
00
+0
=0
Excl
udin
g N
orm
al B
atte
ry
Dep
leti
on
100.
0
+0.
0/-0
.010
0.0
+
0.0/
-0.0
100.
0
+0.
0/-0
.0
at 3
5 m
o
See
page
149
– P
erfo
rman
ce n
ote
on D
ual C
ham
ber
Pace
mak
ers w
ith M
easu
rem
ent L
ock-
up E
RI
In
clud
ing
Nor
mal
Bat
tery
D
eple
tion
100.
0
+0.
0/-0
.010
0.0
+
0.0/
-0.0
100.
0
+0.
0/-0
.0
at 3
5 m
o
AT50
0AT
501,
72
53M
ar-0
311
,100
900
2,80
85
+4
=9
Excl
udin
g N
orm
al B
atte
ry
Dep
leti
on
100.
0
+0.
0/-0
.010
0.0
+
0.0/
-0.0
100.
0
+0.
0/-0
.099
.9
+0.
0/-0
.199
.9
+0.
0/-0
.199
.9
+0.
0/-0
.199
.9
+0.
0/-0
.1
at 8
3 m
o
See
page
154
– P
erfo
rman
ce n
ote
on A
T500
Pac
ing
Syst
em F
ollo
w-U
p Pr
otoc
olIn
clud
ing
Nor
mal
Bat
tery
D
eple
tion
99.9
+
0.0/
-0.1
99.8
+
0.1/
-0.1
99.4
+
0.1/
-0.2
97.5
+
0.3/
-0.3
85.5
+
0.8/
-0.8
55.2
+1
.2/-1
.31.
4
+0.
7/-0
.5
at 8
3 m
o
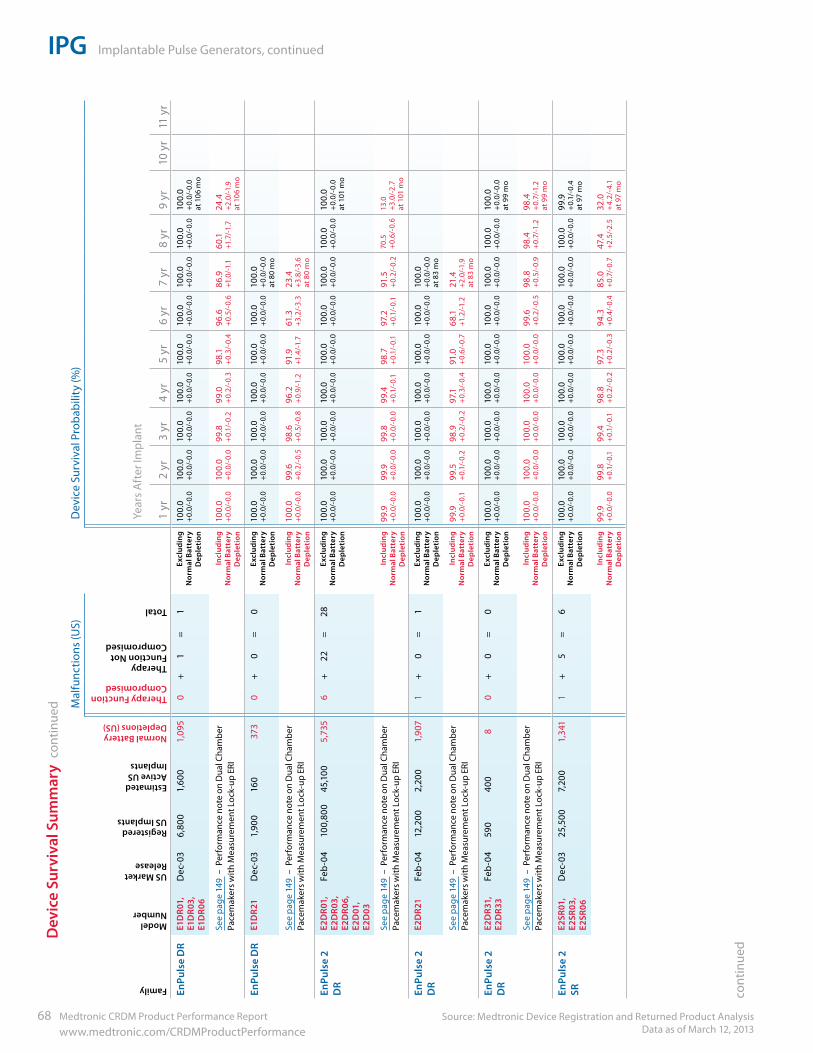
IPG Implantable Pulse Generators, continued
Source: Medtronic Device Registration and Returned Product Analysis Data as of March 12, 2013
68 Medtronic CRDM Product Performance Report www.medtronic.com/CRDMProductPerformance
Family
Model Number
US Market Release
Registered US Implants
Estimated Active US Implants
Normal Battery Depletions (US)
Mal
func
tions
(US)
Dev
ice
Surv
ival
Pro
babi
lity
(%)
Therapy Function Compromised
Therapy Function Not Compromised
Total
Year
s A
fter
Impl
ant
1 yr
2 yr
3 yr
4 yr
5 yr
6 yr
7 yr
8 yr
9 yr
10 y
r11
yr
EnPu
lse
DR
E1D
R01,
E1
DR0
3,
E1D
R06
Dec
-03
6,80
01,
600
1,09
50
+1
=1
Excl
udin
g N
orm
al B
atte
ry
Dep
leti
on
100.
0
+0.
0/-0
.010
0.0
+
0.0/
-0.0
100.
0
+0.
0/-0
.010
0.0
+
0.0/
-0.0
100.
0
+0.
0/-0
.010
0.0
+
0.0/
-0.0
100.
0
+0.
0/-0
.010
0.0
+
0.0/
-0.0
100.
0
+0.
0/-0
.0
at 1
06 m
o
See
page
149
– P
erfo
rman
ce n
ote
on D
ual C
ham
ber
Pace
mak
ers w
ith M
easu
rem
ent L
ock-
up E
RIIn
clud
ing
Nor
mal
Bat
tery
D
eple
tion
100.
0
+0.
0/-0
.010
0.0
+
0.0/
-0.0
99.8
+
0.1/
-0.2
99.0
+
0.2/
-0.3
98.1
+
0.3/
-0.4
96.6
+
0.5/
-0.6
86.9
+1
.0/-1
.160
.1
+1.7
/-1.7
24.4
+2
.0/-1
.9
at 1
06 m
o
EnPu
lse
DR
E1D
R21
Dec
-03
1,90
016
037
30
+0
=0
Excl
udin
g N
orm
al B
atte
ry
Dep
leti
on
100.
0
+0.
0/-0
.010
0.0
+
0.0/
-0.0
100.
0
+0.
0/-0
.010
0.0
+
0.0/
-0.0
100.
0
+0.
0/-0
.010
0.0
+
0.0/
-0.0
100.
0
+0.
0/-0
.0
at 8
0 m
o
See
page
149
– P
erfo
rman
ce n
ote
on D
ual C
ham
ber
Pace
mak
ers w
ith M
easu
rem
ent L
ock-
up E
RIIn
clud
ing
Nor
mal
Bat
tery
D
eple
tion
100.
0
+0.
0/-0
.099
.6
+0.
2/-0
.598
.6
+0.
5/-0
.896
.2
+0.
9/-1
.291
.9
+1.4
/-1.7
61.3
+3
.2/-
3.3
23.4
+3
.8/-
3.6
at
80
mo
EnPu
lse
2 D
RE2
DR0
1,
E2D
R03,
E2
DR0
6,E2
D01
,E2
D03
Feb
-04
100,
800
45,1
005,
735
6+
22=
28Ex
clud
ing
Nor
mal
Bat
tery
D
eple
tion
100.
0
+0.
0/-0
.010
0.0
+
0.0/
-0.0
100.
0
+0.
0/-0
.010
0.0
+
0.0/
-0.0
100.
0
+0.
0/-0
.010
0.0
+
0.0/
-0.0
100.
0
+0.
0/-0
.010
0.0
+
0.0/
-0.0
100.
0
+0.
0/-0
.0
at 1
01 m
o
See
page
149
– P
erfo
rman
ce n
ote
on D
ual C
ham
ber
Pace
mak
ers w
ith M
easu
rem
ent L
ock-
up E
RIIn
clud
ing
Nor
mal
Bat
tery
D
eple
tion
99.9
+
0.0/
-0.0
99.9
+
0.0/
-0.0
99.8
+
0.0/
-0.0
99.4
+
0.1/
-0.1
98.7
+
0.1/
-0.1
97.2
+
0.1/
-0.1
91.5
+
0.2/
-0.2
70.5
+
0.6/
-0.6
13.0
+3
.0/-
2.7
at
101
mo
EnPu
lse
2 D
RE2
DR2
1Fe
b-0
412
,200
2,20
01,
907
1+
0=
1Ex
clud
ing
Nor
mal
Bat
tery
D
eple
tion
100.
0
+0.
0/-0
.010
0.0
+
0.0/
-0.0
100.
0
+0.
0/-0
.010
0.0
+
0.0/
-0.0
100.
0
+0.
0/-0
.010
0.0
+
0.0/
-0.0
100.
0
+0.
0/-0
.0
at 8
3 m
o
See
page
149
– P
erfo
rman
ce n
ote
on D
ual C
ham
ber
Pace
mak
ers w
ith M
easu
rem
ent L
ock-
up E
RIIn
clud
ing
Nor
mal
Bat
tery
D
eple
tion
99.9
+
0.0/
-0.1
99.5
+
0.1/
-0.2
98.9
+
0.2/
-0.2
97.1
+
0.3/
-0.4
91.0
+
0.6/
-0.7
68.1
+1
.2/-1
.221
.4
+2.0
/-1.9
at
83
mo
EnPu
lse
2 D
RE2
DR3
1,E2
DR3
3 Fe
b-0
459
040
08
0+
0=
0Ex
clud
ing
Nor
mal
Bat
tery
D
eple
tion
100.
0
+0.
0/-0
.010
0.0
+
0.0/
-0.0
100.
0
+0.
0/-0
.010
0.0
+
0.0/
-0.0
100.
0
+0.
0/-0
.010
0.0
+
0.0/
-0.0
100.
0
+0.
0/-0
.010
0.0
+
0.0/
-0.0
100.
0
+0.
0/-0
.0
at 9
9 m
o
See
page
149
– P
erfo
rman
ce n
ote
on D
ual C
ham
ber
Pace
mak
ers w
ith M
easu
rem
ent L
ock-
up E
RIIn
clud
ing
Nor
mal
Bat
tery
D
eple
tion
100.
0
+0.
0/-0
.010
0.0
+
0.0/
-0.0
100.
0
+0.
0/-0
.010
0.0
+
0.0/
-0.0
100.
0
+0.
0/-0
.099
.6
+0.
2/-0
.598
.8
+0.
5/-0
.998
.4
+0.
7/-1
.298
.4
+0.
7/-1
.2
at 9
9 m
o
EnPu
lse
2
SRE2
SR01
, E2
SR03
, E2
SR06
Dec
-03
25,5
007,
200
1,34
11
+5
=6
Excl
udin
g N
orm
al B
atte
ry
Dep
leti
on
100.
0
+0.
0/-0
.010
0.0
+
0.0/
-0.0
100.
0
+0.
0/-0
.010
0.0
+
0.0/
-0.0
100.
0
+0.
0/-0
.010
0.0
+
0.0/
-0.0
100.
0
+0.
0/-0
.010
0.0
+
0.0/
-0.0
99.9
+
0.1/
-0.4
at
97
mo
Incl
udin
g N
orm
al B
atte
ry
Dep
leti
on
99.9
+
0.0/
-0.0
99.8
+
0.1/
-0.1
99.4
+
0.1/
-0.1
98.8
+
0.2/
-0.2
97.3
+
0.2/
-0.3
94.3
+
0.4/
-0.4
85.0
+
0.7/
-0.7
47.4
+2
.5/-
2.5
32.0
+
4.2/
-4.1
at
97
mo
Dev
ice
Surv
ival
Sum
mar
y co
ntin
ued
cont
inue
d
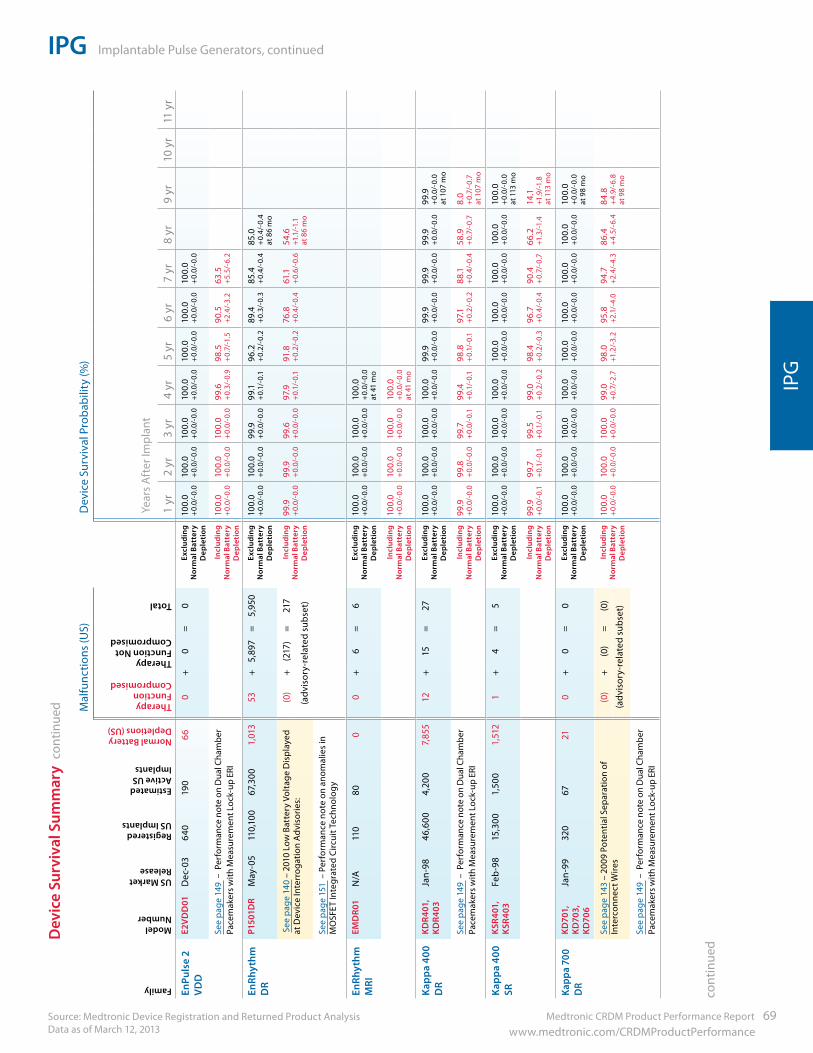
Medtronic CRDM Product Performance Report 69 www.medtronic.com/CRDMProductPerformance
IPG Implantable Pulse Generators, continued
Source: Medtronic Device Registration and Returned Product Analysis Data as of March 12, 2013
IPG
Family
Model Number
US Market Release
Registered US Implants
Estimated Active US Implants
Normal Battery Depletions (US)
Mal
func
tions
(US)
Dev
ice
Surv
ival
Pro
babi
lity
(%)
Therapy Function Compromised
Therapy Function Not Compromised
Total
Year
s A
fter
Impl
ant
1 yr
2 yr
3 yr
4 yr
5 yr
6 yr
7 yr
8 yr
9 yr
10 y
r11
yr
EnPu
lse
2 V
DD
E2V
DD
01D
ec-0
364
019
066
0+
0=
0Ex
clud
ing
Nor
mal
Bat
tery
D
eple
tion
100.
0
+0.
0/-0
.010
0.0
+
0.0/
-0.0
100.
0
+0.
0/-0
.010
0.0
+
0.0/
-0.0
100.
0
+0.
0/-0
.010
0.0
+
0.0/
-0.0
100.
0
+0.
0/-0
.0
See
page
149
– P
erfo
rman
ce n
ote
on D
ual C
ham
ber
Pace
mak
ers w
ith M
easu
rem
ent L
ock-
up E
RIIn
clud
ing
Nor
mal
Bat
tery
D
eple
tion
100.
0
+0.
0/-0
.010
0.0
+
0.0/
-0.0
100.
0
+0.
0/-0
.099
.6
+0.
3/-0
.998
.5
+0.
7/-1
.590
.5
+2.4
/-3.
263
.5
+5.5
/-6.
2
EnRh
ythm
D
RP1
501D
RM
ay-0
511
0,10
067
,300
1,01
353
+5,
897
=5,
950
Excl
udin
g N
orm
al B
atte
ry
Dep
leti
on
100.
0
+0.
0/-0
.010
0.0
+
0.0/
-0.0
99.9
+
0.0/
-0.0
99.1
+
0.1/
-0.1
96.2
+
0.2/
-0.2
89.4
+
0.3/
-0.3
85.4
+
0.4/
-0.4
85.0
+
0.4/
-0.4
at
86
mo
See
pag
e 14
0 –
2010
Low
Bat
tery
Vol
tage
Dis
play
ed
at D
evic
e In
terr
ogat
ion
Adv
isor
ies:
(0
)+
(217
)=
217
Incl
udin
g N
orm
al B
atte
ry
Dep
leti
on
99.9
+
0.0/
-0.0
99.9
+
0.0/
-0.0
99.6
+
0.0/
-0.0
97.9
+
0.1/
-0.1
91.8
+
0.2/
-0.2
76.8
+
0.4/
-0.4
61.1
+
0.6/
-0.6
54.6
+1
.1/-1
.1
at 8
6 m
o(a
dvis
ory-
rela
ted
subs
et)
See
page
151
– P
erfo
rman
ce n
ote
on a
nom
alie
s in
M
OSF
ET In
tegr
ated
Circ
uit T
echn
olog
y
EnRh
ythm
M
RIEM
DR0
1N
/A11
080
00
+6
=6
Excl
udin
g N
orm
al B
atte
ry
Dep
leti
on
100.
0
+0.
0/-0
.010
0.0
+
0.0/
-0.0
100.
0
+0.
0/-0
.010
0.0
+
0.0/
-0.0
at
41
mo
Incl
udin
g N
orm
al B
atte
ry
Dep
leti
on
100.
0
+0.
0/-0
.010
0.0
+
0.0/
-0.0
100.
0
+0.
0/-0
.010
0.0
+
0.0/
-0.0
at
41
mo
Kapp
a 40
0 D
RKD
R401
, KD
R403
Jan-
9846
,600
4,20
07,
855
12+
15=
27Ex
clud
ing
Nor
mal
Bat
tery
D
eple
tion
100.
0
+0.
0/-0
.010
0.0
+
0.0/
-0.0
100.
0
+0.
0/-0
.010
0.0
+
0.0/
-0.0
99.9
+
0.0/
-0.0
99.9
+
0.0/
-0.0
99.9
+
0.0/
-0.0
99.9
+
0.0/
-0.0
99.9
+
0.0/
-0.0
at
107
mo
See
page
149
– P
erfo
rman
ce n
ote
on D
ual C
ham
ber
Pace
mak
ers w
ith M
easu
rem
ent L
ock-
up E
RIIn
clud
ing
Nor
mal
Bat
tery
D
eple
tion
99.9
+
0.0/
-0.0
99.8
+
0.0/
-0.0
99.7
+
0.0/
-0.1
99.4
+
0.1/
-0.1
98.8
+
0.1/
-0.1
97.1
+
0.2/
-0.2
88.1
+
0.4/
-0.4
58.9
+
0.7/
-0.7
8.0
+
0.7/
-0.7
at
107
mo
Kapp
a 40
0 SR
KSR
401,
K
SR40
3Fe
b-9
815
,300
1,50
01,
512
1+
4=
5Ex
clud
ing
Nor
mal
Bat
tery
D
eple
tion
100.
0
+0.
0/-0
.010
0.0
+
0.0/
-0.0
100.
0
+0.
0/-0
.010
0.0
+
0.0/
-0.0
100.
0
+0.
0/-0
.010
0.0
+
0.0/
-0.0
100.
0
+0.
0/-0
.010
0.0
+
0.0/
-0.0
100.
0
+0.
0/-0
.0
at 1
13 m
o
Incl
udin
g N
orm
al B
atte
ry
Dep
leti
on
99.9
+
0.0/
-0.1
99.7
+
0.1/
-0.1
99.5
+
0.1/
-0.1
99.0
+
0.2/
-0.2
98.4
+
0.2/
-0.3
96.7
+
0.4/
-0.4
90.4
+
0.7/
-0.7
66.2
+1
.3/-1
.414
.1
+1.9
/-1.8
at
113
mo
Kapp
a 70
0 D
RKD
701,
KD
703,
KD
706
Jan-
9932
067
210
+0
=0
Excl
udin
g N
orm
al B
atte
ry
Dep
leti
on
100.
0
+0.
0/-0
.010
0.0
+
0.0/
-0.0
100.
0
+0.
0/-0
.010
0.0
+
0.0/
-0.0
100.
0
+0.
0/-0
.010
0.0
+
0.0/
-0.0
100.
0
+0.
0/-0
.010
0.0
+
0.0/
-0.0
100.
0
+0.
0/-0
.0
at 9
8 m
o
See
page
143
– 2
009
Pote
ntia
l Sep
arat
ion
of
Inte
rcon
nect
Wire
s (0
)+
(0)
=(0
)In
clud
ing
Nor
mal
Bat
tery
D
eple
tion
100.
0
+0.
0/-0
.010
0.0
+
0.0/
-0.0
100.
0
+0.
0/-0
.099
.0
+0.
7/-2
.798
.0
+1.2
/-3.
295
.8
+2.1
/-4.
094
.7
+2.4
/-4.
386
.4
+4.
5/-6
.484
.8
+4.
9/-6
.8
at 9
8 m
o(a
dvis
ory-
rela
ted
subs
et)
See
page
149
– P
erfo
rman
ce n
ote
on D
ual C
ham
ber
Pace
mak
ers w
ith M
easu
rem
ent L
ock-
up E
RI
Dev
ice
Surv
ival
Sum
mar
y co
ntin
ued
cont
inue
d
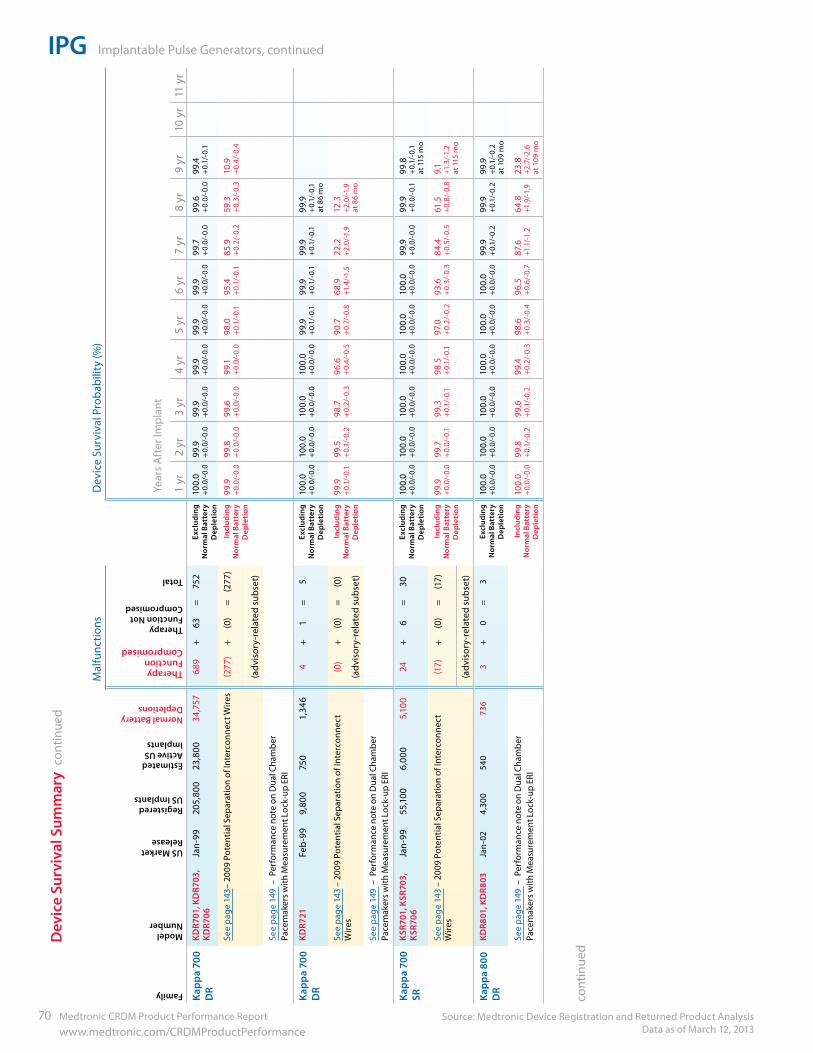
IPG Implantable Pulse Generators, continued
Source: Medtronic Device Registration and Returned Product Analysis Data as of March 12, 2013
70 Medtronic CRDM Product Performance Report www.medtronic.com/CRDMProductPerformance
Family
Model Number
US Market Release
Registered US Implants
Estimated Active US Implants
Normal Battery Depletions
Mal
func
tions
Dev
ice
Surv
ival
Pro
babi
lity
(%)
Therapy Function Compromised
Therapy Function Not Compromised
Total
Year
s A
fter
Impl
ant
1 yr
2 yr
3 yr
4 yr
5 yr
6 yr
7 yr
8 yr
9 yr
10 y
r11
yr
Kapp
a 70
0 D
RKD
R701
, KD
R703
, KD
R706
Jan-
9920
5,80
023
,800
34,7
5768
9+
63=
752
Excl
udin
g N
orm
al B
atte
ry
Dep
leti
on
100.
0
+0.
0/-0
.099
.9
+0.
0/-0
.099
.9
+0.
0/-0
.099
.9
+0.
0/-0
.099
.9
+0.
0/-0
.099
.9
+0.
0/-0
.099
.7
+0.
0/-0
.099
.6
+0.
0/-0
.099
.4
+0.
1/-0
.1
See
page
143
– 20
09 P
oten
tial S
epar
atio
n of
Inte
rcon
nect
Wire
s(2
77)
+(0
)=
(277
)In
clud
ing
Nor
mal
Bat
tery
D
eple
tion
99.9
+
0.0/
-0.0
99.8
+
0.0/
-0.0
99.6
+
0.0/
-0.0
99.1
+
0.0/
-0.0
98.0
+
0.1/
-0.1
95.4
+
0.1/
-0.1
85.9
+
0.2/
-0.2
59.3
+
0.3/
-0.3
10.9
+
0.4/
-0.4
(adv
isor
y-re
late
d su
bset
)
See
page
149
– P
erfo
rman
ce n
ote
on D
ual C
ham
ber
Pace
mak
ers w
ith M
easu
rem
ent L
ock-
up E
RI
Kapp
a 70
0 D
RKD
R721
Feb
-99
9,80
075
01,
346
4+
1=
5Ex
clud
ing
Nor
mal
Bat
tery
D
eple
tion
100.
0
+0.
0/-0
.010
0.0
+
0.0/
-0.0
100.
0
+0.
0/-0
.010
0.0
+
0.0/
-0.0
99.9
+
0.1/
-0.1
99.9
+
0.1/
-0.1
99.9
+
0.1/
-0.1
99.9
+
0.1/
-0.1
at
86
mo
See
page
143
– 2
009
Pote
ntia
l Sep
arat
ion
of In
terc
onne
ct
Wire
s (0
)+
(0)
=(0
)In
clud
ing
Nor
mal
Bat
tery
D
eple
tion
99.9
+
0.1/
-0.1
99.5
+
0.1/
-0.2
98.7
+
0.2/
-0.3
96.6
+
0.4/
-0.5
90.7
+
0.7/
-0.8
68.9
+1
.4/-1
.522
.2
+2.0
/-1.9
12.3
+2
.0/-1
.9
at 8
6 m
o(a
dvis
ory-
rela
ted
subs
et)
See
page
149
– P
erfo
rman
ce n
ote
on D
ual C
ham
ber
Pace
mak
ers w
ith M
easu
rem
ent L
ock-
up E
RI
Kapp
a 70
0 SR
KSR
701,
KSR
703,
K
SR70
6Ja
n-99
55,1
006,
000
5,10
024
+6
=30
Excl
udin
g N
orm
al B
atte
ry
Dep
leti
on
100.
0
+0.
0/-0
.010
0.0
+
0.0/
-0.0
100.
0
+0.
0/-0
.010
0.0
+
0.0/
-0.0
100.
0
+0.
0/-0
.010
0.0
+
0.0/
-0.0
99.9
+
0.0/
-0.0
99.9
+
0.0/
-0.1
99.8
+
0.1/
-0.1
at
115
mo
See
page
143
– 2
009
Pote
ntia
l Sep
arat
ion
of In
terc
onne
ct
Wire
s(1
7)+
(0)
=(1
7)In
clud
ing
Nor
mal
Bat
tery
D
eple
tion
99.9
+
0.0/
-0.0
99.7
+
0.0/
-0.1
99.3
+
0.1/
-0.1
98.5
+
0.1/
-0.1
97.0
+
0.2/
-0.2
93.6
+
0.3/
-0.3
84.4
+
0.5/
-0.5
61.5
+
0.8/
-0.8
9.1
+1
.3/-1
.2
at 1
15 m
o(a
dvis
ory-
rela
ted
subs
et)
Kapp
a 80
0 D
RKD
R801
, KD
R803
Jan-
024,
300
540
736
3+
0=
3Ex
clud
ing
Nor
mal
Bat
tery
D
eple
tion
100.
0
+0.
0/-0
.010
0.0
+
0.0/
-0.0
100.
0
+0.
0/-0
.010
0.0
+
0.0/
-0.0
100.
0
+0.
0/-0
.010
0.0
+
0.0/
-0.0
99.9
+
0.1/
-0.2
99.9
+
0.1/
-0.2
99.9
+
0.1/
-0.2
at
109
mo
See
page
149
– P
erfo
rman
ce n
ote
on D
ual C
ham
ber
Pace
mak
ers w
ith M
easu
rem
ent L
ock-
up E
RIIn
clud
ing
Nor
mal
Bat
tery
D
eple
tion
100.
0
+0.
0/-0
.099
.8
+0.
1/-0
.299
.6
+0.
1/-0
.299
.4
+0.
2/-0
.398
.6
+0.
3/-0
.496
.5
+0.
6/-0
.787
.6
+1.1
/-1.2
64.8
+1
.9/-1
.923
.8
+2.7
/-2.
6
at 1
09 m
o
Dev
ice
Surv
ival
Sum
mar
y co
ntin
ued
cont
inue
d
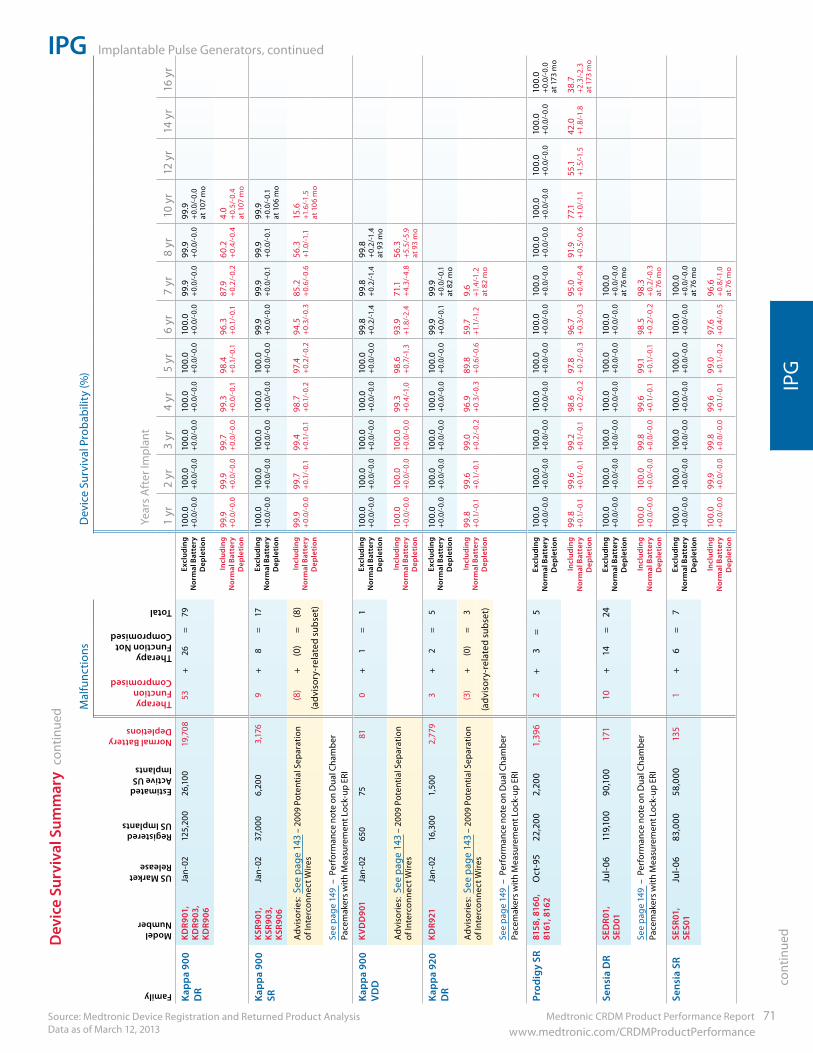
Medtronic CRDM Product Performance Report 71 www.medtronic.com/CRDMProductPerformance
IPG Implantable Pulse Generators, continued
Source: Medtronic Device Registration and Returned Product Analysis Data as of March 12, 2013
IPG
cont
inue
dDev
ice
Surv
ival
Sum
mar
y co
ntin
ued
Family
Model Number
US Market Release
Registered US Implants
Estimated Active US Implants
Normal Battery Depletions
Mal
func
tions
Dev
ice
Surv
ival
Pro
babi
lity
(%)
Therapy Function Compromised
Therapy Function Not Compromised
Total
Year
s A
fter
Impl
ant
1 yr
2 yr
3 yr
4 yr
5 yr
6 yr
7 yr
8 yr
10 y
r12
yr
14 y
r16
yr
Kapp
a 90
0 D
RKD
R901
, KD
R903
, KD
R906
Jan-
0212
5,20
026
,100
19,7
0853
+26
=79
Excl
udin
g N
orm
al B
atte
ry
Dep
leti
on
100.
0
+0.
0/-0
.010
0.0
+
0.0/
-0.0
100.
0
+0.
0/-0
.010
0.0
+
0.0/
-0.0
100.
0
+0.
0/-0
.010
0.0
+
0.0/
-0.0
99.9
+
0.0/
-0.0
99.9
+
0.0/
-0.0
99.9
+
0.0/
-0.0
at
107
mo
Incl
udin
g N
orm
al B
atte
ry
Dep
leti
on
99.9
+
0.0/
-0.0
99.9
+
0.0/
-0.0
99.7
+
0.0/
-0.0
99.3
+
0.0/
-0.1
98.4
+
0.1/
-0.1
96.3
+
0.1/
-0.1
87.9
+
0.2/
-0.2
60.2
+
0.4/
-0.4
4.0
+
0.5/
-0.4
at
107
mo
Kapp
a 90
0 SR
KSR
901,
K
SR90
3,
KSR
906
Jan-
0237
,000
6,20
03,
176
9+
8=
17Ex
clud
ing
Nor
mal
Bat
tery
D
eple
tion
100.
0
+0.
0/-0
.010
0.0
+
0.0/
-0.0
100.
0
+0.
0/-0
.010
0.0
+
0.0/
-0.0
100.
0
+0.
0/-0
.099
.9
+0.
0/-0
.099
.9
+0.
0/-0
.199
.9
+0.
0/-0
.199
.9
+0.
0/-0
.1
at 1
06 m
o
Adv
isor
ies:
See
pag
e 14
3 –
2009
Pot
entia
l Sep
arat
ion
of In
terc
onne
ct W
ires
(8)
+(0
)=
(8)
Incl
udin
g N
orm
al B
atte
ry
Dep
leti
on
99.9
+
0.0/
-0.0
99.7
+
0.1/
-0.1
99.4
+
0.1/
-0.1
98.7
+
0.1/
-0.2
97.4
+
0.2/
-0.2
94.5
+
0.3/
-0.3
85.2
+
0.6/
-0.6
56.3
+1
.0/-1
.115
.6
+1.6
/-1.5
at
106
mo
(adv
isor
y-re
late
d su
bset
)
See
page
149
– P
erfo
rman
ce n
ote
on D
ual C
ham
ber
Pace
mak
ers w
ith M
easu
rem
ent L
ock-
up E
RI
Kapp
a 90
0 V
DD
KV
DD
901
Jan-
0265
075
810
+1
=1
Excl
udin
g N
orm
al B
atte
ry
Dep
leti
on
100.
0
+0.
0/-0
.010
0.0
+
0.0/
-0.0
100.
0
+0.
0/-0
.010
0.0
+
0.0/
-0.0
100.
0
+0.
0/-0
.099
.8
+0.
2/-1
.499
.8
+0.
2/-1
.499
.8
+0.
2/-1
.4
at 9
3 m
o
Adv
isor
ies:
See
pag
e 14
3 –
2009
Pot
entia
l Sep
arat
ion
of In
terc
onne
ct W
ires
Incl
udin
g N
orm
al B
atte
ry
Dep
leti
on
100.
0
+0.
0/-0
.010
0.0
+
0.0/
-0.0
100.
0
+0.
0/-0
.099
.3
+0.
4/-1
.098
.6
+0.
7/-1
.393
.9
+1.8
/-2.
471
.1
+4.
3/-4
.856
.3
+5.5
/-5.
9
at 9
3 m
o
Kapp
a 92
0 D
RKD
R921
Jan-
0216
,300
1,50
02,
779
3+
2=
5Ex
clud
ing
Nor
mal
Bat
tery
D
eple
tion
100.
0
+0.
0/-0
.010
0.0
+
0.0/
-0.0
100.
0
+0.
0/-0
.010
0.0
+
0.0/
-0.0
100.
0
+0.
0/-0
.099
.9
+0.
0/-0
.199
.9
+0.
0/-0
.1
at 8
2 m
o
Adv
isor
ies:
See
pag
e 14
3 –
2009
Pot
entia
l Sep
arat
ion
of In
terc
onne
ct W
ires
(3)
+(0
)=
3In
clud
ing
Nor
mal
Bat
tery
D
eple
tion
99.8
+
0.1/
-0.1
99.6
+
0.1/
-0.1
99.0
+
0.2/
-0.2
96.9
+
0.3/
-0.3
89.8
+
0.6/
-0.6
59.7
+1
.1/-1
.29.
6
+1.4
/-1.2
at
82
mo
(adv
isor
y-re
late
d su
bset
)
See
page
149
– P
erfo
rman
ce n
ote
on D
ual C
ham
ber
Pace
mak
ers w
ith M
easu
rem
ent L
ock-
up E
RI
Prod
igy
SR81
58, 8
160,
81
61, 8
162
Oct
-95
22,2
002,
200
1,39
62
+3
=5
Excl
udin
g N
orm
al B
atte
ry
Dep
leti
on
100.
0
+0.
0/-0
.010
0.0
+
0.0/
-0.0
100.
0
+0.
0/-0
.010
0.0
+
0.0/
-0.0
100.
0
+0.
0/-0
.010
0.0
+
0.0/
-0.0
100.
0
+0.
0/-0
.010
0.0
+
0.0/
-0.0
100.
0
+0.
0/-0
.010
0.0
+
0.0/
-0.0
100.
0
+0.
0/-0
.010
0.0
+
0.0/
-0.0
at
173
mo
Incl
udin
g N
orm
al B
atte
ry
Dep
leti
on
99.8
+
0.1/
-0.1
99.6
+
0.1/
-0.1
99.2
+
0.1/
-0.1
98.6
+
0.2/
-0.2
97.8
+
0.2/
-0.3
96.7
+
0.3/
-0.3
95.0
+
0.4/
-0.4
91.9
+
0.5/
-0.6
77.1
+1
.0/-1
.155
.1
+1.5
/-1.5
42.0
+1
.8/-1
.838
.7
+2.3
/-2.
3
at 1
73 m
o
Sens
ia D
RSE
DR0
1,
SED
01Ju
l-06
119,
100
90,1
0017
110
+14
=24
Excl
udin
g N
orm
al B
atte
ry
Dep
leti
on
100.
0
+0.
0/-0
.010
0.0
+
0.0/
-0.0
100.
0
+0.
0/-0
.010
0.0
+
0.0/
-0.0
100.
0
+0.
0/-0
.010
0.0
+
0.0/
-0.0
100.
0
+0.
0/-0
.0
at 7
6 m
o
See
page
149
– P
erfo
rman
ce n
ote
on D
ual C
ham
ber
Pace
mak
ers w
ith M
easu
rem
ent L
ock-
up E
RIIn
clud
ing
Nor
mal
Bat
tery
D
eple
tion
100.
0
+0.
0/-0
.010
0.0
+
0.0/
-0.0
99.8
+
0.0/
-0.0
99.6
+
0.1/
-0.1
99.1
+
0.1/
-0.1
98.5
+
0.2/
-0.2
98.3
+
0.2/
-0.3
at
76
mo
Sens
ia S
RSE
SR01
, SE
S01
Jul-
0683
,000
58,0
0013
51
+6
=7
Excl
udin
g N
orm
al B
atte
ry
Dep
leti
on
100.
0
+0.
0/-0
.010
0.0
+
0.0/
-0.0
100.
0
+0.
0/-0
.010
0.0
+
0.0/
-0.0
100.
0
+0.
0/-0
.010
0.0
+
0.0/
-0.0
100.
0
+0.
0/-0
.0
at 7
6 m
o
Incl
udin
g N
orm
al B
atte
ry
Dep
leti
on
100.
0
+0.
0/-0
.099
.9
+0.
0/-0
.099
.8
+0.
0/-0
.099
.6
+0.
1/-0
.199
.0
+0.
1/-0
.297
.6
+0.
4/-0
.596
.6
+0.
8/-1
.0
at 7
6 m
o
Family
Model Number
US Market Release
Registered US Implants
Estimated Active US Implants
Normal Battery Depletions
Mal
func
tions
Dev
ice
Surv
ival
Pro
babi
lity
(%)
Therapy Function Compromised
Therapy Function Not Compromised
Total
Year
s A
fter
Impl
ant
1 yr
2 yr
3 yr
4 yr
5 yr
6 yr
7 yr
8 yr
9 yr
10 y
r11
yr
Kapp
a 70
0 D
RKD
R701
, KD
R703
, KD
R706
Jan-
9920
5,80
023
,800
34,7
5768
9+
63=
752
Excl
udin
g N
orm
al B
atte
ry
Dep
leti
on
100.
0
+0.
0/-0
.099
.9
+0.
0/-0
.099
.9
+0.
0/-0
.099
.9
+0.
0/-0
.099
.9
+0.
0/-0
.099
.9
+0.
0/-0
.099
.7
+0.
0/-0
.099
.6
+0.
0/-0
.099
.4
+0.
1/-0
.1
See
page
143
– 20
09 P
oten
tial S
epar
atio
n of
Inte
rcon
nect
Wire
s(2
77)
+(0
)=
(277
)In
clud
ing
Nor
mal
Bat
tery
D
eple
tion
99.9
+
0.0/
-0.0
99.8
+
0.0/
-0.0
99.6
+
0.0/
-0.0
99.1
+
0.0/
-0.0
98.0
+
0.1/
-0.1
95.4
+
0.1/
-0.1
85.9
+
0.2/
-0.2
59.3
+
0.3/
-0.3
10.9
+
0.4/
-0.4
(adv
isor
y-re
late
d su
bset
)
See
page
149
– P
erfo
rman
ce n
ote
on D
ual C
ham
ber
Pace
mak
ers w
ith M
easu
rem
ent L
ock-
up E
RI
Kapp
a 70
0 D
RKD
R721
Feb
-99
9,80
075
01,
346
4+
1=
5Ex
clud
ing
Nor
mal
Bat
tery
D
eple
tion
100.
0
+0.
0/-0
.010
0.0
+
0.0/
-0.0
100.
0
+0.
0/-0
.010
0.0
+
0.0/
-0.0
99.9
+
0.1/
-0.1
99.9
+
0.1/
-0.1
99.9
+
0.1/
-0.1
99.9
+
0.1/
-0.1
at
86
mo
See
page
143
– 2
009
Pote
ntia
l Sep
arat
ion
of In
terc
onne
ct
Wire
s (0
)+
(0)
=(0
)In
clud
ing
Nor
mal
Bat
tery
D
eple
tion
99.9
+
0.1/
-0.1
99.5
+
0.1/
-0.2
98.7
+
0.2/
-0.3
96.6
+
0.4/
-0.5
90.7
+
0.7/
-0.8
68.9
+1
.4/-1
.522
.2
+2.0
/-1.9
12.3
+2
.0/-1
.9
at 8
6 m
o(a
dvis
ory-
rela
ted
subs
et)
See
page
149
– P
erfo
rman
ce n
ote
on D
ual C
ham
ber
Pace
mak
ers w
ith M
easu
rem
ent L
ock-
up E
RI
Kapp
a 70
0 SR
KSR
701,
KSR
703,
K
SR70
6Ja
n-99
55,1
006,
000
5,10
024
+6
=30
Excl
udin
g N
orm
al B
atte
ry
Dep
leti
on
100.
0
+0.
0/-0
.010
0.0
+
0.0/
-0.0
100.
0
+0.
0/-0
.010
0.0
+
0.0/
-0.0
100.
0
+0.
0/-0
.010
0.0
+
0.0/
-0.0
99.9
+
0.0/
-0.0
99.9
+
0.0/
-0.1
99.8
+
0.1/
-0.1
at
115
mo
See
page
143
– 2
009
Pote
ntia
l Sep
arat
ion
of In
terc
onne
ct
Wire
s(1
7)+
(0)
=(1
7)In
clud
ing
Nor
mal
Bat
tery
D
eple
tion
99.9
+
0.0/
-0.0
99.7
+
0.0/
-0.1
99.3
+
0.1/
-0.1
98.5
+
0.1/
-0.1
97.0
+
0.2/
-0.2
93.6
+
0.3/
-0.3
84.4
+
0.5/
-0.5
61.5
+
0.8/
-0.8
9.1
+1
.3/-1
.2
at 1
15 m
o(a
dvis
ory-
rela
ted
subs
et)
Kapp
a 80
0 D
RKD
R801
, KD
R803
Jan-
024,
300
540
736
3+
0=
3Ex
clud
ing
Nor
mal
Bat
tery
D
eple
tion
100.
0
+0.
0/-0
.010
0.0
+
0.0/
-0.0
100.
0
+0.
0/-0
.010
0.0
+
0.0/
-0.0
100.
0
+0.
0/-0
.010
0.0
+
0.0/
-0.0
99.9
+
0.1/
-0.2
99.9
+
0.1/
-0.2
99.9
+
0.1/
-0.2
at
109
mo
See
page
149
– P
erfo
rman
ce n
ote
on D
ual C
ham
ber
Pace
mak
ers w
ith M
easu
rem
ent L
ock-
up E
RIIn
clud
ing
Nor
mal
Bat
tery
D
eple
tion
100.
0
+0.
0/-0
.099
.8
+0.
1/-0
.299
.6
+0.
1/-0
.299
.4
+0.
2/-0
.398
.6
+0.
3/-0
.496
.5
+0.
6/-0
.787
.6
+1.1
/-1.2
64.8
+1
.9/-1
.923
.8
+2.7
/-2.
6
at 1
09 m
o
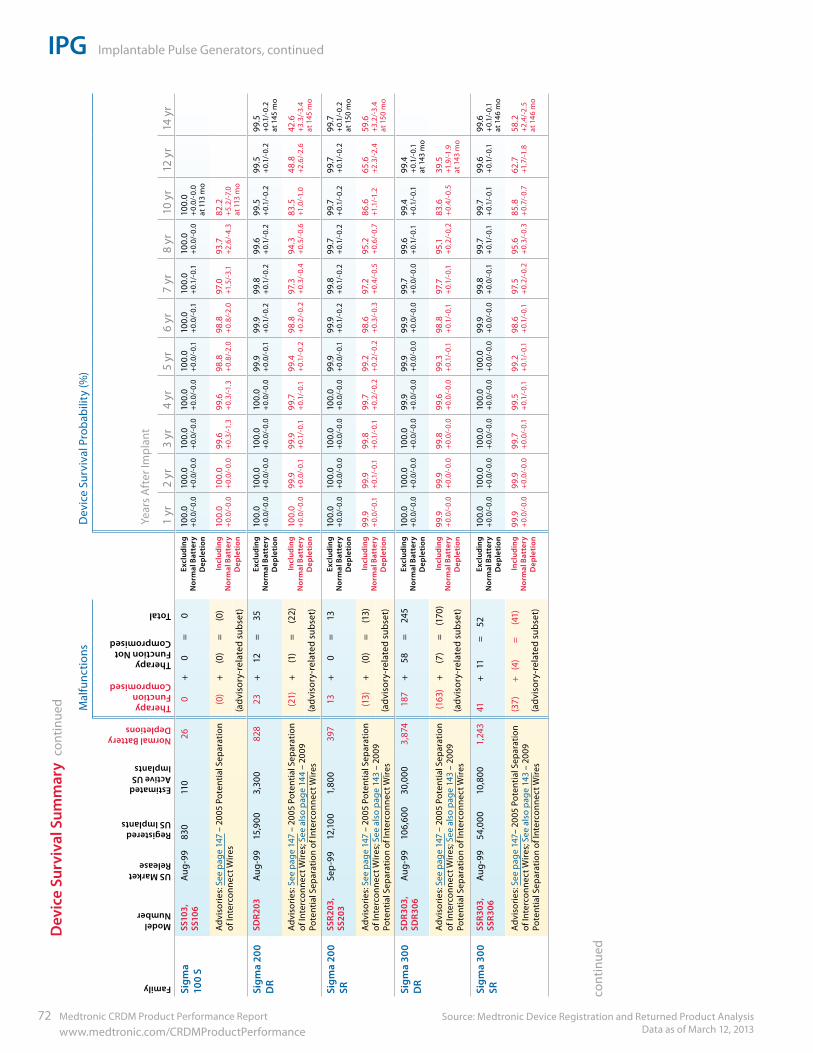
IPG Implantable Pulse Generators, continued
Source: Medtronic Device Registration and Returned Product Analysis Data as of March 12, 2013
72 Medtronic CRDM Product Performance Report www.medtronic.com/CRDMProductPerformance
cont
inue
d
Dev
ice
Surv
ival
Sum
mar
y co
ntin
ued
Family
Model Number
US Market Release
Registered US Implants
Estimated Active US Implants
Normal Battery Depletions
Mal
func
tions
Dev
ice
Surv
ival
Pro
babi
lity
(%)
Therapy Function Compromised
Therapy Function Not Compromised
Total
Year
s A
fter
Impl
ant
1 yr
2 yr
3 yr
4 yr
5 yr
6 yr
7 yr
8 yr
10 y
r12
yr
14 y
rSi
gma
100
SSS
103,
SS
106
Aug
-99
830
110
260
+0
=0
Excl
udin
g N
orm
al B
atte
ry
Dep
leti
on
100.
0
+0.
0/-0
.010
0.0
+
0.0/
-0.0
100.
0
+0.
0/-0
.010
0.0
+
0.0/
-0.0
100.
0 +
0.0/
-0.1
100.
0 +
0.0/
-0.1
100.
0 +
0.1/
-0.1
100.
0
+0.
0/-0
.010
0.0
+
0.0/
-0.0
at
113
mo
Adv
isor
ies:
See
pag
e 14
7 –
2005
Pot
entia
l Sep
arat
ion
of In
terc
onne
ct W
ires
(0)
+(0
)=
(0)
Incl
udin
g N
orm
al B
atte
ry
Dep
leti
on
100.
0
+0.
0/-0
.010
0.0
+
0.0/
-0.0
99.6
+
0.3/
-1.3
99.6
+
0.3/
-1.3
98.8
+
0.8/
-2.0
98.8
+
0.8/
-2.0
97.0
+1
.5/-
3.1
93.7
+2
.6/-
4.3
82.2
+5
.2/-
7.0
at
113
mo
(adv
isor
y-re
late
d su
bset
)
Sigm
a 20
0 D
RSD
R203
Aug
-99
15,9
003,
300
828
23+
12=
35Ex
clud
ing
Nor
mal
Bat
tery
D
eple
tion
100.
0
+0.
0/-0
.010
0.0
+
0.0/
-0.0
100.
0
+0.
0/-0
.010
0.0
+
0.0/
-0.0
99.9
+
0.0/
-0.1
99.9
+
0.1/
-0.2
99.8
+
0.1/
-0.2
99.6
+
0.1/
-0.2
99.5
+
0.1/
-0.2
99.5
+
0.1/
-0.2
99.5
+
0.1/
-0.2
at
145
mo
Adv
isor
ies:
See
pag
e 14
7 –
2005
Pot
entia
l Sep
arat
ion
of In
terc
onne
ct W
ires;
See
als
o pa
ge 1
44 –
200
9 Po
tent
ial S
epar
atio
n of
Inte
rcon
nect
Wire
s
(21)
+(1
)=
(22)
Incl
udin
g N
orm
al B
atte
ry
Dep
leti
on
100.
0
+0.
0/-0
.099
.9
+0.
0/-0
.199
.9
+0.
1/-0
.199
.7
+0.
1/-0
.199
.4
+0.
1/-0
.298
.8
+0.
2/-0
.297
.3
+0.
3/-0
.494
.3
+0.
5/-0
.683
.5
+1.0
/-1.0
48.8
+2
.6/-
2.6
42.6
+3
.3/-
3.4
at
145
mo
(adv
isor
y-re
late
d su
bset
)
Sigm
a 20
0 SR
SSR2
03,
SS20
3Se
p-9
912
,100
1,80
039
713
+0
=13
Excl
udin
g N
orm
al B
atte
ry
Dep
leti
on
100.
0
+0.
0/-0
.010
0.0
+
0.0/
-0.0
100.
0
+0.
0/-0
.010
0.0
+
0.0/
-0.0
99.9
+
0.0/
-0.1
99.9
+
0.1/
-0.2
99.8
+
0.1/
-0.2
99.7
+
0.1/
-0.2
99.7
+
0.1/
-0.2
99.7
+
0.1/
-0.2
99.7
+
0.1/
-0.2
at
150
mo
Adv
isor
ies:
See
pag
e 14
7 –
2005
Pot
entia
l Sep
arat
ion
of In
terc
onne
ct W
ires;
See
als
o pa
ge 1
43 –
200
9 Po
tent
ial S
epar
atio
n of
Inte
rcon
nect
Wire
s
(13)
+(0
)=
(13)
Incl
udin
g N
orm
al B
atte
ry
Dep
leti
on
99.9
+
0.0/
-0.1
99.9
+
0.1/
-0.1
99.8
+
0.1/
-0.1
99.7
+
0.2/
-0.2
99.2
+
0.2/
-0.2
98.6
+
0.3/
-0.3
97.2
+
0.4/
-0.5
95.2
+
0.6/
-0.7
86.6
+1
.1/-1
.265
.6
+2.3
/-2.
459
.6
+3.2
/-3.
4
at 1
50 m
o(a
dvis
ory-
rela
ted
subs
et)
Sigm
a 30
0 D
RSD
R303
, SD
R306
Aug
-99
106,
600
30,0
003,
874
187
+58
=24
5Ex
clud
ing
Nor
mal
Bat
tery
D
eple
tion
100.
0
+0.
0/-0
.010
0.0
+
0.0/
-0.0
100.
0
+0.
0/-0
.099
.9
+0.
0/-0
.099
.9
+0.
0/-0
.099
.9
+0.
0/-0
.099
.7
+0.
0/-0
.099
.6
+0.
1/-0
.199
.4
+0.
1/-0
.199
.4
+0.
1/-0
.1
at 1
43 m
o
Adv
isor
ies:
See
pag
e 14
7 –
2005
Pot
entia
l Sep
arat
ion
of In
terc
onne
ct W
ires;
See
als
o pa
ge 1
43 –
200
9 Po
tent
ial S
epar
atio
n of
Inte
rcon
nect
Wire
s
(163
)+
(7)
=(1
70)
Incl
udin
g N
orm
al B
atte
ry
Dep
leti
on
99.9
+
0.0/
-0.0
99.9
+
0.0/
-0.0
99.8
+
0.0/
-0.0
99.6
+
0.0/
-0.0
99.3
+
0.1/
-0.1
98.8
+
0.1/
-0.1
97.7
+
0.1/
-0.1
95.1
+
0.2/
-0.2
83.6
+
0.4/
-0.5
39.5
+1
.9/-1
.9
at 1
43 m
o(a
dvis
ory-
rela
ted
subs
et)
Sigm
a 30
0 SR
SSR3
03,
SSR3
06A
ug-9
954
,000
10,8
001,
243
41+
11=
52Ex
clud
ing
Nor
mal
Bat
tery
D
eple
tion
100.
0
+0.
0/-0
.010
0.0
+
0.0/
-0.0
100.
0
+0.
0/-0
.010
0.0
+
0.0/
-0.0
100.
0
+0.
0/-0
.099
.9
+0.
0/-0
.099
.8
+0.
0/-0
.199
.7
+0.
1/-0
.199
.7
+0.
1/-0
.199
.6
+0.
1/-0
.199
.6
+0.
1/-0
.1
at 1
46 m
o
Adv
isor
ies:
See
pag
e 14
7– 2
005
Pote
ntia
l Sep
arat
ion
of In
terc
onne
ct W
ires;
See
als
o pa
ge 1
43 –
200
9 Po
tent
ial S
epar
atio
n of
Inte
rcon
nect
Wire
s
(37)
+
(4)
=
(41
) (a
dvis
ory-
rela
ted
subs
et)
Incl
udin
g N
orm
al B
atte
ry
Dep
leti
on
99.9
+
0.0/
-0.0
99.9
+
0.0/
-0.0
99.7
+
0.0/
-0.1
99.5
+
0.1/
-0.1
99.2
+
0.1/
-0.1
98.6
+
0.1/
-0.1
97.5
+
0.2/
-0.2
95.6
+
0.3/
-0.3
85.8
+
0.7/
-0.7
62.7
+1
.7/-1
.858
.2
+2.4
/-2.
5
at 1
46 m
o
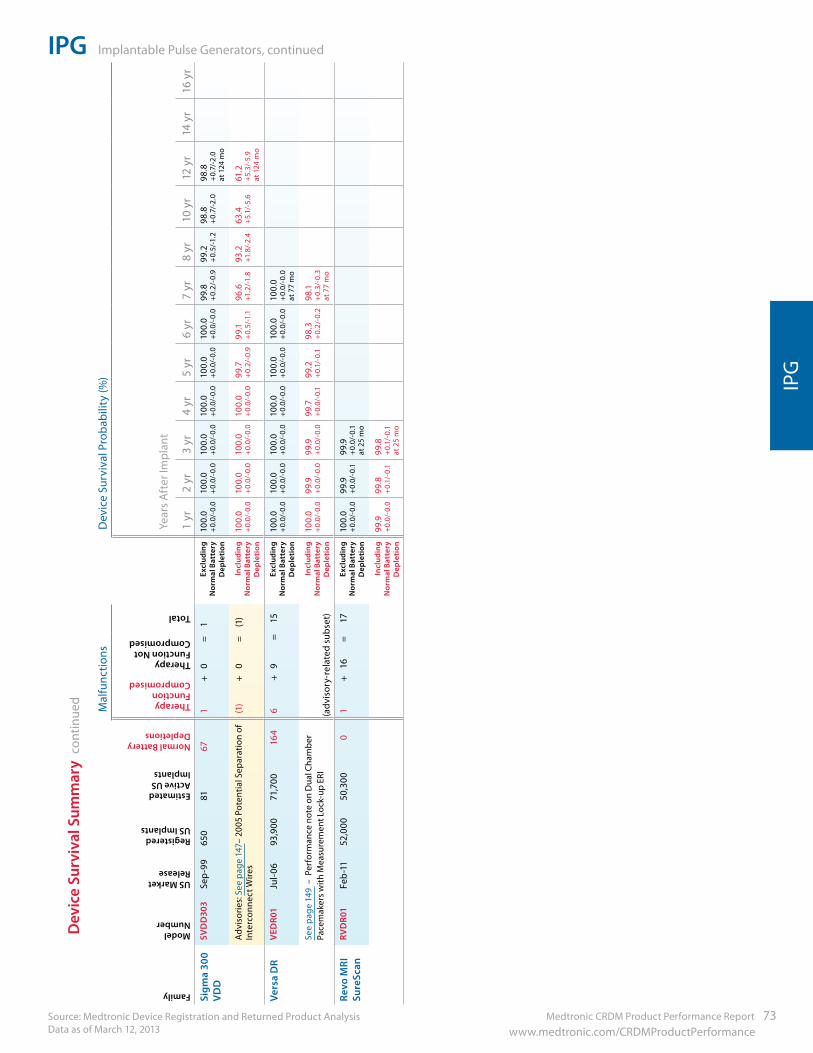
Medtronic CRDM Product Performance Report 73 www.medtronic.com/CRDMProductPerformance
IPG Implantable Pulse Generators, continued
Source: Medtronic Device Registration and Returned Product Analysis Data as of March 12, 2013
IPG
Dev
ice
Surv
ival
Sum
mar
y co
ntin
ued
Family
Model Number
US Market Release
Registered US Implants
Estimated Active US Implants
Normal Battery Depletions
Mal
func
tions
Dev
ice
Surv
ival
Pro
babi
lity
(%)
Therapy Function Compromised
Therapy Function Not Compromised
Total
Year
s A
fter
Impl
ant
1 yr
2 yr
3 yr
4 yr
5 yr
6 yr
7 yr
8 yr
10 y
r12
yr
14 y
r16
yr
Sigm
a 30
0 V
DD
SVD
D30
3Se
p-9
965
081
671
+0
=1
Excl
udin
g N
orm
al B
atte
ry
Dep
leti
on
100.
0
+0.
0/-0
.010
0.0
+
0.0/
-0.0
100.
0
+0.
0/-0
.010
0.0
+
0.0/
-0.0
100.
0
+0.
0/-0
.010
0.0
+
0.0/
-0.0
99.8
+
0.2/
-0.9
99.2
+
0.5/
-1.2
98.8
+
0.7/
-2.0
98.8
+
0.7/
-2.0
at
124
mo
Adv
isor
ies:
See
pag
e 14
7– 2
005
Pote
ntia
l Sep
arat
ion
of
Inte
rcon
nect
Wire
s(1
)+
0=
(1)
Incl
udin
g N
orm
al B
atte
ry
Dep
leti
on
100.
0
+0.
0/-0
.010
0.0
+
0.0/
-0.0
100.
0
+0.
0/-0
.010
0.0
+
0.0/
-0.0
99.7
+
0.2/
-0.9
99.1
+
0.5/
-1.1
96.6
+1
.2/-1
.893
.2
+1.8
/-2.
463
.4
+5.1
/-5.
661
.2
+5.3
/-5.
9
at 1
24 m
o
Vers
a D
RV
EDR0
1Ju
l-06
93,9
0071
,700
164
6+
9=
15Ex
clud
ing
Nor
mal
Bat
tery
D
eple
tion
100.
0
+0.
0/-0
.010
0.0
+
0.0/
-0.0
100.
0
+0.
0/-0
.010
0.0
+
0.0/
-0.0
100.
0
+0.
0/-0
.010
0.0
+
0.0/
-0.0
100.
0
+0.
0/-0
.0
at 7
7 m
o
See
page
149
– P
erfo
rman
ce n
ote
on D
ual C
ham
ber
Pace
mak
ers w
ith M
easu
rem
ent L
ock-
up E
RIIn
clud
ing
Nor
mal
Bat
tery
D
eple
tion
100.
0
+0.
0/-0
.099
.9
+0.
0/-0
.099
.9
+0.
0/-0
.099
.7
+0.
0/-0
.199
.2
+0.
1/-0
.198
.3
+0.
2/-0
.298
.1
+0.
3/-0
.3
at 7
7 m
o
Revo
MRI
Su
reSc
anRV
DR0
1Fe
b-1
152
,000
50,3
000
1+
16=
17Ex
clud
ing
Nor
mal
Bat
tery
D
eple
tion
100.
0
+0.
0/-0
.099
.9
+0.
0/-0
.199
.9
+0.
0/-0
.1
at 2
5 m
o
Incl
udin
g N
orm
al B
atte
ry
Dep
leti
on
99.9
+
0.0/
-0.0
99.8
+
0.1/
-0.1
99.8
+
0.1/
-0.1
at
25
mo
(adv
isor
y-re
late
d su
bset
)
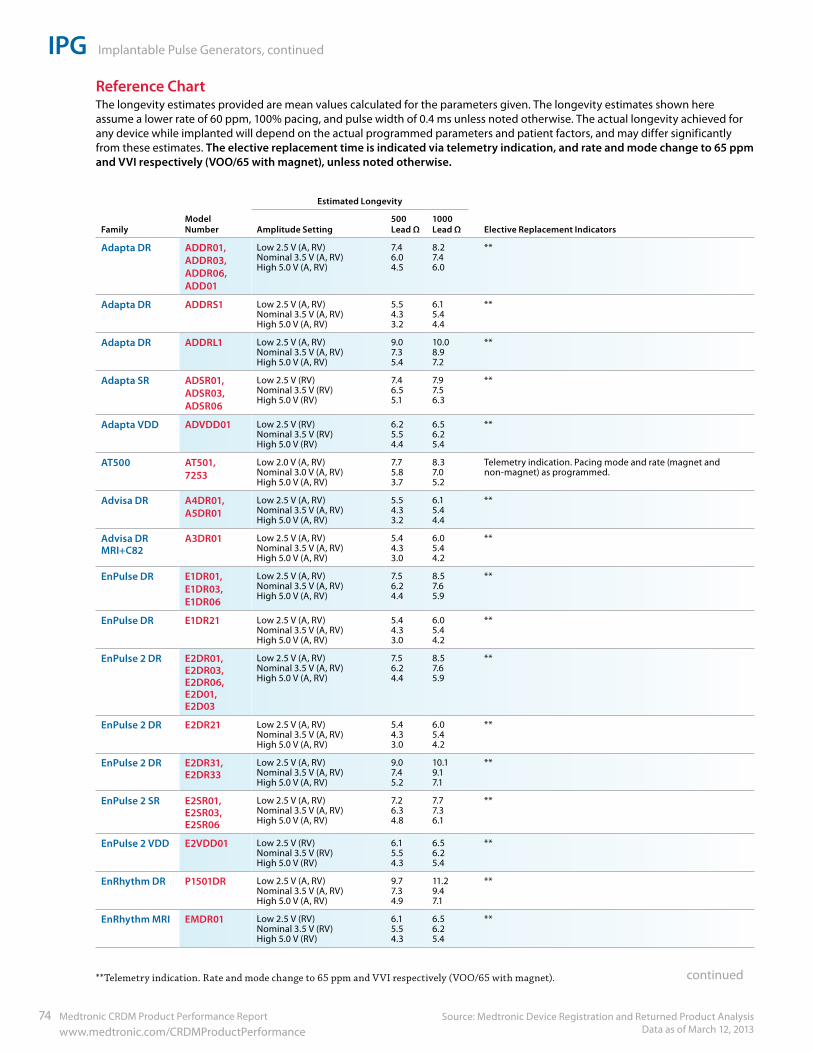
IPG Implantable Pulse Generators, continued
Source: Medtronic Device Registration and Returned Product Analysis Data as of March 12, 2013
74 Medtronic CRDM Product Performance Report www.medtronic.com/CRDMProductPerformance
Reference ChartThe longevity estimates provided are mean values calculated for the parameters given. The longevity estimates shown here assume a lower rate of 60 ppm, 100% pacing, and pulse width of 0.4 ms unless noted otherwise. The actual longevity achieved for any device while implanted will depend on the actual programmed parameters and patient factors, and may differ significantly from these estimates. The elective replacement time is indicated via telemetry indication, and rate and mode change to 65 ppm and VVI respectively (VOO/65 with magnet), unless noted otherwise.
FamilyModelNumber
Estimated Longevity
Elective Replacement IndicatorsAmplitude Setting500 Lead Ω
1000 Lead Ω
Adapta DR ADDR01, ADDR03, ADDR06, ADD01
Low 2.5 V (A, RV) Nominal 3.5 V (A, RV) High 5.0 V (A, RV)
7.4 6.0 4.5
8.2 7.4 6.0
**
Adapta DR ADDRS1 Low 2.5 V (A, RV) Nominal 3.5 V (A, RV) High 5.0 V (A, RV)
5.5 4.3 3.2
6.1 5.4 4.4
**
Adapta DR ADDRL1 Low 2.5 V (A, RV) Nominal 3.5 V (A, RV) High 5.0 V (A, RV)
9.0 7.3 5.4
10.0 8.97.2
**
Adapta SR ADSR01, ADSR03, ADSR06
Low 2.5 V (RV) Nominal 3.5 V (RV) High 5.0 V (RV)
7.4 6.5 5.1
7.9 7.5 6.3
**
Adapta VDD ADVDD01 Low 2.5 V (RV) Nominal 3.5 V (RV) High 5.0 V (RV)
6.2 5.5 4.4
6.5 6.2 5.4
**
AT500 AT501, 7253
Low 2.0 V (A, RV) Nominal 3.0 V (A, RV) High 5.0 V (A, RV)
7.7 5.8 3.7
8.3 7.0 5.2
Telemetry indication. Pacing mode and rate (magnet and non-magnet) as programmed.
Advisa DR A4DR01, A5DR01
Low 2.5 V (A, RV) Nominal 3.5 V (A, RV) High 5.0 V (A, RV)
5.5 4.3 3.2
6.1 5.4 4.4
**
Advisa DR MRI+C82
A3DR01 Low 2.5 V (A, RV) Nominal 3.5 V (A, RV) High 5.0 V (A, RV)
5.4 4.3 3.0
6.0 5.4 4.2
**
EnPulse DR E1DR01, E1DR03, E1DR06
Low 2.5 V (A, RV) Nominal 3.5 V (A, RV) High 5.0 V (A, RV)
7.5 6.2 4.4
8.5 7.6 5.9
**
EnPulse DR E1DR21 Low 2.5 V (A, RV) Nominal 3.5 V (A, RV) High 5.0 V (A, RV)
5.4 4.3 3.0
6.0 5.4 4.2
**
EnPulse 2 DR E2DR01, E2DR03, E2DR06, E2D01, E2D03
Low 2.5 V (A, RV) Nominal 3.5 V (A, RV) High 5.0 V (A, RV)
7.5 6.2 4.4
8.5 7.6 5.9
**
EnPulse 2 DR E2DR21 Low 2.5 V (A, RV) Nominal 3.5 V (A, RV) High 5.0 V (A, RV)
5.4 4.3 3.0
6.0 5.4 4.2
**
EnPulse 2 DR E2DR31, E2DR33
Low 2.5 V (A, RV)Nominal 3.5 V (A, RV) High 5.0 V (A, RV)
9.0 7.4 5.2
10.1 9.1 7.1
**
EnPulse 2 SR E2SR01, E2SR03, E2SR06
Low 2.5 V (A, RV) Nominal 3.5 V (A, RV) High 5.0 V (A, RV)
7.2 6.3 4.8
7.7 7.3 6.1
**
EnPulse 2 VDD E2VDD01 Low 2.5 V (RV) Nominal 3.5 V (RV) High 5.0 V (RV)
6.1 5.5 4.3
6.5 6.2 5.4
**
EnRhythm DR P1501DR Low 2.5 V (A, RV) Nominal 3.5 V (A, RV) High 5.0 V (A, RV)
9.77.34.9
11.29.4 7.1
**
EnRhythm MRI EMDR01 Low 2.5 V (RV) Nominal 3.5 V (RV) High 5.0 V (RV)
6.1 5.5 4.3
6.5 6.2 5.4
**
continued**Telemetry indication. Rate and mode change to 65 ppm and VVI respectively (VOO/65 with magnet).
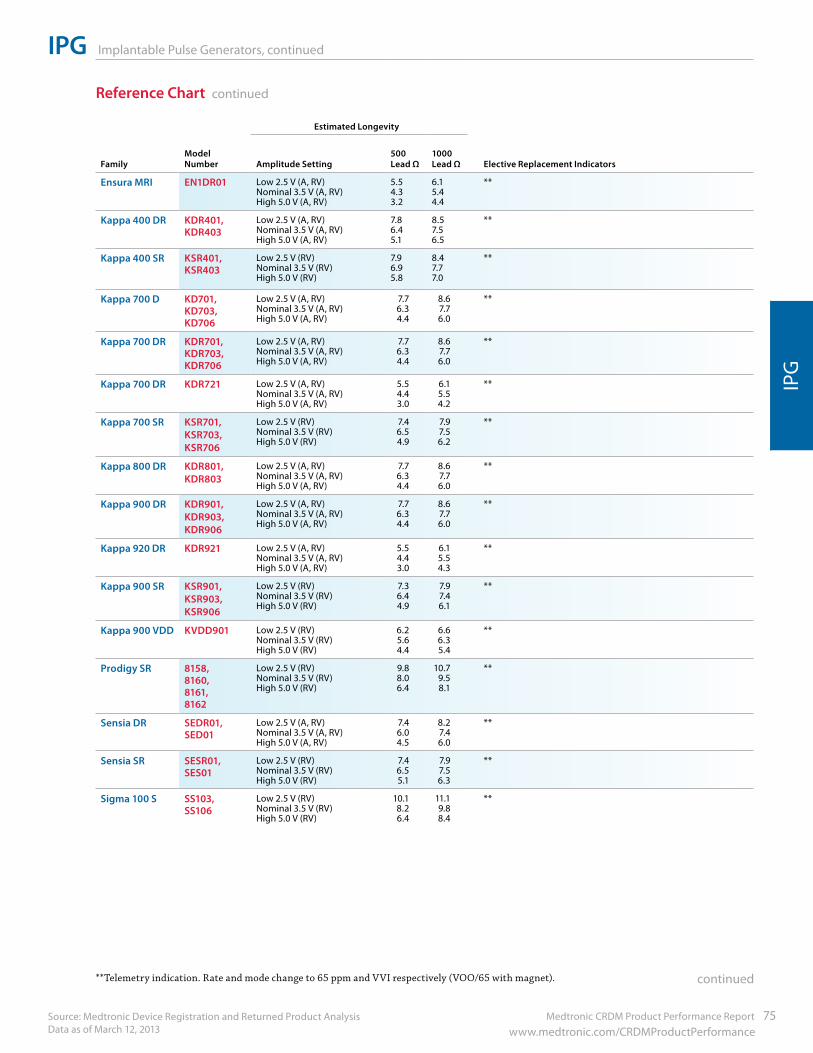
Medtronic CRDM Product Performance Report 75 www.medtronic.com/CRDMProductPerformance
IPG Implantable Pulse Generators, continued
Source: Medtronic Device Registration and Returned Product Analysis Data as of March 12, 2013
IPG
Estimated Longevity
FamilyModelNumber Amplitude Setting
500 Lead Ω
1000 Lead Ω Elective Replacement Indicators
Ensura MRI EN1DR01 Low 2.5 V (A, RV) Nominal 3.5 V (A, RV) High 5.0 V (A, RV)
5.5 4.3 3.2
6.1 5.4 4.4
**
Kappa 400 DR KDR401, KDR403
Low 2.5 V (A, RV) Nominal 3.5 V (A, RV) High 5.0 V (A, RV)
7.8 6.4 5.1
8.5 7.5 6.5
**
Kappa 400 SR KSR401, KSR403
Low 2.5 V (RV) Nominal 3.5 V (RV) High 5.0 V (RV)
7.9 6.9 5.8
8.4 7.7 7.0
**
Kappa 700 D KD701, KD703, KD706
Low 2.5 V (A, RV) Nominal 3.5 V (A, RV) High 5.0 V (A, RV)
7.7 6.3 4.4
8.6 7.7 6.0
**
Kappa 700 DR KDR701, KDR703, KDR706
Low 2.5 V (A, RV) Nominal 3.5 V (A, RV) High 5.0 V (A, RV)
7.7 6.3 4.4
8.6 7.7 6.0
**
Kappa 700 DR KDR721 Low 2.5 V (A, RV) Nominal 3.5 V (A, RV) High 5.0 V (A, RV)
5.5 4.4 3.0
6.1 5.5 4.2
**
Kappa 700 SR KSR701, KSR703, KSR706
Low 2.5 V (RV) Nominal 3.5 V (RV) High 5.0 V (RV)
7.4 6.5 4.9
7.9 7.5 6.2
**
Kappa 800 DR KDR801, KDR803
Low 2.5 V (A, RV) Nominal 3.5 V (A, RV) High 5.0 V (A, RV)
7.7 6.3 4.4
8.6 7.7 6.0
**
Kappa 900 DR KDR901, KDR903, KDR906
Low 2.5 V (A, RV) Nominal 3.5 V (A, RV) High 5.0 V (A, RV)
7.7 6.3 4.4
8.6 7.7 6.0
**
Kappa 920 DR KDR921 Low 2.5 V (A, RV) Nominal 3.5 V (A, RV) High 5.0 V (A, RV)
5.5 4.4 3.0
6.1 5.5 4.3
**
Kappa 900 SR KSR901, KSR903, KSR906
Low 2.5 V (RV) Nominal 3.5 V (RV) High 5.0 V (RV)
7.3 6.4 4.9
7.9 7.4 6.1
**
Kappa 900 VDD KVDD901 Low 2.5 V (RV) Nominal 3.5 V (RV) High 5.0 V (RV)
6.2 5.6 4.4
6.6 6.3 5.4
**
Prodigy SR 8158, 8160, 8161, 8162
Low 2.5 V (RV) Nominal 3.5 V (RV) High 5.0 V (RV)
9.8 8.0 6.4
10.7 9.5 8.1
**
Sensia DR SEDR01, SED01
Low 2.5 V (A, RV) Nominal 3.5 V (A, RV) High 5.0 V (A, RV)
7.4 6.0 4.5
8.2 7.4 6.0
**
Sensia SR SESR01, SES01
Low 2.5 V (RV) Nominal 3.5 V (RV) High 5.0 V (RV)
7.4 6.5 5.1
7.9 7.5 6.3
**
Sigma 100 S SS103, SS106
Low 2.5 V (RV) Nominal 3.5 V (RV) High 5.0 V (RV)
10.1 8.2 6.4
11.19.88.4
**
Reference Chart continued
continued**Telemetry indication. Rate and mode change to 65 ppm and VVI respectively (VOO/65 with magnet).
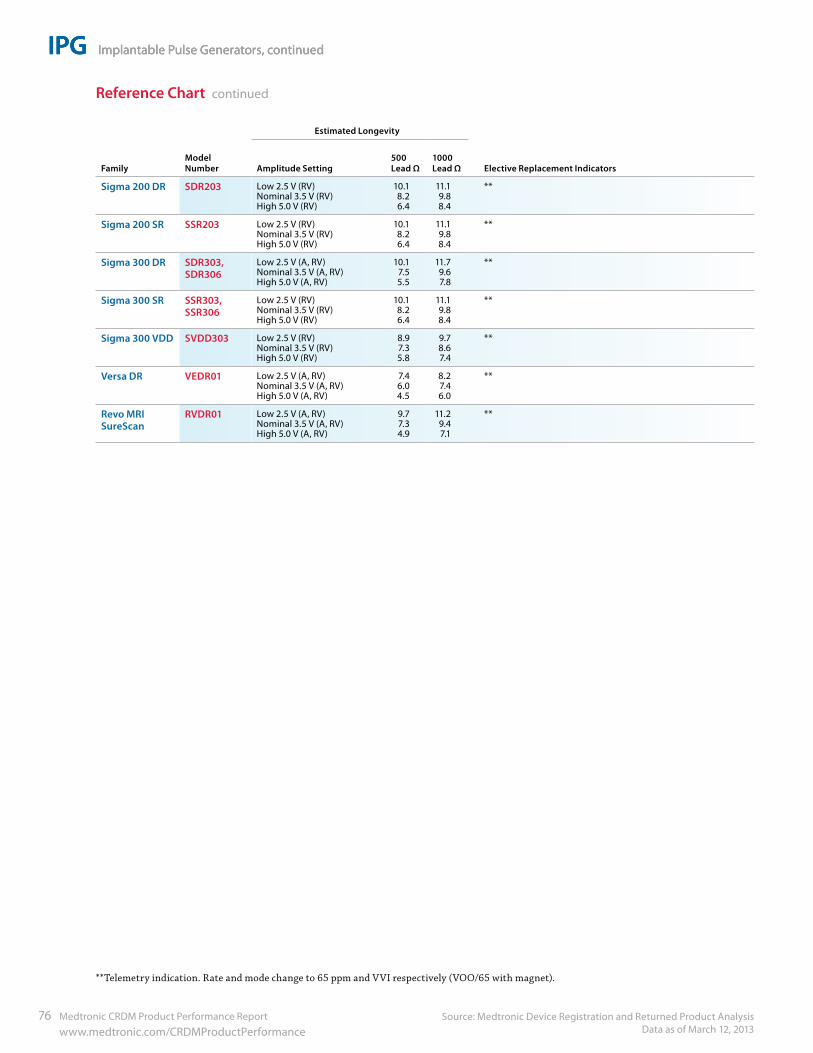
IPG Implantable Pulse Generators, continued
Source: Medtronic Device Registration and Returned Product Analysis Data as of March 12, 2013
76 Medtronic CRDM Product Performance Report www.medtronic.com/CRDMProductPerformance
IPG Implantable Pulse Generators, continued
Estimated Longevity
FamilyModelNumber Amplitude Setting
500 Lead Ω
1000 Lead Ω Elective Replacement Indicators
Sigma 200 DR SDR203 Low 2.5 V (RV) Nominal 3.5 V (RV) High 5.0 V (RV)
10.1 8.2 6.4
11.1 9.8 8.4
**
Sigma 200 SR SSR203 Low 2.5 V (RV) Nominal 3.5 V (RV) High 5.0 V (RV)
10.1 8.2 6.4
11.1 9.8 8.4
**
Sigma 300 DR SDR303, SDR306
Low 2.5 V (A, RV) Nominal 3.5 V (A, RV) High 5.0 V (A, RV)
10.17.55.5
11.79.67.8
**
Sigma 300 SR SSR303, SSR306
Low 2.5 V (RV) Nominal 3.5 V (RV) High 5.0 V (RV)
10.18.26.4
11.19.88.4
**
Sigma 300 VDD SVDD303 Low 2.5 V (RV) Nominal 3.5 V (RV) High 5.0 V (RV)
8.97.35.8
9.78.67.4
**
Versa DR VEDR01 Low 2.5 V (A, RV) Nominal 3.5 V (A, RV) High 5.0 V (A, RV)
7.4 6.0 4.5
8.2 7.4 6.0
**
Revo MRI SureScan
RVDR01 Low 2.5 V (A, RV) Nominal 3.5 V (A, RV) High 5.0 V (A, RV)
9.7 7.3 4.9
11.2 9.4 7.1
**
Reference Chart continued
**Telemetry indication. Rate and mode change to 65 ppm and VVI respectively (VOO/65 with magnet).
IPG Implantable Pulse Generators, continued
February 1, 2013 Medtronic CRDM Product Performance Report 77 www.medtronic.com/CRDMProductPerformance
Lead
s
Medtronic CRDM has tracked lead survival for over 29 years with its multicenter, global chronic lead studies.
Method for Estimating Lead Performance
Leads Performance AnalysisImplanted leads operate in the challenging biochemical environment of the human body and the body’s response to foreign objects. Implanted leads are also subject to mechanical stresses associated with heart motion, body motion, and patient anatomy.
In this environment, pacemaker and defibrillation leads cannot be expected to last forever. While IPGs and ICDs have a battery that will deplete after a predictable length of time, a lead’s longevity cannot be predicted, nor are there simple indicators that a lead is approaching the end of its service life. Therefore, regular monitoring while implanted, and evaluation of lead integrity upon IPG or ICD replacement, is necessary to determine if a lead may be approaching the end of its service life.
Shortfalls of Using Returned Product and Complaints to Estimate Lead PerformanceAll leads and lead segments returned to Medtronic are analyzed to determine whether or not they meet performance limits established by Medtronic. Although returned product analyses are valuable for gaining insight into lead failure mechanisms, this data cannot be used by itself for determining the survival probability of leads because only a small fraction of leads are explanted and returned for analysis. Additionally, those leads that are returned cannot be assumed to be statistically representative of the performance of the total population for a given lead model. Partial or total lead extraction can result in significant damage to a lead, making a definitive analysis of a suspected failure, and its cause, impossible.
To account for the under reporting inherent with lead survival analysis based solely on returned product, some manufacturers add reported complaints where adverse product performance is evident but the product itself has not been returned. The improvement to the accuracy of survival estimates depends on the degree to which all complaints are actually communicated to the manufacturer. Since not all complaints are communicated to the manufacturer, adding complaints to the survival analysis does not completely solve the under reporting problem.
Thus, lead survival probabilities are more appropriately determined through a clinical surveillance study that includes active follow-up with the patients. Although Medtronic monitors returned product analysis and complaints, these are not used to determine lead survival estimates.
Medtronic tracks lead survival through its Product Surveillance Registry. The registry is designed to record clinical observations representative of the total clinical experience. Therefore, the lead survival estimates include both lead hardware failure and lead-related medical complications, and do not differentiate a lead hardware failure from other clinical events such as exit block, perforation, dislodgement, or concurrent pulse generator failure. The lead need not be returned to Medtronic.
Product Surveillance Registry (PSR)
Medtronic has been monitoring the performance of its cardiac therapy products with a multicenter study since 1983 and has evaluated the performance of more than 95,000 leads, with data reported from countries around the world. Throughout this time period, Medtronic has continually worked to adapt systems and processes to more effectively monitor product performance following market release. The following summarizes current registry requirements.
Medtronic’s global Product Surveillance Registry has a prospective, non-randomized, observational design. A key purpose of the registry is to provide continuing evaluation and periodic reporting of the long-term reliability and performance of Medtronic market-released cardiac therapy products. Product-related adverse events, indicating the status of the product, are collected to measure survival probabilities. The data gathered may also be used to support the design and development of investigational plans for new cardiac therapy products. The registry is designed to continue indefinitely, encompassing new products as they become commercially available.
To ensure a sufficiently large and representative source of data, participating clinical sites must meet pre-specified selection criteria. The number of participants is regularly reviewed to ensure the necessary capacity to meet Medtronic’s ongoing prospective post-market surveillance needs is available. Every effort is made to ensure participants are representative of the range of clinical environments in which Medtronic cardiac rhythm products are used. Eligible products for enrollment include Medtronic market-released cardiac rhythm therapy products for which additional information to further characterize product performance following market release is desired. Enrollment may be capped at a product when the number enrolled ensures sufficient precision to effectively characterize product survivability.
continued

February 1, 2013 78 Medtronic CRDM Product Performance Report www.medtronic.com/CRDMProductPerformance
The Standard Actuarial Method is used to determine estimates of lead survival.
Method for Estimating Lead Performance continued
Enrolled patients are followed in accordance with the standard care practices of their care provider from their implant date until they can no longer be followed (e.g., death, lost to follow-up, etc.). However, to ensure regular patient status assessments are completed, follow-up windows consistent with typical care practices have been established with a minimum annual follow-up requirement. Product-related adverse events, system modifications and changes in patient status (e.g., death and withdrawal from the study) are required to be reported upon occurrence. This active surveillance model ensures a robust dataset for effectively monitoring product performance.
Patients are eligible for enrollment if:• Theyareintendedtobeimplantedorarewithin
30 days post-implant of a Medtronic market-released lead connected to a market-released CRT, ICD, or IPG device, and the lead is used for a pacing, sensing, or defibrillation application, or
• Theyparticipatedinaqualifyinginvestigationalstudy of a Medtronic cardiac therapy product that is now market-released; complete implant and follow-up data are available; and the data can be appropriately and legally released.
Each site must inform Medtronic whenever a lead complication has occurred or when a patient is no longer participating. Chronic product performance is analyzed as a function of time using the survival analysis method.
Medtronic continually evaluates the quality and integrity of the data through a combination of on-site and centralized monitoring activities.
Lead ComplicationsThe data presented characterizes chronic lead performance by estimating lead-related complication- free survival probabilities. For analysis purposes, the complication criteria, which align with the AdvaMed ‘Industry Guidance for Uniform Reporting of Clinical Performance of Cardiac Rhythm Management Pulse Generators and Leads’, are defined below. These criteria do not, however, enable a lead integrity or “hardware” failure to be conclusively differentiated from other clinical events such as an undetected lead dislodgement, exit block, or concurrent pulse generator failure manifested as a sensing or capture problem.
All reported lead-related adverse events are classified by the reporting investigator and are adjudicated by an independent event adjudication committee.1 A lead-related complication is considered to have occurred if a clinical observation occurs more than 30 days after implant, is adjudicated with at least one of the following event classifications and at least one of the following clinical actions is made. Events with an onset date 30 days or less after the implant are considered procedure-related and therefore not included as chronic lead-related complications.
Event Classifications
• Failuretocapture
• Failuretosense/undersensing
• Oversensing
• Abnormalpacingimpedance(basedonleadmodel,but normal range is typically 200 - 2,000 ohms)
• Abnormaldefibrillationimpedance(basedonleadmodel, but normal range is typically 20 - 200 ohms)
• Insulationbreach
• Conductorfracture,confirmedelectrically,visuallyorradiographically
• Extracardiacstimulation
• Cardiacperforation
• Leaddislodgement
Clinical Actions
• Leadsurgicallyabandoned/capped
• Leadelectricallyabandoned
• Leadexplanted
• Leadreplaced
• Leadconductortakenoutofservice(polarityreprogrammed to remove defective conductor, e.g., bipolar to unipolar)
continued
1 During the evolution of PSR, event adjudication was transitioned from a Medtronic technical review committee to an independent event adjudication committee in 2011. Data analyses include adjudication using both methods.
February 1, 2013 Medtronic CRDM Product Performance Report 79 www.medtronic.com/CRDMProductPerformance
Lead
s
Method for Estimating Lead Performance continued
• Leadusecontinuedbasedonmedicaljudgmentdespite a known clinical performance issue
• Otherlead-relatedsurgeryperformed(e.g.,leadmechanical alteration or unsuccessful repositioning)
Note: Successful lead repositioning is not a qualifying action.
Data Analysis MethodsThe performance of leads is expressed in terms of lead survival estimates, where “survival” refers to the function of the lead, not the survival of the patient. These survival estimates are intended to illustrate the probability that a lead will survive for a given number of years without a chronic lead-related complication.
Survival times are calculated from the implant date to the earliest of the complication date, out-of-service date (for example, subject leaves the study or the lead is no longer being used) or the last follow-up date. If a lead experiences more than one complication, the first is used to calculate survival time; although all complications associated with a lead are included in the summary tables.
Oftheseveraldifferentstatisticalmethodsavailableforsurvival analysis, the Standard Actuarial Method, with suspensions assumed distributed across the intervals (Cutler-Ederer Method), is used to determine estimates of lead survival.
Onthefollowingpages,eachgraphincludesasurvivalcurve where events include qualifying lead-related complications. This survival estimate is a good representation of the probability a lead will survive a period of time without a lead-related complication. For example, if a survival probability is 95% after 5 years of service, then the lead has a 5% chance of experiencing a lead-related complication in the first 5 years following implant.
Although tabular data is provided in 1-year intervals, the curves are actually computed and plotted using 3-month intervals.
The data in the tables is rounded to the nearest tenth ofonepercent.Occasionally,agraphmayshow100%survival, but have one or more complications. This occurs because even with the complications, the data rounds to 100%.
The survival curves are statistical estimates. As performance experience accumulates, the estimation improves. Confidence intervals are provided as a way to indicate the degree of certainty of the estimates. Greenwood’s formula is used to calculate the standard errors, and the log-log method is used to produce the 2-sided 95% confidence bounds.
Since the survival estimate can become very imprecise with small effective sample sizes, Medtronic truncates the survival curve when the number of leads entering an interval is less than 50 leads. When the number of leads entering an interval reaches 50, the next data point is added to the survival curve. For those lead models that do not have sufficient sample size, a survival curve will not be presented.
Definition of Analysis DatasetThe survival estimates are derived from all device components successfully enrolled as of the data cutoff date. The number of enrollments is listed for each lead model.
This sample is considered to be representative of the worldwide population, and therefore the survival estimates shown should be representative of the performance worldwide of these models.
Criteria for Model InclusionPerformance information for a model or model family will be published when more than 100 leads have been enrolled and no fewer than 50 leads followed for at least 6 months. Models will continue to be published for at least 20 years as long as Medtronic estimates at least 500 leads remain active in the United States, based on estimated US implants.
Medtronic, at its discretion, may stop providing updated performance information on lead models that received original US market-release approval 20 or more years ago.

February 1, 2013 80 Medtronic CRDM Product Performance Report www.medtronic.com/CRDMProductPerformance
Medtronic urges all physicians to return explanted products and to notify Medtronic when a product is no longer in use, regardless of reason for explant or removal from use.
Method for Estimating Lead Performance continued
Returned Product Analysis ResultsEvery lead or lead portion returned to Medtronic receives an analysis. Although the returned product analysis data is not used to generate the survival estimates, the data provides valuable insight into the causes of lead malfunction.
For reporting returned product analysis results, Medtronic CRDM considers a lead as having malfunctioned whenever the analysis shows that any parameter was outside the performance limits established by Medtronic while implanted and in service. To be considered a malfunction for returned product analysis reporting, the lead must have been returned to Medtronic and analyzed.
The results of the analysis is presented in four categories. The lead reporting categories are:
•ConductorFracture:Conductormalfunctionwithcomplete or intermittent loss of continuity that could interrupt current flow (e.g., fractured conductors), including those associated with clavicle flex fatigue or crush damage.
•InsulationBreach:Amalfunctionoftheinsulationallowing inappropriate entry of body fluids or inappropriate current flow between the conductors, or between the conductor and the body. Examples include cuts, tears, depressions, abrasions, and material degradation.
•Crimps/Welds/Bonds:Anymalfunctioninaconductororlead body associated with a point of connection.
•Other:Malfunctionsofspecificleadmechanicalattributes, such as sensors, connectors, seal rings, or malfunction modes not included in the three categories above.
A lead subject to a safety advisory is not considered to have malfunctioned unless it has been returned to Medtronic CRDM and found, through analysis, to actually have performed outside the performance limits established by Medtronic.
For leads designed for either ventricular or atrial use, the numbers listed in the Returned Product Analysis tables include both.
The numbers of malfunctions listed in the Returned Product Analysis tables are the actual numbers confirmed in the returned product analysis from the United States.
The numbers of complications listed in the complications tables are the actual numbers observed in the PSR centers around the world.
US Reports of Acute Lead Observations (Occurring within First Month of Service)In the first weeks following lead implantation, physiologic responses and lead performance can vary until long-term lead stability is attained. Acute (defined as the first month after implant) lead performance may be subject to a number of factors, including patient-specific anatomy, clinicalconditionsand/orvaryingimplantconditions/techniques. After a period of time, the implant and the lead performance stabilizes. It is for this reason that the Product Surveillance Registry results, which are intended to measure long-term performance, do not include complications that occur within the first 30 days after implant.
Information about the clinical experience in the first month of service is included in this report. The source for this information is Medtronic’s complaint handling system database. The information is summarized in tablestitled“USReportsofAcuteLeadObservations.”To be included in this summary of observations, a lead must first be successfully implanted and registered in Medtronic’s Device and Registrant Tracking system.
Each Event Report received by Medtronic’s complaint handling system is assigned one or more Reason for Report codes based on the information received. The Reason for Report codes have been grouped into Acute LeadObservationcategories.Thecategoriesusedforthisproduct performance report are drawn from the “FDA Guidance for Submission of Research and Marketing Applications for Permanent Pacemaker Leads and for Pacemaker Lead Adapter 510(k) Submissions.” The categories are:
1. Cardiac Perforation
2. Conductor Fracture
3. Lead Dislodgement
4. Failure to Capture
5. Oversensing
6. Failure to Sense
7. InsulationBreach
8. Impedance Abnormal
February 1, 2013 Medtronic CRDM Product Performance Report 81 www.medtronic.com/CRDMProductPerformance
Lead
s
Method for Estimating Lead Performance continued
9. Extracardiac Stimulation
10. Unspecified
Although multiple observations are possible for any given lead, only one observation is reported per lead. The observation reported is the observation highest on the list. For example, if an Event Report includes observations for both Lead Dislodgement and Failure to Sense, Lead Dislodgement is reported.
The lead event reported to Medtronic may or may not have involved clinical action or product returned to Medtronic. The lead may have remained implanted and in service.
Estimated Number of Implanted and Active Leads in the United StatesIn addition to providing the number of leads enrolled in the PSR , this report also provides the number of leads registered as implanted and the number remaining active in the United States based on the status recorded in the Medtronic Device and Registrant Tracking system.
Some lead models do not have a survival curve presented in this report. These lead models do not have a survival curve because they have insufficient sample size in the Product Surveillance Registry. Returned Product Analysis results for these models are included here for reference and comparison.
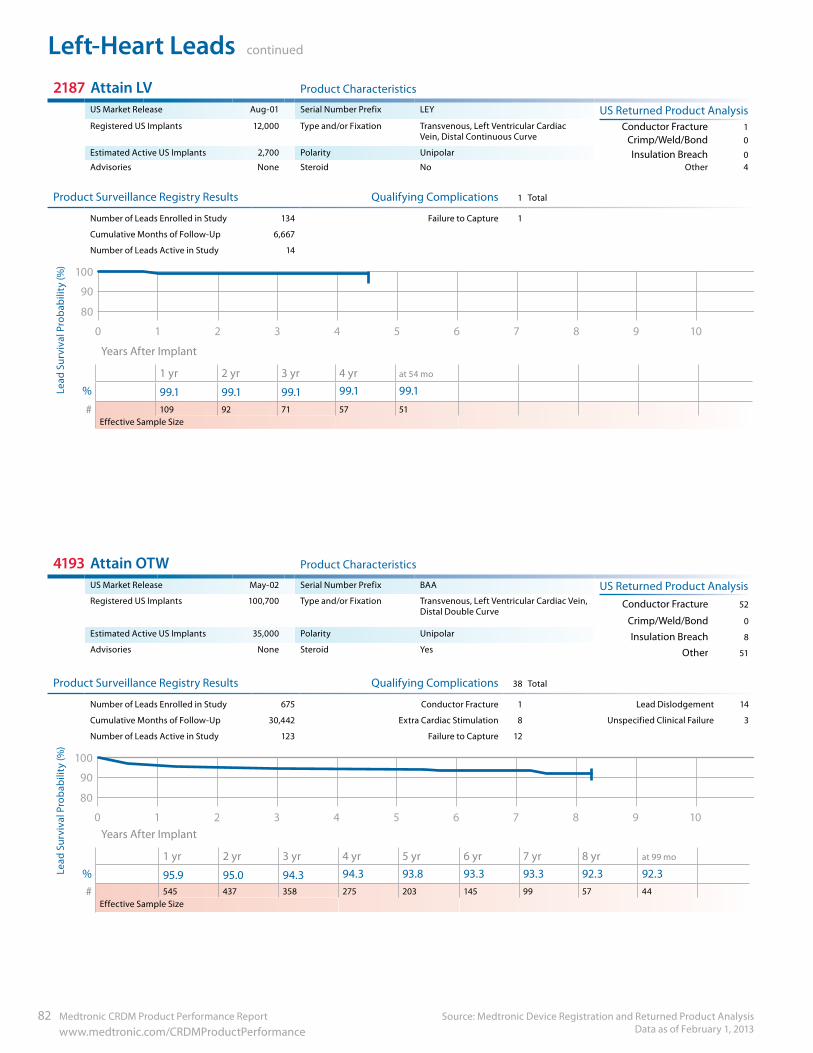
Left-Heart Leads continued
Source: Medtronic Device Registration and Returned Product Analysis Data as of February 1, 2013
82 Medtronic CRDM Product Performance Report www.medtronic.com/CRDMProductPerformance
2187 Attain LV Product Characteristics
US Market Release Aug-01 Serial Number Prefix LEY US Returned Product AnalysisRegistered US Implants 12,000 Type and/or Fixation Transvenous, Left Ventricular Cardiac
Vein, Distal Continuous CurveConductor Fracture 1
Crimp/Weld/Bond 0Estimated Active US Implants 2,700 Polarity Unipolar Insulation Breach 0Advisories None Steroid No Other 4
Product Surveillance Registry Results Qualifying Complications 1 Total
Number of Leads Enrolled in Study 134 Failure to Capture 1
Cumulative Months of Follow-Up 6,667
Number of Leads Active in Study 14
90
100
80
109876543210
Years After Implant
1 yr 2 yr 3 yr 4 yr at 54 mo
% 99.1 99.1 99.1 99.1 99.1
# 109 92 71 57 51Effective Sample Size
4193 Attain OTW Product Characteristics
US Market Release May-02 Serial Number Prefix BAA US Returned Product AnalysisRegistered US Implants 100,700 Type and/or Fixation Transvenous, Left Ventricular Cardiac Vein,
Distal Double CurveConductor Fracture 52
Crimp/Weld/Bond 0Estimated Active US Implants 35,000 Polarity Unipolar Insulation Breach 8Advisories None Steroid Yes Other 51
Product Surveillance Registry Results Qualifying Complications 38 Total
Number of Leads Enrolled in Study 675 Conductor Fracture 1 Lead Dislodgement 14
Cumulative Months of Follow-Up 30,442 Extra Cardiac Stimulation 8 Unspecified Clinical Failure 3
Number of Leads Active in Study 123 Failure to Capture 12
90
100
80
109876543210 Years After Implant
1 yr 2 yr 3 yr 4 yr 5 yr 6 yr 7 yr 8 yr at 99 mo
% 95.9 95.0 94.3 94.3 93.8 93.3 93.3 92.3 92.3# 545 437 358 275 203 145 99 57 44
Effective Sample Size
Lead
Sur
viva
l Pro
babi
lity
(%)
Lead
Sur
viva
l Pro
babi
lity
(%)
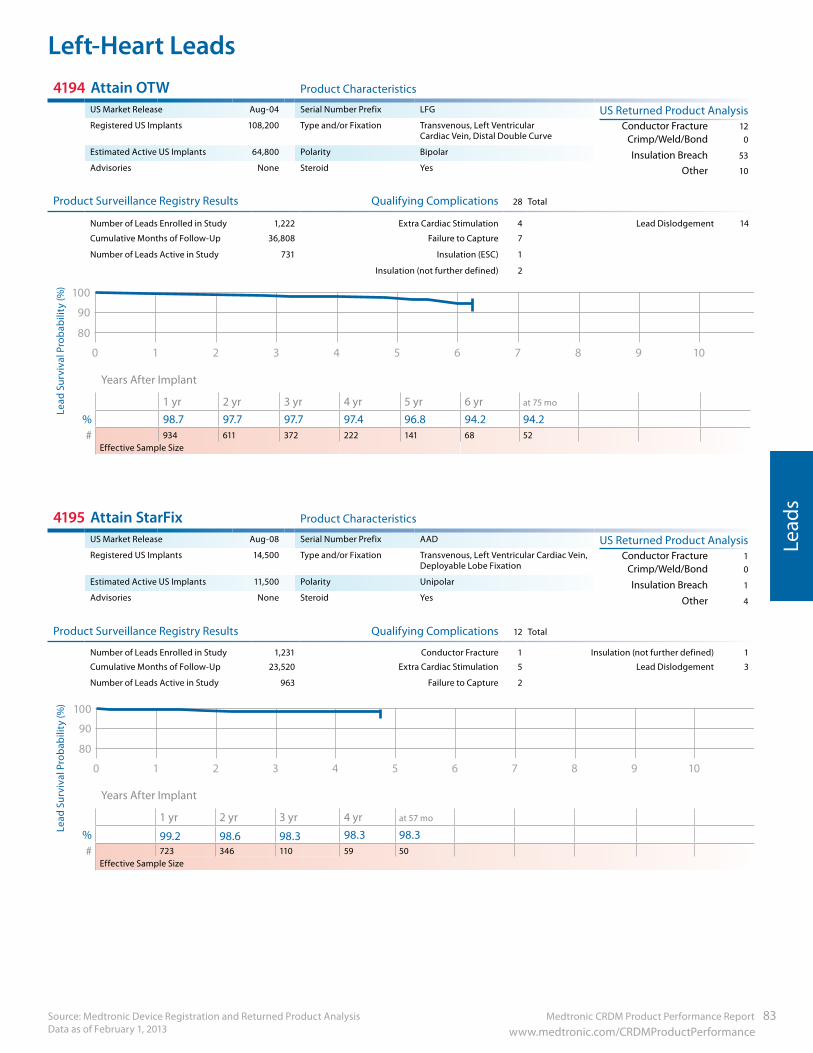
Source: Medtronic Device Registration and Returned Product Analysis Data as of February 1, 2013
Left-Heart Leads
Lead
s
Medtronic CRDM Product Performance Report 83 www.medtronic.com/CRDMProductPerformance
4194 Attain OTW Product Characteristics
US Market Release Aug-04 Serial Number Prefix LFG US Returned Product AnalysisRegistered US Implants 108,200 Type and/or Fixation Transvenous, Left Ventricular
Cardiac Vein, Distal Double Curve Conductor Fracture 12
Crimp/Weld/Bond 0Estimated Active US Implants 64,800 Polarity Bipolar Insulation Breach 53Advisories None Steroid Yes Other 10
Product Surveillance Registry Results Qualifying Complications 28 Total
Number of Leads Enrolled in Study 1,222 Extra Cardiac Stimulation 4 Lead Dislodgement 14
Cumulative Months of Follow-Up 36,808 Failure to Capture 7
Number of Leads Active in Study 731 Insulation (ESC) 1
Insulation (not further defined) 2
90
100
80
109876543210
Years After Implant
1 yr 2 yr 3 yr 4 yr 5 yr 6 yr at 75 mo
% 98.7 97.7 97.7 97.4 96.8 94.2 94.2# 934 611 372 222 141 68 52
Effective Sample Size
4195 Attain StarFix Product Characteristics
US Market Release Aug-08 Serial Number Prefix AAD US Returned Product AnalysisRegistered US Implants 14,500 Type and/or Fixation Transvenous, Left Ventricular Cardiac Vein,
Deployable Lobe FixationConductor Fracture 1
Crimp/Weld/Bond 0Estimated Active US Implants 11,500 Polarity Unipolar Insulation Breach 1Advisories None Steroid Yes Other 4
Product Surveillance Registry Results Qualifying Complications 12 Total
Number of Leads Enrolled in Study 1,231 Conductor Fracture 1 Insulation (not further defined) 1
Cumulative Months of Follow-Up 23,520 Extra Cardiac Stimulation 5 Lead Dislodgement 3
Number of Leads Active in Study 963 Failure to Capture 2
90
100
80
109876543210
Years After Implant
1 yr 2 yr 3 yr 4 yr at 57 mo
% 99.2 98.6 98.3 98.3 98.3# 723 346 110 59 50
Effective Sample Size
Lead
Sur
viva
l Pro
babi
lity
(%)
Lead
Sur
viva
l Pro
babi
lity
(%)
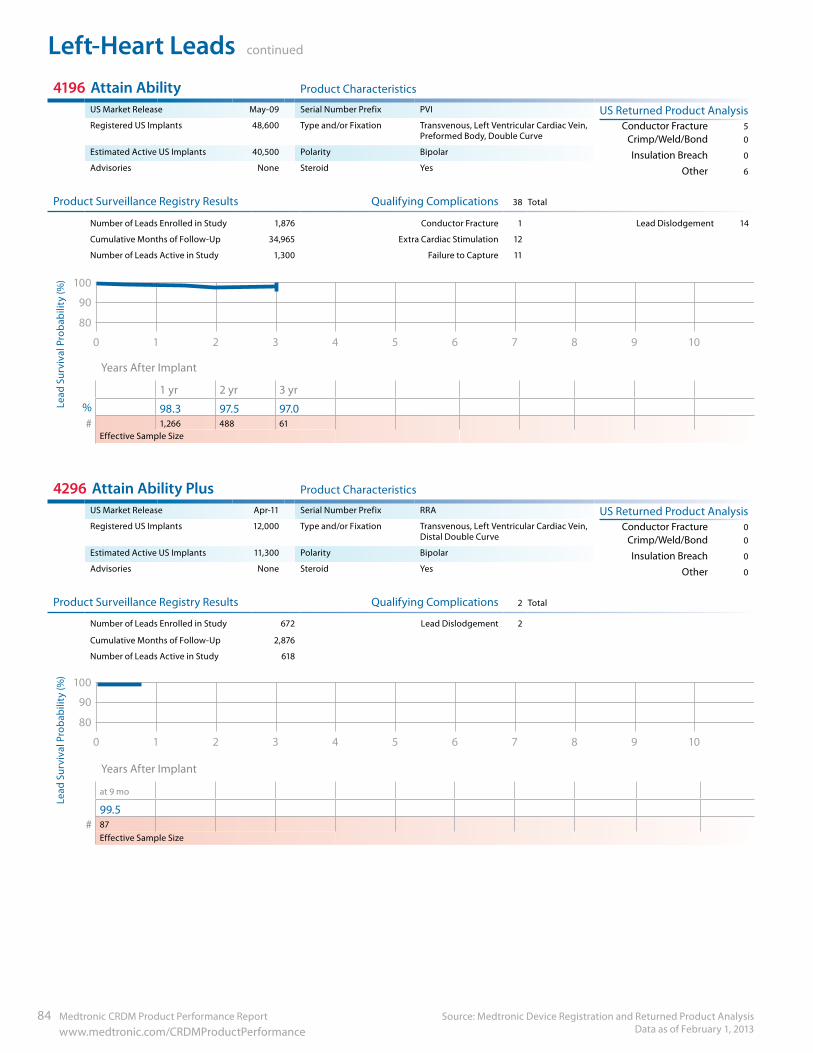
Left-Heart Leads continued
Source: Medtronic Device Registration and Returned Product Analysis Data as of February 1, 2013
84 Medtronic CRDM Product Performance Report www.medtronic.com/CRDMProductPerformance
4196 Attain Ability Product Characteristics
US Market Release May-09 Serial Number Prefix PVI US Returned Product AnalysisRegistered US Implants 48,600 Type and/or Fixation Transvenous, Left Ventricular Cardiac Vein,
Preformed Body, Double CurveConductor Fracture 5
Crimp/Weld/Bond 0Estimated Active US Implants 40,500 Polarity Bipolar Insulation Breach 0Advisories None Steroid Yes Other 6
Product Surveillance Registry Results Qualifying Complications 38 Total
Number of Leads Enrolled in Study 1,876 Conductor Fracture 1 Lead Dislodgement 14
Cumulative Months of Follow-Up 34,965 Extra Cardiac Stimulation 12
Number of Leads Active in Study 1,300 Failure to Capture 11
90
100
80
109876543210
Years After Implant
1 yr 2 yr 3 yr% 98.3 97.5 97.0# 1,266 488 61
Effective Sample Size
4296 Attain Ability Plus Product Characteristics
US Market Release Apr-11 Serial Number Prefix RRA US Returned Product AnalysisRegistered US Implants 12,000 Type and/or Fixation Transvenous, Left Ventricular Cardiac Vein,
Distal Double CurveConductor Fracture 0
Crimp/Weld/Bond 0Estimated Active US Implants 11,300 Polarity Bipolar Insulation Breach 0Advisories None Steroid Yes Other 0
Product Surveillance Registry Results Qualifying Complications 2 Total
Number of Leads Enrolled in Study 672 Lead Dislodgement 2
Cumulative Months of Follow-Up 2,876
Number of Leads Active in Study 618
90
100
80
109876543210
Years After Implant
at 9 mo
99.5# 87
Effective Sample Size
Lead
Sur
viva
l Pro
babi
lity
(%)
Lead
Sur
viva
l Pro
babi
lity
(%)
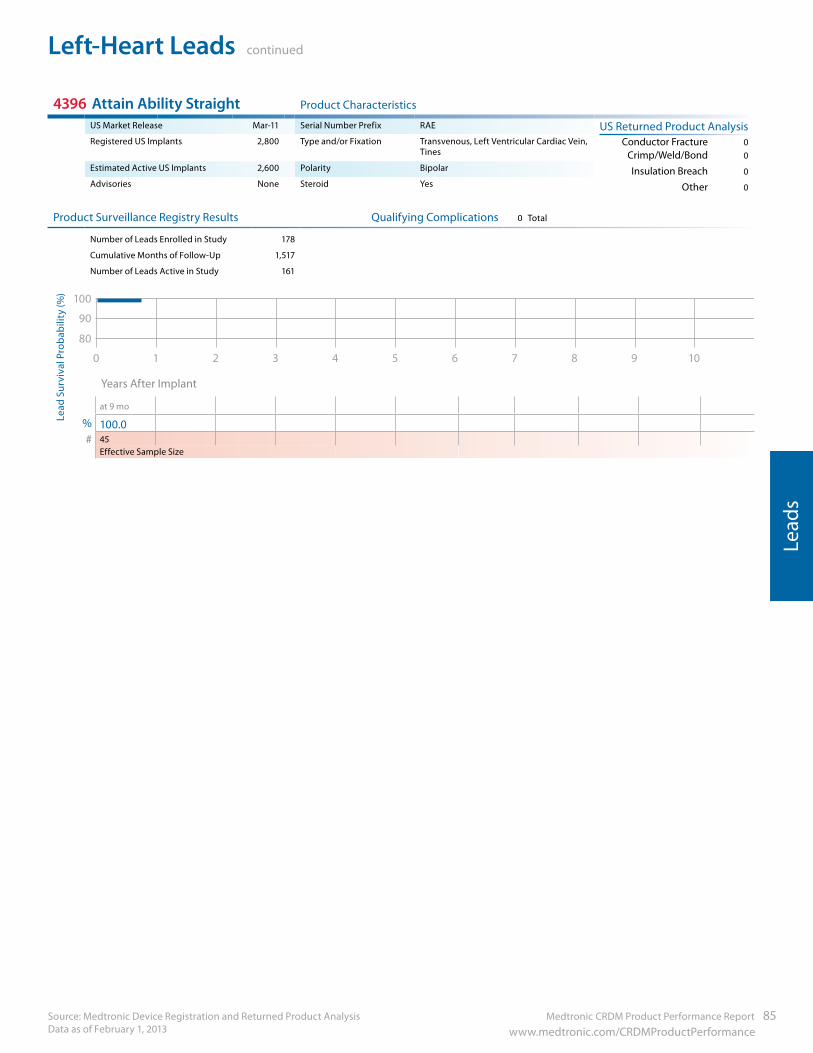
Medtronic CRDM Product Performance Report 85 www.medtronic.com/CRDMProductPerformance
Left-Heart Leads continued
Source: Medtronic Device Registration and Returned Product Analysis Data as of February 1, 2013
Lead
s
4396 Attain Ability Straight Product Characteristics
US Market Release Mar-11 Serial Number Prefix RAE US Returned Product AnalysisRegistered US Implants 2,800 Type and/or Fixation Transvenous, Left Ventricular Cardiac Vein,
TinesConductor Fracture 0
Crimp/Weld/Bond 0Estimated Active US Implants 2,600 Polarity Bipolar Insulation Breach 0Advisories None Steroid Yes Other 0
Product Surveillance Registry Results Qualifying Complications 0 Total
Number of Leads Enrolled in Study 178
Cumulative Months of Follow-Up 1,517
Number of Leads Active in Study 161
90
100
80
109876543210
Years After Implant
at 9 mo
% 100.0# 45
Effective Sample Size
Lead
Sur
viva
l Pro
babi
lity
(%)
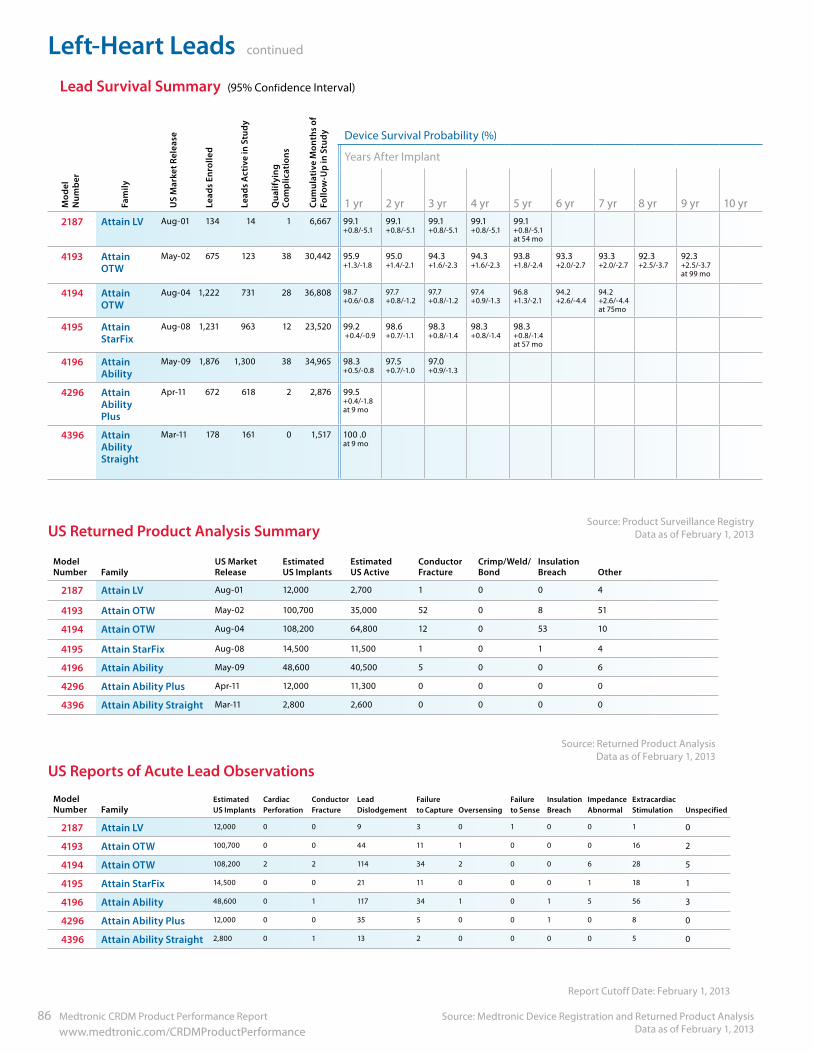
Left-Heart Leads continued
Source: Medtronic Device Registration and Returned Product Analysis Data as of February 1, 2013
86 Medtronic CRDM Product Performance Report www.medtronic.com/CRDMProductPerformance
US Returned Product Analysis Summary
ModelNumber Family
US MarketRelease
Estimated US Implants
Estimated US Active
Conductor Fracture
Crimp/Weld/Bond
Insulation Breach Other
2187 Attain LV Aug-01 12,000 2,700 1 0 0 4
4193 Attain OTW May-02 100,700 35,000 52 0 8 51
4194 Attain OTW Aug-04 108,200 64,800 12 0 53 10
4195 Attain StarFix Aug-08 14,500 11,500 1 0 1 4
4196 Attain Ability May-09 48,600 40,500 5 0 0 6
4296 Attain Ability Plus Apr-11 12,000 11,300 0 0 0 0
4396 Attain Ability Straight Mar-11 2,800 2,600 0 0 0 0
Source: Returned Product Analysis Data as of February 1, 2013
Mod
elN
umbe
r
Fam
ily
US
Mar
ket R
elea
se
Lead
s En
rolle
d
Lead
s A
ctiv
e in
Stu
dy
Qua
lifyi
ngCo
mpl
icat
ions
Cum
ulat
ive
Mon
ths
of
Follo
w-U
p in
Stu
dy Device Survival Probability (%)
Years After Implant
1 yr 2 yr 3 yr 4 yr 5 yr 6 yr 7 yr 8 yr 9 yr 10 yr2187 Attain LV Aug-01 134 14 1 6,667 99.1
+0.8/-5.199.1+0.8/-5.1
99.1+0.8/-5.1
99.1+0.8/-5.1
99.1+0.8/-5.1 at 54 mo
4193 Attain OTW
May-02 675 123 38 30,442 95.9 +1.3/-1.8
95.0+1.4/-2.1
94.3+1.6/-2.3
94.3+1.6/-2.3
93.8+1.8/-2.4
93.3+2.0/-2.7
93.3+2.0/-2.7
92.3+2.5/-3.7
92.3+2.5/-3.7 at 99 mo
4194 Attain OTW
Aug-04 1,222 731 28 36,808 98.7 +0.6/-0.8
97.7 +0.8/-1.2
97.7 +0.8/-1.2
97.4 +0.9/-1.3
96.8 +1.3/-2.1
94.2 +2.6/-4.4
94.2 +2.6/-4.4 at 75mo
4195 Attain StarFix
Aug-08 1,231 963 12 23,520 99.2 +0.4/-0.9
98.6+0.7/-1.1
98.3+0.8/-1.4
98.3+0.8/-1.4
98.3+0.8/-1.4 at 57 mo
4196 Attain Ability
May-09 1,876 1,300 38 34,965 98.3+0.5/-0.8
97.5+0.7/-1.0
97.0+0.9/-1.3
4296 Attain Ability Plus
Apr-11 672 618 2 2,876 99.5+0.4/-1.8 at 9 mo
4396 Attain Ability Straight
Mar-11 178 161 0 1,517 100 .0at 9 mo
Lead Survival Summary (95% Confidence Interval)
US Reports of Acute Lead Observations
Report Cutoff Date: February 1, 2013
ModelNumber Family
Estimated US Implants
Cardiac Perforation
Conductor Fracture
Lead Dislodgement
Failure to Capture Oversensing
Failure to Sense
Insulation Breach
Impedance Abnormal
Extracardiac Stimulation Unspecified
2187 Attain LV 12,000 0 0 9 3 0 1 0 0 1 0
4193 Attain OTW 100,700 0 0 44 11 1 0 0 0 16 2
4194 Attain OTW 108,200 2 2 114 34 2 0 0 6 28 5
4195 Attain StarFix 14,500 0 0 21 11 0 0 0 1 18 1
4196 Attain Ability 48,600 0 1 117 34 1 0 1 5 56 3
4296 Attain Ability Plus 12,000 0 0 35 5 0 0 1 0 8 0
4396 Attain Ability Straight 2,800 0 1 13 2 0 0 0 0 5 0
Source: Product Surveillance RegistryData as of February 1, 2013
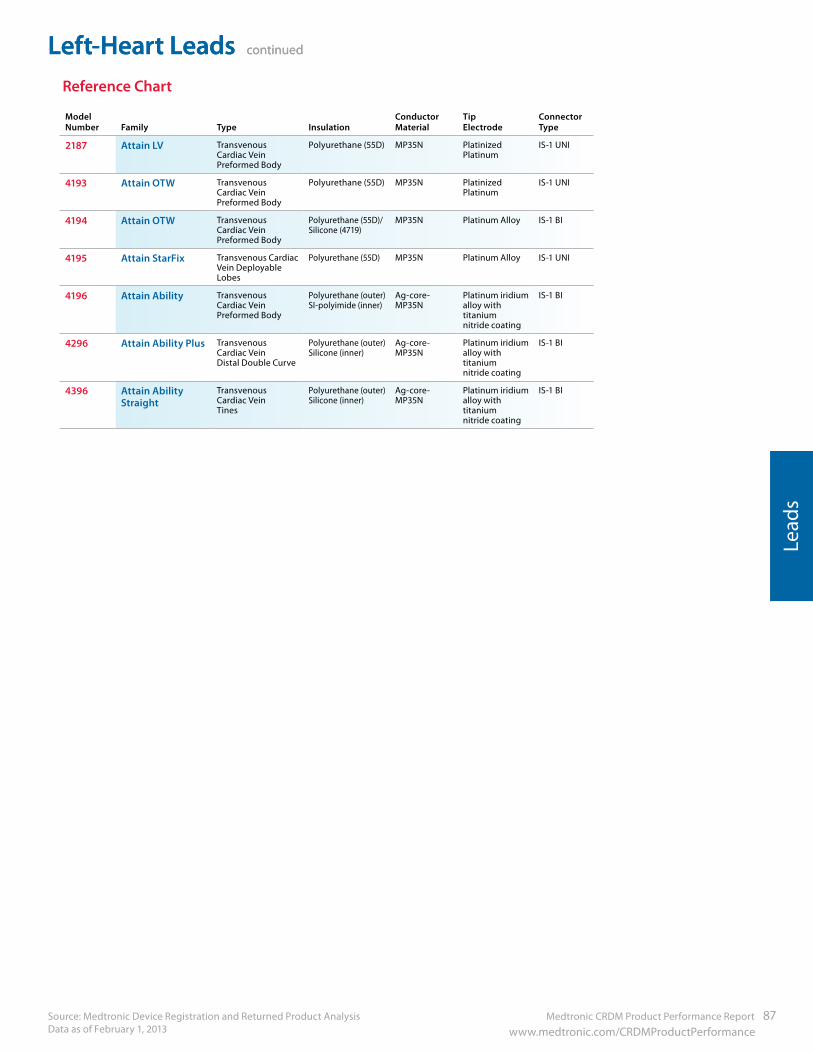
Medtronic CRDM Product Performance Report 87 www.medtronic.com/CRDMProductPerformance
Left-Heart Leads continued
Source: Medtronic Device Registration and Returned Product Analysis Data as of February 1, 2013
Lead
s
Left-Heart Leads continued
ModelNumber Family Type Insulation
Conductor Material
Tip Electrode
Connector Type
2187 Attain LV Transvenous Cardiac Vein Preformed Body
Polyurethane (55D) MP35N Platinized Platinum
IS-1 UNI
4193 Attain OTW Transvenous Cardiac Vein Preformed Body
Polyurethane (55D) MP35N Platinized Platinum
IS-1 UNI
4194 Attain OTW Transvenous Cardiac Vein Preformed Body
Polyurethane (55D)/ Silicone (4719)
MP35N Platinum Alloy IS-1 BI
4195 Attain StarFix Transvenous Cardiac Vein Deployable Lobes
Polyurethane (55D) MP35N Platinum Alloy IS-1 UNI
4196 Attain Ability TransvenousCardiac VeinPreformed Body
Polyurethane (outer) SI-polyimide (inner)
Ag-core-MP35N
Platinum iridiumalloy with titaniumnitride coating
IS-1 BI
4296 Attain Ability Plus TransvenousCardiac VeinDistal Double Curve
Polyurethane (outer) Silicone (inner)
Ag-core-MP35N
Platinum iridiumalloy with titaniumnitride coating
IS-1 BI
4396 Attain Ability Straight
TransvenousCardiac VeinTines
Polyurethane (outer) Silicone (inner)
Ag-core-MP35N
Platinum iridiumalloy with titaniumnitride coating
IS-1 BI
Reference Chart
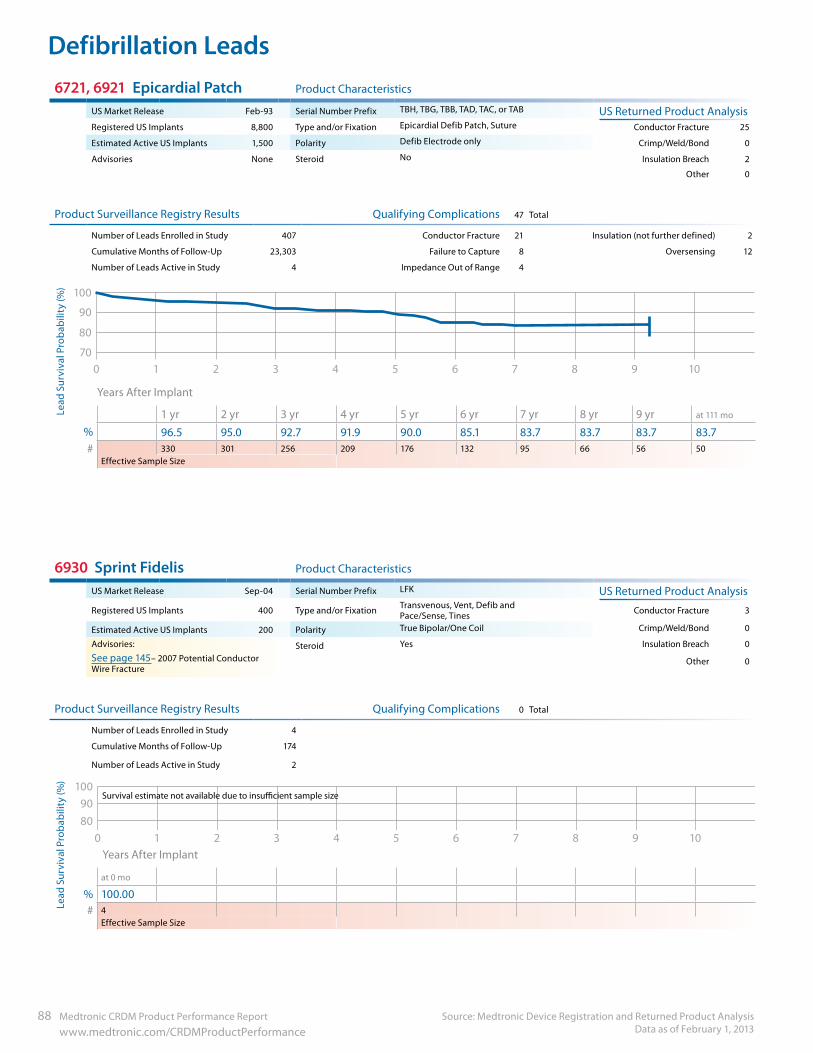
Defibrillation Leads
Source: Medtronic Device Registration and Returned Product Analysis Data as of February 1, 2013
88 Medtronic CRDM Product Performance Report www.medtronic.com/CRDMProductPerformance
6721, 6921 Epicardial Patch Product Characteristics
US Market Release Feb-93 Serial Number Prefix TBH, TBG, TBB, TAD, TAC, or TAB US Returned Product AnalysisRegistered US Implants 8,800 Type and/or Fixation Epicardial Defib Patch, Suture Conductor Fracture 25
Estimated Active US Implants 1,500 Polarity Defib Electrode only Crimp/Weld/Bond 0
Advisories None Steroid No Insulation Breach 2
Other 0
Product Surveillance Registry Results Qualifying Complications 47 Total
Number of Leads Enrolled in Study 407 Conductor Fracture 21 Insulation (not further defined) 2
Cumulative Months of Follow-Up 23,303 Failure to Capture 8 Oversensing 12
Number of Leads Active in Study 4 Impedance Out of Range 4
90
100
80
70109876543210
Years After Implant
1 yr 2 yr 3 yr 4 yr 5 yr 6 yr 7 yr 8 yr 9 yr at 111 mo
% 96.5 95.0 92.7 91.9 90.0 85.1 83.7 83.7 83.7 83.7# 330 301 256 209 176 132 95 66 56 50
Effective Sample Size
6930 Sprint Fidelis Product Characteristics
US Market Release Sep-04 Serial Number Prefix LFK US Returned Product Analysis
Registered US Implants 400 Type and/or Fixation Transvenous, Vent, Defib and Pace/Sense, Tines Conductor Fracture 3
Estimated Active US Implants 200 Polarity True Bipolar/One Coil Crimp/Weld/Bond 0
Advisories: Steroid Yes Insulation Breach 0
See page 145– 2007 Potential Conductor Wire Fracture
Other 0
Product Surveillance Registry Results Qualifying Complications 0 Total
Number of Leads Enrolled in Study 4
Cumulative Months of Follow-Up 174
Number of Leads Active in Study 2
Survival estimate not available due to insucient sample size90
100
8070605040302010
109876543210 Years After Implant
at 0 mo
% 100.00# 4
Effective Sample Size
Lead
Sur
viva
l Pro
babi
lity
(%)
Lead
Sur
viva
l Pro
babi
lity
(%)
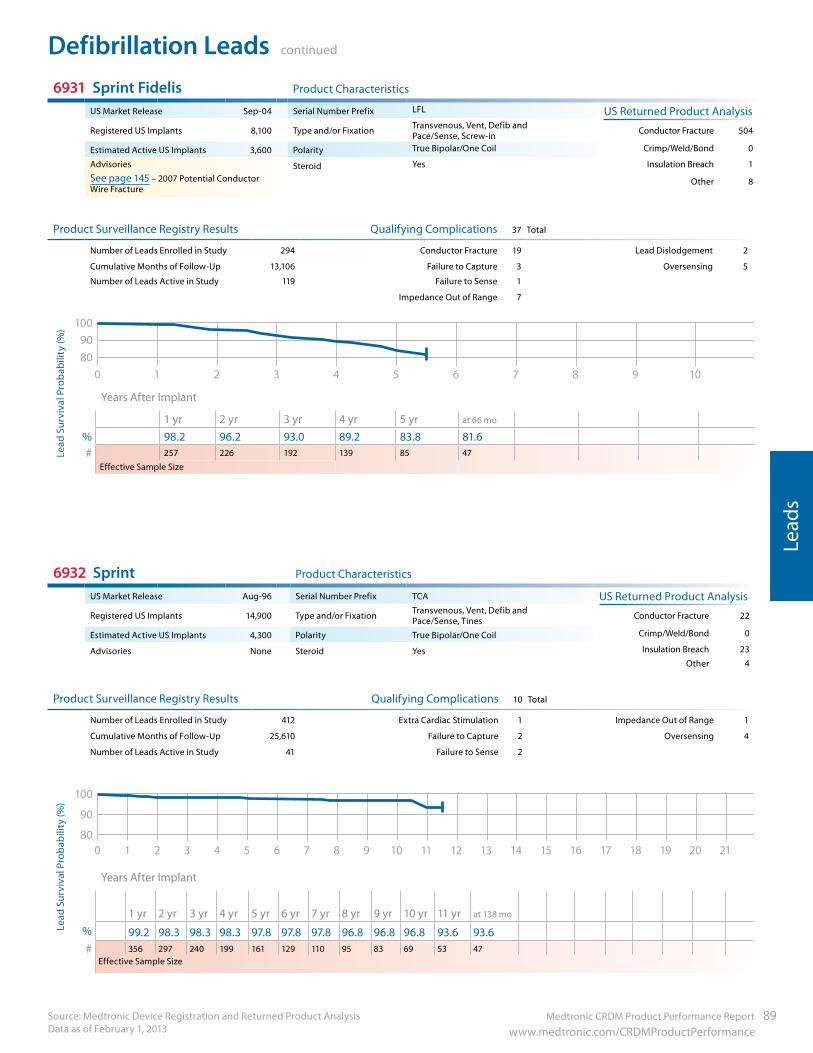
Medtronic CRDM Product Performance Report 89 www.medtronic.com/CRDMProductPerformance
Defibrillation Leads continued
Source: Medtronic Device Registration and Returned Product Analysis Data as of February 1, 2013
Lead
s
6931 Sprint Fidelis Product Characteristics
US Market Release Sep-04 Serial Number Prefix LFL US Returned Product Analysis
Registered US Implants 8,100 Type and/or Fixation Transvenous, Vent, Defib and Pace/Sense, Screw-in Conductor Fracture 504
Estimated Active US Implants 3,600 Polarity True Bipolar/One Coil Crimp/Weld/Bond 0
Advisories Steroid Yes Insulation Breach 1
See page 145 – 2007 Potential Conductor Wire Fracture
Other 8
Product Surveillance Registry Results Qualifying Complications 37 Total
Number of Leads Enrolled in Study 294 Conductor Fracture 19 Lead Dislodgement 2
Cumulative Months of Follow-Up 13,106 Failure to Capture 3 Oversensing 5
Number of Leads Active in Study 119 Failure to Sense 1
Impedance Out of Range 7
90100
80109876543210
Years After Implant
1 yr 2 yr 3 yr 4 yr 5 yr at 66 mo
% 98.2 96.2 93.0 89.2 83.8 81.6# 257 226 192 139 85 47
Effective Sample Size
6932 Sprint Product Characteristics
US Market Release Aug-96 Serial Number Prefix TCA US Returned Product Analysis
Registered US Implants 14,900 Type and/or Fixation Transvenous, Vent, Defib and Pace/Sense, Tines Conductor Fracture 22
Estimated Active US Implants 4,300 Polarity True Bipolar/One Coil Crimp/Weld/Bond 0
Advisories None Steroid Yes Insulation Breach 23
Other 4
Product Surveillance Registry Results Qualifying Complications 10 Total
Number of Leads Enrolled in Study 412 Extra Cardiac Stimulation 1 Impedance Out of Range 1
Cumulative Months of Follow-Up 25,610 Failure to Capture 2 Oversensing 4
Number of Leads Active in Study 41 Failure to Sense 2
90
100
8020181614121086420 21191715131197531
Years After Implant
1 yr 2 yr 3 yr 4 yr 5 yr 6 yr 7 yr 8 yr 9 yr 10 yr 11 yr at 138 mo
% 99.2 98.3 98.3 98.3 97.8 97.8 97.8 96.8 96.8 96.8 93.6 93.6# 356 297 240 199 161 129 110 95 83 69 53 47
Effective Sample Size
Lead
Sur
viva
l Pro
babi
lity
(%)
Lead
Sur
viva
l Pro
babi
lity
(%)
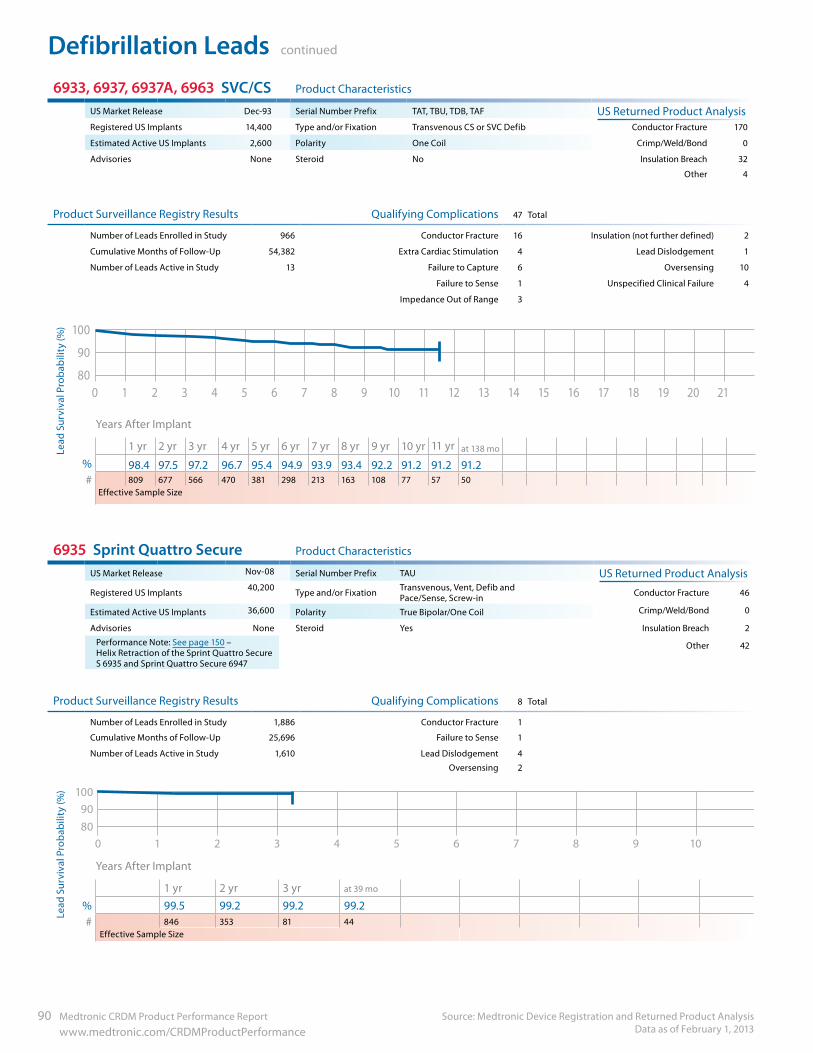
Defibrillation Leads continued
Source: Medtronic Device Registration and Returned Product Analysis Data as of February 1, 2013
90 Medtronic CRDM Product Performance Report www.medtronic.com/CRDMProductPerformance
6933, 6937, 6937A, 6963 SVC/CS Product Characteristics
US Market Release Dec-93 Serial Number Prefix TAT, TBU, TDB, TAF US Returned Product AnalysisRegistered US Implants 14,400 Type and/or Fixation Transvenous CS or SVC Defib Conductor Fracture 170
Estimated Active US Implants 2,600 Polarity One Coil Crimp/Weld/Bond 0
Advisories None Steroid No Insulation Breach 32
Other 4
Product Surveillance Registry Results Qualifying Complications 47 Total
Number of Leads Enrolled in Study 966 Conductor Fracture 16 Insulation (not further defined) 2
Cumulative Months of Follow-Up 54,382 Extra Cardiac Stimulation 4 Lead Dislodgement 1
Number of Leads Active in Study 13 Failure to Capture 6 Oversensing 10
Failure to Sense 1 Unspecified Clinical Failure 4
Impedance Out of Range 3
90
100
8020181614121086420 21191715131197531
Years After Implant
1 yr 2 yr 3 yr 4 yr 5 yr 6 yr 7 yr 8 yr 9 yr 10 yr 11 yr at 138 mo
% 98.4 97.5 97.2 96.7 95.4 94.9 93.9 93.4 92.2 91.2 91.2 91.2# 809 677 566 470 381 298 213 163 108 77 57 50
Effective Sample Size
6935 Sprint Quattro Secure Product Characteristics
US Market Release Nov-08 Serial Number Prefix TAU US Returned Product Analysis
Registered US Implants 40,200 Type and/or Fixation Transvenous, Vent, Defib and Pace/Sense, Screw-in Conductor Fracture 46
Estimated Active US Implants 36,600 Polarity True Bipolar/One Coil Crimp/Weld/Bond 0
Advisories None Steroid Yes Insulation Breach 2
Performance Note: See page 150 – Helix Retraction of the Sprint Quattro Secure S 6935 and Sprint Quattro Secure 6947
Other 42
Product Surveillance Registry Results Qualifying Complications 8 Total
Number of Leads Enrolled in Study 1,886 Conductor Fracture 1
Cumulative Months of Follow-Up 25,696 Failure to Sense 1
Number of Leads Active in Study 1,610 Lead Dislodgement 4
Oversensing 2
90100
80109876543210
Years After Implant
1 yr 2 yr 3 yr at 39 mo
% 99.5 99.2 99.2 99.2# 846 353 81 44
Effective Sample Size
Lead
Sur
viva
l Pro
babi
lity
(%)
Lead
Sur
viva
l Pro
babi
lity
(%)
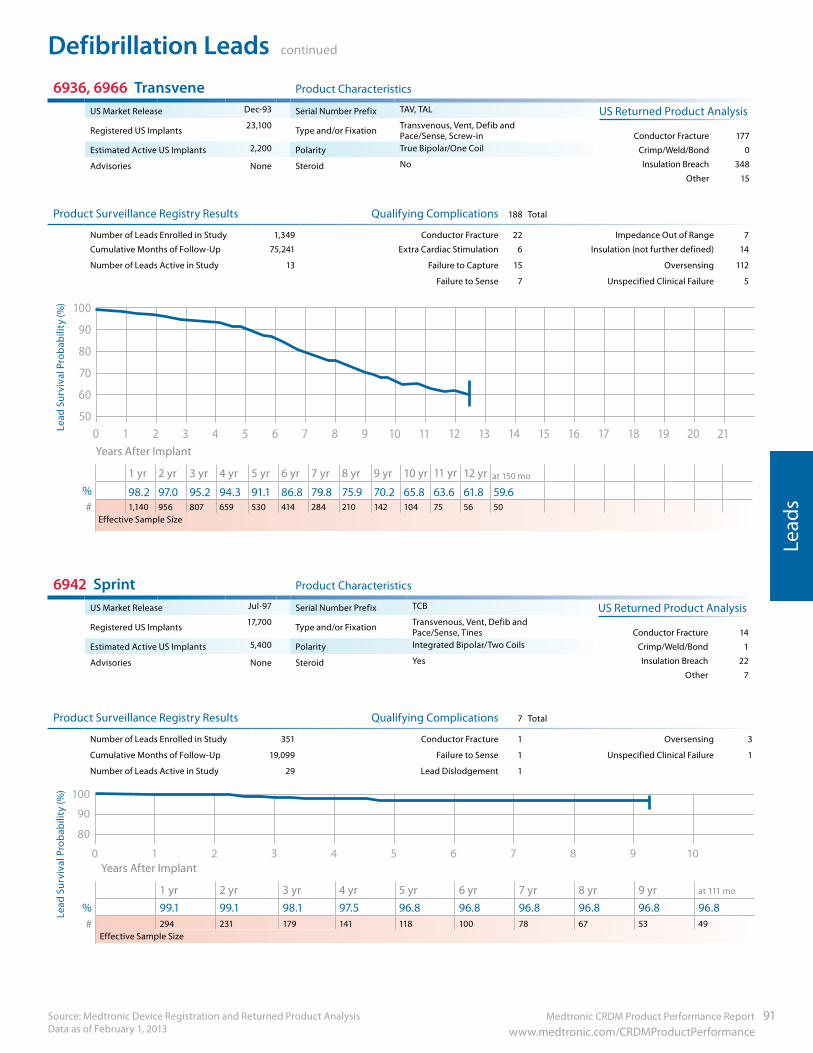
Medtronic CRDM Product Performance Report 91 www.medtronic.com/CRDMProductPerformance
Defibrillation Leads continued
Source: Medtronic Device Registration and Returned Product Analysis Data as of February 1, 2013
Lead
s
6936, 6966 Transvene Product Characteristics
US Market Release Dec-93 Serial Number Prefix TAV, TAL US Returned Product Analysis
Registered US Implants 23,100 Type and/or Fixation Transvenous, Vent, Defib and Pace/Sense, Screw-in Conductor Fracture 177
Estimated Active US Implants 2,200 Polarity True Bipolar/One Coil Crimp/Weld/Bond 0
Advisories None Steroid No Insulation Breach 348
Other 15
Product Surveillance Registry Results Qualifying Complications 188 Total
Number of Leads Enrolled in Study 1,349 Conductor Fracture 22 Impedance Out of Range 7
Cumulative Months of Follow-Up 75,241 Extra Cardiac Stimulation 6 Insulation (not further defined) 14
Number of Leads Active in Study 13 Failure to Capture 15 Oversensing 112
Failure to Sense 7 Unspecified Clinical Failure 5
90
100
80
70
60
5020181614121086420 21191715131197531
Years After Implant
1 yr 2 yr 3 yr 4 yr 5 yr 6 yr 7 yr 8 yr 9 yr 10 yr 11 yr 12 yr at 150 mo
% 98.2 97.0 95.2 94.3 91.1 86.8 79.8 75.9 70.2 65.8 63.6 61.8 59.6 # 1,140 956 807 659 530 414 284 210 142 104 75 56 50
Effective Sample Size
6942 Sprint Product Characteristics
US Market Release Jul-97 Serial Number Prefix TCB US Returned Product Analysis
Registered US Implants 17,700 Type and/or Fixation Transvenous, Vent, Defib and Pace/Sense, Tines Conductor Fracture 14
Estimated Active US Implants 5,400 Polarity Integrated Bipolar/Two Coils Crimp/Weld/Bond 1
Advisories None Steroid Yes Insulation Breach 22
Other 7
Product Surveillance Registry Results Qualifying Complications 7 Total
Number of Leads Enrolled in Study 351 Conductor Fracture 1 Oversensing 3
Cumulative Months of Follow-Up 19,099 Failure to Sense 1 Unspecified Clinical Failure 1
Number of Leads Active in Study 29 Lead Dislodgement 1
90
100
80
109876543210 Years After Implant
1 yr 2 yr 3 yr 4 yr 5 yr 6 yr 7 yr 8 yr 9 yr at 111 mo
% 99.1 99.1 98.1 97.5 96.8 96.8 96.8 96.8 96.8 96.8# 294 231 179 141 118 100 78 67 53 49
Effective Sample Size
Lead
Sur
viva
l Pro
babi
lity
(%)
Lead
Sur
viva
l Pro
babi
lity
(%)
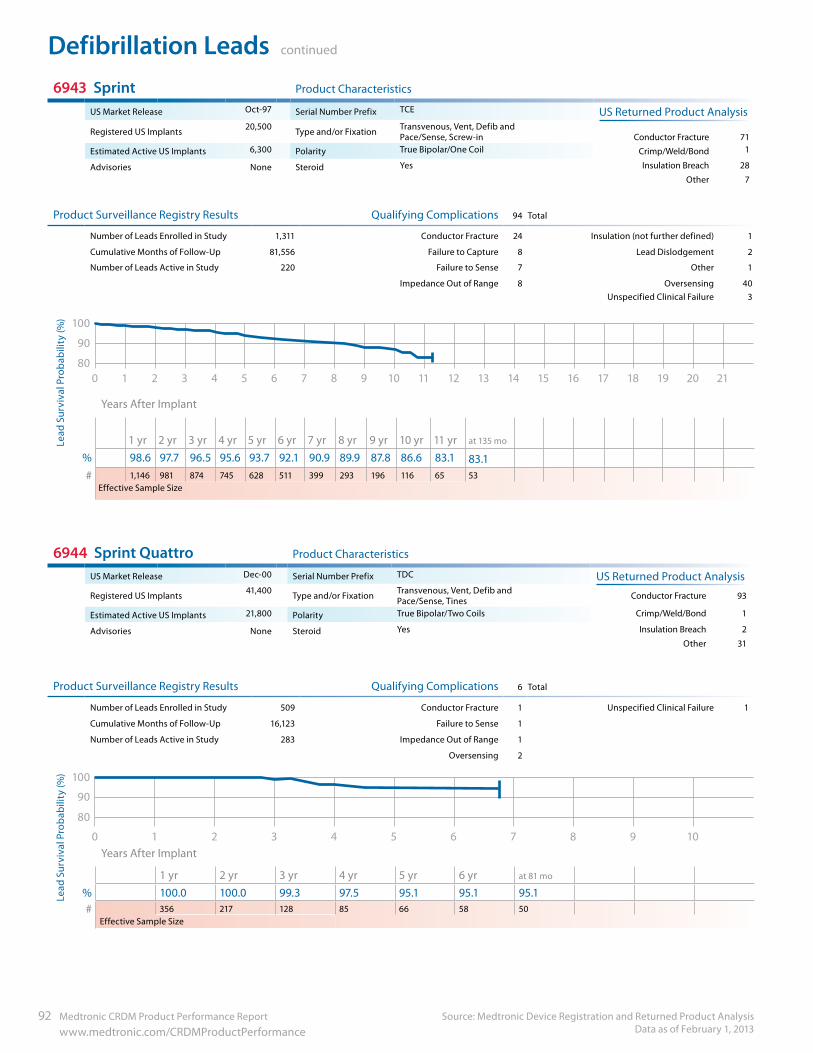
Defibrillation Leads continued
Source: Medtronic Device Registration and Returned Product Analysis Data as of February 1, 2013
92 Medtronic CRDM Product Performance Report www.medtronic.com/CRDMProductPerformance
6943 Sprint Product Characteristics
US Market Release Oct-97 Serial Number Prefix TCE US Returned Product Analysis
Registered US Implants 20,500 Type and/or Fixation Transvenous, Vent, Defib and Pace/Sense, Screw-in Conductor Fracture 71
Estimated Active US Implants 6,300 Polarity True Bipolar/One Coil Crimp/Weld/Bond 1
Advisories None Steroid Yes Insulation Breach 28
Other 7
Product Surveillance Registry Results Qualifying Complications 94 Total
Number of Leads Enrolled in Study 1,311 Conductor Fracture 24 Insulation (not further defined) 1
Cumulative Months of Follow-Up 81,556 Failure to Capture 8 Lead Dislodgement 2
Number of Leads Active in Study 220 Failure to Sense 7 Other 1
Impedance Out of Range 8 Oversensing 40Unspecified Clinical Failure 3
90
100
8020181614121086420 21191715131197531
Years After Implant
1 yr 2 yr 3 yr 4 yr 5 yr 6 yr 7 yr 8 yr 9 yr 10 yr 11 yr at 135 mo
% 98.6 97.7 96.5 95.6 93.7 92.1 90.9 89.9 87.8 86.6 83.1 83.1# 1,146 981 874 745 628 511 399 293 196 116 65 53
Effective Sample Size
6944 Sprint Quattro Product Characteristics
US Market Release Dec-00 Serial Number Prefix TDC US Returned Product Analysis
Registered US Implants 41,400 Type and/or Fixation Transvenous, Vent, Defib and Pace/Sense, Tines Conductor Fracture 93
Estimated Active US Implants 21,800 Polarity True Bipolar/Two Coils Crimp/Weld/Bond 1
Advisories None Steroid Yes Insulation Breach 2
Other 31
Product Surveillance Registry Results Qualifying Complications 6 Total
Number of Leads Enrolled in Study 509 Conductor Fracture 1 Unspecified Clinical Failure 1
Cumulative Months of Follow-Up 16,123 Failure to Sense 1
Number of Leads Active in Study 283 Impedance Out of Range 1
Oversensing 2
90
100
80
109876543210 Years After Implant
1 yr 2 yr 3 yr 4 yr 5 yr 6 yr at 81 mo
% 100.0 100.0 99.3 97.5 95.1 95.1 95.1# 356 217 128 85 66 58 50
Effective Sample Size
Lead
Sur
viva
l Pro
babi
lity
(%)
Lead
Sur
viva
l Pro
babi
lity
(%)
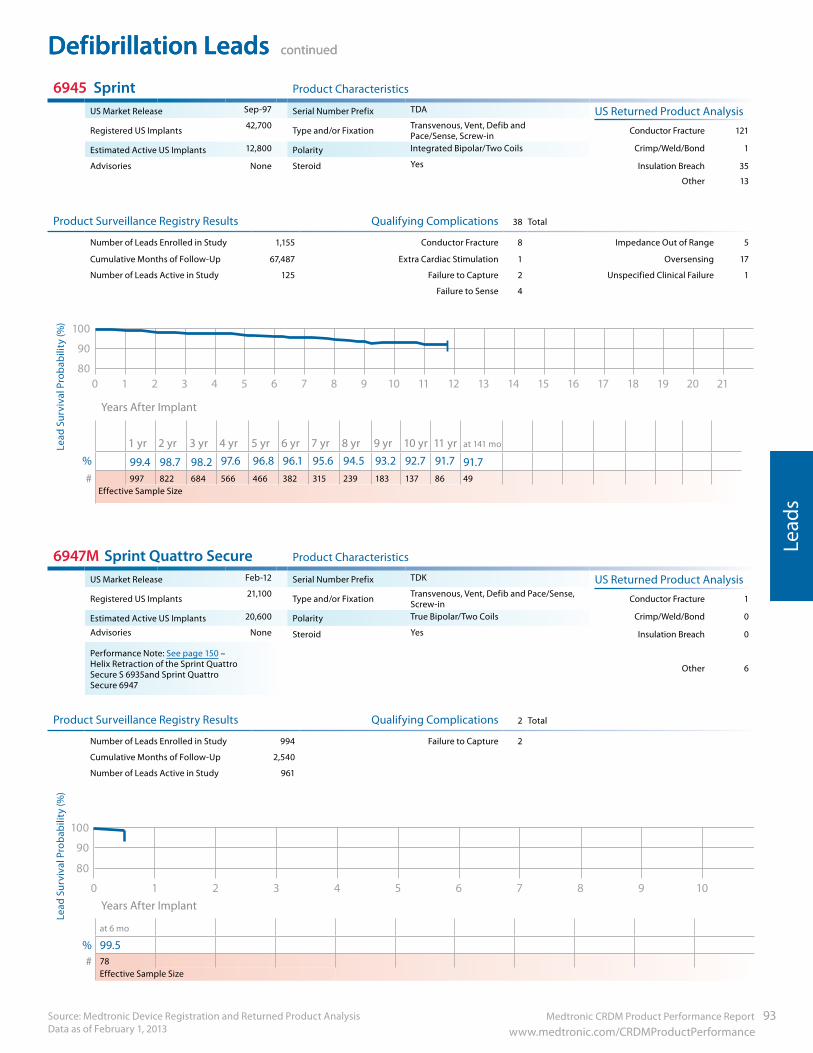
Medtronic CRDM Product Performance Report 93 www.medtronic.com/CRDMProductPerformance
Defibrillation Leads continued
Source: Medtronic Device Registration and Returned Product Analysis Data as of February 1, 2013
Lead
s
6945 Sprint Product Characteristics
US Market Release Sep-97 Serial Number Prefix TDA US Returned Product Analysis
Registered US Implants 42,700 Type and/or Fixation Transvenous, Vent, Defib and Pace/Sense, Screw-in Conductor Fracture 121
Estimated Active US Implants 12,800 Polarity Integrated Bipolar/Two Coils Crimp/Weld/Bond 1
Advisories None Steroid Yes Insulation Breach 35
Other 13
Product Surveillance Registry Results Qualifying Complications 38 Total
Number of Leads Enrolled in Study 1,155 Conductor Fracture 8 Impedance Out of Range 5
Cumulative Months of Follow-Up 67,487 Extra Cardiac Stimulation 1 Oversensing 17
Number of Leads Active in Study 125 Failure to Capture 2 Unspecified Clinical Failure 1
Failure to Sense 4
90
100
8020181614121086420 21191715131197531
Years After Implant
1 yr 2 yr 3 yr 4 yr 5 yr 6 yr 7 yr 8 yr 9 yr 10 yr 11 yr at 141 mo
% 99.4 98.7 98.2 97.6 96.8 96.1 95.6 94.5 93.2 92.7 91.7 91.7# 997 822 684 566 466 382 315 239 183 137 86 49
Effective Sample Size
6947M Sprint Quattro Secure Product Characteristics
US Market Release Feb-12 Serial Number Prefix TDK US Returned Product Analysis
Registered US Implants 21,100 Type and/or Fixation Transvenous, Vent, Defib and Pace/Sense, Screw-in Conductor Fracture 1
Estimated Active US Implants 20,600 Polarity True Bipolar/Two Coils Crimp/Weld/Bond 0
Advisories None Steroid Yes Insulation Breach 0
Performance Note: See page 150 – Helix Retraction of the Sprint Quattro Secure S 6935and Sprint Quattro Secure 6947
Other 6
Product Surveillance Registry Results Qualifying Complications 2 Total
Number of Leads Enrolled in Study 994 Failure to Capture 2
Cumulative Months of Follow-Up 2,540
Number of Leads Active in Study 961
90
100
80
109876543210 Years After Implant
at 6 mo
% 99.5# 78
Effective Sample Size
Defibrillation Leads continuedLe
ad S
urvi
val P
roba
bilit
y (%
)Le
ad S
urvi
val P
roba
bilit
y (%
)
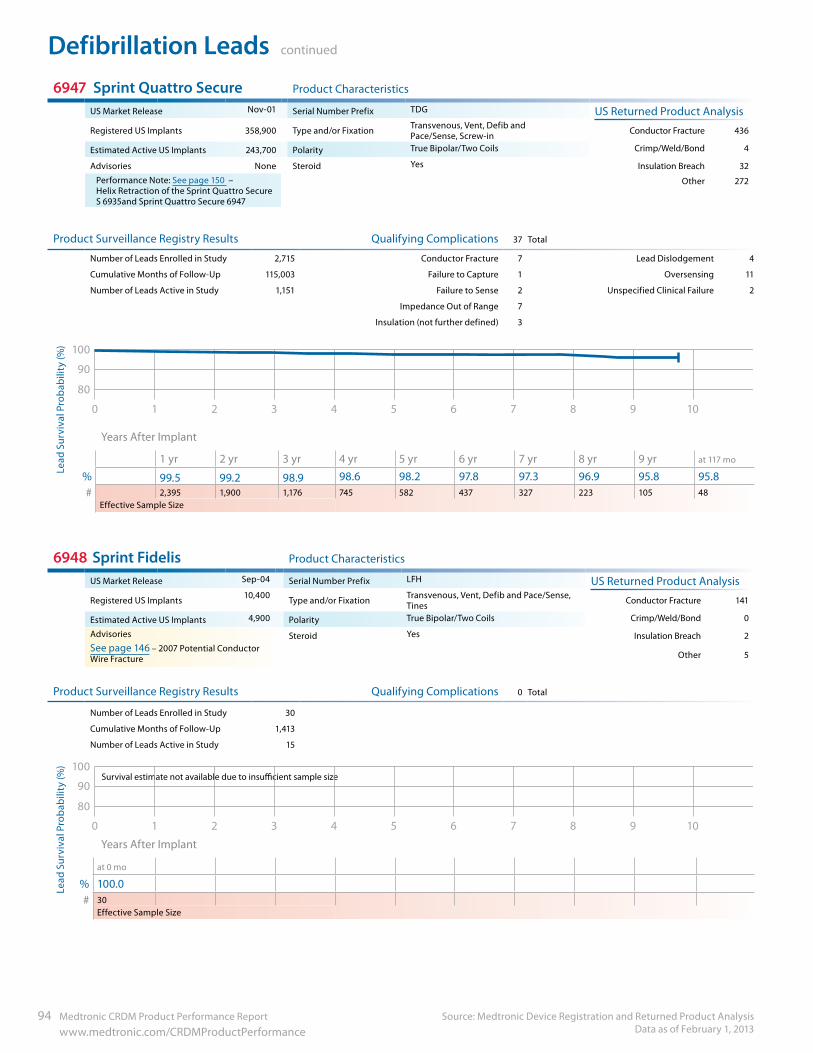
Defibrillation Leads continued
Source: Medtronic Device Registration and Returned Product Analysis Data as of February 1, 2013
94 Medtronic CRDM Product Performance Report www.medtronic.com/CRDMProductPerformance
6947 Sprint Quattro Secure Product Characteristics
US Market Release Nov-01 Serial Number Prefix TDG US Returned Product Analysis
Registered US Implants 358,900 Type and/or Fixation Transvenous, Vent, Defib and Pace/Sense, Screw-in Conductor Fracture 436
Estimated Active US Implants 243,700 Polarity True Bipolar/Two Coils Crimp/Weld/Bond 4
Advisories None Steroid Yes Insulation Breach 32
Performance Note: See page 150 – Helix Retraction of the Sprint Quattro Secure S 6935and Sprint Quattro Secure 6947
Other 272
Product Surveillance Registry Results Qualifying Complications 37 Total
Number of Leads Enrolled in Study 2,715 Conductor Fracture 7 Lead Dislodgement 4
Cumulative Months of Follow-Up 115,003 Failure to Capture 1 Oversensing 11
Number of Leads Active in Study 1,151 Failure to Sense 2 Unspecified Clinical Failure 2
Impedance Out of Range 7
Insulation (not further defined) 3
90
100
80
109876543210
Years After Implant
1 yr 2 yr 3 yr 4 yr 5 yr 6 yr 7 yr 8 yr 9 yr at 117 mo
% 99.5 99.2 98.9 98.6 98.2 97.8 97.3 96.9 95.8 95.8# 2,395 1,900 1,176 745 582 437 327 223 105 48
Effective Sample Size
6948 Sprint Fidelis Product Characteristics
US Market Release Sep-04 Serial Number Prefix LFH US Returned Product Analysis
Registered US Implants 10,400 Type and/or Fixation Transvenous, Vent, Defib and Pace/Sense, Tines Conductor Fracture 141
Estimated Active US Implants 4,900 Polarity True Bipolar/Two Coils Crimp/Weld/Bond 0
Advisories Steroid Yes Insulation Breach 2See page 146 – 2007 Potential Conductor Wire Fracture Other 5
Product Surveillance Registry Results Qualifying Complications 0 Total
Number of Leads Enrolled in Study 30
Cumulative Months of Follow-Up 1,413
Number of Leads Active in Study 15
Survival estimate not available due to insucient sample size90
100
80
109876543210
Years After Implant
at 0 mo
% 100.0# 30
Effective Sample Size
Lead
Sur
viva
l Pro
babi
lity
(%)
Lead
Sur
viva
l Pro
babi
lity
(%)
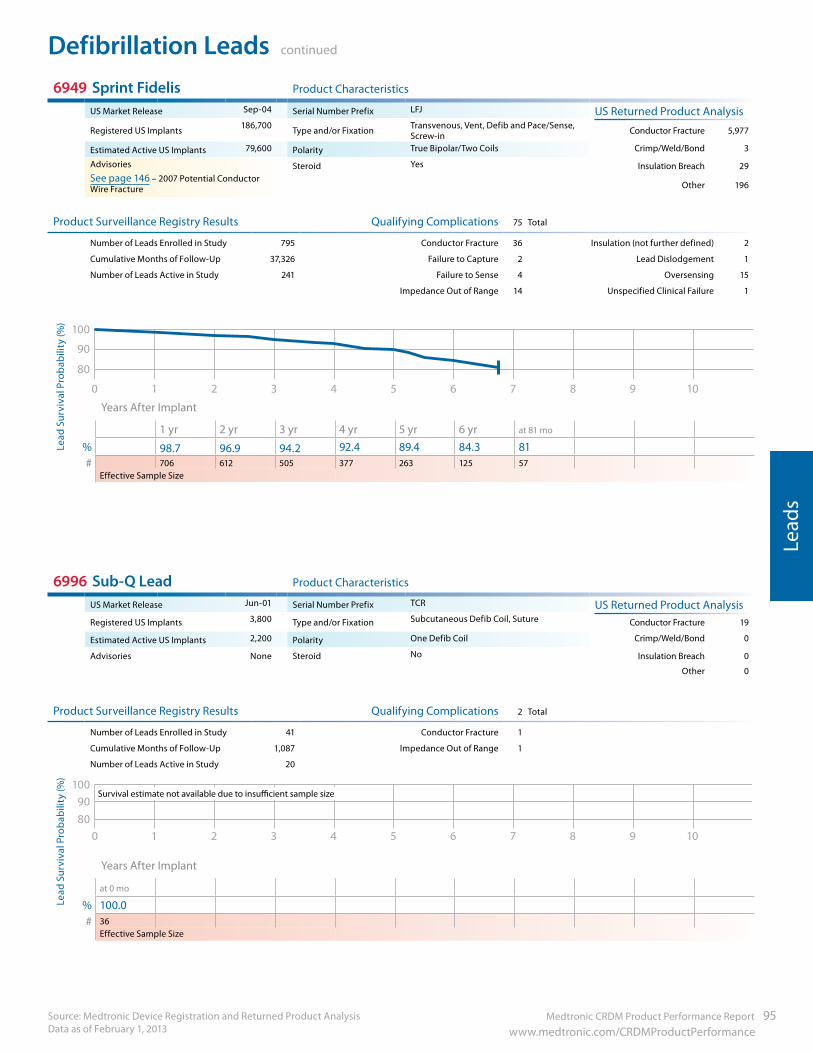
Medtronic CRDM Product Performance Report 95 www.medtronic.com/CRDMProductPerformance
Defibrillation Leads continued
Source: Medtronic Device Registration and Returned Product Analysis Data as of February 1, 2013
Lead
s
6949 Sprint Fidelis Product Characteristics
US Market Release Sep-04 Serial Number Prefix LFJ US Returned Product Analysis
Registered US Implants 186,700 Type and/or Fixation Transvenous, Vent, Defib and Pace/Sense, Screw-in Conductor Fracture 5,977
Estimated Active US Implants 79,600 Polarity True Bipolar/Two Coils Crimp/Weld/Bond 3
Advisories Steroid Yes Insulation Breach 29See page 146 – 2007 Potential Conductor Wire Fracture Other 196
Product Surveillance Registry Results Qualifying Complications 75 Total
Number of Leads Enrolled in Study 795 Conductor Fracture 36 Insulation (not further defined) 2
Cumulative Months of Follow-Up 37,326 Failure to Capture 2 Lead Dislodgement 1
Number of Leads Active in Study 241 Failure to Sense 4 Oversensing 15
Impedance Out of Range 14 Unspecified Clinical Failure 1
90
100
80
70
60
50
40
30
20
10
109876543210
Years After Implant
1 yr 2 yr 3 yr 4 yr 5 yr 6 yr at 81 mo
% 98.7 96.9 94.2 92.4 89.4 84.3 81# 706 612 505 377 263 125 57
Effective Sample Size
6996 Sub-Q Lead Product Characteristics
US Market Release Jun-01 Serial Number Prefix TCR US Returned Product AnalysisRegistered US Implants 3,800 Type and/or Fixation Subcutaneous Defib Coil, Suture Conductor Fracture 19
Estimated Active US Implants 2,200 Polarity One Defib Coil Crimp/Weld/Bond 0
Advisories None Steroid No Insulation Breach 0
Other 0
Product Surveillance Registry Results Qualifying Complications 2 Total
Number of Leads Enrolled in Study 41 Conductor Fracture 1
Cumulative Months of Follow-Up 1,087 Impedance Out of Range 1
Number of Leads Active in Study 20
Survival estimate not available due to insucient sample size90
100
80109876543210
Years After Implant
at 0 mo
% 100.0 # 36
Effective Sample Size
Lead
Sur
viva
l Pro
babi
lity
(%)
Lead
Sur
viva
l Pro
babi
lity
(%)
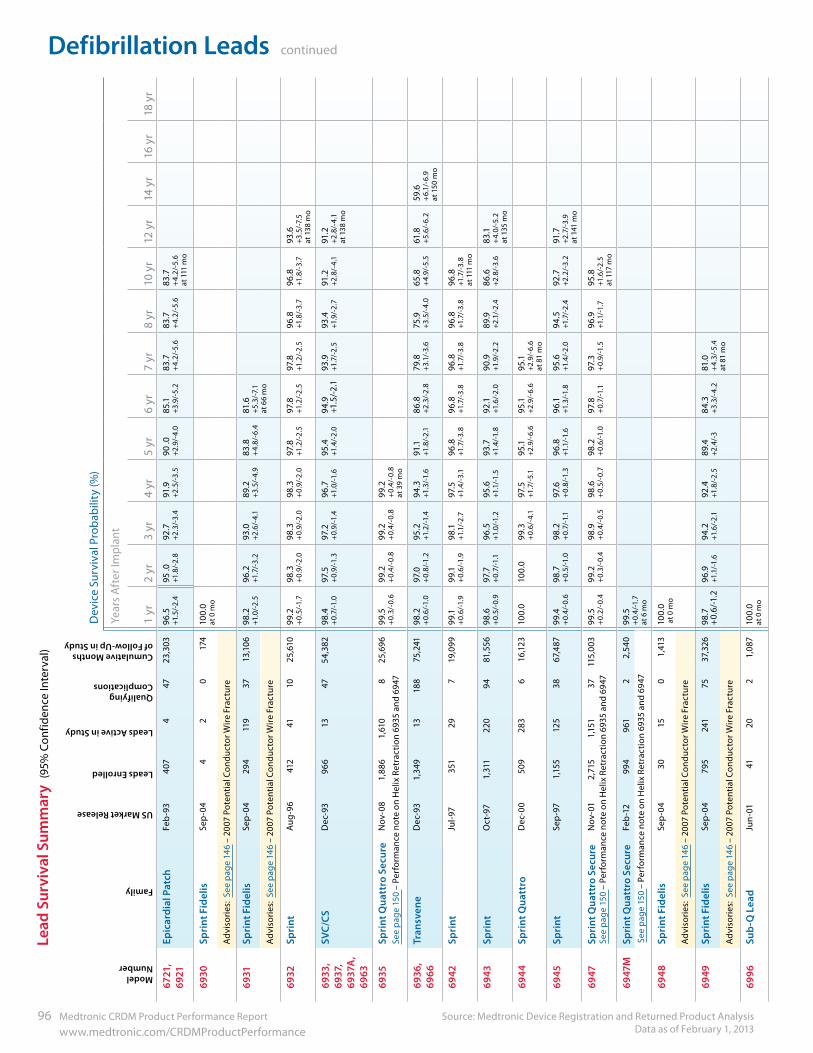
Defibrillation Leads continued
Source: Medtronic Device Registration and Returned Product Analysis Data as of February 1, 2013
96 Medtronic CRDM Product Performance Report www.medtronic.com/CRDMProductPerformance
ModelNumber
Family
US Market Release
Leads Enrolled
Leads Active in Study
Qualifying Complications
Cumulative Months of Follow-Up in Study
Dev
ice
Surv
ival
Pro
babi
lity
(%)
Year
s A
fter
Impl
ant
1 yr
2 yr
3 yr
4 yr
5 yr
6 yr
7 yr
8 yr
10 y
r12
yr
14 y
r16
yr
18 y
r67
21,
6921
Ep
icar
dial
Pat
ch
Feb
-93
407
447
23,3
0396
.5
+1.5
/-2.
495
.0+1
.8/-
2.8
92.7
+2
.3/-
3.4
91.9
+2
.5/-
3.5
90 .0
+2.9
/-4.
085
.1
+3.9
/-5.
283
.7
+4.
2/-5
.683
.7
+4.
2/-5
.683
.7
+4.
2/-5
.6
at 1
11 m
o
6930
Spri
nt F
idel
isSe
p-0
44
20
174
100.
0 at
0 m
o
Adv
isor
ies:
See
pag
e 14
6 –
2007
Pot
entia
l Con
duct
or W
ire F
ract
ure
6931
Spri
nt F
idel
isSe
p-0
429
411
937
13,1
0698
.2+1
.0/-
2.5
96.2
+1.7
/-3.
293
.0+2
.6/-
4.1
89.2
+3.5
/-4.
983
.8+
4.8/
-6.4
81.6
+5.3
/-7.
1
at 6
6 m
oA
dvis
orie
s: S
ee p
age
146
– 20
07 P
oten
tial C
ondu
ctor
Wire
Fra
ctur
e
6932
Spri
nt
Aug
-96
412
4110
25,6
1099
.2+
0.5/
-1.7
98.3
+0.
9/-2
.098
.3+
0.9/
-2.0
98.3
+0.
9/-2
.097
.8+1
.2/-
2.5
97.8
+1.2
/-2.
597
.8+1
.2/-
2.5
96.8
+1.8
/-3.
796
.8+1
.8/-
3.7
93.6
+3.5
/-7.
5
at 1
38 m
o
6933
, 69
37,
6937
A,
6963
SVC/
CSD
ec-9
396
613
4754
,382
98.4
+0.
7/-1
.097
.5+
0.9/
-1.3
97.2
+0.
9/-1
.496
.7+1
.0/-1
.695
.4+1
.4/-
2.0
94.9
+1
.5/-
2.1
93.9
+1.7
/-2.
593
.4+1
.9/-
2.7
91.2
+2.8
/-4.
191
.2+2
.8/-
4.1
at
138
mo
6935
Spri
nt Q
uatt
ro S
ecur
e
Nov
-08
1,88
61,
610
825
,696
99.5
+0.
3/-0
.699
.2+
0.4/
-0.8
99.2
+0.
4/-0
.899
.2+
0.4/
-0.8
at
39
mo
6936
, 69
66Tr
ansv
ene
Dec
-93
1,34
913
188
75,2
4198
.2+
0.6/
-1.0
97.0
+0.
8/-1
.295
.2+1
.2/-1
.494
.3+1
.3/-1
.691
.1+1
.8/-
2.1
86.8
+2.3
/-2.
879
.8+3
.1/-
3.6
75.9
+3.5
/-4.
065
.8+
4.9/
-5.5
61.8
+5.6
/-6.
259
.6+
6.1/
-6.9
at
150
mo
6942
Spri
nt
Jul-9
735
129
719
,099
99.1
+0.
6/-1
.999
.1+
0.6/
-1.9
98.1
+1.1
/-2.
797
.5+1
.4/-
3.1
96.8
+1.7
/-3.
896
.8+1
.7/-
3.8
96.8
+1.7
/-3.
896
.8+1
.7/-
3.8
96.8
+1.7
/-3.
8
at 1
11 m
o
6943
Spri
ntO
ct-9
71,
311
220
9481
,556
98.6
+0.
5/-0
.997
.7+
0.7/
-1.1
96.5
+1
.0/-1
.295
.6+1
.1/-1
.593
.7+1
.4/-1
.892
.1+1
.6/-
2.0
90.9
+1.9
/-2.
289
.9+2
.1/-
2.4
86.6
+2.8
/-3.
683
.1+
4.0/
-5.2
at
135
mo
6944
Spri
nt Q
uatt
ro
Dec
-00
509
283
616
,123
100.
010
0.0
99.3
+0.
6/-4
.197
.5+1
.7/-
5.1
95.1
+2.9
/-6.
695
.1+2
.9/-
6.6
95.1
+2.9
/-6.
6 at
81
mo
6945
Spri
nt
Sep
-97
1,15
512
538
67,4
8799
.4+
0.4/
-0.6
98.7
+0.
5/-1
.098
.2+
0.7/
-1.1
97.6
+0.
8/-1
.396
.8+1
.1/-1
.696
.1+1
.3/-1
.895
.6+1
.4/-
2.0
94.5
+1.7
/-2.
492
.7+2
.2/-
3.2
91.7
+2.7
/-3.
9
at 1
41 m
o
6947
Spri
nt Q
uatt
ro S
ecur
eN
ov-0
12,
715
1,15
137
115,
003
99.5
+0.
2/-0
.499
.2+
0.3/
-0.4
98.9
+0.
4/-0
.598
.6+
0.5/
-0.7
98.2
+0.
6/-1
.097
.8+
0.7/
-1.1
97.3
+0.
9/-1
.596
.9+1
.1/-1
.795
.8+1
.6/-
2.5
at
117
mo
6947
MSp
rint
Qua
ttro
Sec
ure
Feb
-12
994
961
22,
540
99.5
+0.
4/-1
.7
at 6
mo
6948
Spri
nt F
idel
isSe
p-0
430
150
1,41
310
0.0
at 0
mo
Adv
isor
ies:
See
pag
e 14
6 –
2007
Pot
entia
l Con
duct
or W
ire F
ract
ure
6949
Spri
nt F
idel
isSe
p-0
479
524
175
37,3
2698
.7
+0.
6/-1
.296
.9
+1.1
/-1.6
94.2
+1
.6/-
2.1
92.4
+1
.8/-
2.5
89.4
+2
.4/-
384
.3
+3.3
/-4.
281
.0+
4.3/
-5.4
at
81
mo
Adv
isor
ies:
See
pag
e 14
6 –
2007
Pot
entia
l Con
duct
or W
ire F
ract
ure
6996
Sub
-Q L
ead
Jun-
0141
202
1,08
710
0.0
at
0 m
o
Lead
Sur
viva
l Sum
mar
y (9
5% C
onfid
ence
Inte
rval
)
See
page
150
– P
erfo
rman
ce n
ote
on H
elix
Ret
ract
ion
6935
and
694
7
See
page
150
– P
erfo
rman
ce n
ote
on H
elix
Ret
ract
ion
6935
and
694
7
See
page
150
– P
erfo
rman
ce n
ote
on H
elix
Ret
ract
ion
6935
and
694
7
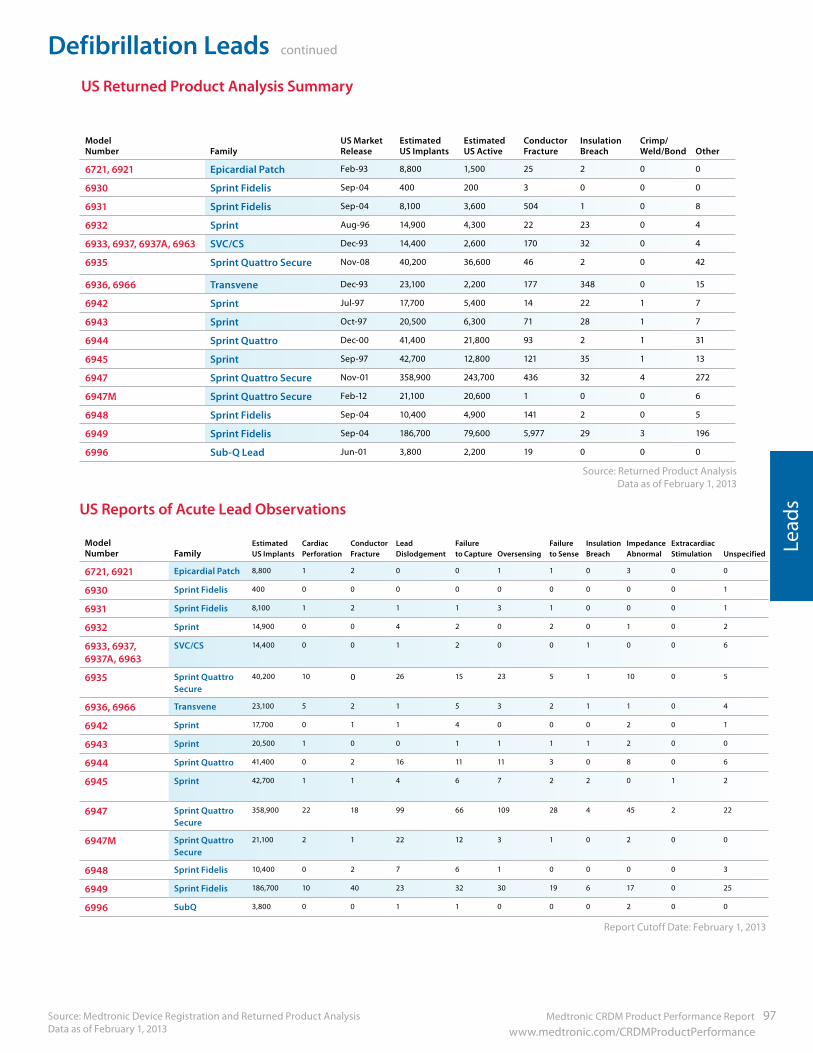
Medtronic CRDM Product Performance Report 97 www.medtronic.com/CRDMProductPerformance
Defibrillation Leads continued
Source: Medtronic Device Registration and Returned Product Analysis Data as of February 1, 2013
Lead
s
ModelNumber Family
US MarketRelease
Estimated US Implants
Estimated US Active
Conductor Fracture
Insulation Breach
Crimp/Weld/Bond Other
6721, 6921 Epicardial Patch Feb-93 8,800 1,500 25 2 0 0
6930 Sprint Fidelis Sep-04 400 200 3 0 0 0
6931 Sprint Fidelis Sep-04 8,100 3,600 504 1 0 8
6932 Sprint Aug-96 14,900 4,300 22 23 0 4
6933, 6937, 6937A, 6963 SVC/CS Dec-93 14,400 2,600 170 32 0 4
6935 Sprint Quattro Secure Nov-08 40,200 36,600 46 2 0 42
6936, 6966 Transvene Dec-93 23,100 2,200 177 348 0 15
6942 Sprint Jul-97 17,700 5,400 14 22 1 7
6943 Sprint Oct-97 20,500 6,300 71 28 1 7
6944 Sprint Quattro Dec-00 41,400 21,800 93 2 1 31
6945 Sprint Sep-97 42,700 12,800 121 35 1 13
6947 Sprint Quattro Secure Nov-01 358,900 243,700 436 32 4 272
6947M Sprint Quattro Secure Feb-12 21,100 20,600 1 0 0 6
6948 Sprint Fidelis Sep-04 10,400 4,900 141 2 0 5
6949 Sprint Fidelis Sep-04 186,700 79,600 5,977 29 3 196
6996 Sub-Q Lead Jun-01 3,800 2,200 19 0 0 0
US Returned Product Analysis Summary
ModelNumber Family
Estimated US Implants
Cardiac Perforation
Conductor Fracture
Lead Dislodgement
Failure to Capture Oversensing
Failure to Sense
Insulation Breach
Impedance Abnormal
Extracardiac Stimulation Unspecified
6721, 6921 Epicardial Patch 8,800 1 2 0 0 1 1 0 3 0 0
6930 Sprint Fidelis 400 0 0 0 0 0 0 0 0 0 1
6931 Sprint Fidelis 8,100 1 2 1 1 3 1 0 0 0 1
6932 Sprint 14,900 0 0 4 2 0 2 0 1 0 2
6933, 6937, 6937A, 6963
SVC/CS 14,400 0 0 1 2 0 0 1 0 0 6
6935 Sprint Quattro Secure
40,200 10 0 26 15 23 5 1 10 0 5
6936, 6966 Transvene 23,100 5 2 1 5 3 2 1 1 0 4
6942 Sprint 17,700 0 1 1 4 0 0 0 2 0 1
6943 Sprint 20,500 1 0 0 1 1 1 1 2 0 0
6944 Sprint Quattro 41,400 0 2 16 11 11 3 0 8 0 6
6945 Sprint 42,700 1 1 4 6 7 2 2 0 1 2
6947 Sprint Quattro Secure
358,900 22 18 99 66 109 28 4 45 2 22
6947M Sprint Quattro Secure
21,100 2 1 22 12 3 1 0 2 0 0
6948 Sprint Fidelis 10,400 0 2 7 6 1 0 0 0 0 3
6949 Sprint Fidelis 186,700 10 40 23 32 30 19 6 17 0 25
6996 SubQ 3,800 0 0 1 1 0 0 0 2 0 0
US Reports of Acute Lead Observations
Report Cutoff Date: February 1, 2013
Source: Returned Product Analysis Data as of February 1, 2013
ModelNumber
Family
US Market Release
Leads Enrolled
Leads Active in Study
Qualifying Complications
Cumulative Months of Follow-Up in Study
Dev
ice
Surv
ival
Pro
babi
lity
(%)
Year
s A
fter
Impl
ant
1 yr
2 yr
3 yr
4 yr
5 yr
6 yr
7 yr
8 yr
10 y
r12
yr
14 y
r16
yr
18 y
r67
21,
6921
Ep
icar
dial
Pat
ch
Feb
-93
407
447
23,3
0396
.5
+1.5
/-2.
495
.0+1
.8/-
2.8
92.7
+2
.3/-
3.4
91.9
+2
.5/-
3.5
90 .0
+2.9
/-4.
085
.1
+3.9
/-5.
283
.7
+4.
2/-5
.683
.7
+4.
2/-5
.683
.7
+4.
2/-5
.6
at 1
11 m
o
6930
Spri
nt F
idel
isSe
p-0
44
20
174
100.
0 at
0 m
o
Adv
isor
ies:
See
pag
e 14
6 –
2007
Pot
entia
l Con
duct
or W
ire F
ract
ure
6931
Spri
nt F
idel
isSe
p-0
429
411
937
13,1
0698
.2+1
.0/-
2.5
96.2
+1.7
/-3.
293
.0+2
.6/-
4.1
89.2
+3.5
/-4.
983
.8+
4.8/
-6.4
81.6
+5.3
/-7.
1
at 6
6 m
oA
dvis
orie
s: S
ee p
age
146
– 20
07 P
oten
tial C
ondu
ctor
Wire
Fra
ctur
e
6932
Spri
nt
Aug
-96
412
4110
25,6
1099
.2+
0.5/
-1.7
98.3
+0.
9/-2
.098
.3+
0.9/
-2.0
98.3
+0.
9/-2
.097
.8+1
.2/-
2.5
97.8
+1.2
/-2.
597
.8+1
.2/-
2.5
96.8
+1.8
/-3.
796
.8+1
.8/-
3.7
93.6
+3.5
/-7.
5
at 1
38 m
o
6933
, 69
37,
6937
A,
6963
SVC/
CSD
ec-9
396
613
4754
,382
98.4
+0.
7/-1
.097
.5+
0.9/
-1.3
97.2
+0.
9/-1
.496
.7+1
.0/-1
.695
.4+1
.4/-
2.0
94.9
+1
.5/-
2.1
93.9
+1.7
/-2.
593
.4+1
.9/-
2.7
91.2
+2.8
/-4.
191
.2+2
.8/-
4.1
at
138
mo
6935
Spri
nt Q
uatt
ro S
ecur
e
Nov
-08
1,88
61,
610
825
,696
99.5
+0.
3/-0
.699
.2+
0.4/
-0.8
99.2
+0.
4/-0
.899
.2+
0.4/
-0.8
at
39
mo
6936
, 69
66Tr
ansv
ene
Dec
-93
1,34
913
188
75,2
4198
.2+
0.6/
-1.0
97.0
+0.
8/-1
.295
.2+1
.2/-1
.494
.3+1
.3/-1
.691
.1+1
.8/-
2.1
86.8
+2.3
/-2.
879
.8+3
.1/-
3.6
75.9
+3.5
/-4.
065
.8+
4.9/
-5.5
61.8
+5.6
/-6.
259
.6+
6.1/
-6.9
at
150
mo
6942
Spri
nt
Jul-9
735
129
719
,099
99.1
+0.
6/-1
.999
.1+
0.6/
-1.9
98.1
+1.1
/-2.
797
.5+1
.4/-
3.1
96.8
+1.7
/-3.
896
.8+1
.7/-
3.8
96.8
+1.7
/-3.
896
.8+1
.7/-
3.8
96.8
+1.7
/-3.
8
at 1
11 m
o
6943
Spri
ntO
ct-9
71,
311
220
9481
,556
98.6
+0.
5/-0
.997
.7+
0.7/
-1.1
96.5
+1
.0/-1
.295
.6+1
.1/-1
.593
.7+1
.4/-1
.892
.1+1
.6/-
2.0
90.9
+1.9
/-2.
289
.9+2
.1/-
2.4
86.6
+2.8
/-3.
683
.1+
4.0/
-5.2
at
135
mo
6944
Spri
nt Q
uatt
ro
Dec
-00
509
283
616
,123
100.
010
0.0
99.3
+0.
6/-4
.197
.5+1
.7/-
5.1
95.1
+2.9
/-6.
695
.1+2
.9/-
6.6
95.1
+2.9
/-6.
6 at
81
mo
6945
Spri
nt
Sep
-97
1,15
512
538
67,4
8799
.4+
0.4/
-0.6
98.7
+0.
5/-1
.098
.2+
0.7/
-1.1
97.6
+0.
8/-1
.396
.8+1
.1/-1
.696
.1+1
.3/-1
.895
.6+1
.4/-
2.0
94.5
+1.7
/-2.
492
.7+2
.2/-
3.2
91.7
+2.7
/-3.
9
at 1
41 m
o
6947
Spri
nt Q
uatt
ro S
ecur
eN
ov-0
12,
715
1,15
137
115,
003
99.5
+0.
2/-0
.499
.2+
0.3/
-0.4
98.9
+0.
4/-0
.598
.6+
0.5/
-0.7
98.2
+0.
6/-1
.097
.8+
0.7/
-1.1
97.3
+0.
9/-1
.596
.9+1
.1/-1
.795
.8+1
.6/-
2.5
at
117
mo
6947
MSp
rint
Qua
ttro
Sec
ure
Feb
-12
994
961
22,
540
99.5
+0.
4/-1
.7
at 6
mo
6948
Spri
nt F
idel
isSe
p-0
430
150
1,41
310
0.0
at 0
mo
Adv
isor
ies:
See
pag
e 14
6 –
2007
Pot
entia
l Con
duct
or W
ire F
ract
ure
6949
Spri
nt F
idel
isSe
p-0
479
524
175
37,3
2698
.7
+0.
6/-1
.296
.9
+1.1
/-1.6
94.2
+1
.6/-
2.1
92.4
+1
.8/-
2.5
89.4
+2
.4/-
384
.3
+3.3
/-4.
281
.0+
4.3/
-5.4
at
81
mo
Adv
isor
ies:
See
pag
e 14
6 –
2007
Pot
entia
l Con
duct
or W
ire F
ract
ure
6996
Sub
-Q L
ead
Jun-
0141
202
1,08
710
0.0
at
0 m
o
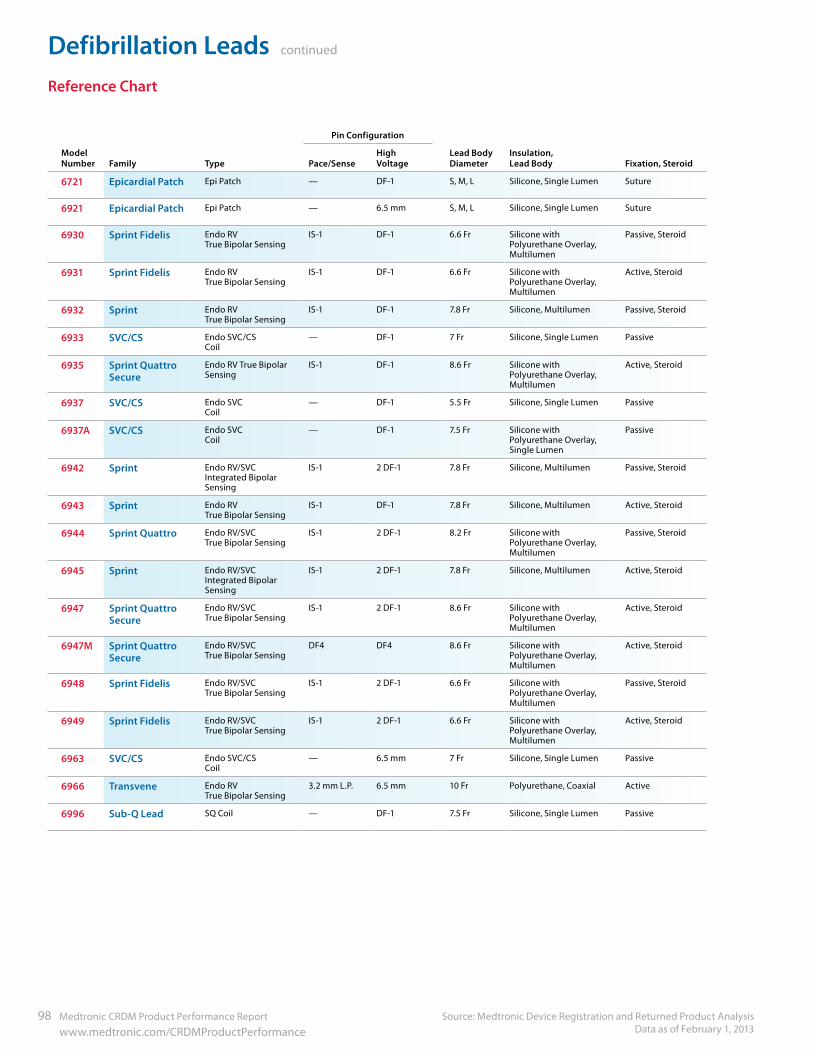
Defibrillation Leads continued
Source: Medtronic Device Registration and Returned Product Analysis Data as of February 1, 2013
98 Medtronic CRDM Product Performance Report www.medtronic.com/CRDMProductPerformance
Reference Chart
ModelNumber Family Type
Pin Configuration
Lead Body Diameter
Insulation, Lead Body Fixation, SteroidPace/Sense
High Voltage
6721 Epicardial Patch Epi Patch — DF-1 S, M, L Silicone, Single Lumen Suture
6921 Epicardial Patch Epi Patch — 6.5 mm S, M, L Silicone, Single Lumen Suture
6930 Sprint Fidelis Endo RVTrue Bipolar Sensing
IS-1 DF-1 6.6 Fr Silicone with Polyurethane Overlay, Multilumen
Passive, Steroid
6931 Sprint Fidelis Endo RVTrue Bipolar Sensing
IS-1 DF-1 6.6 Fr Silicone with Polyurethane Overlay, Multilumen
Active, Steroid
6932 Sprint Endo RVTrue Bipolar Sensing
IS-1 DF-1 7.8 Fr Silicone, Multilumen Passive, Steroid
6933 SVC/CS Endo SVC/CSCoil
— DF-1 7 Fr Silicone, Single Lumen Passive
6935 Sprint Quattro Secure
Endo RV True Bipolar Sensing
IS-1 DF-1 8.6 Fr Silicone with Polyurethane Overlay, Multilumen
Active, Steroid
6937 SVC/CS Endo SVCCoil
— DF-1 5.5 Fr Silicone, Single Lumen Passive
6937A SVC/CS Endo SVCCoil
— DF-1 7.5 Fr Silicone with Polyurethane Overlay, Single Lumen
Passive
6942 Sprint Endo RV/SVCIntegrated Bipolar Sensing
IS-1 2 DF-1 7.8 Fr Silicone, Multilumen Passive, Steroid
6943 Sprint Endo RVTrue Bipolar Sensing
IS-1 DF-1 7.8 Fr Silicone, Multilumen Active, Steroid
6944 Sprint Quattro Endo RV/SVCTrue Bipolar Sensing
IS-1 2 DF-1 8.2 Fr Silicone with Polyurethane Overlay, Multilumen
Passive, Steroid
6945 Sprint Endo RV/SVCIntegrated Bipolar Sensing
IS-1 2 DF-1 7.8 Fr Silicone, Multilumen Active, Steroid
6947 Sprint Quattro Secure
Endo RV/SVC True Bipolar Sensing
IS-1 2 DF-1 8.6 Fr Silicone with Polyurethane Overlay, Multilumen
Active, Steroid
6947M Sprint Quattro Secure
Endo RV/SVCTrue Bipolar Sensing
DF4 DF4 8.6 Fr Silicone withPolyurethane Overlay,Multilumen
Active, Steroid
6948 Sprint Fidelis Endo RV/SVCTrue Bipolar Sensing
IS-1 2 DF-1 6.6 Fr Silicone with Polyurethane Overlay, Multilumen
Passive, Steroid
6949 Sprint Fidelis Endo RV/SVCTrue Bipolar Sensing
IS-1 2 DF-1 6.6 Fr Silicone with Polyurethane Overlay,Multilumen
Active, Steroid
6963 SVC/CS Endo SVC/CSCoil
— 6.5 mm 7 Fr Silicone, Single Lumen Passive
6966 Transvene Endo RVTrue Bipolar Sensing
3.2 mm L.P. 6.5 mm 10 Fr Polyurethane, Coaxial Active
6996 Sub-Q Lead SQ Coil — DF-1 7.5 Fr Silicone, Single Lumen Passive
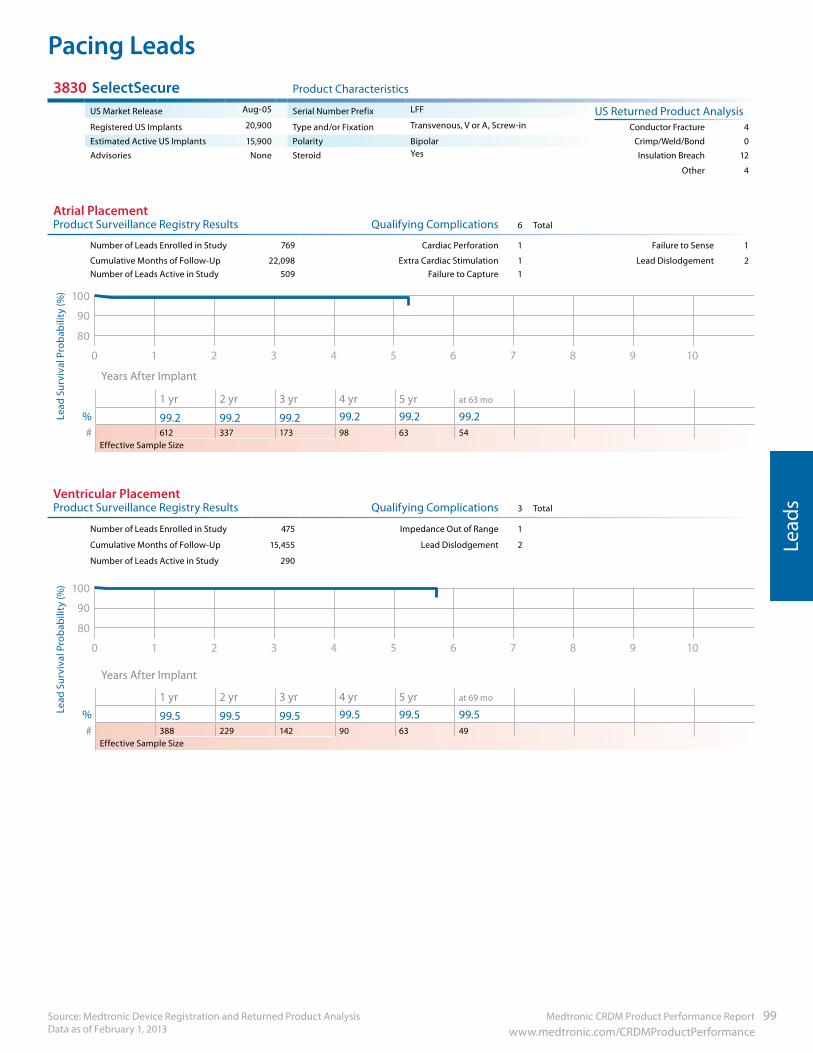
Pacing Leads
Medtronic CRDM Product Performance Report 99 www.medtronic.com/CRDMProductPerformance
Source: Medtronic Device Registration and Returned Product Analysis Data as of February 1, 2013
Lead
s
3830 SelectSecure Product Characteristics
US Market Release Aug-05 Serial Number Prefix LFF US Returned Product AnalysisRegistered US Implants 20,900 Type and/or Fixation Transvenous, V or A, Screw-in Conductor Fracture 4
Estimated Active US Implants 15,900 Polarity Bipolar Crimp/Weld/Bond 0
Advisories None Steroid Yes Insulation Breach 12
Other 4
Atrial Placement Product Surveillance Registry Results Qualifying Complications 6 Total
Number of Leads Enrolled in Study 769 Cardiac Perforation 1 Failure to Sense 1
Cumulative Months of Follow-Up 22,098 Extra Cardiac Stimulation 1 Lead Dislodgement 2Number of Leads Active in Study 509 Failure to Capture 1
90
100
80
70
60
50
40
30
20
10
109876543210
Years After Implant
1 yr 2 yr 3 yr 4 yr 5 yr at 63 mo
% 99.2 99.2 99.2 99.2 99.2 99.2# 612 337 173 98 63 54
Effective Sample Size
Ventricular Placement Product Surveillance Registry Results Qualifying Complications 3 Total
Number of Leads Enrolled in Study 475 Impedance Out of Range 1
Cumulative Months of Follow-Up 15,455 Lead Dislodgement 2
Number of Leads Active in Study 290
90
100
80
70
60
50
40
30
20
10
109876543210
Years After Implant
1 yr 2 yr 3 yr 4 yr 5 yr at 69 mo
% 99.5 99.5 99.5 99.5 99.5 99.5# 388 229 142 90 63 49
Effective Sample Size
Lead
Sur
viva
l Pro
babi
lity
(%)
Lead
Sur
viva
l Pro
babi
lity
(%)
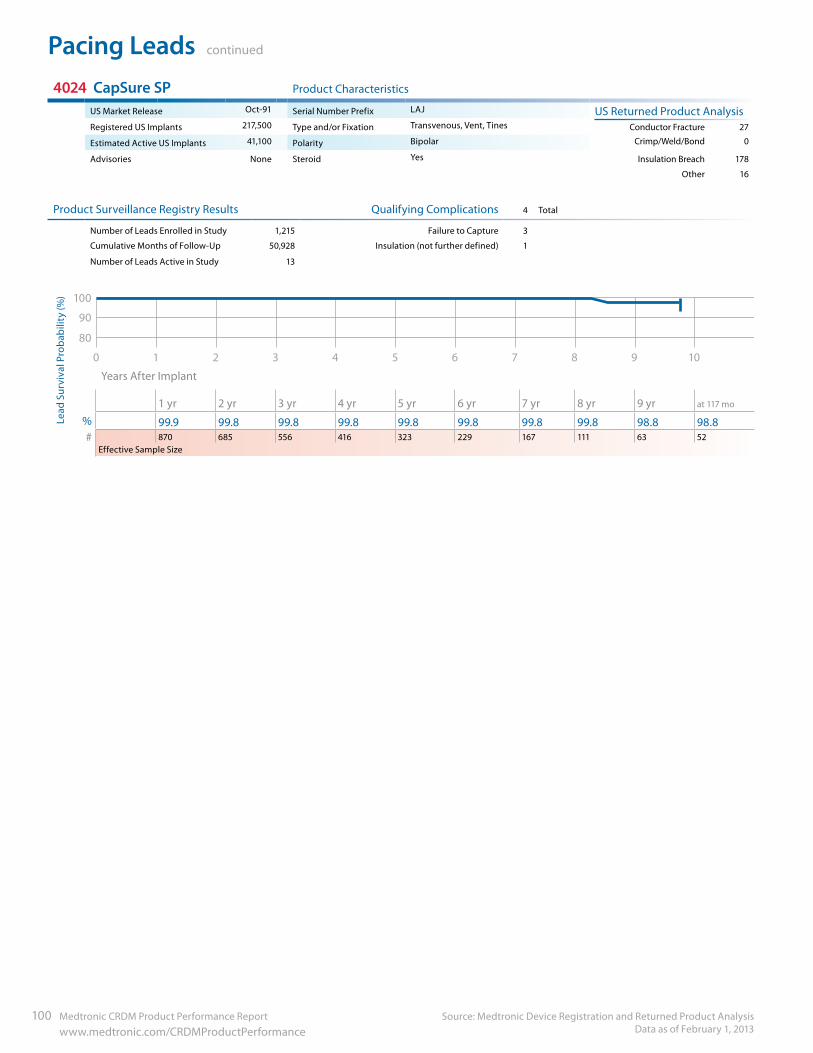
Pacing Leads continued
Source: Medtronic Device Registration and Returned Product Analysis Data as of February 1, 2013
100 Medtronic CRDM Product Performance Report www.medtronic.com/CRDMProductPerformance
4024 CapSure SP Product Characteristics
US Market Release Oct-91 Serial Number Prefix LAJ US Returned Product AnalysisRegistered US Implants 217,500 Type and/or Fixation Transvenous, Vent, Tines Conductor Fracture 27
Estimated Active US Implants 41,100 Polarity Bipolar Crimp/Weld/Bond 0
Advisories None Steroid Yes Insulation Breach 178
Other 16
Product Surveillance Registry Results Qualifying Complications 4 Total
Number of Leads Enrolled in Study 1,215 Failure to Capture 3
Cumulative Months of Follow-Up 50,928 Insulation (not further defined) 1
Number of Leads Active in Study 13
90
100
80
109876543210
Years After Implant
1 yr 2 yr 3 yr 4 yr 5 yr 6 yr 7 yr 8 yr 9 yr at 117 mo
% 99.9 99.8 99.8 99.8 99.8 99.8 99.8 99.8 98.8 98.8# 870 685 556 416 323 229 167 111 63 52
Effective Sample Size
Lead
Sur
viva
l Pro
babi
lity
(%)
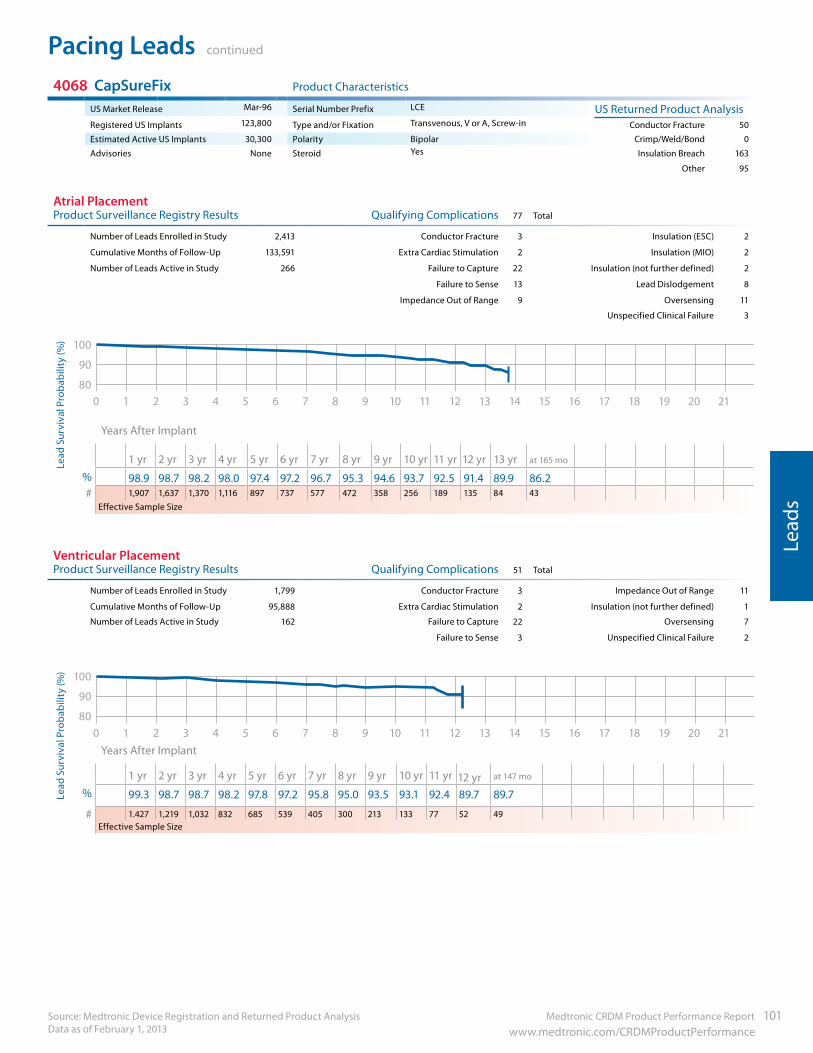
Medtronic CRDM Product Performance Report 101 www.medtronic.com/CRDMProductPerformance
Pacing Leads continued
Source: Medtronic Device Registration and Returned Product Analysis Data as of February 1, 2013
Lead
s
4068 CapSureFix Product Characteristics
US Market Release Mar-96 Serial Number Prefix LCE US Returned Product AnalysisRegistered US Implants 123,800 Type and/or Fixation Transvenous, V or A, Screw-in Conductor Fracture 50
Estimated Active US Implants 30,300 Polarity Bipolar Crimp/Weld/Bond 0
Advisories None Steroid Yes Insulation Breach 163
Other 95
Atrial Placement Product Surveillance Registry Results Qualifying Complications 77 Total
Number of Leads Enrolled in Study 2,413 Conductor Fracture 3 Insulation (ESC) 2
Cumulative Months of Follow-Up 133,591 Extra Cardiac Stimulation 2 Insulation (MIO) 2
Number of Leads Active in Study 266 Failure to Capture 22 Insulation (not further defined) 2
Failure to Sense 13 Lead Dislodgement 8
Impedance Out of Range 9 Oversensing 11
Unspecified Clinical Failure 3
90
100
8020181614121086420 21191715131197531
Years After Implant
1 yr 2 yr 3 yr 4 yr 5 yr 6 yr 7 yr 8 yr 9 yr 10 yr 11 yr 12 yr 13 yr at 165 mo
% 98.9 98.7 98.2 98.0 97.4 97.2 96.7 95.3 94.6 93.7 92.5 91.4 89.9 86.2 # 1,907 1,637 1,370 1,116 897 737 577 472 358 256 189 135 84 43
Effective Sample Size
Ventricular Placement Product Surveillance Registry Results Qualifying Complications 51 Total
Number of Leads Enrolled in Study 1,799 Conductor Fracture 3 Impedance Out of Range 11
Cumulative Months of Follow-Up 95,888 Extra Cardiac Stimulation 2 Insulation (not further defined) 1
Number of Leads Active in Study 162 Failure to Capture 22 Oversensing 7
Failure to Sense 3 Unspecified Clinical Failure 2
90
100
8020181614121086420 21191715131197531
Years After Implant
1 yr 2 yr 3 yr 4 yr 5 yr 6 yr 7 yr 8 yr 9 yr 10 yr 11 yr 12 yr at 147 mo
% 99.3 98.7 98.7 98.2 97.8 97.2 95.8 95.0 93.5 93.1 92.4 89.7 89.7
# 1.427 1,219 1,032 832 685 539 405 300 213 133 77 52 49Effective Sample Size
Lead
Sur
viva
l Pro
babi
lity
(%)
Lead
Sur
viva
l Pro
babi
lity
(%)
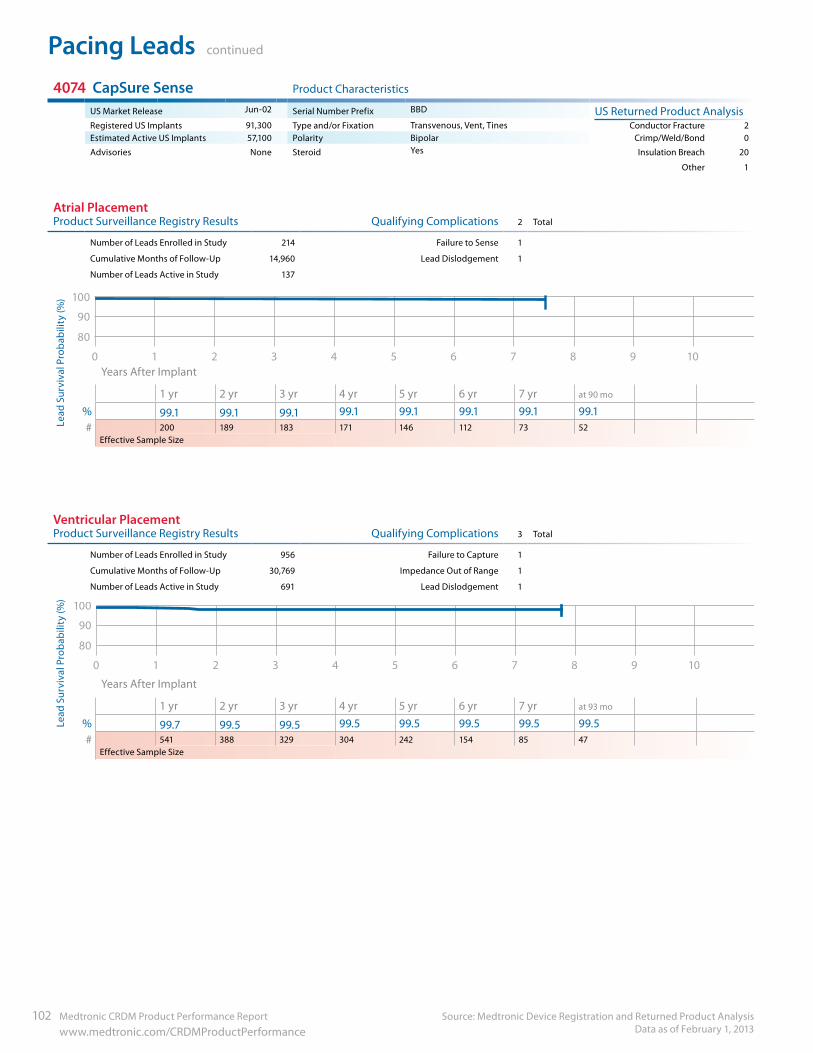
Pacing Leads continued
Source: Medtronic Device Registration and Returned Product Analysis Data as of February 1, 2013
102 Medtronic CRDM Product Performance Report www.medtronic.com/CRDMProductPerformance
4074 CapSure Sense Product Characteristics
US Market Release Jun-02 Serial Number Prefix BBD US Returned Product AnalysisRegistered US Implants 91,300 Type and/or Fixation Transvenous, Vent, Tines Conductor Fracture 2Estimated Active US Implants 57,100 Polarity Bipolar Crimp/Weld/Bond 0
Advisories None Steroid Yes Insulation Breach 20
Other 1
Atrial Placement Product Surveillance Registry Results Qualifying Complications 2 Total
Number of Leads Enrolled in Study 214 Failure to Sense 1
Cumulative Months of Follow-Up 14,960 Lead Dislodgement 1
Number of Leads Active in Study 137
90
100
80
109876543210 Years After Implant
1 yr 2 yr 3 yr 4 yr 5 yr 6 yr 7 yr at 90 mo
% 99.1 99.1 99.1 99.1 99.1 99.1 99.1 99.1# 200 189 183 171 146 112 73 52
Effective Sample Size
Ventricular Placement Product Surveillance Registry Results Qualifying Complications 3 Total
Number of Leads Enrolled in Study 956 Failure to Capture 1
Cumulative Months of Follow-Up 30,769 Impedance Out of Range 1
Number of Leads Active in Study 691 Lead Dislodgement 1
90
100
80
109876543210
Years After Implant
1 yr 2 yr 3 yr 4 yr 5 yr 6 yr 7 yr at 93 mo
% 99.7 99.5 99.5 99.5 99.5 99.5 99.5 99.5# 541 388 329 304 242 154 85 47
Effective Sample Size
Lead
Sur
viva
l Pro
babi
lity
(%)
Lead
Sur
viva
l Pro
babi
lity
(%)
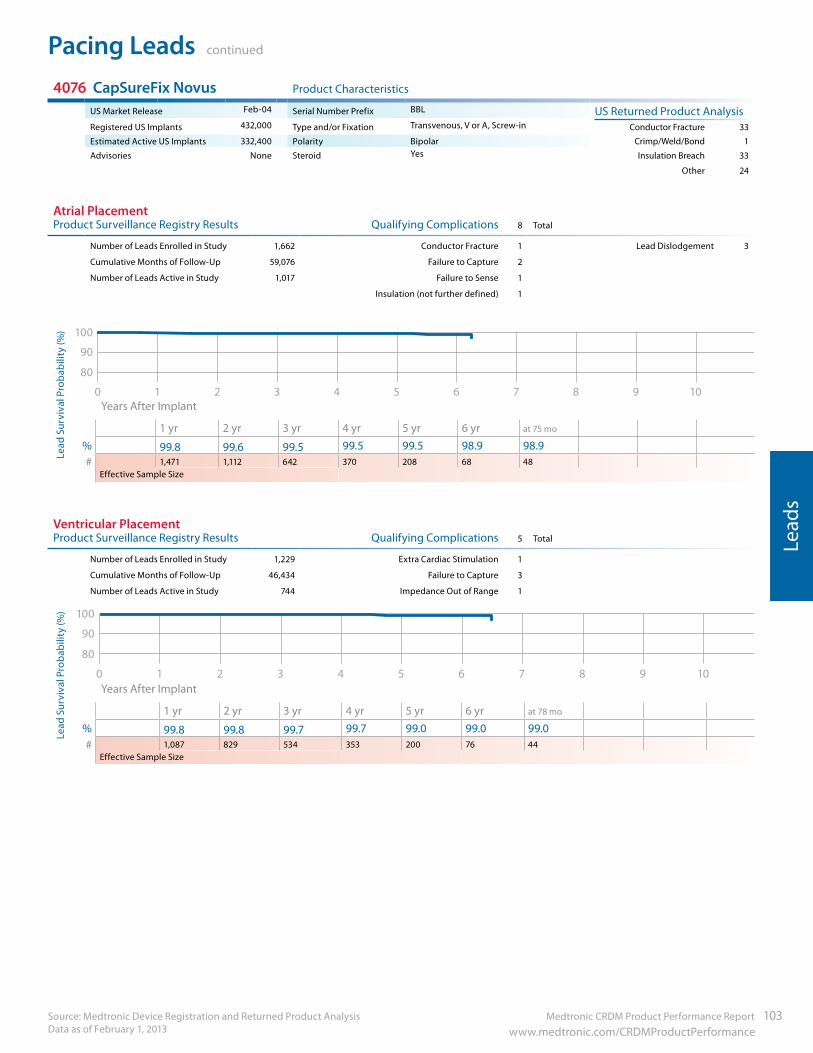
Medtronic CRDM Product Performance Report 103 www.medtronic.com/CRDMProductPerformance
Pacing Leads continued
Source: Medtronic Device Registration and Returned Product Analysis Data as of February 1, 2013
Lead
s
4076 CapSureFix Novus Product Characteristics
US Market Release Feb-04 Serial Number Prefix BBL US Returned Product AnalysisRegistered US Implants 432,000 Type and/or Fixation Transvenous, V or A, Screw-in Conductor Fracture 33
Estimated Active US Implants 332,400 Polarity Bipolar Crimp/Weld/Bond 1
Advisories None Steroid Yes Insulation Breach 33
Other 24
Atrial Placement Product Surveillance Registry Results Qualifying Complications 8 Total
Number of Leads Enrolled in Study 1,662 Conductor Fracture 1 Lead Dislodgement 3
Cumulative Months of Follow-Up 59,076 Failure to Capture 2
Number of Leads Active in Study 1,017 Failure to Sense 1
Insulation (not further defined) 1
90
100
80
109876543210 Years After Implant
1 yr 2 yr 3 yr 4 yr 5 yr 6 yr at 75 mo
% 99.8 99.6 99.5 99.5 99.5 98.9 98.9# 1,471 1,112 642 370 208 68 48
Effective Sample Size
Ventricular Placement Product Surveillance Registry Results Qualifying Complications 5 Total
Number of Leads Enrolled in Study 1,229 Extra Cardiac Stimulation 1
Cumulative Months of Follow-Up 46,434 Failure to Capture 3
Number of Leads Active in Study 744 Impedance Out of Range 1
90
100
80
109876543210 Years After Implant
1 yr 2 yr 3 yr 4 yr 5 yr 6 yr at 78 mo
% 99.8 99.8 99.7 99.7 99.0 99.0 99.0# 1,087 829 534 353 200 76 44
Effective Sample Size
Lead
Sur
viva
l Pro
babi
lity
(%)
Lead
Sur
viva
l Pro
babi
lity
(%)
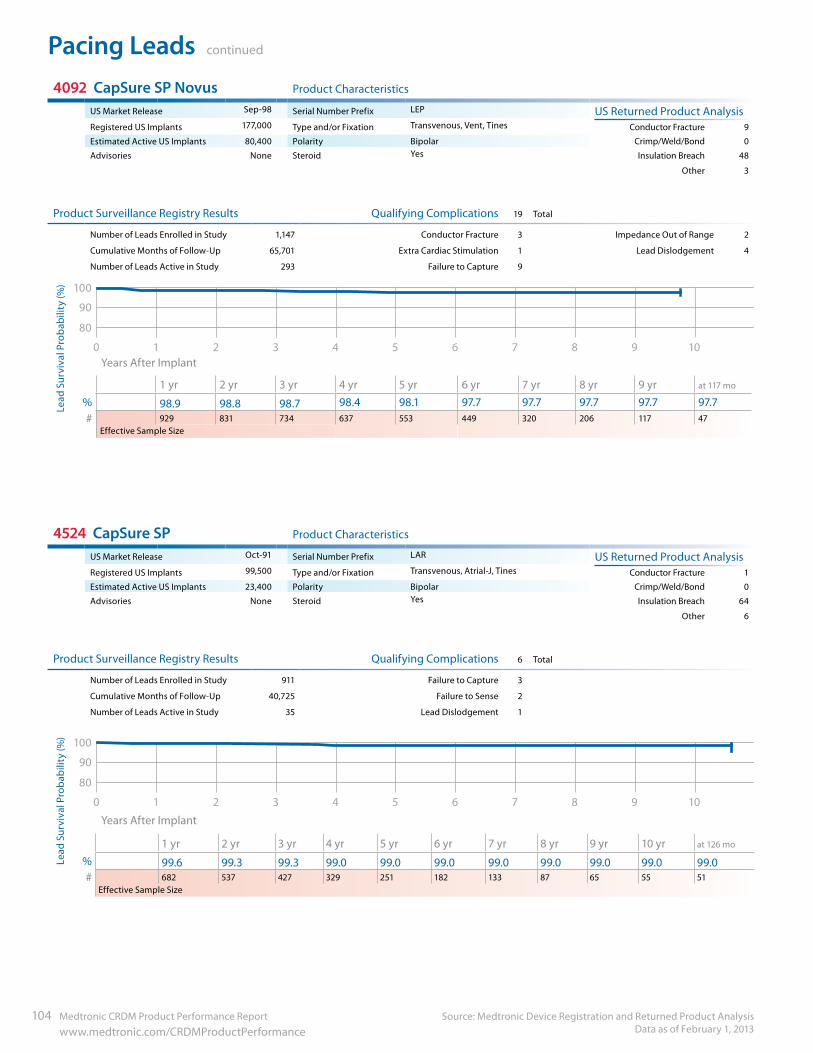
Pacing Leads continued
Source: Medtronic Device Registration and Returned Product Analysis Data as of February 1, 2013
104 Medtronic CRDM Product Performance Report www.medtronic.com/CRDMProductPerformance
4092 CapSure SP Novus Product Characteristics
US Market Release Sep-98 Serial Number Prefix LEP US Returned Product AnalysisRegistered US Implants 177,000 Type and/or Fixation Transvenous, Vent, Tines Conductor Fracture 9
Estimated Active US Implants 80,400 Polarity Bipolar Crimp/Weld/Bond 0
Advisories None Steroid Yes Insulation Breach 48
Other 3
Product Surveillance Registry Results Qualifying Complications 19 Total
Number of Leads Enrolled in Study 1,147 Conductor Fracture 3 Impedance Out of Range 2
Cumulative Months of Follow-Up 65,701 Extra Cardiac Stimulation 1 Lead Dislodgement 4
Number of Leads Active in Study 293 Failure to Capture 9
90
100
80
109876543210 Years After Implant
1 yr 2 yr 3 yr 4 yr 5 yr 6 yr 7 yr 8 yr 9 yr at 117 mo
% 98.9 98.8 98.7 98.4 98.1 97.7 97.7 97.7 97.7 97.7# 929 831 734 637 553 449 320 206 117 47
Effective Sample Size
4524 CapSure SP Product Characteristics
US Market Release Oct-91 Serial Number Prefix LAR US Returned Product AnalysisRegistered US Implants 99,500 Type and/or Fixation Transvenous, Atrial-J, Tines Conductor Fracture 1
Estimated Active US Implants 23,400 Polarity Bipolar Crimp/Weld/Bond 0
Advisories None Steroid Yes Insulation Breach 64
Other 6
Product Surveillance Registry Results Qualifying Complications 6 Total
Number of Leads Enrolled in Study 911 Failure to Capture 3
Cumulative Months of Follow-Up 40,725 Failure to Sense 2
Number of Leads Active in Study 35 Lead Dislodgement 1
90
100
80
109876543210
Years After Implant
1 yr 2 yr 3 yr 4 yr 5 yr 6 yr 7 yr 8 yr 9 yr 10 yr at 126 mo
% 99.6 99.3 99.3 99.0 99.0 99.0 99.0 99.0 99.0 99.0 99.0# 682 537 427 329 251 182 133 87 65 55 51
Effective Sample Size
Lead
Sur
viva
l Pro
babi
lity
(%)
Lead
Sur
viva
l Pro
babi
lity
(%)
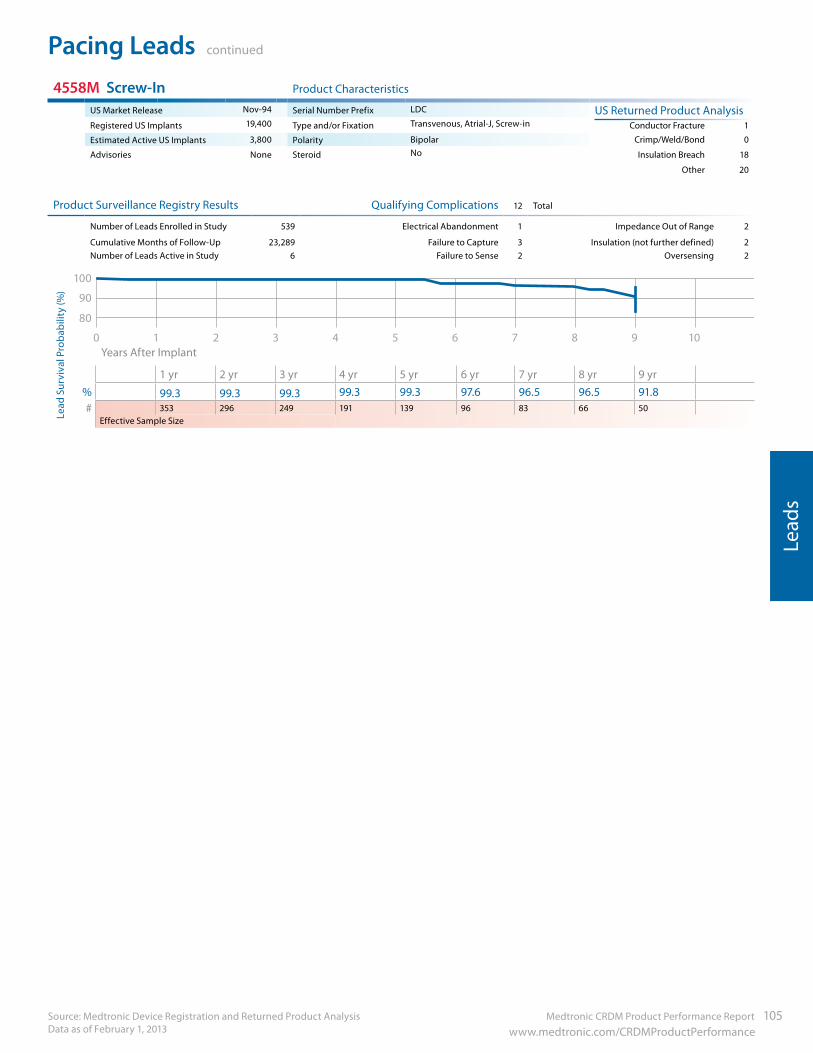
Medtronic CRDM Product Performance Report 105 www.medtronic.com/CRDMProductPerformance
Pacing Leads continued
Source: Medtronic Device Registration and Returned Product Analysis Data as of February 1, 2013
Lead
s
4558M Screw-In Product Characteristics
US Market Release Nov-94 Serial Number Prefix LDC US Returned Product AnalysisRegistered US Implants 19,400 Type and/or Fixation Transvenous, Atrial-J, Screw-in Conductor Fracture 1
Estimated Active US Implants 3,800 Polarity Bipolar Crimp/Weld/Bond 0
Advisories None Steroid No Insulation Breach 18
Other 20
Product Surveillance Registry Results Qualifying Complications 12 Total
Number of Leads Enrolled in Study 539 Electrical Abandonment 1 Impedance Out of Range 2
Cumulative Months of Follow-Up 23,289 Failure to Capture 3 Insulation (not further defined) 2Number of Leads Active in Study 6 Failure to Sense 2 Oversensing 2
90
100
80
109876543210 Years After Implant
1 yr 2 yr 3 yr 4 yr 5 yr 6 yr 7 yr 8 yr 9 yr% 99.3 99.3 99.3 99.3 99.3 97.6 96.5 96.5 91.8# 353 296 249 191 139 96 83 66 50
Effective Sample SizeLead
Sur
viva
l Pro
babi
lity
(%)
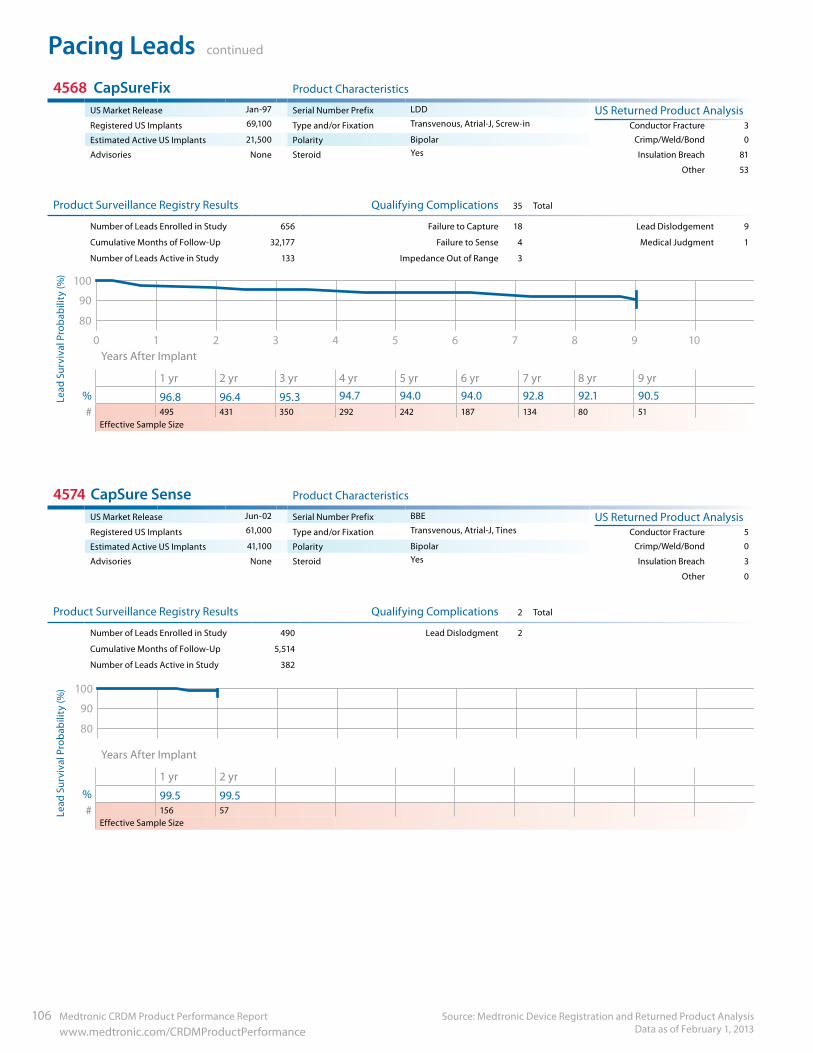
Pacing Leads continued
Source: Medtronic Device Registration and Returned Product Analysis Data as of February 1, 2013
106 Medtronic CRDM Product Performance Report www.medtronic.com/CRDMProductPerformance
4568 CapSureFix Product Characteristics
US Market Release Jan-97 Serial Number Prefix LDD US Returned Product AnalysisRegistered US Implants 69,100 Type and/or Fixation Transvenous, Atrial-J, Screw-in Conductor Fracture 3
Estimated Active US Implants 21,500 Polarity Bipolar Crimp/Weld/Bond 0
Advisories None Steroid Yes Insulation Breach 81
Other 53
Product Surveillance Registry Results Qualifying Complications 35 Total
Number of Leads Enrolled in Study 656 Failure to Capture 18 Lead Dislodgement 9
Cumulative Months of Follow-Up 32,177 Failure to Sense 4 Medical Judgment 1
Number of Leads Active in Study 133 Impedance Out of Range 3
90
100
80
109876543210 Years After Implant
1 yr 2 yr 3 yr 4 yr 5 yr 6 yr 7 yr 8 yr 9 yr% 96.8 96.4 95.3 94.7 94.0 94.0 92.8 92.1 90.5# 495 431 350 292 242 187 134 80 51
Effective Sample Size
4574 CapSure Sense Product Characteristics
US Market Release Jun-02 Serial Number Prefix BBE US Returned Product AnalysisRegistered US Implants 61,000 Type and/or Fixation Transvenous, Atrial-J, Tines Conductor Fracture 5
Estimated Active US Implants 41,100 Polarity Bipolar Crimp/Weld/Bond 0
Advisories None Steroid Yes Insulation Breach 3
Other 0
Product Surveillance Registry Results Qualifying Complications 2 Total
Number of Leads Enrolled in Study 490 Lead Dislodgment 2
Cumulative Months of Follow-Up 5,514
Number of Leads Active in Study 382
90
100
80
109876543210 Years After Implant
1 yr 2 yr% 99.5 99.5# 156 57
Effective Sample Size
Lead
Sur
viva
l Pro
babi
lity
(%)
Lead
Sur
viva
l Pro
babi
lity
(%)
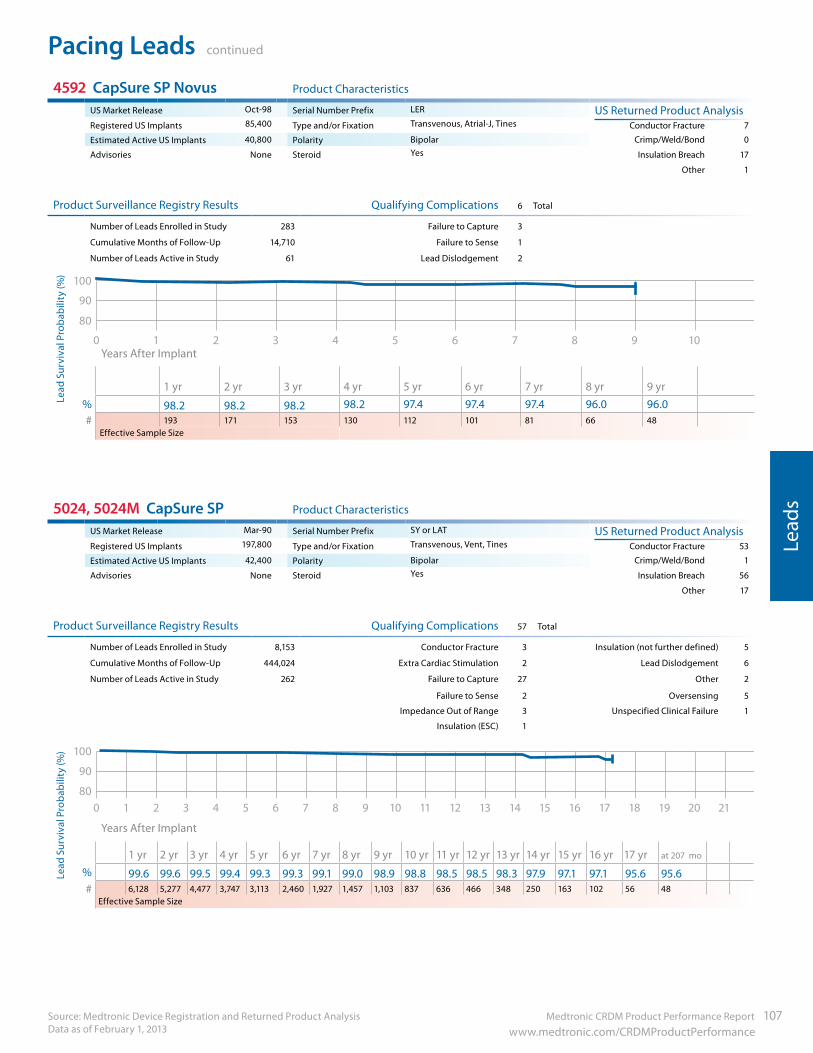
Medtronic CRDM Product Performance Report 107 www.medtronic.com/CRDMProductPerformance
Pacing Leads continued
Source: Medtronic Device Registration and Returned Product Analysis Data as of February 1, 2013
Lead
s
4592 CapSure SP Novus Product Characteristics
US Market Release Oct-98 Serial Number Prefix LER US Returned Product AnalysisRegistered US Implants 85,400 Type and/or Fixation Transvenous, Atrial-J, Tines Conductor Fracture 7
Estimated Active US Implants 40,800 Polarity Bipolar Crimp/Weld/Bond 0
Advisories None Steroid Yes Insulation Breach 17
Other 1
Product Surveillance Registry Results Qualifying Complications 6 Total
Number of Leads Enrolled in Study 283 Failure to Capture 3
Cumulative Months of Follow-Up 14,710 Failure to Sense 1
Number of Leads Active in Study 61 Lead Dislodgement 2
90
100
80
109876543210 Years After Implant
1 yr 2 yr 3 yr 4 yr 5 yr 6 yr 7 yr 8 yr 9 yr% 98.2 98.2 98.2 98.2 97.4 97.4 97.4 96.0 96.0# 193 171 153 130 112 101 81 66 48
Effective Sample Size
5024, 5024M CapSure SP Product Characteristics
US Market Release Mar-90 Serial Number Prefix SY or LAT US Returned Product AnalysisRegistered US Implants 197,800 Type and/or Fixation Transvenous, Vent, Tines Conductor Fracture 53
Estimated Active US Implants 42,400 Polarity Bipolar Crimp/Weld/Bond 1
Advisories None Steroid Yes Insulation Breach 56
Other 17
Product Surveillance Registry Results Qualifying Complications 57 Total
Number of Leads Enrolled in Study 8,153 Conductor Fracture 3 Insulation (not further defined) 5
Cumulative Months of Follow-Up 444,024 Extra Cardiac Stimulation 2 Lead Dislodgement 6
Number of Leads Active in Study 262 Failure to Capture 27 Other 2
Failure to Sense 2 Oversensing 5
Impedance Out of Range 3 Unspecified Clinical Failure 1
Insulation (ESC) 1
90
100
8020181614121086420 21191715131197531
Years After Implant
1 yr 2 yr 3 yr 4 yr 5 yr 6 yr 7 yr 8 yr 9 yr 10 yr 11 yr 12 yr 13 yr 14 yr 15 yr 16 yr 17 yr at 207 mo
% 99.6 99.6 99.5 99.4 99.3 99.3 99.1 99.0 98.9 98.8 98.5 98.5 98.3 97.9 97.1 97.1 95.6 95.6# 6,128 5,277 4,477 3,747 3,113 2,460 1,927 1,457 1,103 837 636 466 348 250 163 102 56 48
Effective Sample Size
Lead
Sur
viva
l Pro
babi
lity
(%)
Lead
Sur
viva
l Pro
babi
lity
(%)
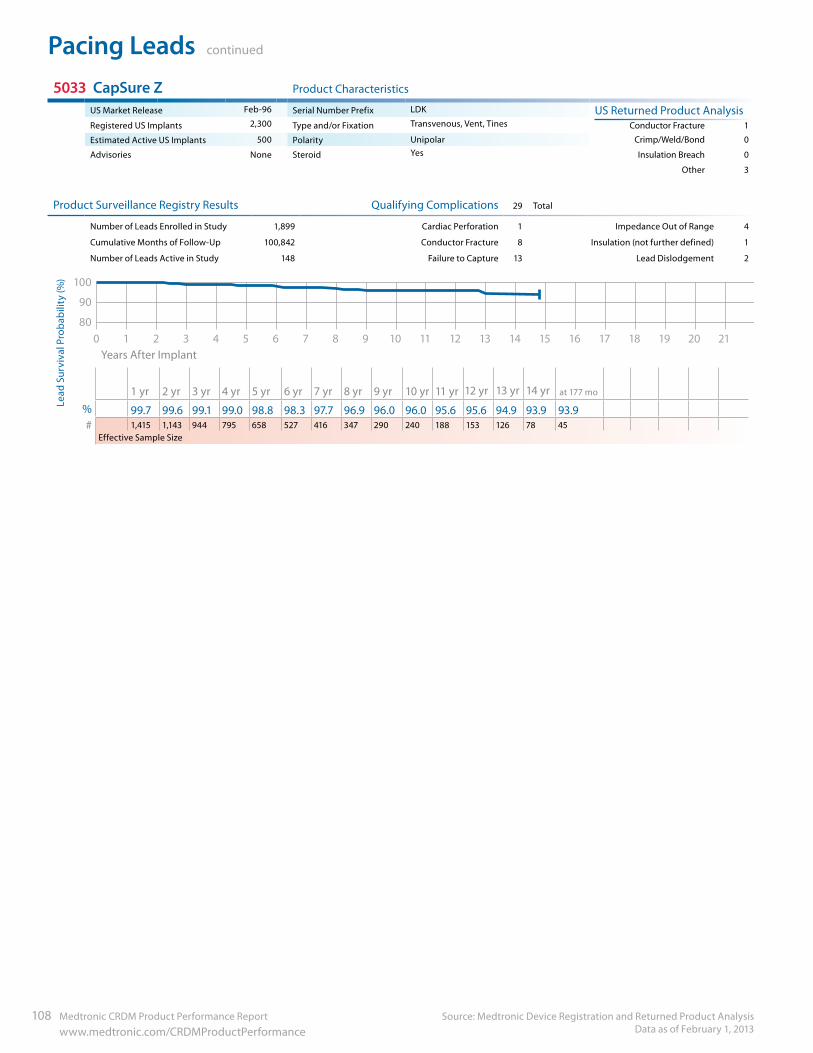
Pacing Leads continued
Source: Medtronic Device Registration and Returned Product Analysis Data as of February 1, 2013
108 Medtronic CRDM Product Performance Report www.medtronic.com/CRDMProductPerformance
5033 CapSure Z Product Characteristics
US Market Release Feb-96 Serial Number Prefix LDK US Returned Product AnalysisRegistered US Implants 2,300 Type and/or Fixation Transvenous, Vent, Tines Conductor Fracture 1
Estimated Active US Implants 500 Polarity Unipolar Crimp/Weld/Bond 0
Advisories None Steroid Yes Insulation Breach 0
Other 3
Product Surveillance Registry Results Qualifying Complications 29 Total
Number of Leads Enrolled in Study 1,899 Cardiac Perforation 1 Impedance Out of Range 4
Cumulative Months of Follow-Up 100,842 Conductor Fracture 8 Insulation (not further defined) 1
Number of Leads Active in Study 148 Failure to Capture 13 Lead Dislodgement 2
90
100
8020181614121086420 21191715131197531
Years After Implant
1 yr 2 yr 3 yr 4 yr 5 yr 6 yr 7 yr 8 yr 9 yr 10 yr 11 yr 12 yr 13 yr 14 yr at 177 mo
% 99.7 99.6 99.1 99.0 98.8 98.3 97.7 96.9 96.0 96.0 95.6 95.6 94.9 93.9 93.9# 1,415 1,143 944 795 658 527 416 347 290 240 188 153 126 78 45
Effective Sample Size
Lead
Sur
viva
l Pro
babi
lity
(%)
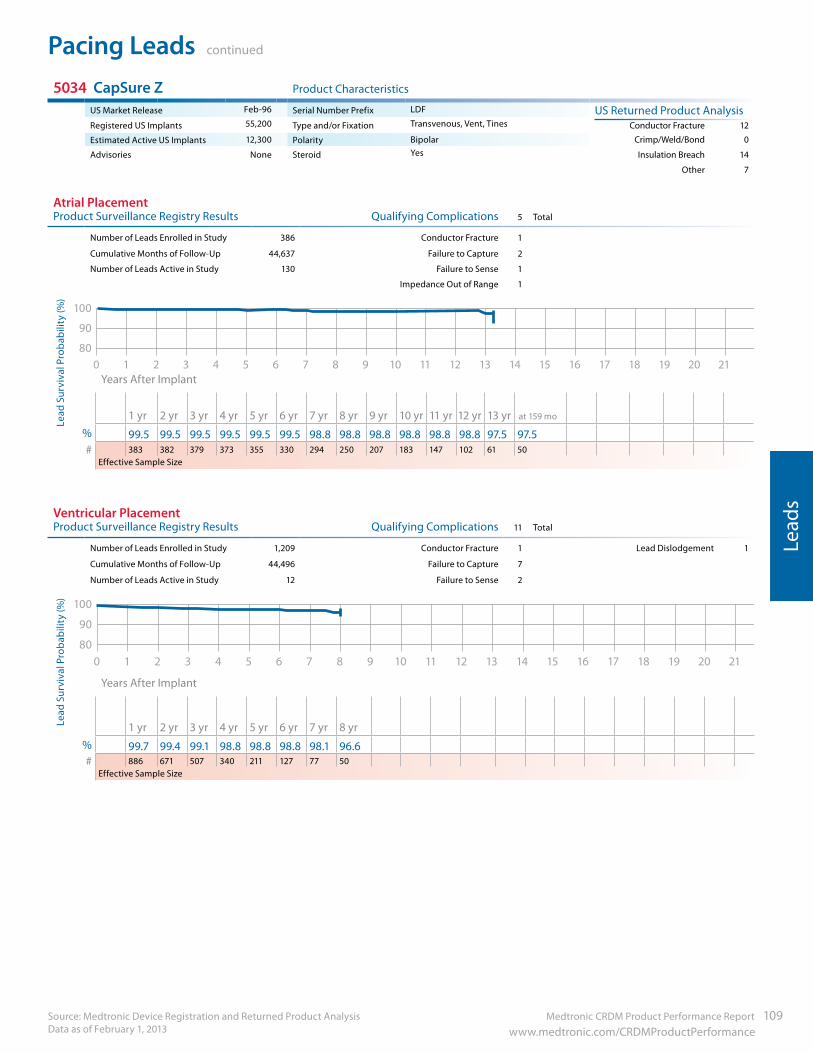
Medtronic CRDM Product Performance Report 109 www.medtronic.com/CRDMProductPerformance
Pacing Leads continued
Source: Medtronic Device Registration and Returned Product Analysis Data as of February 1, 2013
Lead
s
5034 CapSure Z Product Characteristics
US Market Release Feb-96 Serial Number Prefix LDF US Returned Product AnalysisRegistered US Implants 55,200 Type and/or Fixation Transvenous, Vent, Tines Conductor Fracture 12
Estimated Active US Implants 12,300 Polarity Bipolar Crimp/Weld/Bond 0
Advisories None Steroid Yes Insulation Breach 14
Other 7
Atrial Placement Product Surveillance Registry Results Qualifying Complications 5 Total
Number of Leads Enrolled in Study 386 Conductor Fracture 1
Cumulative Months of Follow-Up 44,637 Failure to Capture 2
Number of Leads Active in Study 130 Failure to Sense 1
Impedance Out of Range 1
90
100
8020181614121086420 21191715131197531
Years After Implant
1 yr 2 yr 3 yr 4 yr 5 yr 6 yr 7 yr 8 yr 9 yr 10 yr 11 yr 12 yr 13 yr at 159 mo
% 99.5 99.5 99.5 99.5 99.5 99.5 98.8 98.8 98.8 98.8 98.8 98.8 97.5 97.5# 383 382 379 373 355 330 294 250 207 183 147 102 61 50
Effective Sample Size
Ventricular Placement Product Surveillance Registry Results Qualifying Complications 11 Total
Number of Leads Enrolled in Study 1,209 Conductor Fracture 1 Lead Dislodgement 1
Cumulative Months of Follow-Up 44,496 Failure to Capture 7
Number of Leads Active in Study 12 Failure to Sense 2
90
100
8020181614121086420 21191715131197531
Years After Implant
1 yr 2 yr 3 yr 4 yr 5 yr 6 yr 7 yr 8 yr% 99.7 99.4 99.1 98.8 98.8 98.8 98.1 96.6# 886 671 507 340 211 127 77 50
Effective Sample Size
Lead
Sur
viva
l Pro
babi
lity
(%)
Lead
Sur
viva
l Pro
babi
lity
(%)
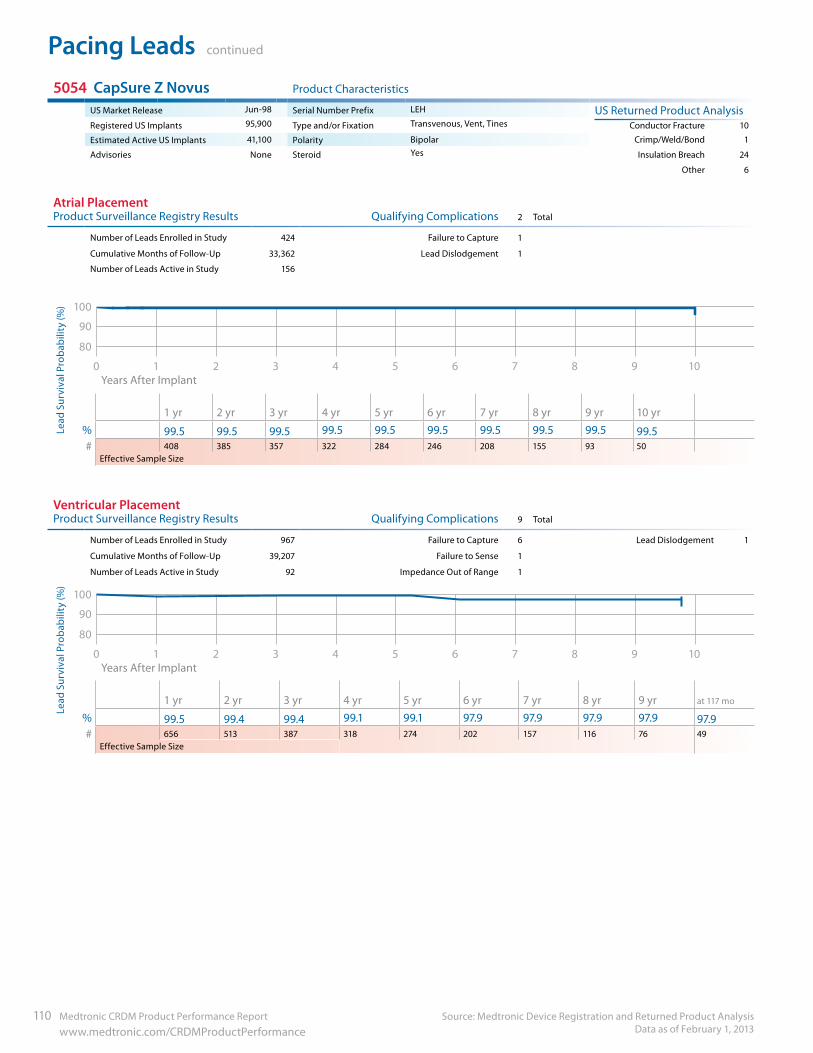
Pacing Leads continued
Source: Medtronic Device Registration and Returned Product Analysis Data as of February 1, 2013
110 Medtronic CRDM Product Performance Report www.medtronic.com/CRDMProductPerformance
5054 CapSure Z Novus Product Characteristics
US Market Release Jun-98 Serial Number Prefix LEH US Returned Product AnalysisRegistered US Implants 95,900 Type and/or Fixation Transvenous, Vent, Tines Conductor Fracture 10
Estimated Active US Implants 41,100 Polarity Bipolar Crimp/Weld/Bond 1
Advisories None Steroid Yes Insulation Breach 24
Other 6
Atrial Placement Product Surveillance Registry Results Qualifying Complications 2 Total
Number of Leads Enrolled in Study 424 Failure to Capture 1
Cumulative Months of Follow-Up 33,362 Lead Dislodgement 1
Number of Leads Active in Study 156
90
100
80
109876543210 Years After Implant
1 yr 2 yr 3 yr 4 yr 5 yr 6 yr 7 yr 8 yr 9 yr 10 yr% 99.5 99.5 99.5 99.5 99.5 99.5 99.5 99.5 99.5 99.5# 408 385 357 322 284 246 208 155 93 50
Effective Sample Size
Ventricular Placement Product Surveillance Registry Results Qualifying Complications 9 Total
Number of Leads Enrolled in Study 967 Failure to Capture 6 Lead Dislodgement 1
Cumulative Months of Follow-Up 39,207 Failure to Sense 1
Number of Leads Active in Study 92 Impedance Out of Range 1
90
100
80
109876543210 Years After Implant
1 yr 2 yr 3 yr 4 yr 5 yr 6 yr 7 yr 8 yr 9 yr at 117 mo
% 99.5 99.4 99.4 99.1 99.1 97.9 97.9 97.9 97.9 97.9# 656 513 387 318 274 202 157 116 76 49
Effective Sample Size
Lead
Sur
viva
l Pro
babi
lity
(%)
Lead
Sur
viva
l Pro
babi
lity
(%)
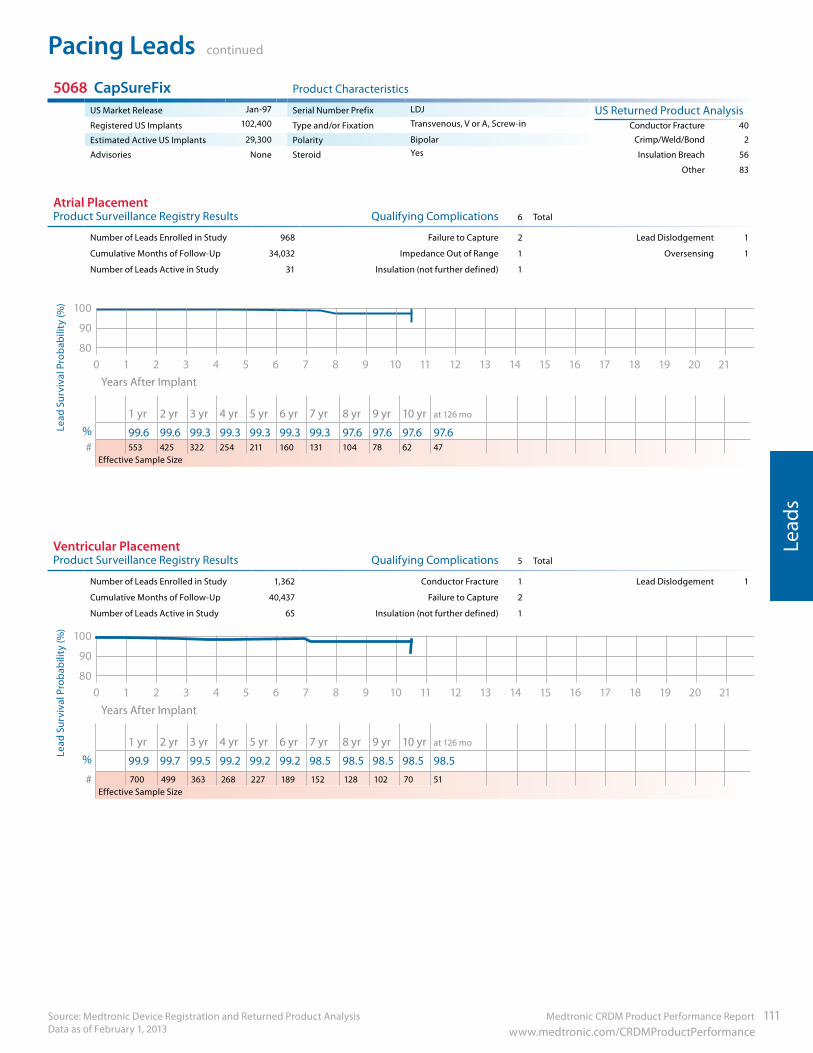
Medtronic CRDM Product Performance Report 111 www.medtronic.com/CRDMProductPerformance
Pacing Leads continued
Source: Medtronic Device Registration and Returned Product Analysis Data as of February 1, 2013
Lead
s
5068 CapSureFix Product Characteristics
US Market Release Jan-97 Serial Number Prefix LDJ US Returned Product AnalysisRegistered US Implants 102,400 Type and/or Fixation Transvenous, V or A, Screw-in Conductor Fracture 40
Estimated Active US Implants 29,300 Polarity Bipolar Crimp/Weld/Bond 2
Advisories None Steroid Yes Insulation Breach 56
Other 83
Atrial Placement Product Surveillance Registry Results Qualifying Complications 6 Total
Number of Leads Enrolled in Study 968 Failure to Capture 2 Lead Dislodgement 1
Cumulative Months of Follow-Up 34,032 Impedance Out of Range 1 Oversensing 1
Number of Leads Active in Study 31 Insulation (not further defined) 1
90
100
8020181614121086420 21191715131197531
Years After Implant
1 yr 2 yr 3 yr 4 yr 5 yr 6 yr 7 yr 8 yr 9 yr 10 yr at 126 mo
% 99.6 99.6 99.3 99.3 99.3 99.3 99.3 97.6 97.6 97.6 97.6# 553 425 322 254 211 160 131 104 78 62 47
Effective Sample Size
Ventricular Placement Product Surveillance Registry Results Qualifying Complications 5 Total
Number of Leads Enrolled in Study 1,362 Conductor Fracture 1 Lead Dislodgement 1
Cumulative Months of Follow-Up 40,437 Failure to Capture 2
Number of Leads Active in Study 65 Insulation (not further defined) 1
90
100
8020181614121086420 21191715131197531
Years After Implant
1 yr 2 yr 3 yr 4 yr 5 yr 6 yr 7 yr 8 yr 9 yr 10 yr at 126 mo
% 99.9 99.7 99.5 99.2 99.2 99.2 98.5 98.5 98.5 98.5 98.5
# 700 499 363 268 227 189 152 128 102 70 51Effective Sample Size
Lead
Sur
viva
l Pro
babi
lity
(%)
Lead
Sur
viva
l Pro
babi
lity
(%)
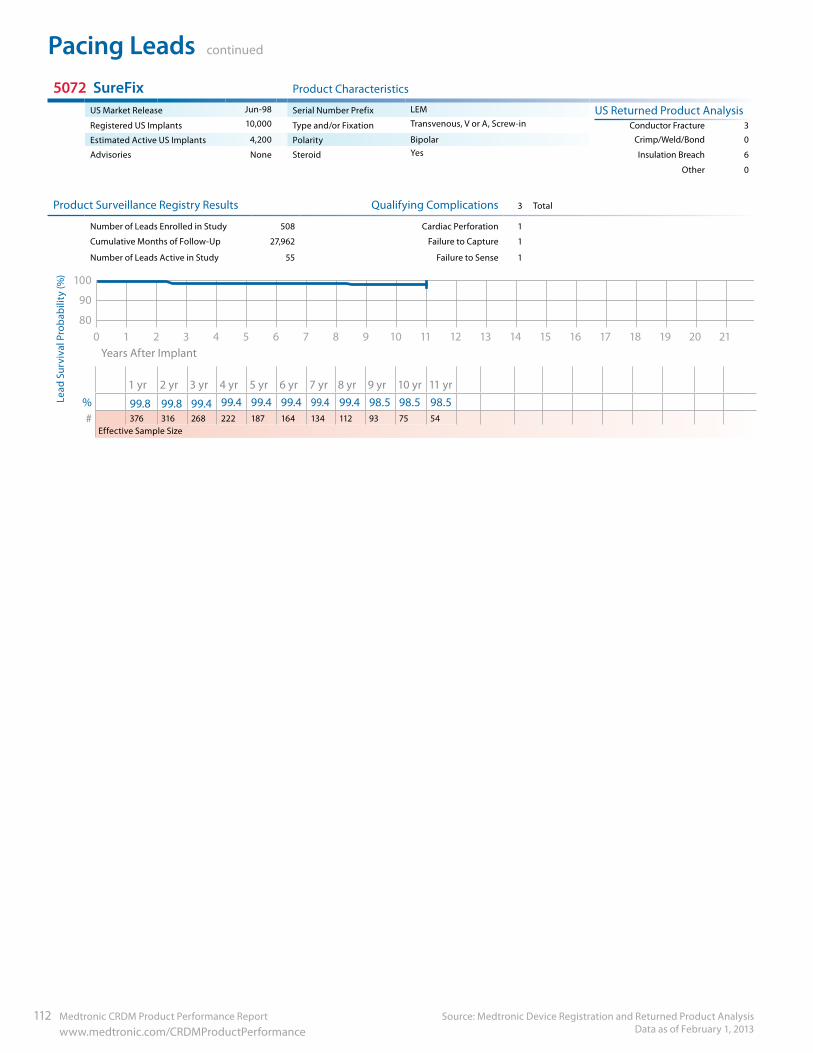
Pacing Leads continued
Source: Medtronic Device Registration and Returned Product Analysis Data as of February 1, 2013
112 Medtronic CRDM Product Performance Report www.medtronic.com/CRDMProductPerformance
5072 SureFix Product Characteristics
US Market Release Jun-98 Serial Number Prefix LEM US Returned Product AnalysisRegistered US Implants 10,000 Type and/or Fixation Transvenous, V or A, Screw-in Conductor Fracture 3
Estimated Active US Implants 4,200 Polarity Bipolar Crimp/Weld/Bond 0
Advisories None Steroid Yes Insulation Breach 6
Other 0
Product Surveillance Registry Results Qualifying Complications 3 Total
Number of Leads Enrolled in Study 508 Cardiac Perforation 1
Cumulative Months of Follow-Up 27,962 Failure to Capture 1
Number of Leads Active in Study 55 Failure to Sense 1
90
100
8020181614121086420 21191715131197531
Years After Implant
1 yr 2 yr 3 yr 4 yr 5 yr 6 yr 7 yr 8 yr 9 yr 10 yr 11 yr% 99.8 99.8 99.4 99.4 99.4 99.4 99.4 99.4 98.5 98.5 98.5# 376 316 268 222 187 164 134 112 93 75 54
Effective Sample Size
Lead
Sur
viva
l Pro
babi
lity
(%)
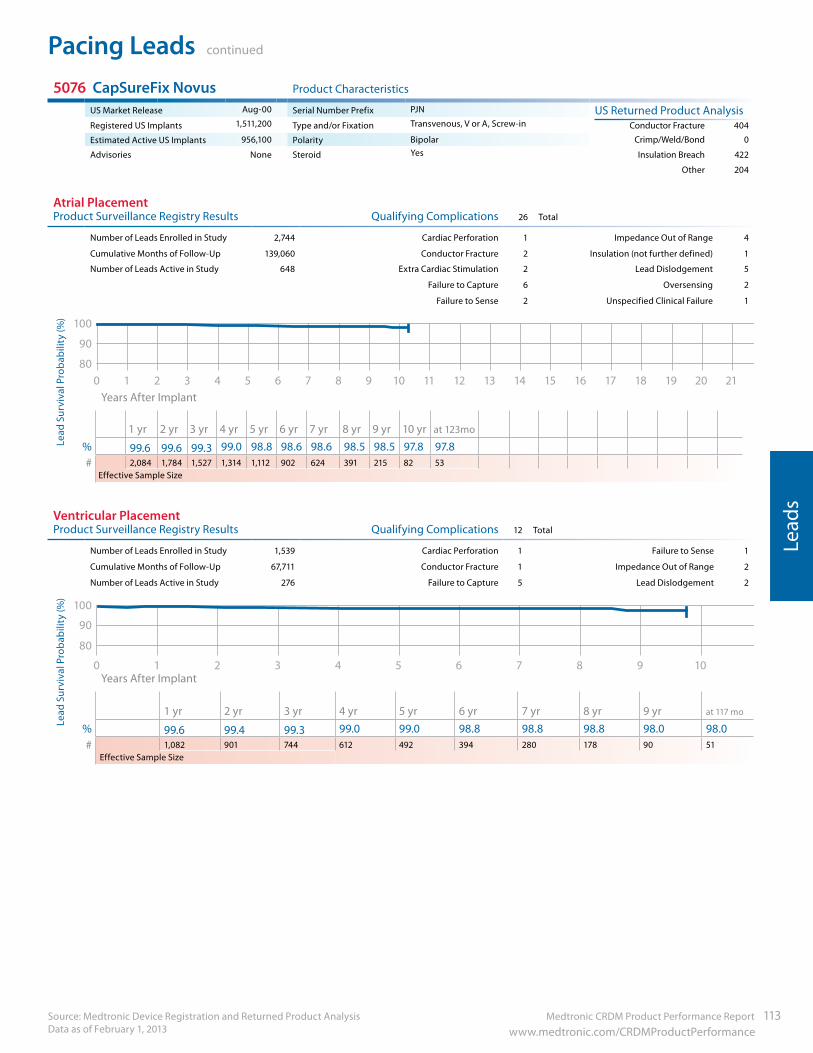
Medtronic CRDM Product Performance Report 113 www.medtronic.com/CRDMProductPerformance
Pacing Leads continued
Source: Medtronic Device Registration and Returned Product Analysis Data as of February 1, 2013
Lead
s
5076 CapSureFix Novus Product Characteristics
US Market Release Aug-00 Serial Number Prefix PJN US Returned Product AnalysisRegistered US Implants 1,511,200 Type and/or Fixation Transvenous, V or A, Screw-in Conductor Fracture 404
Estimated Active US Implants 956,100 Polarity Bipolar Crimp/Weld/Bond 0
Advisories None Steroid Yes Insulation Breach 422
Other 204
Atrial Placement Product Surveillance Registry Results Qualifying Complications 26 Total
Number of Leads Enrolled in Study 2,744 Cardiac Perforation 1 Impedance Out of Range 4
Cumulative Months of Follow-Up 139,060 Conductor Fracture 2 Insulation (not further defined) 1
Number of Leads Active in Study 648 Extra Cardiac Stimulation 2 Lead Dislodgement 5
Failure to Capture 6 Oversensing 2
Failure to Sense 2 Unspecified Clinical Failure 1
90
100
8020181614121086420 21191715131197531
Years After Implant
1 yr 2 yr 3 yr 4 yr 5 yr 6 yr 7 yr 8 yr 9 yr 10 yr at 123mo
% 99.6 99.6 99.3 99.0 98.8 98.6 98.6 98.5 98.5 97.8 97.8# 2,084 1,784 1,527 1,314 1,112 902 624 391 215 82 53
Effective Sample Size
Ventricular Placement Product Surveillance Registry Results Qualifying Complications 12 Total
Number of Leads Enrolled in Study 1,539 Cardiac Perforation 1 Failure to Sense 1
Cumulative Months of Follow-Up 67,711 Conductor Fracture 1 Impedance Out of Range 2
Number of Leads Active in Study 276 Failure to Capture 5 Lead Dislodgement 2
90
100
80
109876543210 Years After Implant
1 yr 2 yr 3 yr 4 yr 5 yr 6 yr 7 yr 8 yr 9 yr at 117 mo
% 99.6 99.4 99.3 99.0 99.0 98.8 98.8 98.8 98.0 98.0# 1,082 901 744 612 492 394 280 178 90 51
Effective Sample Size
Lead
Sur
viva
l Pro
babi
lity
(%)
Lead
Sur
viva
l Pro
babi
lity
(%)
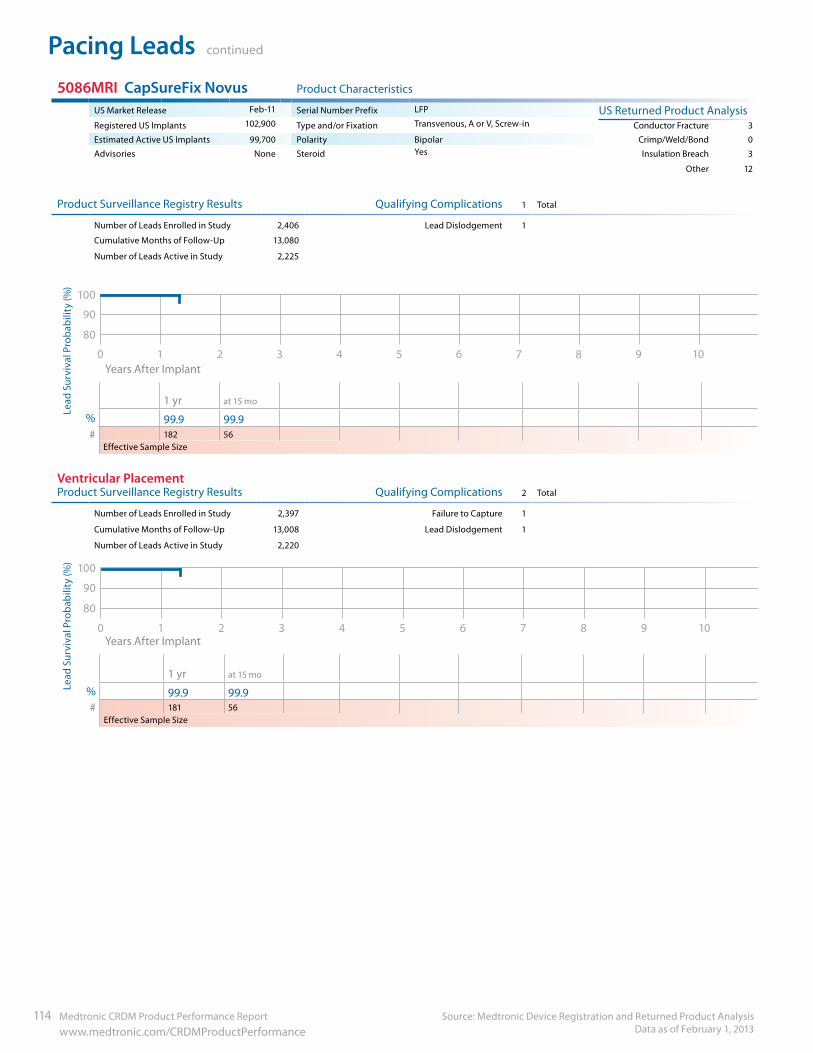
Pacing Leads continued
Source: Medtronic Device Registration and Returned Product Analysis Data as of February 1, 2013
114 Medtronic CRDM Product Performance Report www.medtronic.com/CRDMProductPerformance
5086MRI CapSureFix Novus Product Characteristics
US Market Release Feb-11 Serial Number Prefix LFP US Returned Product AnalysisRegistered US Implants 102,900 Type and/or Fixation Transvenous, A or V, Screw-in Conductor Fracture 3
Estimated Active US Implants 99,700 Polarity Bipolar Crimp/Weld/Bond 0
Advisories None Steroid Yes Insulation Breach 3
Other 12
Product Surveillance Registry Results Qualifying Complications 1 Total
Number of Leads Enrolled in Study 2,406 Lead Dislodgement 1
Cumulative Months of Follow-Up 13,080
Number of Leads Active in Study 2,225
90
100
80
109876543210 Years After Implant
1 yr at 15 mo
% 99.9 99.9# 182 56
Effective Sample Size
Ventricular Placement Product Surveillance Registry Results Qualifying Complications 2 Total
Number of Leads Enrolled in Study 2,397 Failure to Capture 1
Cumulative Months of Follow-Up 13,008 Lead Dislodgement 1
Number of Leads Active in Study 2,220
90
100
80
109876543210 Years After Implant
1 yr at 15 mo
% 99.9 99.9# 181 56
Effective Sample Size
Lead
Sur
viva
l Pro
babi
lity
(%)
Lead
Sur
viva
l Pro
babi
lity
(%)
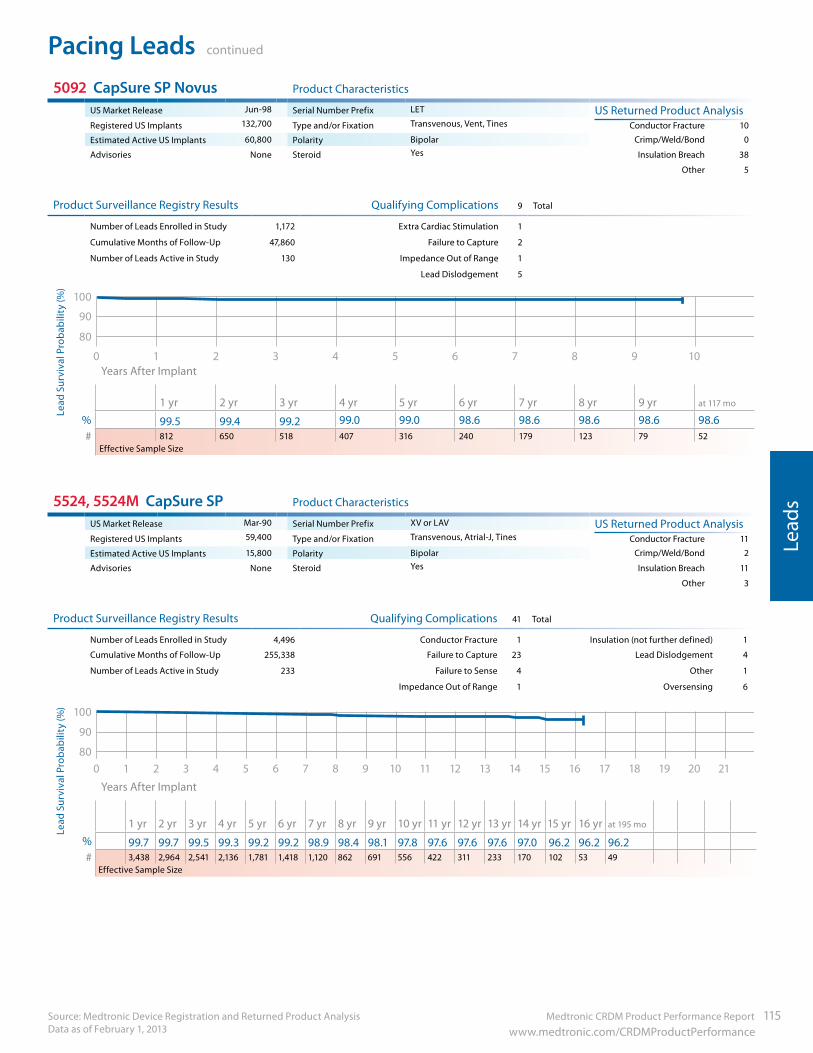
Medtronic CRDM Product Performance Report 115 www.medtronic.com/CRDMProductPerformance
Pacing Leads continued
Source: Medtronic Device Registration and Returned Product Analysis Data as of February 1, 2013
Lead
s
5092 CapSure SP Novus Product Characteristics
US Market Release Jun-98 Serial Number Prefix LET US Returned Product AnalysisRegistered US Implants 132,700 Type and/or Fixation Transvenous, Vent, Tines Conductor Fracture 10
Estimated Active US Implants 60,800 Polarity Bipolar Crimp/Weld/Bond 0
Advisories None Steroid Yes Insulation Breach 38
Other 5
Product Surveillance Registry Results Qualifying Complications 9 Total
Number of Leads Enrolled in Study 1,172 Extra Cardiac Stimulation 1
Cumulative Months of Follow-Up 47,860 Failure to Capture 2
Number of Leads Active in Study 130 Impedance Out of Range 1
Lead Dislodgement 5
90
100
80
109876543210 Years After Implant
1 yr 2 yr 3 yr 4 yr 5 yr 6 yr 7 yr 8 yr 9 yr at 117 mo
% 99.5 99.4 99.2 99.0 99.0 98.6 98.6 98.6 98.6 98.6# 812 650 518 407 316 240 179 123 79 52
Effective Sample Size
5524, 5524M CapSure SP Product Characteristics
US Market Release Mar-90 Serial Number Prefix XV or LAV US Returned Product AnalysisRegistered US Implants 59,400 Type and/or Fixation Transvenous, Atrial-J, Tines Conductor Fracture 11
Estimated Active US Implants 15,800 Polarity Bipolar Crimp/Weld/Bond 2
Advisories None Steroid Yes Insulation Breach 11
Other 3
Product Surveillance Registry Results Qualifying Complications 41 Total
Number of Leads Enrolled in Study 4,496 Conductor Fracture 1 Insulation (not further defined) 1
Cumulative Months of Follow-Up 255,338 Failure to Capture 23 Lead Dislodgement 4
Number of Leads Active in Study 233 Failure to Sense 4 Other 1
Impedance Out of Range 1 Oversensing 6
Survival Estimate of Atrial CapSure SP/CapSure SP Novus Lead 5524/5524M Jan 2010
90
100
80
70
60
50
40
30
20
10
0
20181614121086420 21191715131197531
Years After Implant
1 yr 2 yr 3 yr 4 yr 5 yr 6 yr 7 yr 8 yr 9 yr 10 yr 11 yr 12 yr 13 yr 14 yr 15 yr 16 yr at 195 mo
% 99.7 99.7 99.5 99.3 99.2 99.2 98.9 98.4 98.1 97.8 97.6 97.6 97.6 97.0 96.2 96.2 96.2# 3,438 2,964 2,541 2,136 1,781 1,418 1,120 862 691 556 422 311 233 170 102 53 49
Effective Sample Size
Lead
Sur
viva
l Pro
babi
lity
(%)
Lead
Sur
viva
l Pro
babi
lity
(%)
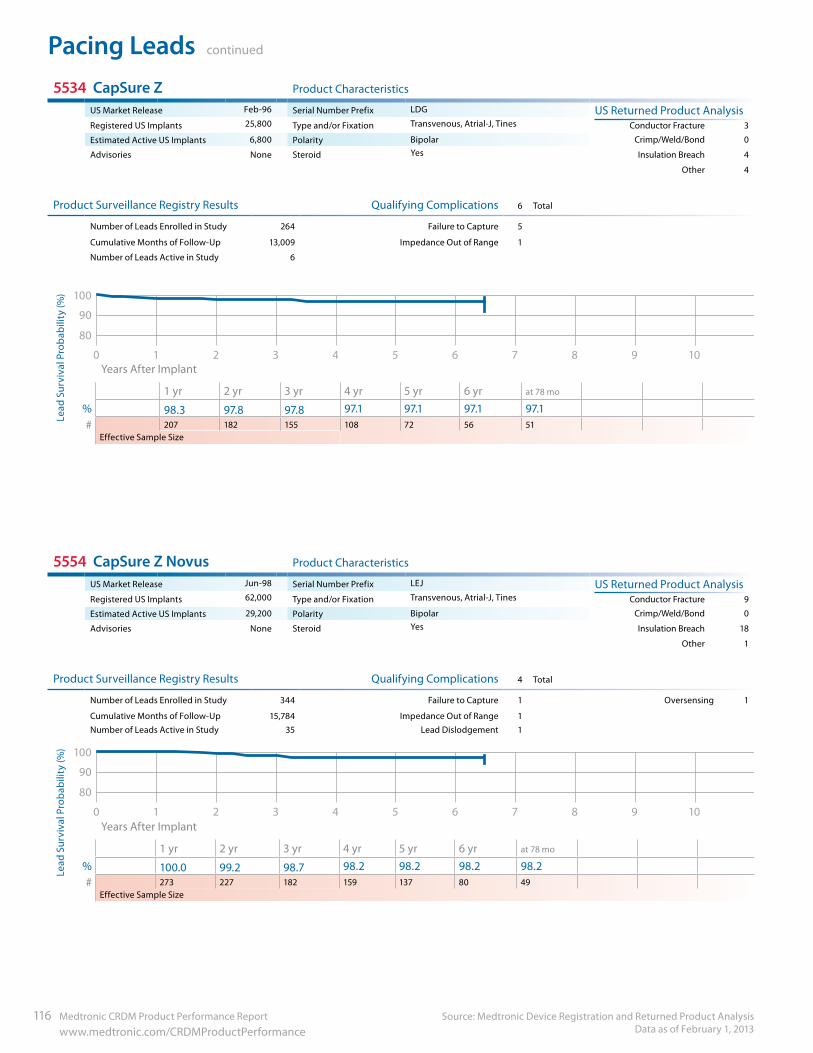
Pacing Leads continued
Source: Medtronic Device Registration and Returned Product Analysis Data as of February 1, 2013
116 Medtronic CRDM Product Performance Report www.medtronic.com/CRDMProductPerformance
5534 CapSure Z Product Characteristics
US Market Release Feb-96 Serial Number Prefix LDG US Returned Product AnalysisRegistered US Implants 25,800 Type and/or Fixation Transvenous, Atrial-J, Tines Conductor Fracture 3
Estimated Active US Implants 6,800 Polarity Bipolar Crimp/Weld/Bond 0
Advisories None Steroid Yes Insulation Breach 4
Other 4
Product Surveillance Registry Results Qualifying Complications 6 Total
Number of Leads Enrolled in Study 264 Failure to Capture 5
Cumulative Months of Follow-Up 13,009 Impedance Out of Range 1
Number of Leads Active in Study 6
90
100
80
109876543210 Years After Implant
1 yr 2 yr 3 yr 4 yr 5 yr 6 yr at 78 mo
% 98.3 97.8 97.8 97.1 97.1 97.1 97.1# 207 182 155 108 72 56 51
Effective Sample Size
5554 CapSure Z Novus Product Characteristics
US Market Release Jun-98 Serial Number Prefix LEJ US Returned Product AnalysisRegistered US Implants 62,000 Type and/or Fixation Transvenous, Atrial-J, Tines Conductor Fracture 9
Estimated Active US Implants 29,200 Polarity Bipolar Crimp/Weld/Bond 0
Advisories None Steroid Yes Insulation Breach 18
Other 1
Product Surveillance Registry Results Qualifying Complications 4 Total
Number of Leads Enrolled in Study 344 Failure to Capture 1 Oversensing 1
Cumulative Months of Follow-Up 15,784 Impedance Out of Range 1Number of Leads Active in Study 35 Lead Dislodgement 1
90
100
80
109876543210 Years After Implant
1 yr 2 yr 3 yr 4 yr 5 yr 6 yr at 78 mo
% 100.0 99.2 98.7 98.2 98.2 98.2 98.2# 273 227 182 159 137 80 49
Effective Sample Size
Lead
Sur
viva
l Pro
babi
lity
(%)
Lead
Sur
viva
l Pro
babi
lity
(%)
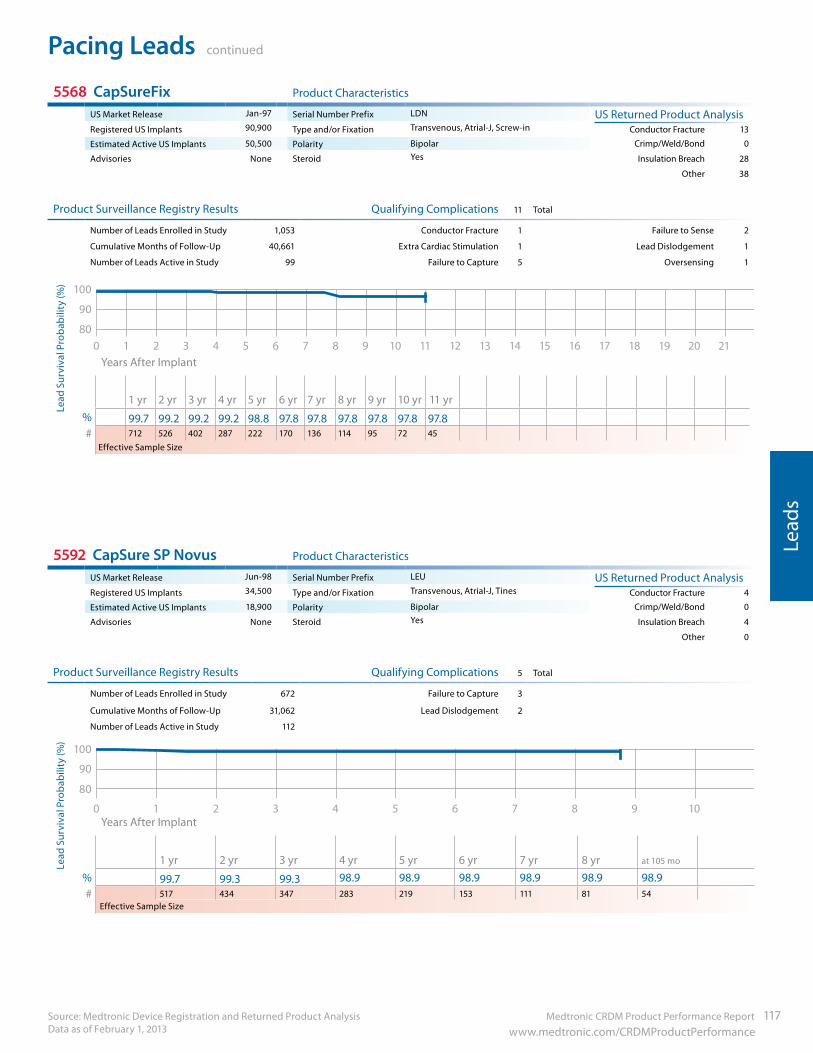
Medtronic CRDM Product Performance Report 117 www.medtronic.com/CRDMProductPerformance
Pacing Leads continued
Source: Medtronic Device Registration and Returned Product Analysis Data as of February 1, 2013
Lead
s
5568 CapSureFix Product Characteristics
US Market Release Jan-97 Serial Number Prefix LDN US Returned Product AnalysisRegistered US Implants 90,900 Type and/or Fixation Transvenous, Atrial-J, Screw-in Conductor Fracture 13
Estimated Active US Implants 50,500 Polarity Bipolar Crimp/Weld/Bond 0
Advisories None Steroid Yes Insulation Breach 28
Other 38
Product Surveillance Registry Results Qualifying Complications 11 Total
Number of Leads Enrolled in Study 1,053 Conductor Fracture 1 Failure to Sense 2
Cumulative Months of Follow-Up 40,661 Extra Cardiac Stimulation 1 Lead Dislodgement 1
Number of Leads Active in Study 99 Failure to Capture 5 Oversensing 1
90
100
8020181614121086420 21191715131197531
Years After Implant
1 yr 2 yr 3 yr 4 yr 5 yr 6 yr 7 yr 8 yr 9 yr 10 yr 11 yr% 99.7 99.2 99.2 99.2 98.8 97.8 97.8 97.8 97.8 97.8 97.8# 712 526 402 287 222 170 136 114 95 72 45
Effective Sample Size
5592 CapSure SP Novus Product Characteristics
US Market Release Jun-98 Serial Number Prefix LEU US Returned Product AnalysisRegistered US Implants 34,500 Type and/or Fixation Transvenous, Atrial-J, Tines Conductor Fracture 4
Estimated Active US Implants 18,900 Polarity Bipolar Crimp/Weld/Bond 0
Advisories None Steroid Yes Insulation Breach 4
Other 0
Product Surveillance Registry Results Qualifying Complications 5 Total
Number of Leads Enrolled in Study 672 Failure to Capture 3
Cumulative Months of Follow-Up 31,062 Lead Dislodgement 2
Number of Leads Active in Study 112
90
100
80
109876543210 Years After Implant
1 yr 2 yr 3 yr 4 yr 5 yr 6 yr 7 yr 8 yr at 105 mo
% 99.7 99.3 99.3 98.9 98.9 98.9 98.9 98.9 98.9# 517 434 347 283 219 153 111 81 54
Effective Sample Size
Lead
Sur
viva
l Pro
babi
lity
(%)
Lead
Sur
viva
l Pro
babi
lity
(%)
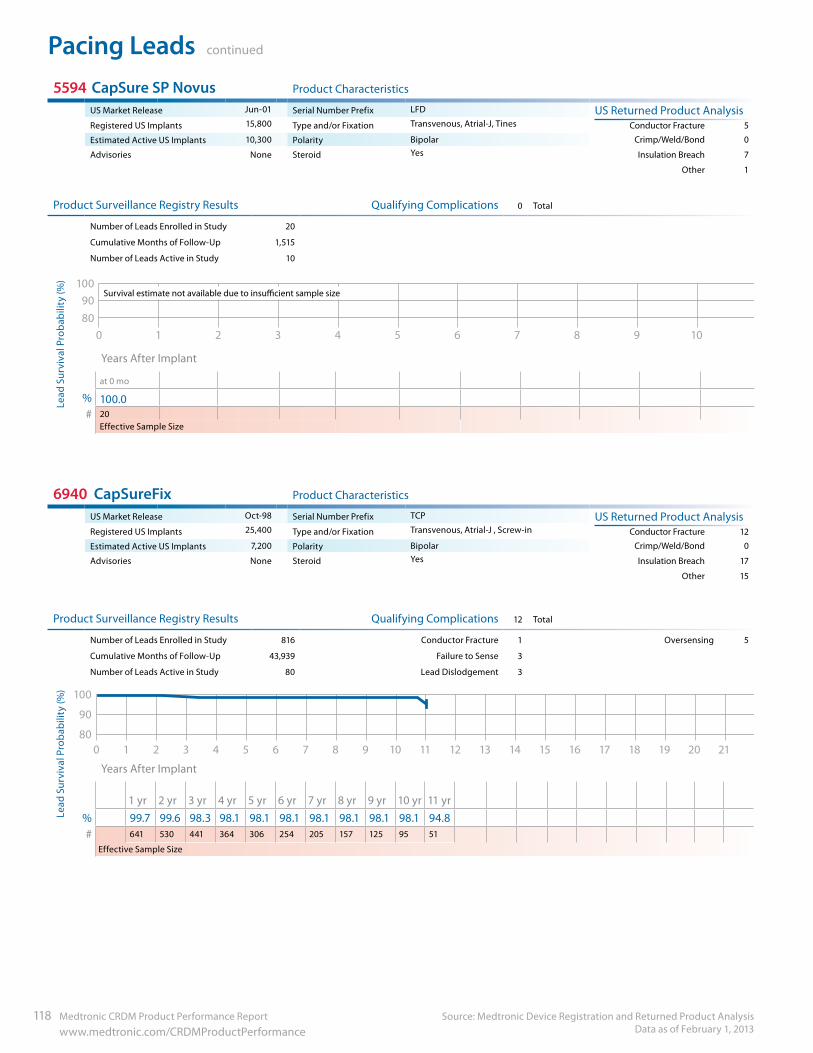
Pacing Leads continued
Source: Medtronic Device Registration and Returned Product Analysis Data as of February 1, 2013
118 Medtronic CRDM Product Performance Report www.medtronic.com/CRDMProductPerformance
5594 CapSure SP Novus Product Characteristics
US Market Release Jun-01 Serial Number Prefix LFD US Returned Product AnalysisRegistered US Implants 15,800 Type and/or Fixation Transvenous, Atrial-J, Tines Conductor Fracture 5
Estimated Active US Implants 10,300 Polarity Bipolar Crimp/Weld/Bond 0
Advisories None Steroid Yes Insulation Breach 7
Other 1
Product Surveillance Registry Results Qualifying Complications 0 Total
Number of Leads Enrolled in Study 20
Cumulative Months of Follow-Up 1,515
Number of Leads Active in Study 10
Survival estimate not available due to insucient sample size90
100
80109876543210
Years After Implant
at 0 mo
% 100.0# 20
Effective Sample Size
6940 CapSureFix Product Characteristics
US Market Release Oct-98 Serial Number Prefix TCP US Returned Product AnalysisRegistered US Implants 25,400 Type and/or Fixation Transvenous, Atrial-J , Screw-in Conductor Fracture 12
Estimated Active US Implants 7,200 Polarity Bipolar Crimp/Weld/Bond 0
Advisories None Steroid Yes Insulation Breach 17
Other 15
Product Surveillance Registry Results Qualifying Complications 12 Total
Number of Leads Enrolled in Study 816 Conductor Fracture 1 Oversensing 5
Cumulative Months of Follow-Up 43,939 Failure to Sense 3
Number of Leads Active in Study 80 Lead Dislodgement 3
90
100
8020181614121086420 21191715131197531
Years After Implant
1 yr 2 yr 3 yr 4 yr 5 yr 6 yr 7 yr 8 yr 9 yr 10 yr 11 yr% 99.7 99.6 98.3 98.1 98.1 98.1 98.1 98.1 98.1 98.1 94.8# 641 530 441 364 306 254 205 157 125 95 51
Effective Sample Size
Lead
Sur
viva
l Pro
babi
lity
(%)
Lead
Sur
viva
l Pro
babi
lity
(%)
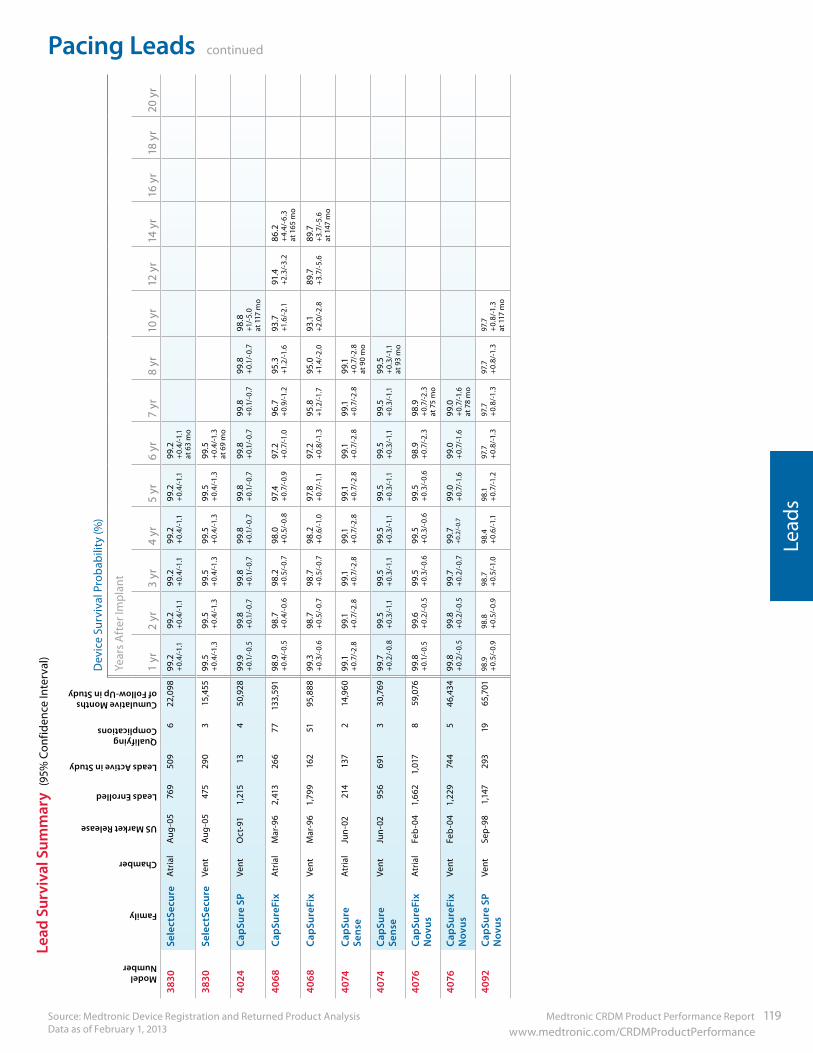
Medtronic CRDM Product Performance Report 119 www.medtronic.com/CRDMProductPerformance
Pacing Leads continued
Source: Medtronic Device Registration and Returned Product Analysis Data as of February 1, 2013
Lead
s
cont
inue
d
Lead
Sur
viva
l Sum
mar
y (9
5% C
onfid
ence
Inte
rval
)
ModelNumber
Family
Chamber
US Market Release
Leads Enrolled
Leads Active in Study
Qualifying Complications
Cumulative Months of Follow-Up in Study
Dev
ice
Surv
ival
Pro
babi
lity
(%)
Year
s A
fter
Impl
ant
1 yr
2 yr
3 yr
4 yr
5 yr
6 yr
7 yr
8 yr
10 y
r12
yr
14 y
r16
yr
18 y
r20
yr
3830
Sele
ctSe
cure
Atr
ial
Aug
-05
769
509
622
,098
99.2
+0.
4/-1
.199
.2+
0.4/
-1.1
99.2
+0.
4/-1
.199
.2+
0.4/
-1.1
99.2
+0.
4/-1
.199
.2+
0.4/
-1.1
at
63
mo
3830
Sele
ctSe
cure
Vent
A
ug-0
547
529
03
15,4
5599
.5
+0.
4/-1
.399
.5+
0.4/
-1.3
99.5
+0.
4/-1
.399
.5+
0.4/
-1.3
99.5
+0.
4/-1
.399
.5+
0.4/
-1.3
at
69
mo
4024
CapS
ure
SPVe
nt
Oct
-91
1,21
513
450
,928
99.9
+0.
1/-0
.599
.8+
0.1/
-0.7
99.8
+0.
1/-0
.799
.8+
0.1/
-0.7
99.8
+0.
1/-0
.799
.8+
0.1/
-0.7
99.8
+0.
1/-0
.799
.8+
0.1/
-0.7
98.8
+1/-
5.0
at 1
17 m
o
4068
CapS
ureF
ixA
tria
lM
ar-9
62,
413
266
7713
3,59
198
.9+
0.4/
-0.5
98.7
+0.
4/-0
.698
.2+
0.5/
-0.7
98.0
+0.
5/-0
.897
.4+
0.7/
-0.9
97.2
+0.
7/-1
.096
.7+
0.9/
-1.2
95.3
+1.2
/-1.6
93.7
+1
.6/-
2.1
91.4
+2.3
/-3.
286
.2+
4.4/
-6.3
at
165
mo
4068
CapS
ureF
ixVe
nt
M
ar-9
61,
799
162
5195
,888
99.3
+0.
3/-0
.698
.7+
0.5/
-0.7
98.7
+0.
5/-0
.798
.2+
0.6/
-1.0
97.8
+0.
7/-1
.197
.2+
0.8/
-1.3
95.8
+1.2
/-1.7
95.0
+1.4
/-2.
093
.1+2
.0/-
2.8
89.7
+3.7
/-5.
689
.7+3
.7/-
5.6
at
147
mo
4074
CapS
ure
Sens
eA
tria
lJu
n-02
214
137
214
,960
99.1
+0.
7/-2
.899
.1+
0.7/
-2.8
99.1
+0.
7/-2
.899
.1+
0.7/
-2.8
99.1
+0.
7/-2
.899
.1+
0.7/
-2.8
99.1
+0.
7/-2
.899
.1+
0.7/
-2.8
at
90
mo
4074
CapS
ure
Sens
eVe
nt
Ju
n-02
956
691
330
,769
99.7
+0.
2/-0
.899
.5+
0.3/
-1.1
99.5
+0.
3/-1
.199
.5+
0.3/
-1.1
99.5
+0.
3/-1
.199
.5+
0.3/
-1.1
99.5
+0.
3/-1
.199
.5
+0.
3/-1
.1
at 9
3 m
o
4076
CapS
ureF
ix
Nov
usA
tria
l
Feb
-04
1,66
21,
017
859
,076
99.8
+0.
1/-0
.599
.6+
0.2/
-0.5
99.5
+0.
3/-0
.699
.5+
0.3/
-0.6
99.5
+0.
3/-0
.698
.9+
0.7/
-2.3
98.9
+0.
7/-2
.3
at 7
5 m
o
4076
CapS
ureF
ix
Nov
usVe
nt
Fe
b-0
41,
229
744
546
,434
99.8
+0.
2/-0
.599
.8+
0.2/
-0.5
99.7
+0.
2/-0
.799
.7+
0.2/
-0.7
99.0
+
0.7/
-1.6
99.0
+0.
7/-1
.699
.0+
0.7/
-1.6
at
78
mo
4092
CapS
ure
SP
Nov
usVe
ntSe
p-9
81,
147
293
1965
,701
98.9
+0.
5/-0
.998
.8+
0.5/
-0.9
98.7
+0.
5/-1
.098
.4+
0.6/
-1.1
98.1
+
0.7/
-1.2
97.7
+0.
8/-1
.397
.7+
0.8/
-1.3
97.7
+0.
8/-1
.397
.7
+0.
8/-1
.3
at 1
17 m
o
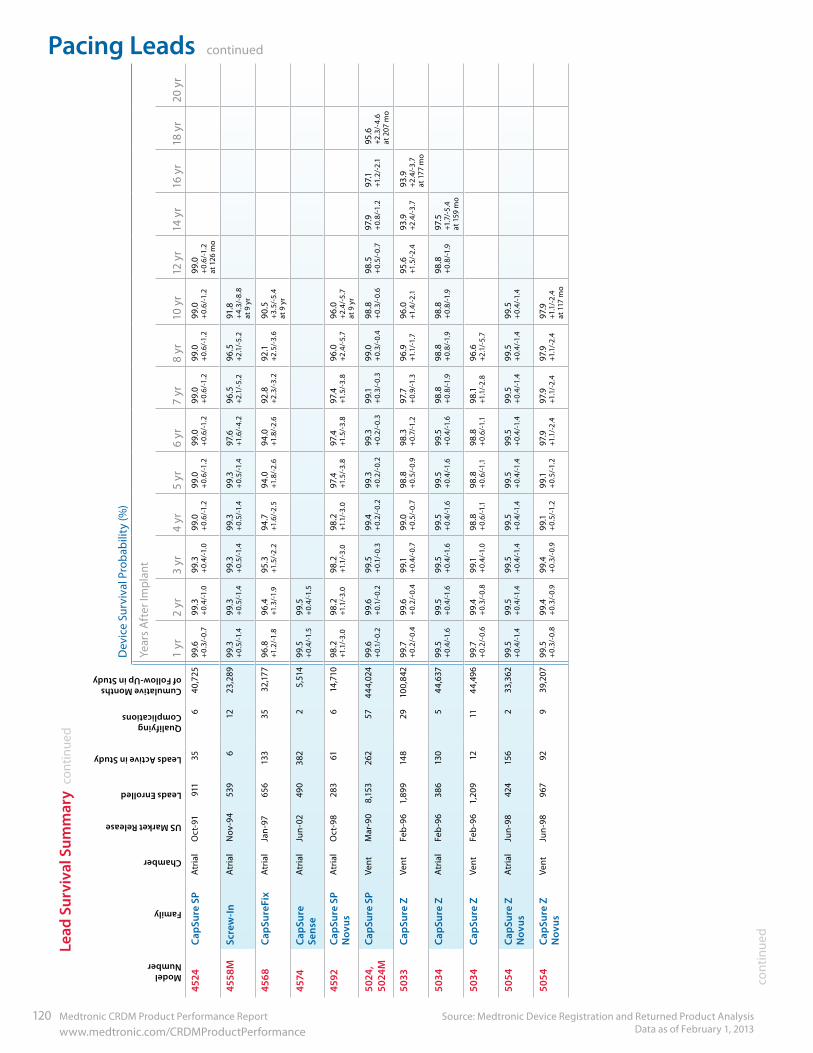
Pacing Leads continued
Source: Medtronic Device Registration and Returned Product Analysis Data as of February 1, 2013
120 Medtronic CRDM Product Performance Report www.medtronic.com/CRDMProductPerformance
cont
inue
d
ModelNumber
Family
Chamber
US Market Release
Leads Enrolled
Leads Active in Study
Qualifying Complications
Cumulative Months of Follow-Up in Study
Dev
ice
Surv
ival
Pro
babi
lity
(%)
Year
s A
fter
Impl
ant
1 yr
2 yr
3 yr
4 yr
5 yr
6 yr
7 yr
8 yr
10 y
r12
yr
14 y
r16
yr
18 y
r20
yr
4524
CapS
ure
SPA
tria
l
Oct
-91
911
356
40,7
2599
.6+
0.3/
-0.7
99.3
+0.
4/-1
.099
.3+
0.4/
-1.0
99.0
+0.
6/-1
.299
.0+
0.6/
-1.2
99.0
+0.
6/-1
.299
.0
+0.
6/-1
.299
.0+
0.6/
-1.2
99.0
+0.
6/-1
.299
.0
+0.
6/-1
.2
at 1
26 m
o
4558
MSc
rew
-In
Atr
ial
N
ov-9
453
96
1223
,289
99.3
+0.
5/-1
.499
.3+
0.5/
-1.4
99.3
+
0.5/
-1.4
99.3
+
0.5/
-1.4
99.3
+0.
5/-1
.497
.6
+1.6
/-4.
296
.5
+2.1
/-5.
296
.5
+2.1
/-5.
291
.8
+4.
3/-8
.8
at 9
yr
4568
CapS
ureF
ixA
tria
l
Jan-
9765
613
335
32,1
7796
.8
+1.2
/-1.8
96.4
+1
.3/-1
.995
.3
+1.5
/-2.
294
.7
+1.6
/-2.
594
.0
+1.8
/-2.
694
.0+1
.8/-
2.6
92.8
+2
.3/-
3.2
92.1
+2
.5/-
3.6
90.5
+3
.5/-
5.4
at
9 y
r
4574
CapS
ure
Sens
eA
tria
l
Jun-
0249
038
22
5,51
499
.5
+0.
4/-1
.599
.5+
0.4/
-1.5
4592
CapS
ure
SP
Nov
usA
tria
l
Oct
-98
283
616
14,7
1098
.2+1
.1/-
3.0
98.2
+1.1
/-3.
098
.2+1
.1/-
3.0
98.2
+1
.1/-
3.0
97.4
+1
.5/-
3.8
97.4
+1
.5/-
3.8
97.4
+1
.5/-
3.8
96.0
+2.4
/-5.
796
.0+2
.4/-
5.7
at
9 y
r
5024
, 50
24M
CapS
ure
SPVe
nt
M
ar-9
08,
153
262
5744
4,02
499
.6+
0.1/
-0.2
99.6
+
0.1/
-0.2
99.5
+
0.1/
-0.3
99.4
+
0.2/
-0.2
99.3
+
0.2/
-0.2
99.3
+
0.2/
-0.3
99.1
+
0.3/
-0.3
99.0
+0.
3/-0
.498
.8
+0.
3/-0
.698
.5
+0.
5/-0
.797
.9
+0.
8/-1
.297
.1
+1.2
/-2.
195
.6
+2.3
/-4.
6 at
207
mo
5033
CapS
ure
ZVe
nt
Fe
b-9
61,
899
148
2910
0,84
299
.7+
0.2/
-0.4
99.6
+
0.2/
-0.4
99.1
+
0.4/
-0.7
99.0
+0.
5/-0
.798
.8
+0.
5/-0
.998
.3
+0.
7/-1
.297
.7
+0.
9/-1
.396
.9
+1.1
/-1.7
96.0
+1.4
/-2.
195
.6
+1.5
/-2.
493
.9
+2.4
/-3.
793
.9
+2.4
/-3.
7
at 1
77 m
o
5034
CapS
ure
ZA
tria
lFe
b-9
638
613
05
44,6
3799
.5+
0.4/
-1.6
99.5
+
0.4/
-1.6
99.5
+
0.4/
-1.6
99.5
+
0.4/
-1.6
99.5
+
0.4/
-1.6
99.5
+
0.4/
-1.6
98.8
+
0.8/
-1.9
98.8
+
0.8/
-1.9
98.8
+
0.8/
-1.9
98.8
+
0.8/
-1.9
97.5
+1
.7/-
5.4
at
159
mo
5034
CapS
ure
ZVe
nt
Fe
b-9
61,
209
1211
44,4
9699
.7+
0.2/
-0.6
99.4
+
0.3/
-0.8
99.1
+
0.4/
-1.0
98.8
+
0.6/
-1.1
98.8
+
0.6/
-1.1
98.8
+
0.6/
-1.1
98.1
+1
.1/-
2.8
96.6
+2
.1/-
5.7
5054
CapS
ure
Z N
ovus
Atr
ial
Jun-
9842
415
62
33,3
6299
.5
+0.
4/-1
.499
.5
+0.
4/-1
.499
.5
+0.
4/-1
.499
.5
+0.
4/-1
.499
.5
+0.
4/-1
.499
.5
+0.
4/-1
.499
.5
+0.
4/-1
.499
.5
+0.
4/-1
.499
.5
+0.
4/-1
.4
5054
CapS
ure
Z N
ovus
Vent
Jun-
9896
792
939
,207
99.5
+
0.3/
-0.8
99.4
+
0.3/
-0.9
99.4
+
0.3/
-0.9
99.1
+
0.5/
-1.2
99.1
+
0.5/
-1.2
97.9
+1
.1/-
2.4
97.9
+1
.1/-
2.4
97.9
+1
.1/-
2.4
97.9
+1
.1/-
2.4
at
117
mo
Lead
Sur
viva
l Sum
mar
y co
ntin
ued
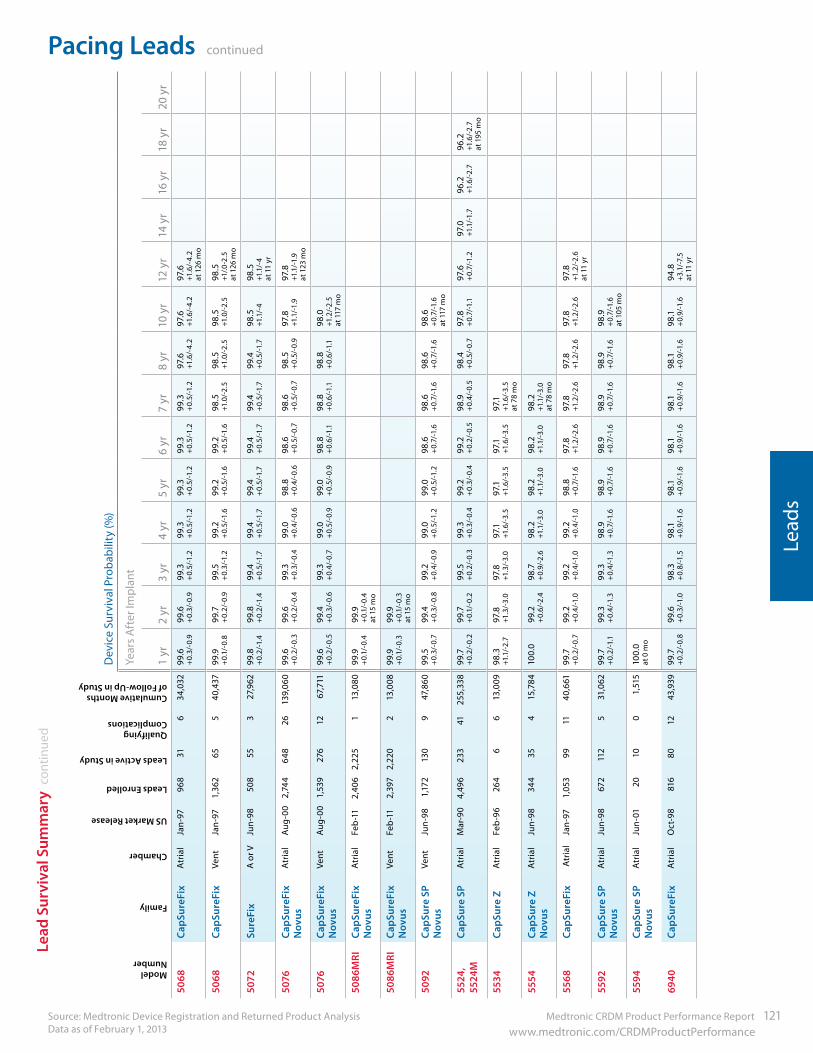
Medtronic CRDM Product Performance Report 121 www.medtronic.com/CRDMProductPerformance
Pacing Leads continued
Source: Medtronic Device Registration and Returned Product Analysis Data as of February 1, 2013
Lead
s
ModelNumber
Family
Chamber
US Market Release
Leads Enrolled
Leads Active in Study
Qualifying Complications
Cumulative Months of Follow-Up in Study
Dev
ice
Surv
ival
Pro
babi
lity
(%)
Year
s A
fter
Impl
ant
1 yr
2 yr
3 yr
4 yr
5 yr
6 yr
7 yr
8 yr
10 y
r12
yr
14 y
r16
yr
18 y
r20
yr
4524
CapS
ure
SPA
tria
l
Oct
-91
911
356
40,7
2599
.6+
0.3/
-0.7
99.3
+0.
4/-1
.099
.3+
0.4/
-1.0
99.0
+0.
6/-1
.299
.0+
0.6/
-1.2
99.0
+0.
6/-1
.299
.0
+0.
6/-1
.299
.0+
0.6/
-1.2
99.0
+0.
6/-1
.299
.0
+0.
6/-1
.2
at 1
26 m
o
4558
MSc
rew
-In
Atr
ial
N
ov-9
453
96
1223
,289
99.3
+0.
5/-1
.499
.3+
0.5/
-1.4
99.3
+
0.5/
-1.4
99.3
+
0.5/
-1.4
99.3
+0.
5/-1
.497
.6
+1.6
/-4.
296
.5
+2.1
/-5.
296
.5
+2.1
/-5.
291
.8
+4.
3/-8
.8
at 9
yr
4568
CapS
ureF
ixA
tria
l
Jan-
9765
613
335
32,1
7796
.8
+1.2
/-1.8
96.4
+1
.3/-1
.995
.3
+1.5
/-2.
294
.7
+1.6
/-2.
594
.0
+1.8
/-2.
694
.0+1
.8/-
2.6
92.8
+2
.3/-
3.2
92.1
+2
.5/-
3.6
90.5
+3
.5/-
5.4
at
9 y
r
4574
CapS
ure
Sens
eA
tria
l
Jun-
0249
038
22
5,51
499
.5
+0.
4/-1
.599
.5+
0.4/
-1.5
4592
CapS
ure
SP
Nov
usA
tria
l
Oct
-98
283
616
14,7
1098
.2+1
.1/-
3.0
98.2
+1.1
/-3.
098
.2+1
.1/-
3.0
98.2
+1
.1/-
3.0
97.4
+1
.5/-
3.8
97.4
+1
.5/-
3.8
97.4
+1
.5/-
3.8
96.0
+2.4
/-5.
796
.0+2
.4/-
5.7
at
9 y
r
5024
, 50
24M
CapS
ure
SPVe
nt
M
ar-9
08,
153
262
5744
4,02
499
.6+
0.1/
-0.2
99.6
+
0.1/
-0.2
99.5
+
0.1/
-0.3
99.4
+
0.2/
-0.2
99.3
+
0.2/
-0.2
99.3
+
0.2/
-0.3
99.1
+
0.3/
-0.3
99.0
+0.
3/-0
.498
.8
+0.
3/-0
.698
.5
+0.
5/-0
.797
.9
+0.
8/-1
.297
.1
+1.2
/-2.
195
.6
+2.3
/-4.
6 at
207
mo
5033
CapS
ure
ZVe
nt
Fe
b-9
61,
899
148
2910
0,84
299
.7+
0.2/
-0.4
99.6
+
0.2/
-0.4
99.1
+
0.4/
-0.7
99.0
+0.
5/-0
.798
.8
+0.
5/-0
.998
.3
+0.
7/-1
.297
.7
+0.
9/-1
.396
.9
+1.1
/-1.7
96.0
+1.4
/-2.
195
.6
+1.5
/-2.
493
.9
+2.4
/-3.
793
.9
+2.4
/-3.
7
at 1
77 m
o
5034
CapS
ure
ZA
tria
lFe
b-9
638
613
05
44,6
3799
.5+
0.4/
-1.6
99.5
+
0.4/
-1.6
99.5
+
0.4/
-1.6
99.5
+
0.4/
-1.6
99.5
+
0.4/
-1.6
99.5
+
0.4/
-1.6
98.8
+
0.8/
-1.9
98.8
+
0.8/
-1.9
98.8
+
0.8/
-1.9
98.8
+
0.8/
-1.9
97.5
+1
.7/-
5.4
at
159
mo
5034
CapS
ure
ZVe
nt
Fe
b-9
61,
209
1211
44,4
9699
.7+
0.2/
-0.6
99.4
+
0.3/
-0.8
99.1
+
0.4/
-1.0
98.8
+
0.6/
-1.1
98.8
+
0.6/
-1.1
98.8
+
0.6/
-1.1
98.1
+1
.1/-
2.8
96.6
+2
.1/-
5.7
5054
CapS
ure
Z N
ovus
Atr
ial
Jun-
9842
415
62
33,3
6299
.5
+0.
4/-1
.499
.5
+0.
4/-1
.499
.5
+0.
4/-1
.499
.5
+0.
4/-1
.499
.5
+0.
4/-1
.499
.5
+0.
4/-1
.499
.5
+0.
4/-1
.499
.5
+0.
4/-1
.499
.5
+0.
4/-1
.4
5054
CapS
ure
Z N
ovus
Vent
Jun-
9896
792
939
,207
99.5
+
0.3/
-0.8
99.4
+
0.3/
-0.9
99.4
+
0.3/
-0.9
99.1
+
0.5/
-1.2
99.1
+
0.5/
-1.2
97.9
+1
.1/-
2.4
97.9
+1
.1/-
2.4
97.9
+1
.1/-
2.4
97.9
+1
.1/-
2.4
at
117
mo
Lead
Sur
viva
l Sum
mar
y co
ntin
ued
ModelNumber
Family
Chamber
US Market Release
Leads Enrolled
Leads Active in Study
Qualifying Complications
Cumulative Months of Follow-Up in Study
Dev
ice
Surv
ival
Pro
babi
lity
(%)
Year
s A
fter
Impl
ant
1 yr
2 yr
3 yr
4 yr
5 yr
6 yr
7 yr
8 yr
10 y
r12
yr
14 y
r16
yr
18 y
r20
yr
5068
CapS
ureF
ixA
tria
lJa
n-97
968
316
34,0
3299
.6
+0.
3/-0
.999
.6
+0.
3/-0
.999
.3
+0.
5/-1
.299
.3
+0.
5/-1
.299
.3
+0.
5/-1
.299
.3
+0.
5/-1
.299
.3
+0.
5/-1
.297
.6
+1.6
/-4.
297
.6
+1.6
/-4.
297
.6
+1.6
/-4.
2
at 1
26 m
o
5068
CapS
ureF
ixVe
ntJa
n-97
1,36
265
540
,437
99.9
+
0.1/
-0.8
99.7
+
0.2/
-0.9
99.5
+
0.3/
-1.2
99.2
+
0.5/
-1.6
99.2
+
0.5/
-1.6
99.2
+
0.5/
-1.6
98.5
+1
.0/-
2.5
98.5
+1
.0/-
2.5
98.5
+1
.0/-
2.5
98.5
+1
/.0-2
.5
at 1
26 m
o
5072
Sure
Fix
A o
r VJu
n-98
508
553
27,9
6299
.8
+0.
2/-1
.499
.8
+0.
2/-1
.499
.4
+0.
5/-1
.799
.4
+0.
5/-1
.799
.4
+0.
5/-1
.799
.4
+0.
5/-1
.799
.4
+0.
5/-1
.799
.4
+0.
5/-1
.798
.5
+1.1
/-4
98.5
+1
.1/-
4
at 1
1 yr
5076
CapS
ureF
ix
Nov
usA
tria
l
Aug
-00
2,74
464
826
139,
060
99.6
+0.
2/-0
.399
.6
+0.
2/-0
.499
.3
+0.
3/-0
.499
.0+
0.4/
-0.6
98.8
+
0.4/
-0.6
98.6
+
0.5/
-0.7
98.6
+
0.5/
-0.7
98.5
+
0.5/
-0.9
97.8
+1
.1/-1
.997
.8
+1.1
/-1.9
at
123
mo
5076
CapS
ureF
ix
Nov
usVe
nt
A
ug-0
01,
539
276
1267
,711
99.6
+
0.2/
-0.5
99.4
+
0.3/
-0.6
99.3
+
0.4/
-0.7
99.0
+0.
5/-0
.999
.0+
0.5/
-0.9
98.8
+
0.6/
-1.1
98.8
+
0.6/
-1.1
98.8
+
0.6/
-1.1
98.0
+1.2
/-2.
5
at 1
17 m
o
5086
MRI
CapS
ureF
ix
Nov
usA
tria
lFe
b-1
12,
406
2,22
51
13,0
8099
.9+
0.1/
-0.4
99.9
+
0.1/
-0.4
at
15
mo
5086
MRI
CapS
ureF
ix
Nov
usVe
ntFe
b-1
12,
397
2,22
02
13,0
0899
.9
+0.
1/-0
.399
.9
+0.
1/-0
.3
at 1
5 m
o
5092
CapS
ure
SP
Nov
usVe
nt
Ju
n-98
1,17
213
09
47,8
6099
.5
+0.
3/-0
.799
.4
+0.
3/-0
.899
.2
+0.
4/-0
.999
.0+
0.5/
-1.2
99.0
+0.
5/-1
.298
.6
+0.
7/-1
.698
.6
+0.
7/-1
.698
.6
+0.
7/-1
.698
.6
+0.
7/-1
.6
at 1
17 m
o
5524
, 55
24M
CapS
ure
SPA
tria
l
Mar
-90
4,49
623
341
255,
338
99.7
+0.
2/-0
.299
.7
+0.
1/-0
.299
.5
+0.
2/-0
.399
.3
+0.
3/-0
.499
.2
+0.
3/-0
.499
.2
+0.
2/-0
.598
.9
+0.
4/-0
.598
.4
+0.
5/-0
.797
.8
+0.
7/-1
.197
.6
+0.
7/-1
.297
.0
+1.1
/-1.7
96.2
+1
.6/-
2.7
96.2
+1
.6/-
2.7
at 1
95 m
o
5534
CapS
ure
ZA
tria
l
Feb
-96
264
66
13,0
0998
.3
+1.1
/-2.
797
.8
+1.3
/-3.
097
.8
+1.3
/-3.
097
.1
+1.6
/-3.
597
.1
+1.6
/-3.
597
.1
+1.6
/-3.
597
.1
+1.6
/-3.
5
at 7
8 m
o
5554
CapS
ure
Z N
ovus
Atr
ial
Jun-
9834
435
415
,784
100.
099
.2
+0.
6/-2
.498
.7
+0.
9/-2
.698
.2
+1.1
/-3.
098
.2
+1.1
/-3.
098
.2
+1.1
/-3.
098
.2
+1.1
/-3.
0
at 7
8 m
o
5568
CapS
ureF
ix A
tria
lJa
n-97
1,05
399
1140
,661
99.7
+
0.2/
-0.7
99.2
+
0.4/
-1.0
99.2
+
0.4/
-1.0
99.2
+
0.4/
-1.0
98.8
+
0.7/
-1.6
97.8
+1
.2/-
2.6
97.8
+1
.2/-
2.6
97.8
+1
.2/-
2.6
97.8
+1
.2/-
2.6
97.8
+1
.2/-
2.6
at
11
yr
5592
CapS
ure
SP
Nov
usA
tria
lJu
n-98
672
112
531
,062
99.7
+
0.2/
-1.1
99.3
+
0.4/
-1.3
99.3
+
0.4/
-1.3
98.9
+0.
7/-1
.698
.9
+0.
7/-1
.698
.9
+0.
7/-1
.698
.9
+0.
7/-1
.698
.9+
0.7/
-1.6
98.9
+
0.7/
-1.6
at
105
mo
5594
CapS
ure
SP
Nov
usA
tria
l
Jun-
0120
100
1,51
510
0.0
at 0
mo
6940
CapS
ureF
ixA
tria
lO
ct-9
881
680
1243
,939
99.7
+0.
2/-0
.899
.6
+0.
3/-1
.098
.3
+0.
8/-1
.598
.1
+0.
9/-1
.698
.1
+0.
9/-1
.698
.1
+0.
9/-1
.698
.1
+0.
9/-1
.698
.1
+0.
9/-1
.698
.1
+0.
9/-1
.694
.8
+3.1
/-7.
5
at 1
1 yr
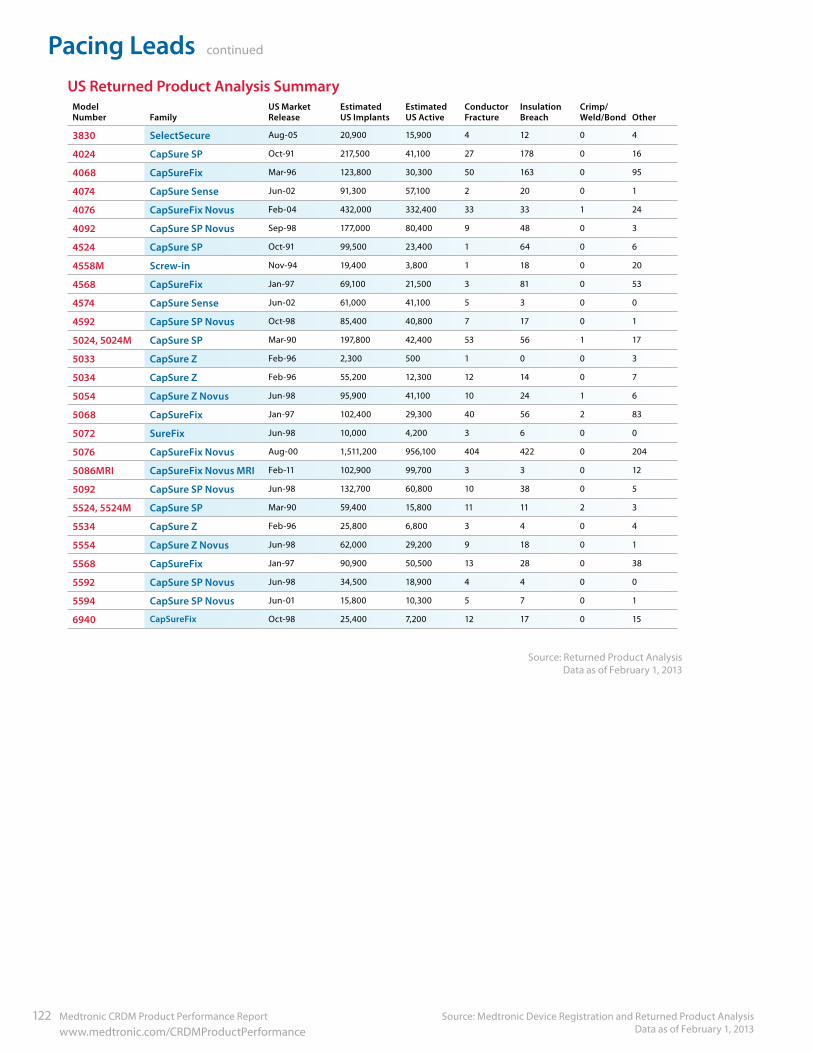
Pacing Leads continued
Source: Medtronic Device Registration and Returned Product Analysis Data as of February 1, 2013
122 Medtronic CRDM Product Performance Report www.medtronic.com/CRDMProductPerformance
Model Number Family
US Market Release
Estimated US Implants
Estimated US Active
Conductor Fracture
Insulation Breach
Crimp/Weld/Bond Other
3830 SelectSecure Aug-05 20,900 15,900 4 12 0 4
4024 CapSure SP Oct-91 217,500 41,100 27 178 0 16
4068 CapSureFix Mar-96 123,800 30,300 50 163 0 95
4074 CapSure Sense Jun-02 91,300 57,100 2 20 0 1
4076 CapSureFix Novus Feb-04 432,000 332,400 33 33 1 24
4092 CapSure SP Novus Sep-98 177,000 80,400 9 48 0 3
4524 CapSure SP Oct-91 99,500 23,400 1 64 0 6
4558M Screw-in Nov-94 19,400 3,800 1 18 0 20
4568 CapSureFix Jan-97 69,100 21,500 3 81 0 53
4574 CapSure Sense Jun-02 61,000 41,100 5 3 0 0
4592 CapSure SP Novus Oct-98 85,400 40,800 7 17 0 1
5024, 5024M CapSure SP Mar-90 197,800 42,400 53 56 1 17
5033 CapSure Z Feb-96 2,300 500 1 0 0 3
5034 CapSure Z Feb-96 55,200 12,300 12 14 0 7
5054 CapSure Z Novus Jun-98 95,900 41,100 10 24 1 6
5068 CapSureFix Jan-97 102,400 29,300 40 56 2 83
5072 SureFix Jun-98 10,000 4,200 3 6 0 0
5076 CapSureFix Novus Aug-00 1,511,200 956,100 404 422 0 204
5086MRI CapSureFix Novus MRI Feb-11 102,900 99,700 3 3 0 12
5092 CapSure SP Novus Jun-98 132,700 60,800 10 38 0 5
5524, 5524M CapSure SP Mar-90 59,400 15,800 11 11 2 3
5534 CapSure Z Feb-96 25,800 6,800 3 4 0 4
5554 CapSure Z Novus Jun-98 62,000 29,200 9 18 0 1
5568 CapSureFix Jan-97 90,900 50,500 13 28 0 38
5592 CapSure SP Novus Jun-98 34,500 18,900 4 4 0 0
5594 CapSure SP Novus Jun-01 15,800 10,300 5 7 0 1
6940 CapSureFix Oct-98 25,400 7,200 12 17 0 15
US Returned Product Analysis Summary
Source: Returned Product Analysis Data as of February 1, 2013
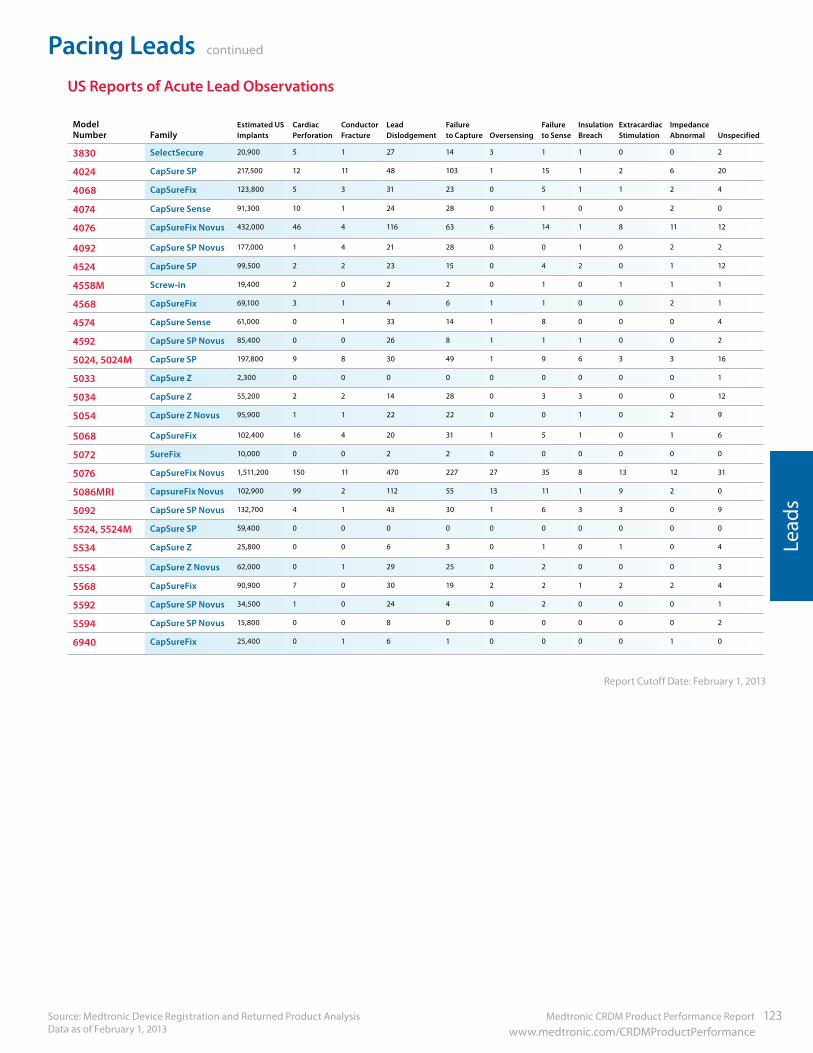
Medtronic CRDM Product Performance Report 123 www.medtronic.com/CRDMProductPerformance
Pacing Leads continued
Source: Medtronic Device Registration and Returned Product Analysis Data as of February 1, 2013
Lead
s
ModelNumber Family
Estimated US Implants
Cardiac Perforation
Conductor Fracture
Lead Dislodgement
Failure to Capture Oversensing
Failure to Sense
Insulation Breach
Extracardiac Stimulation
Impedance Abnormal Unspecified
3830 SelectSecure 20,900 5 1 27 14 3 1 1 0 0 2
4024 CapSure SP 217,500 12 11 48 103 1 15 1 2 6 20
4068 CapSureFix 123,800 5 3 31 23 0 5 1 1 2 4
4074 CapSure Sense 91,300 10 1 24 28 0 1 0 0 2 0
4076 CapSureFix Novus 432,000 46 4 116 63 6 14 1 8 11 12
4092 CapSure SP Novus 177,000 1 4 21 28 0 0 1 0 2 2
4524 CapSure SP 99,500 2 2 23 15 0 4 2 0 1 12
4558M Screw-in 19,400 2 0 2 2 0 1 0 1 1 1
4568 CapSureFix 69,100 3 1 4 6 1 1 0 0 2 1
4574 CapSure Sense 61,000 0 1 33 14 1 8 0 0 0 4
4592 CapSure SP Novus 85,400 0 0 26 8 1 1 1 0 0 2
5024, 5024M CapSure SP 197,800 9 8 30 49 1 9 6 3 3 16
5033 CapSure Z 2,300 0 0 0 0 0 0 0 0 0 1
5034 CapSure Z 55,200 2 2 14 28 0 3 3 0 0 12
5054 CapSure Z Novus 95,900 1 1 22 22 0 0 1 0 2 9
5068 CapSureFix 102,400 16 4 20 31 1 5 1 0 1 6
5072 SureFix 10,000 0 0 2 2 0 0 0 0 0 0
5076 CapSureFix Novus 1,511,200 150 11 470 227 27 35 8 13 12 31
5086MRI CapsureFix Novus 102,900 99 2 112 55 13 11 1 9 2 0
5092 CapSure SP Novus 132,700 4 1 43 30 1 6 3 3 0 9
5524, 5524M CapSure SP 59,400 0 0 0 0 0 0 0 0 0 0
5534 CapSure Z 25,800 0 0 6 3 0 1 0 1 0 4
5554 CapSure Z Novus 62,000 0 1 29 25 0 2 0 0 0 3
5568 CapSureFix 90,900 7 0 30 19 2 2 1 2 2 4
5592 CapSure SP Novus 34,500 1 0 24 4 0 2 0 0 0 1
5594 CapSure SP Novus 15,800 0 0 8 0 0 0 0 0 0 2
6940 CapSureFix 25,400 0 1 6 1 0 0 0 0 1 0
US Reports of Acute Lead Observations
Report Cutoff Date: February 1, 2013
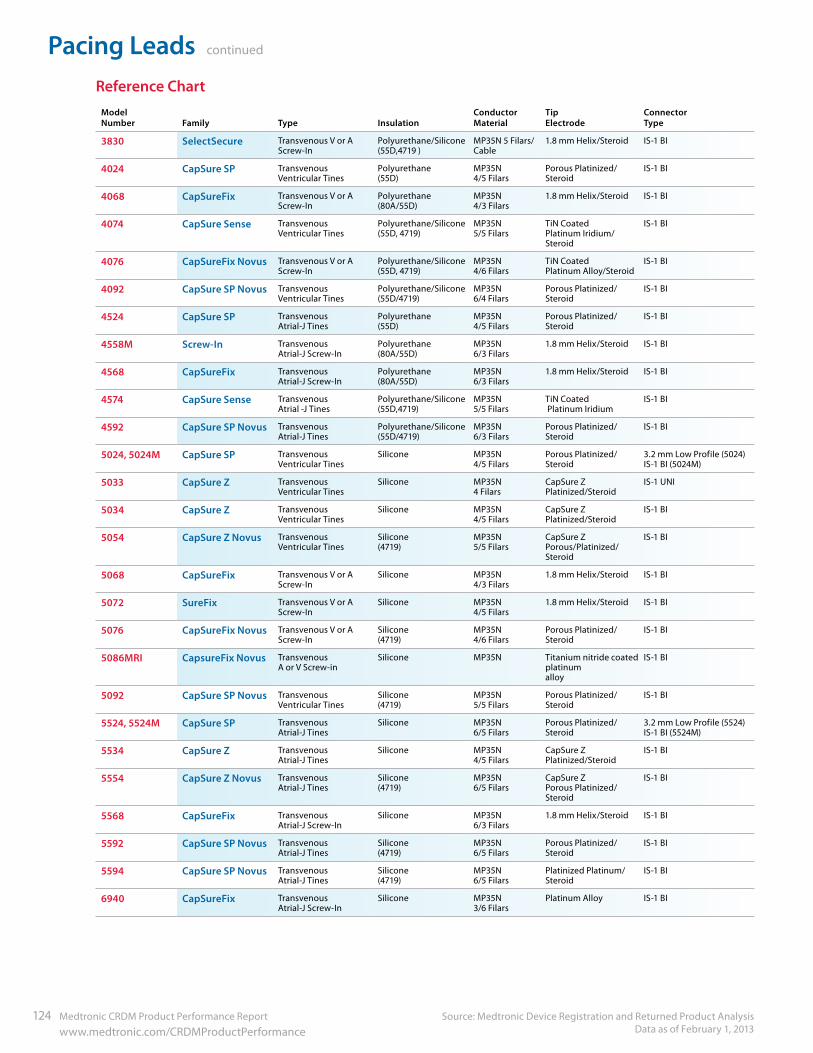
Pacing Leads continued
Source: Medtronic Device Registration and Returned Product Analysis Data as of February 1, 2013
124 Medtronic CRDM Product Performance Report www.medtronic.com/CRDMProductPerformance
ModelNumber Family Type Insulation
Conductor Material
Tip Electrode
Connector Type
3830 SelectSecure Transvenous V or A Screw-In
Polyurethane/Silicone (55D,4719 )
MP35N 5 Filars/Cable
1.8 mm Helix/Steroid IS-1 BI
4024 CapSure SP Transvenous Ventricular Tines
Polyurethane (55D)
MP35N4/5 Filars
Porous Platinized/Steroid
IS-1 BI
4068 CapSureFix Transvenous V or A Screw-In
Polyurethane (80A/55D)
MP35N4/3 Filars
1.8 mm Helix/Steroid IS-1 BI
4074 CapSure Sense Transvenous Ventricular Tines
Polyurethane/Silicone (55D, 4719)
MP35N 5/5 Filars
TiN Coated Platinum Iridium/Steroid
IS-1 BI
4076 CapSureFix Novus Transvenous V or A Screw-In
Polyurethane/Silicone (55D, 4719)
MP35N 4/6 Filars
TiN CoatedPlatinum Alloy/Steroid
IS-1 BI
4092 CapSure SP Novus Transvenous Ventricular Tines
Polyurethane/Silicone (55D/4719)
MP35N6/4 Filars
Porous Platinized/Steroid
IS-1 BI
4524 CapSure SP TransvenousAtrial-J Tines
Polyurethane(55D)
MP35N4/5 Filars
Porous Platinized/Steroid
IS-1 BI
4558M Screw-In TransvenousAtrial-J Screw-In
Polyurethane (80A/55D)
MP35N6/3 Filars
1.8 mm Helix/Steroid IS-1 BI
4568 CapSureFix TransvenousAtrial-J Screw-In
Polyurethane (80A/55D)
MP35N6/3 Filars
1.8 mm Helix/Steroid IS-1 BI
4574 CapSure Sense TransvenousAtrial -J Tines
Polyurethane/Silicone (55D,4719)
MP35N5/5 Filars
TiN Coated Platinum Iridium
IS-1 BI
4592 CapSure SP Novus TransvenousAtrial-J Tines
Polyurethane/Silicone (55D/4719)
MP35N6/3 Filars
Porous Platinized/Steroid
IS-1 BI
5024, 5024M CapSure SP Transvenous Ventricular Tines
Silicone MP35N4/5 Filars
Porous Platinized/Steroid
3.2 mm Low Profile (5024)IS-1 BI (5024M)
5033 CapSure Z Transvenous Ventricular Tines
Silicone MP35N4 Filars
CapSure Z Platinized/Steroid
IS-1 UNI
5034 CapSure Z Transvenous Ventricular Tines
Silicone MP35N4/5 Filars
CapSure Z Platinized/Steroid
IS-1 BI
5054 CapSure Z Novus Transvenous Ventricular Tines
Silicone(4719)
MP35N5/5 Filars
CapSure Z Porous/Platinized/Steroid
IS-1 BI
5068 CapSureFix Transvenous V or A Screw-In
Silicone MP35N4/3 Filars
1.8 mm Helix/Steroid IS-1 BI
5072 SureFix Transvenous V or A Screw-In
Silicone MP35N4/5 Filars
1.8 mm Helix/Steroid IS-1 BI
5076 CapSureFix Novus Transvenous V or A Screw-In
Silicone(4719)
MP35N4/6 Filars
Porous Platinized/Steroid
IS-1 BI
5086MRI CapsureFix Novus TransvenousA or V Screw-in
Silicone MP35N Titanium nitride coated platinumalloy
IS-1 BI
5092 CapSure SP Novus Transvenous Ventricular Tines
Silicone(4719)
MP35N5/5 Filars
Porous Platinized/Steroid
IS-1 BI
5524, 5524M CapSure SP TransvenousAtrial-J Tines
Silicone MP35N6/5 Filars
Porous Platinized/Steroid
3.2 mm Low Profile (5524) IS-1 BI (5524M)
5534 CapSure Z TransvenousAtrial-J Tines
Silicone MP35N4/5 Filars
CapSure Z Platinized/Steroid
IS-1 BI
5554 CapSure Z Novus TransvenousAtrial-J Tines
Silicone (4719)
MP35N6/5 Filars
CapSure ZPorous Platinized/Steroid
IS-1 BI
5568 CapSureFix TransvenousAtrial-J Screw-In
Silicone MP35N6/3 Filars
1.8 mm Helix/Steroid IS-1 BI
5592 CapSure SP Novus TransvenousAtrial-J Tines
Silicone (4719)
MP35N6/5 Filars
Porous Platinized/Steroid
IS-1 BI
5594 CapSure SP Novus TransvenousAtrial-J Tines
Silicone (4719)
MP35N6/5 Filars
Platinized Platinum/Steroid
IS-1 BI
6940 CapSureFix TransvenousAtrial-J Screw-In
Silicone MP35N3/6 Filars
Platinum Alloy IS-1 BI
Reference Chart
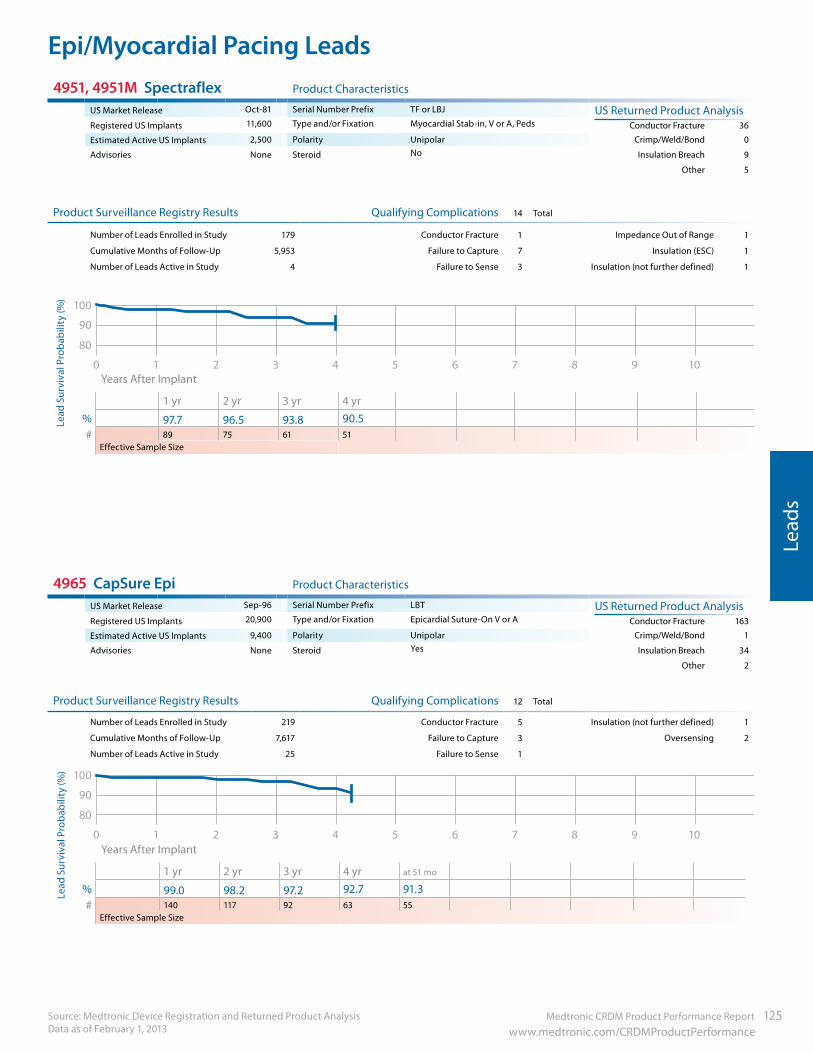
Medtronic CRDM Product Performance Report 125 www.medtronic.com/CRDMProductPerformance
Epi/Myocardial Pacing Leads
Lead
s
Source: Medtronic Device Registration and Returned Product Analysis Data as of February 1, 2013
4951, 4951M Spectraflex Product Characteristics
US Market Release Oct-81 Serial Number Prefix TF or LBJ US Returned Product AnalysisRegistered US Implants 11,600 Type and/or Fixation Myocardial Stab-in, V or A, Peds Conductor Fracture 36
Estimated Active US Implants 2,500 Polarity Unipolar Crimp/Weld/Bond 0
Advisories None Steroid No Insulation Breach 9
Other 5
Product Surveillance Registry Results Qualifying Complications 14 Total
Number of Leads Enrolled in Study 179 Conductor Fracture 1 Impedance Out of Range 1
Cumulative Months of Follow-Up 5,953 Failure to Capture 7 Insulation (ESC) 1
Number of Leads Active in Study 4 Failure to Sense 3 Insulation (not further defined) 1
90
100
80
109876543210 Years After Implant
1 yr 2 yr 3 yr 4 yr% 97.7 96.5 93.8 90.5# 89 75 61 51
Effective Sample Size
4965 CapSure Epi Product Characteristics
US Market Release Sep-96 Serial Number Prefix LBT US Returned Product AnalysisRegistered US Implants 20,900 Type and/or Fixation Epicardial Suture-On V or A Conductor Fracture 163
Estimated Active US Implants 9,400 Polarity Unipolar Crimp/Weld/Bond 1
Advisories None Steroid Yes Insulation Breach 34
Other 2
Product Surveillance Registry Results Qualifying Complications 12 Total
Number of Leads Enrolled in Study 219 Conductor Fracture 5 Insulation (not further defined) 1
Cumulative Months of Follow-Up 7,617 Failure to Capture 3 Oversensing 2
Number of Leads Active in Study 25 Failure to Sense 1
90
100
80
109876543210 Years After Implant
1 yr 2 yr 3 yr 4 yr at 51 mo
% 99.0 98.2 97.2 92.7 91.3 # 140 117 92 63 55
Effective Sample Size
Lead
Sur
viva
l Pro
babi
lity
(%)
Lead
Sur
viva
l Pro
babi
lity
(%)
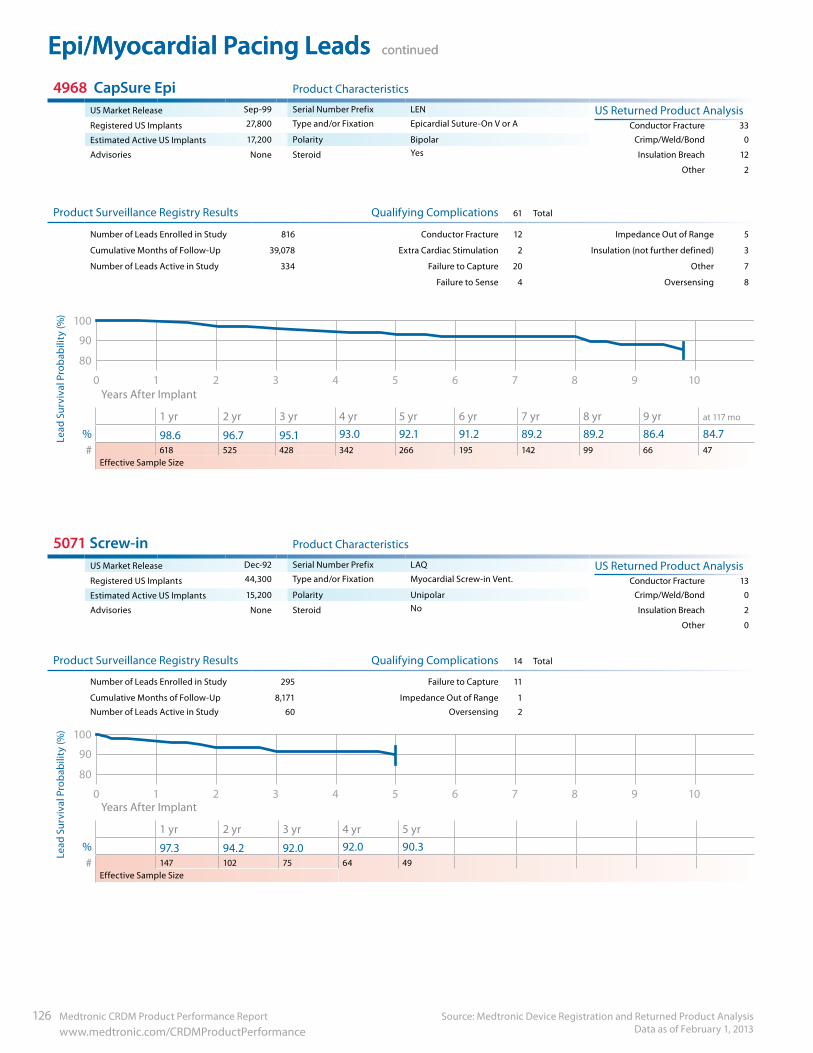
Epi/Myocardial Pacing Leads continued
Source: Medtronic Device Registration and Returned Product Analysis Data as of February 1, 2013
126 Medtronic CRDM Product Performance Report www.medtronic.com/CRDMProductPerformance
Epi/Myocardial Pacing Leads continued 4968 CapSure Epi Product Characteristics
US Market Release Sep-99 Serial Number Prefix LEN US Returned Product AnalysisRegistered US Implants 27,800 Type and/or Fixation Epicardial Suture-On V or A Conductor Fracture 33
Estimated Active US Implants 17,200 Polarity Bipolar Crimp/Weld/Bond 0
Advisories None Steroid Yes Insulation Breach 12
Other 2
Product Surveillance Registry Results Qualifying Complications 61 Total
Number of Leads Enrolled in Study 816 Conductor Fracture 12 Impedance Out of Range 5
Cumulative Months of Follow-Up 39,078 Extra Cardiac Stimulation 2 Insulation (not further defined) 3
Number of Leads Active in Study 334 Failure to Capture 20 Other 7
Failure to Sense 4 Oversensing 8
90
100
80
109876543210 Years After Implant
1 yr 2 yr 3 yr 4 yr 5 yr 6 yr 7 yr 8 yr 9 yr at 117 mo
% 98.6 96.7 95.1 93.0 92.1 91.2 89.2 89.2 86.4 84.7# 618 525 428 342 266 195 142 99 66 47
Effective Sample Size
5071 Screw-in Product Characteristics
US Market Release Dec-92 Serial Number Prefix LAQ US Returned Product AnalysisRegistered US Implants 44,300 Type and/or Fixation Myocardial Screw-in Vent. Conductor Fracture 13
Estimated Active US Implants 15,200 Polarity Unipolar Crimp/Weld/Bond 0
Advisories None Steroid No Insulation Breach 2
Other 0
Product Surveillance Registry Results Qualifying Complications 14 Total
Number of Leads Enrolled in Study 295 Failure to Capture 11
Cumulative Months of Follow-Up 8,171 Impedance Out of Range 1
Number of Leads Active in Study 60 Oversensing 2
90
100
80
109876543210 Years After Implant
1 yr 2 yr 3 yr 4 yr 5 yr% 97.3 94.2 92.0 92.0 90.3# 147 102 75 64 49
Effective Sample Size
Lead
Sur
viva
l Pro
babi
lity
(%)
Lead
Sur
viva
l Pro
babi
lity
(%)
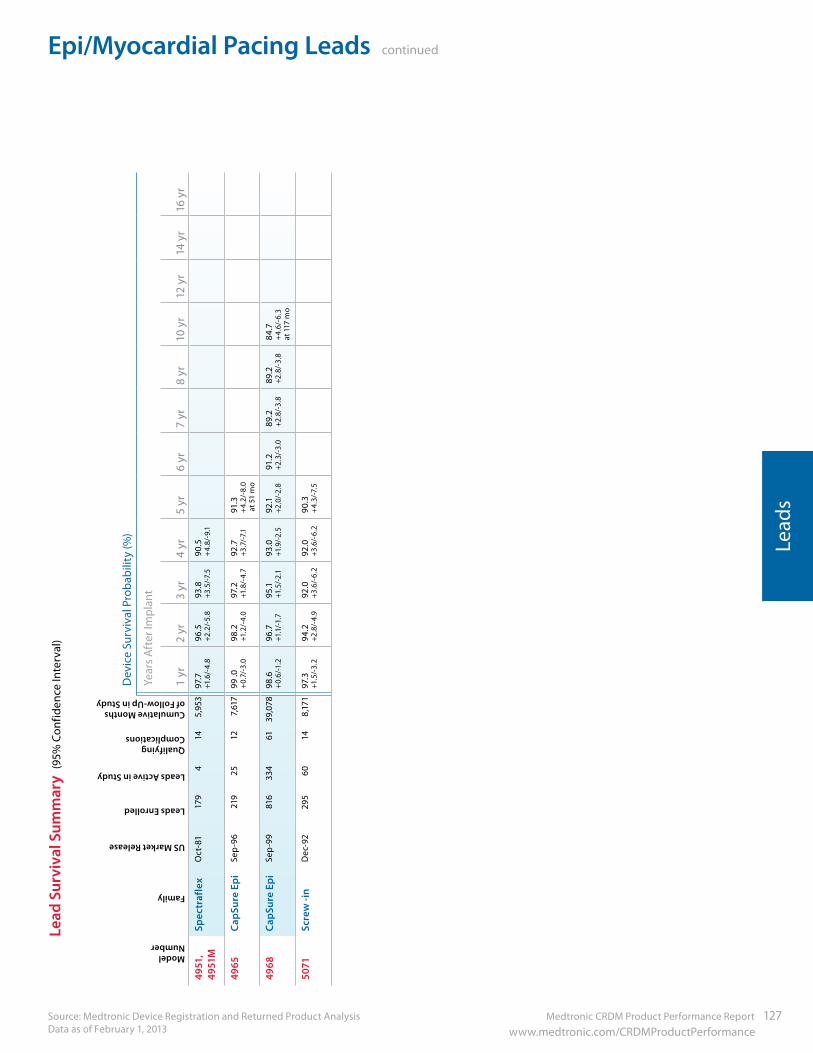
Medtronic CRDM Product Performance Report 127 www.medtronic.com/CRDMProductPerformance
Epi/Myocardial Pacing Leads continued
Source: Medtronic Device Registration and Returned Product Analysis Data as of February 1, 2013
Lead
s
Lead
Sur
viva
l Sum
mar
y (9
5% C
onfid
ence
Inte
rval
)
ModelNumber
Family
US Market Release
Leads Enrolled
Leads Active in Study
Qualifying Complications
Cumulative Months of Follow-Up in Study
Dev
ice
Surv
ival
Pro
babi
lity
(%)
Year
s A
fter
Impl
ant
1 yr
2 yr
3 yr
4 yr
5 yr
6 yr
7 yr
8 yr
10 y
r12
yr
14 y
r16
yr
4951
, 49
51M
Spec
traf
lex
Oct
-81
179
414
5,95
397
.7
+1.6
/-4.
896
.5
+2.2
/-5.
893
.8
+3.5
/-7.
590
.5
+4.
8/-9
.1
4965
CapS
ure
Epi
Sep
-96
219
2512
7,61
799
.0+
0.7/
-3.0
98.2
+1
.2/-
4.0
97.2
+1
.8/-
4.7
92.7
+3
.7/-
7.1
91.3
+
4.2/
-8.0
at 5
1 m
o
4968
CapS
ure
Epi
Sep
-99
816
334
6139
,078
98.6
+
0.6/
-1.2
96.7
+1
.1/-1
.795
.1
+1.5
/-2.
193
.0+1
.9/-
2.5
92.1
+2
.0/-
2.8
91.2
+2
.3/-
3.0
89.2
+2.8
/-3.
889
.2
+2.8
/-3.
884
.7
+4.
6/-6
.3
at 1
17 m
o
5071
Scre
w -i
nD
ec-9
229
560
148,
171
97.3
+1
.5/-
3.2
94.2
+2
.8/-
4.9
92.0
+3.6
/-6.
292
.0+3
.6/-
6.2
90.3
+
4.3/
-7.5
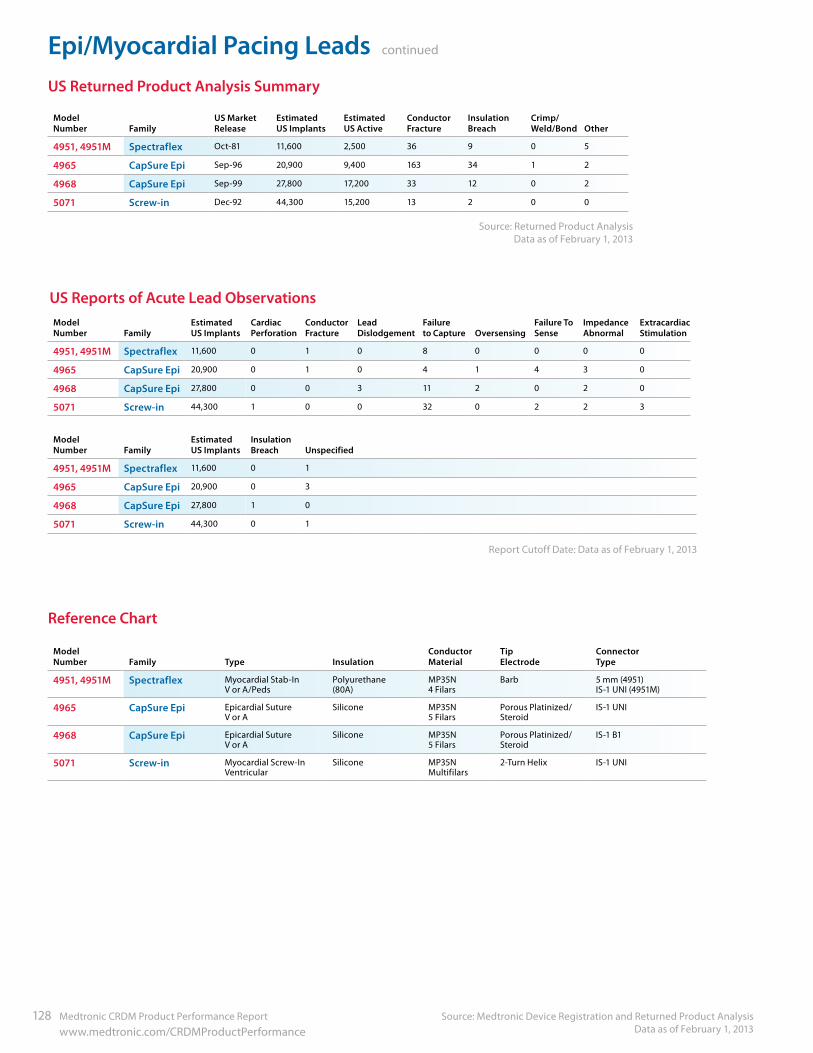
Epi/Myocardial Pacing Leads continued
Source: Medtronic Device Registration and Returned Product Analysis Data as of February 1, 2013
128 Medtronic CRDM Product Performance Report www.medtronic.com/CRDMProductPerformance
ModelNumber Family
US Market Release
Estimated US Implants
Estimated US Active
Conductor Fracture
Insulation Breach
Crimp/Weld/Bond Other
4951, 4951M Spectraflex Oct-81 11,600 2,500 36 9 0 5
4965 CapSure Epi Sep-96 20,900 9,400 163 34 1 2
4968 CapSure Epi Sep-99 27,800 17,200 33 12 0 2
5071 Screw-in Dec-92 44,300 15,200 13 2 0 0
Reference Chart
ModelNumber Family Type Insulation
Conductor Material
Tip Electrode
Connector Type
4951, 4951M Spectraflex Myocardial Stab-In V or A/Peds
Polyurethane (80A)
MP35N4 Filars
Barb 5 mm (4951) IS-1 UNI (4951M)
4965 CapSure Epi Epicardial Suture V or A
Silicone MP35N5 Filars
Porous Platinized/Steroid
IS-1 UNI
4968 CapSure Epi Epicardial Suture V or A
Silicone MP35N5 Filars
Porous Platinized/Steroid
IS-1 B1
5071 Screw-in Myocardial Screw-In Ventricular
Silicone MP35N Multifilars
2-Turn Helix IS-1 UNI
US Returned Product Analysis Summary
Source: Returned Product Analysis Data as of February 1, 2013
ModelNumber Family
Estimated US Implants
Cardiac Perforation
Conductor Fracture
Lead Dislodgement
Failure to Capture Oversensing
Failure To Sense
Impedance Abnormal
Extracardiac Stimulation
4951, 4951M Spectraflex 11,600 0 1 0 8 0 0 0 0
4965 CapSure Epi 20,900 0 1 0 4 1 4 3 0
4968 CapSure Epi 27,800 0 0 3 11 2 0 2 0
5071 Screw-in 44,300 1 0 0 32 0 2 2 3
ModelNumber Family
Estimated US Implants
InsulationBreach Unspecified
4951, 4951M Spectraflex 11,600 0 1
4965 CapSure Epi 20,900 0 3
4968 CapSure Epi 27,800 1 0
5071 Screw-in 44,300 0 1
US Reports of Acute Lead Observations
Report Cutoff Date: Data as of February 1, 2013
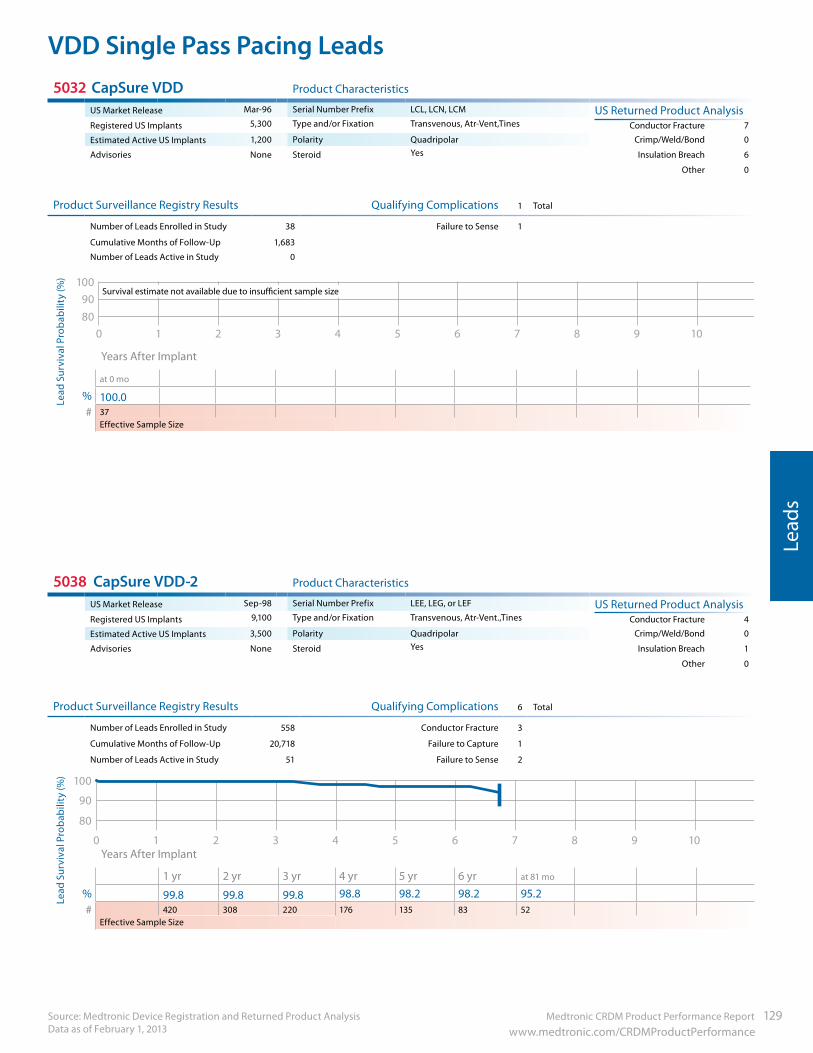
Medtronic CRDM Product Performance Report 129 www.medtronic.com/CRDMProductPerformance
VDD Single Pass Pacing Leads
Lead
s
Source: Medtronic Device Registration and Returned Product Analysis Data as of February 1, 2013
5032 CapSure VDD Product Characteristics
US Market Release Mar-96 Serial Number Prefix LCL, LCN, LCM US Returned Product AnalysisRegistered US Implants 5,300 Type and/or Fixation Transvenous, Atr-Vent,Tines Conductor Fracture 7
Estimated Active US Implants 1,200 Polarity Quadripolar Crimp/Weld/Bond 0
Advisories None Steroid Yes Insulation Breach 6
Other 0
Product Surveillance Registry Results Qualifying Complications 1 Total
Number of Leads Enrolled in Study 38 Failure to Sense 1
Cumulative Months of Follow-Up 1,683
Number of Leads Active in Study 0
Survival estimate not available due to insufficient sample size90
100
80109876543210
Years After Implant
at 0 mo
% 100.0# 37
Effective Sample Size
5038 CapSure VDD-2 Product Characteristics
US Market Release Sep-98 Serial Number Prefix LEE, LEG, or LEF US Returned Product AnalysisRegistered US Implants 9,100 Type and/or Fixation Transvenous, Atr-Vent.,Tines Conductor Fracture 4
Estimated Active US Implants 3,500 Polarity Quadripolar Crimp/Weld/Bond 0
Advisories None Steroid Yes Insulation Breach 1
Other 0
Product Surveillance Registry Results Qualifying Complications 6 Total
Number of Leads Enrolled in Study 558 Conductor Fracture 3
Cumulative Months of Follow-Up 20,718 Failure to Capture 1
Number of Leads Active in Study 51 Failure to Sense 2
90
100
80
109876543210 Years After Implant
1 yr 2 yr 3 yr 4 yr 5 yr 6 yr at 81 mo
% 99.8 99.8 99.8 98.8 98.2 98.2 95.2# 420 308 220 176 135 83 52
Effective Sample Size
Lead
Sur
viva
l Pro
babi
lity
(%)
Lead
Sur
viva
l Pro
babi
lity
(%)
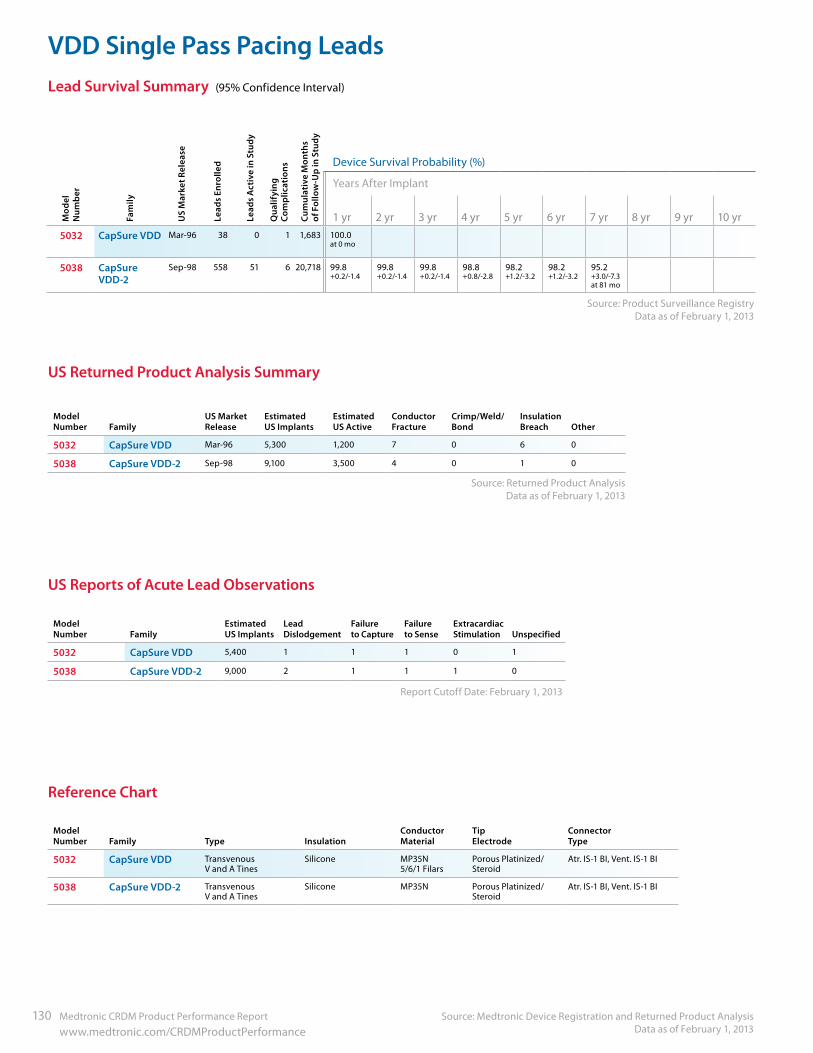
VDD Single Pass Pacing Leads
Source: Medtronic Device Registration and Returned Product Analysis Data as of February 1, 2013
130 Medtronic CRDM Product Performance Report www.medtronic.com/CRDMProductPerformance
Mod
elN
umbe
r
Fam
ily
US
Mar
ket R
elea
se
Lead
s En
rolle
d
Lead
s A
ctiv
e in
Stu
dy
Qua
lifyi
ng
Com
plic
atio
ns
Cum
ulat
ive
Mon
ths
of F
ollo
w-U
p in
Stu
dy
Device Survival Probability (%)
Years After Implant
1 yr 2 yr 3 yr 4 yr 5 yr 6 yr 7 yr 8 yr 9 yr 10 yr5032 CapSure VDD Mar-96 38 0 1 1,683 100.0
at 0 mo
5038 CapSure VDD-2
Sep-98 558 51 6 20,718 99.8 +0.2/-1.4
99.8 +0.2/-1.4
99.8 +0.2/-1.4
98.8 +0.8/-2.8
98.2 +1.2/-3.2
98.2 +1.2/-3.2
95.2+3.0/-7.3 at 81 mo
Lead Survival Summary (95% Confidence Interval)
Reference Chart
ModelNumber Family Type Insulation
Conductor Material
Tip Electrode
Connector Type
5032 CapSure VDD Transvenous V and A Tines
Silicone MP35N5/6/1 Filars
Porous Platinized/Steroid
Atr. IS-1 BI, Vent. IS-1 BI
5038 CapSure VDD-2 Transvenous V and A Tines
Silicone MP35N Porous Platinized/Steroid
Atr. IS-1 BI, Vent. IS-1 BI
Source: Product Surveillance RegistryData as of February 1, 2013
US Returned Product Analysis Summary
ModelNumber Family
US MarketRelease
Estimated US Implants
Estimated US Active
Conductor Fracture
Crimp/Weld/Bond
Insulation Breach Other
5032 CapSure VDD Mar-96 5,300 1,200 7 0 6 0
5038 CapSure VDD-2 Sep-98 9,100 3,500 4 0 1 0
Source: Returned Product Analysis Data as of February 1, 2013
ModelNumber Family
Estimated US Implants
Lead Dislodgement
Failure to Capture
Failure to Sense
Extracardiac Stimulation Unspecified
5032 CapSure VDD 5,400 1 1 1 0 1
5038 CapSure VDD-2 9,000 2 1 1 1 0
US Reports of Acute Lead Observations
Report Cutoff Date: February 1, 2013
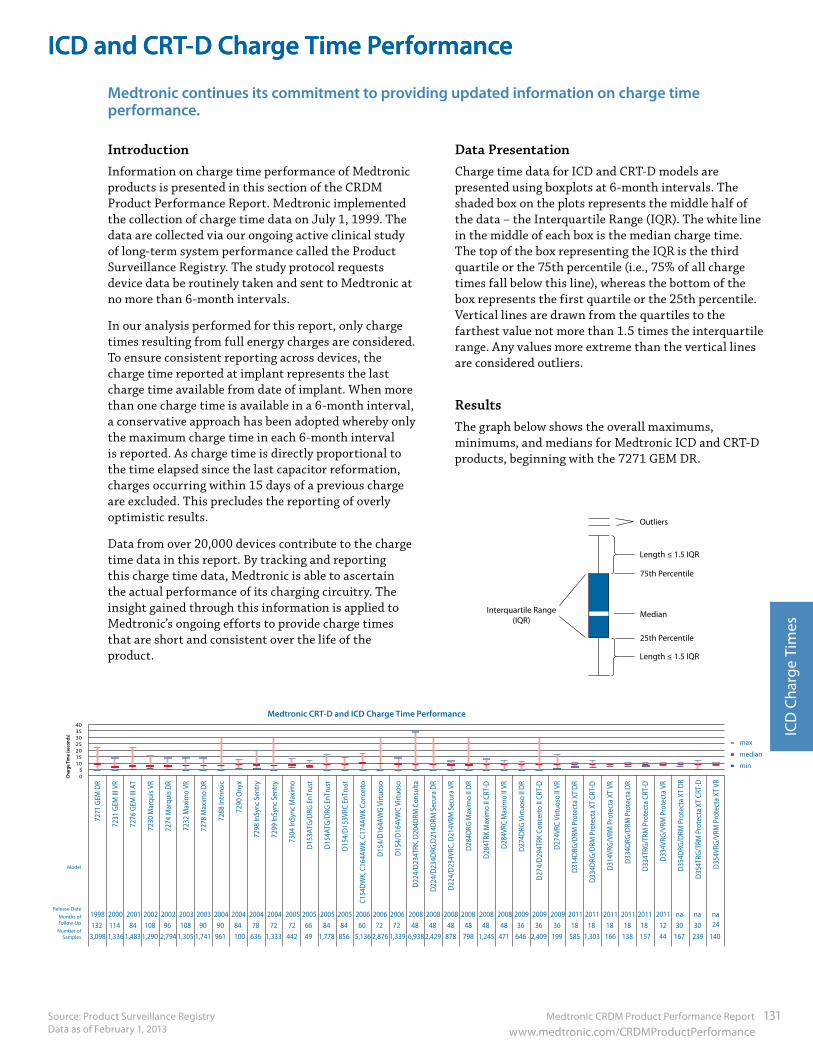
Medtronic CRDM Product Performance Report 131 www.medtronic.com/CRDMProductPerformance
ICD and CRT-D Charge Time Performance
ICD
Cha
rge
Tim
es
Source: Product Surveillance RegistryData as of February 1, 2013
ICD and CRT-D Charge Time Performance
Medtronic continues its commitment to providing updated information on charge time performance.
IntroductionInformation on charge time performance of Medtronic products is presented in this section of the CRDM Product Performance Report. Medtronic implemented the collection of charge time data on July 1, 1999. The data are collected via our ongoing active clinical study of long-term system performance called the Product Surveillance Registry. The study protocol requests device data be routinely taken and sent to Medtronic at no more than 6-month intervals.
In our analysis performed for this report, only charge times resulting from full energy charges are considered. To ensure consistent reporting across devices, the charge time reported at implant represents the last charge time available from date of implant. When more than one charge time is available in a 6-month interval, a conservative approach has been adopted whereby only the maximum charge time in each 6-month interval is reported. As charge time is directly proportional to the time elapsed since the last capacitor reformation, charges occurring within 15 days of a previous charge are excluded. This precludes the reporting of overly optimistic results.
Data from over 20,000 devices contribute to the charge time data in this report. By tracking and reporting this charge time data, Medtronic is able to ascertain the actual performance of its charging circuitry. The insight gained through this information is applied to Medtronic’s ongoing efforts to provide charge times that are short and consistent over the life of the product.
Data PresentationCharge time data for ICD and CRT-D models are presented using boxplots at 6-month intervals. The shaded box on the plots represents the middle half of the data – the Interquartile Range (IQR). The white line in the middle of each box is the median charge time. The top of the box representing the IQR is the third quartile or the 75th percentile (i.e., 75% of all charge times fall below this line), whereas the bottom of the box represents the first quartile or the 25th percentile. Vertical lines are drawn from the quartiles to the farthest value not more than 1.5 times the interquartile range. Any values more extreme than the vertical lines are considered outliers.
ResultsThe graph below shows the overall maximums, minimums, and medians for Medtronic ICD and CRT-D products, beginning with the 7271 GEM DR.
Outliers
Median
Length ≤ 1.5 IQR
Interquartile Range(IQR)
Length ≤ 1.5 IQR
75th Percentile
25th Percentile
Model
Release Date
Months ofFollow-Up
Number ofSamples
max
median
min
Char
ge Ti
me
(seco
nds)
5 0
10 15 20 25 30 35 40
7271
GEM
DR
7231
GEM
III V
R
7276
GEM
III A
T
7230
Mar
quis
VR
7274
Mar
quis
DR
7232
Max
imo
VR
7278
Max
imo
DR
7288
Intr
insi
c
7290
Ony
x
7298
InSy
nc S
entr
y
7299
InSy
nc S
entr
y
7304
InSy
nc M
axim
o
D15
3ATG
/DRG
EnT
rust
D15
4ATG
/DRG
EnT
rust
D15
4/D
153V
RC E
nTru
st
C154
DW
K, C
164A
WK,
C17
4AW
K Co
ncer
to
D15
4/D
164A
WG
Virt
uoso
D15
4/D
164V
WC
Virt
uoso
D22
4/D
234T
RK, D
204D
RM C
onsu
lta
D22
4/D
234D
RG,D
214D
RM S
ecur
a D
R
D22
4/D
234V
RC, D
214V
RM S
ecur
a VR
D28
4DRG
Max
imo
II D
R
D28
4TRK
Max
imo
II CR
T-D
D28
4VRC
Max
imo
II VR
D27
4DRG
Virt
uoso
II D
R
D27
4/D
294T
RK C
once
rto
II CR
T-D
D27
4VRC
Virt
uoso
II V
R
D31
4DRG
/DRM
Pro
tect
a XT
DR
D33
4DRG
/DRM
Pro
tect
a XT
CRT
-D
D31
4VRG
/VRM
Pro
tect
a XT
VR
D33
4DRG
/DRM
Pro
tect
a D
R
D33
4TRG
/TRM
Pro
tect
a CR
T-D
D33
4VRG
/VRM
Pro
tect
a VR
1998 2000 2001 2002 2002 2003 2003 2004 2004 2004 2004 2005 2005 2005 2005 2006 2006 2006 2008 2008 2008 2008 2008 2008 2009 2009 2009 2011 2011 2011 2011 2011 2011
132 114 84 108 96 108 90 90 84 78 72 72 66 84 84 60 72 72 48 48 48 48 48 48 36 36 36 18 18 18 18 18 12
3,098 1,336 1,483 1,290 2,794 1,305 1,741 961 100 636 1,333 442 49 1,778 856 5,136 2,876 1,339 6,938 2,429 878 798 1,245 471 646 2,409 199 585 1,303 166 138 157 44
Medtronic CRT-D and ICD Charge Time Performance
D35
4DRG
/DRM
Pro
tect
a XT
DR
D35
4TRG
/TRM
Pro
tect
a XT
CRT
-D
D35
4VRG
/VRM
Pro
tect
a XT
VR
na na na
30 30 24
167 239 140
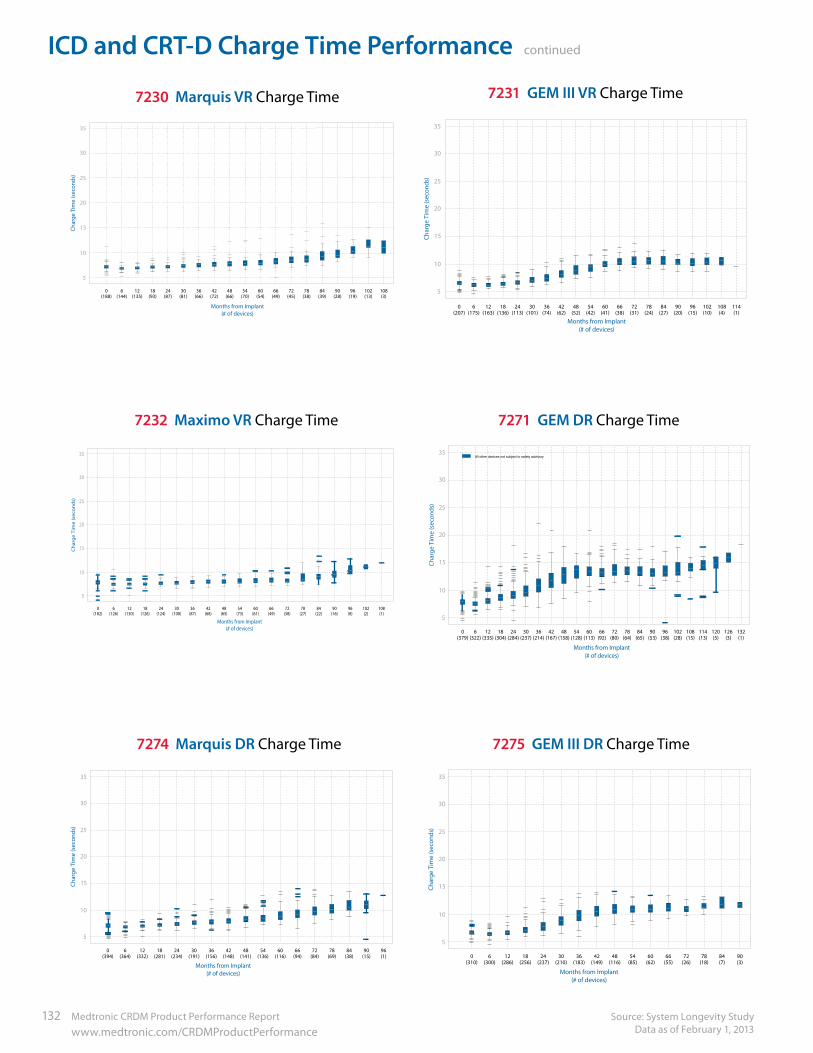
ICD and CRT-D Charge Time Performance continued
Source: System Longevity StudyData as of February 1, 2013
132 Medtronic CRDM Product Performance Report www.medtronic.com/CRDMProductPerformance
Char
ge T
ime
(sec
onds
)
5
10
15
20
25
30
35
0(207)
6(175)
12(163)
18(136)
24(113)
30(101)
36(74)
42(62)
48(52)
54(42)
60(41)
66(38)
72(31)
78(24)
84(27)
90(20)
96(15)
102(10)
108(4)
114(1)
Months from Implant(# of devices)
7231 GEM III VR Charge TimeCh
arge
Tim
e (s
econ
ds)
5
10
15
20
25
30
35
0(394)
6(364)
12(332)
18(281)
24(234)
30(191)
36(156)
42(148)
48(141)
54(136)
60(116)
66(94)
72(84)
78(69)
84(38)
90(15)
Months from Implant(# of devices)
96(1)
7274 Marquis DR Charge Time
Char
ge T
ime
(sec
onds
)
5
10
15
20
25
30
35
0(188)
6(144)
12(135)
18(93)
24(87)
30(81)
36(66)
42(72)
48(66)
54(70)
60(54)
66(49)
72(45)
78(38)
84(39)
90(28)
96(19)
Months from Implant(# of devices)
102(13)
108(3)
7230 Marquis VR Charge Time
Ch
arg
e Ti
me
(sec
on
ds)
5
10
15
20
25
30
35
0(182)
6(126)
12(130)
18(126)
24(124)
30(100)
36(87)
42(68)
48(65)
54(73)
60(61)
66(49)
72(38)
78(27)
84(22)
90(16)
Months from Implant(# of devices)
96(8)
102(2)
108(1)
7232 Maximo VR Charge TimeCh
arge
Tim
e (s
econ
ds)
5
10
15
20
25
30
35
0(379)
6(322)
12(335)
18(304)
24(284)
30(237)
36(214)
42(167)
48(158)
54(128)
60(113)
66(92)
72(80)
78(64)
84(65)
90(53)
96(38)
102(28)
108(15)
114(13)
120(5)
126(3)
132(1)
Months from Implant(# of devices)
All other devices not subject to safety advisory
7271 GEM DR Charge TimeCh
arge
Tim
e (s
econ
ds)
5
10
15
20
25
30
35
0(310)
6(300)
12(286)
18(256)
24(237)
30(210)
36(183)
42(149)
48(116)
54(85)
60(62)
66(55)
72(26)
78(18)
84(7)
90(3)
Months from Implant(# of devices)
7275 GEM III DR Charge Time
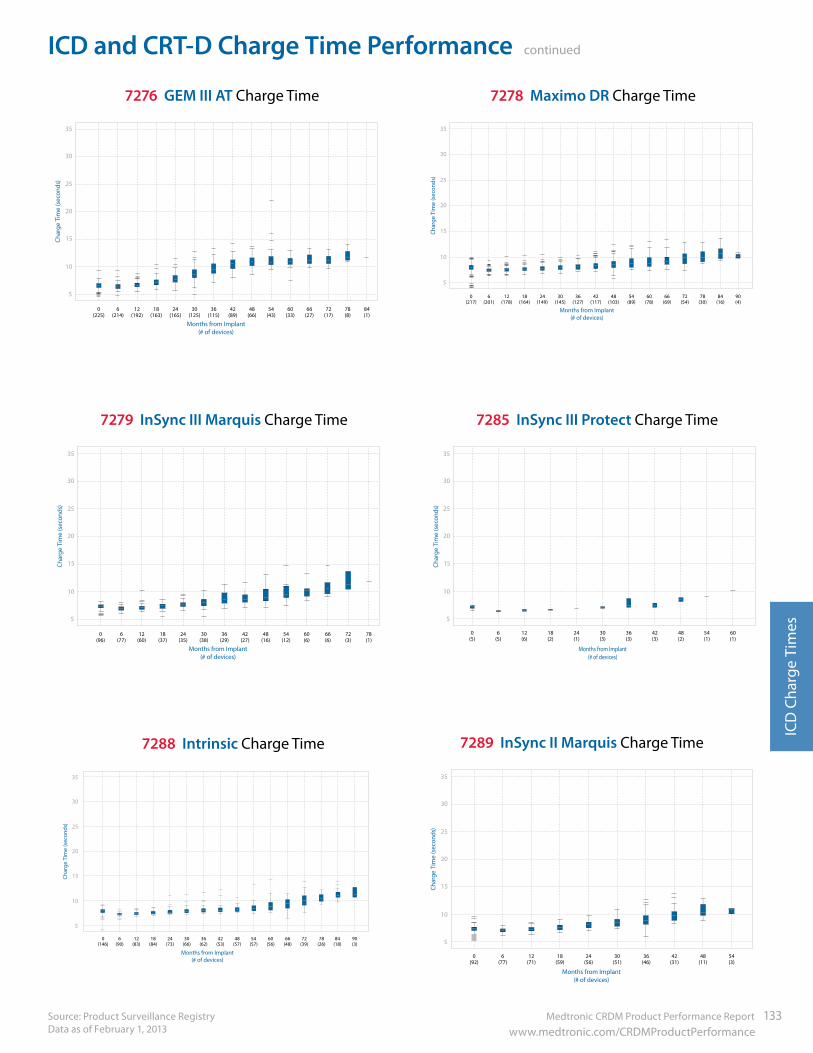
Medtronic CRDM Product Performance Report 133 www.medtronic.com/CRDMProductPerformance
ICD and CRT-D Charge Time Performance continued
ICD
Cha
rge
Tim
es
Source: Product Surveillance RegistryData as of February 1, 2013
Char
ge T
ime
(sec
onds
)
15
20
25
30
35
5
10
0(217)
6(201)
12(178)
18(164)
24(149)
30(145)
36(127)
42(117)
48(103)
54(89)
60(78)
66(69)
72(54)
78(30)
84(16)
Months from Implant(# of devices)
90(4)
7278 Maximo DR Charge Time
5
10
15
20
25
30
35
0(5)
6(5)
12(6)
18(2)
24(1)
30(3)
36(3)
42(3)
48(2)
54(1)
60(1)
Char
ge T
ime
(sec
onds
)
Months from Implant(# of devices)
7285 InSync III Protect Charge Time
Char
ge T
ime
(sec
onds
)
5
10
15
20
25
30
35
0(146)
6(90)
12(83)
18(84)
24(73)
30(66)
36(62)
42(53)
48(57)
54(57)
60(56)
66(48)
72(39)
78(26)
Months from Implant(# of devices)
84(18)
90(3)
7288 Intrinsic Charge Time
5
10
0(225)
6(214)
12(192)
18(163)
24(165)
30(125)
36(115)
42(89)
48(66)
54(43)
60(33)
66(27)
72(17)
78(8)
84(1)
Char
ge T
ime
(sec
onds
)
15
20
25
30
35
Months from Implant(# of devices)
7276 GEM III AT Charge Time
Char
ge T
ime
(sec
onds
)
5
10
15
20
25
30
35
0(96)
6(77)
12(60)
18(37)
24(35)
30(38)
36(29)
42(27)
48(16)
54(12)
60(6)
66(6)
72(3)
78(1)
Months from Implant(# of devices)
7279 InSync III Marquis Charge TimeCh
arge
Tim
e (s
econ
ds)
5
10
15
20
25
30
35
0(92)
6(77)
12(71)
18(59)
24(56)
30(51)
42(31)
48(11)
54(3)
Months from Implant(# of devices)
36(46)
7289 InSync II Marquis Charge Time
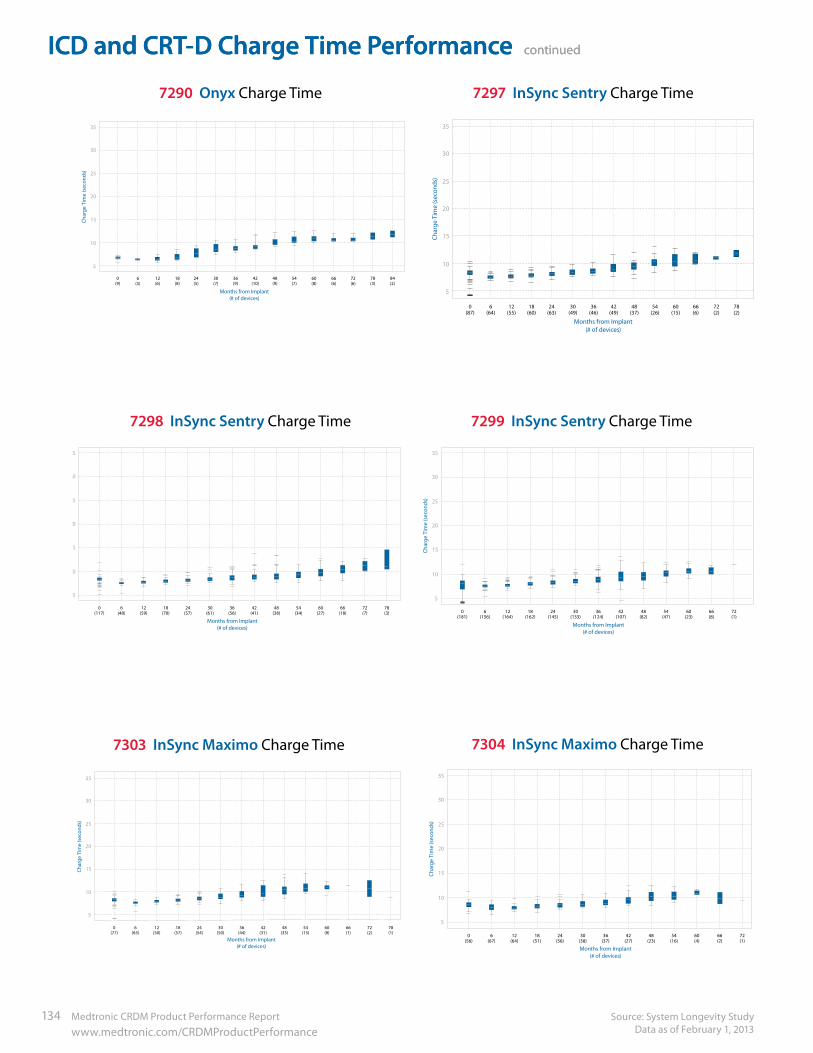
ICD and CRT-D Charge Time Performance continued
Source: System Longevity StudyData as of February 1, 2013
134 Medtronic CRDM Product Performance Report www.medtronic.com/CRDMProductPerformance
Char
ge T
ime
(sec
onds
)
5
10
15
20
25
30
35
0(9)
6(5)
12(6)
18(8)
24(5)
30(7)
36(9)
42(10)
48(9)
54(7)
60(8)
66(6)
Months from Implant(# of devices)
72(6)
78(3)
84(2)
7290 Onyx Charge Time
ICD and CRT-D Charge Time Performance continued
Char
ge T
ime
(sec
onds
)
5
10
15
20
25
30
35
0(87)
6(64)
12(55)
18(60)
24(63)
30(49)
36(46)
42(49)
48(37)
54(26)
60(15)
66(6)
72(2)
78(2)
Months from Implant(# of devices)
7297 InSync Sentry Charge TimeCh
arge
Tim
e (s
econ
ds)
5
10
15
20
25
30
35
0(77)
6(63)
12(50)
18(57)
24(54)
30(50)
36(44)
42(31)
48(33)
54(15)
60(8)
Months from Implant(# of devices)
66(1)
72(2)
78(1)
7303 InSync Maximo Charge Time
Char
ge T
ime
(sec
onds
)
5
10
15
20
25
30
35
0(181)
6(156)
12(164)
18(162)
24(145)
30(133)
36(124)
42(107)
48(82)
54(47)
60(23)
Months from Implant(# of devices)
72(1)
66(8)
7299 InSync Sentry Charge TimeCh
arge
Tim
e (s
econ
ds)
5
10
15
20
25
30
35
0(56)
6(67)
12(64)
18(51)
24(56)
30(38)
36(37)
42(27)
48(23)
54(16)
60(4)
Months from Implant(# of devices)
66(2)
72(1)
7304 InSync Maximo Charge Time
Char
ge T
ime
(sec
onds
)
5
10
15
20
25
30
35
0(117)
6(48)
12(59)
18(70)
24(57)
30(61)
36(56)
42(41)
48(38)
54(34)
60(27)
Months from Implant(# of devices)
66(18)
72(7)
78(3)
7298 InSync Sentry Charge Time
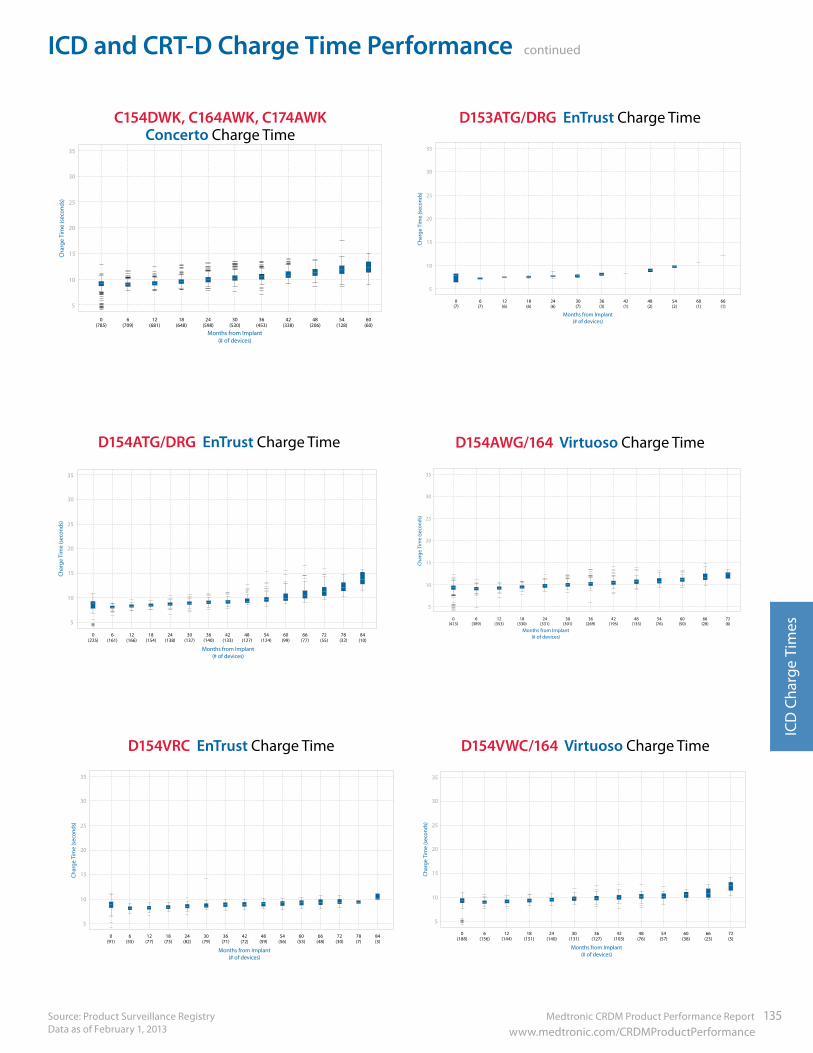
Medtronic CRDM Product Performance Report 135 www.medtronic.com/CRDMProductPerformance
ICD and CRT-D Charge Time Performance continued
ICD
Cha
rge
Tim
es
Source: Product Surveillance RegistryData as of February 1, 2013
Char
ge T
ime
(sec
onds
)
5
10
15
20
25
30
35
0(7)
6(7)
12(6)
18(6)
24(6)
30(7)
36(3)
42(1)
48(2)
54(2)
Months from Implant(# of devices)
60(1)
66(1)
D153ATG/DRG EnTrust Charge Time
Char
ge T
ime
(sec
onds
)
5
10
15
20
25
30
35
0(225)
6(161)
12(166)
18(154)
24(138)
30(137)
36(140)
42(133)
48(127)
54(124)
60(99)
66(77)
72(55)
Months from Implant(# of devices)
78(32)
84(10)
D154ATG/DRG EnTrust Charge Time
Char
ge T
ime
(sec
onds
)
5
10
15
20
25
30
35
0(413)
6(389)
12(353)
18(330)
24(331)
30(301)
36(269)
42(195)
48(135)
54(76)
Months from Implant(# of devices)
60(50)
66(28)
72(6)
D154AWG/164 Virtuoso Charge Time
Char
ge T
ime
(sec
onds
)
5
10
15
20
25
30
35
0(91)
6(55)
12(77)
18(73)
24(82)
30(79)
36(71)
42(72)
48(59)
54(56)
72(30)
66(48)
60(53)
Months from Implant(# of devices)
78(7)
84(3)
D154VRC EnTrust Charge Time
Char
ge T
ime
(sec
onds
)
5
10
15
20
25
30
35
0(188)
6(156)
12(144)
18(151)
24(140)
30(131)
36(127)
48(76)
42(103)
54(57)
60(38)
Months from Implant(# of devices)
66(23)
72(5)
D154VWC/164 Virtuoso Charge Time
Char
ge T
ime
(sec
onds
)
5
10
15
20
25
30
35
0(785)
6(709)
12(681)
18(648)
24(598)
30(530)
36(453)
42(338)
48(206)
54(128)
Months from Implant(# of devices)
60(60)
C154DWK, C164AWK, C174AWK Concerto Charge Time
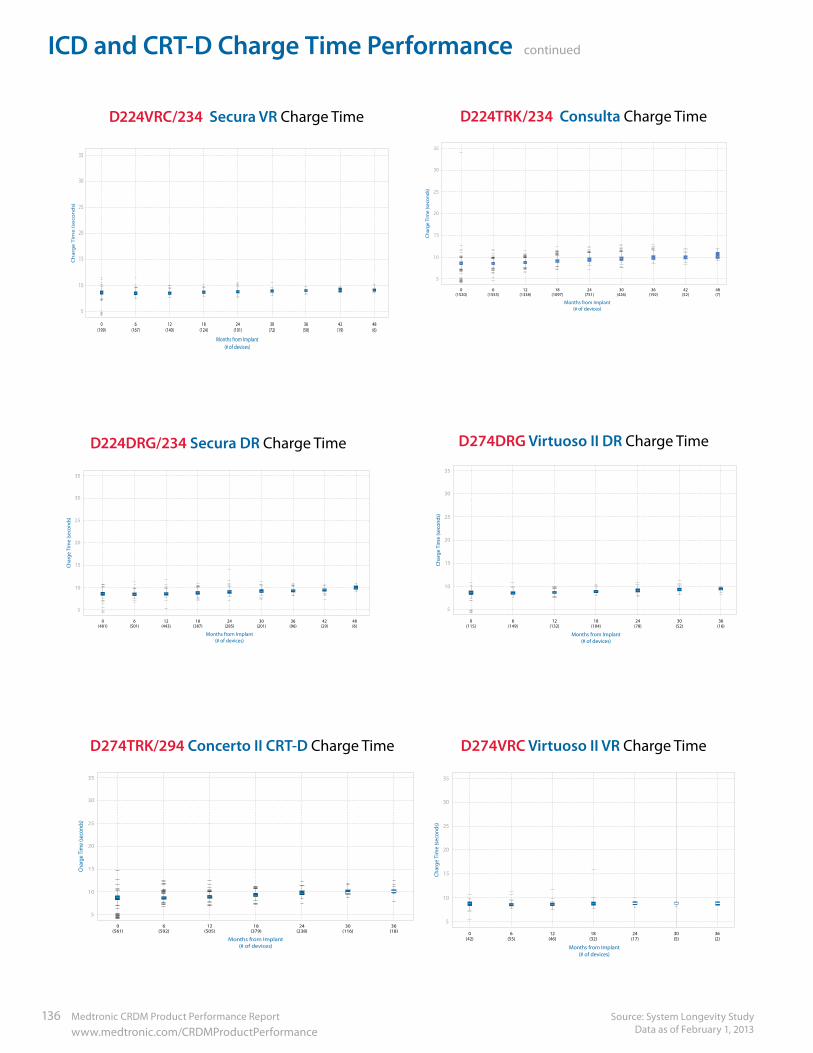
ICD and CRT-D Charge Time Performance continued
Source: System Longevity StudyData as of February 1, 2013
136 Medtronic CRDM Product Performance Report www.medtronic.com/CRDMProductPerformance
Char
ge T
ime
(sec
onds
)
Months from Implant(# of devices)
5
10
15
20
25
30
35
0(481)
12(443)
6(501)
24(285)
30(201)
18(387)
36(96)
42(29)
48(6)
D224DRG/234 Secura DR Charge Time
D224TRK/234 Consulta Charge Time
Char
ge T
ime
(sec
onds
)
Months from Implant(# of devices)
5
10
15
20
25
30
35
0(1520)
12(1338)
6(1555)
18(1097)
24(751)
30(426)
36(192)
42(52)
48(7)
D224VRC/234 Secura VR Charge Time
Ch
arg
e T
ime
(se
con
ds)
Months from Implant(# of devices)
5
10
15
20
25
30
35
0(199)
12(140)
18(124)
24(101)
6(167)
30(72)
36(50)
42(19)
48(6)
Char
ge T
ime
(sec
onds
)
Months from Implant(# of devices)
5
10
15
20
25
30
35
0(115)
12(132)
6(149)
24(78)
18(104)
30(52)
36(16)
D274DRG Virtuoso II DR Charge TimeCh
arge
Tim
e (s
econ
ds)
Months from Implant(# of devices)
5
10
15
20
25
30
35
0(42)
12(46)
6(55)
24(17)
18(32)
30(5)
36(2)
D274VRC Virtuoso II VR Charge Time
Char
ge T
ime
(seco
nds)
Months from Implant(# of devices)
5
10
15
20
25
30
35
0(561)
12(505)
6(592)
24(238)
18(379)
30(116)
36(18)
D274TRK/294 Concerto II CRT-D Charge Time
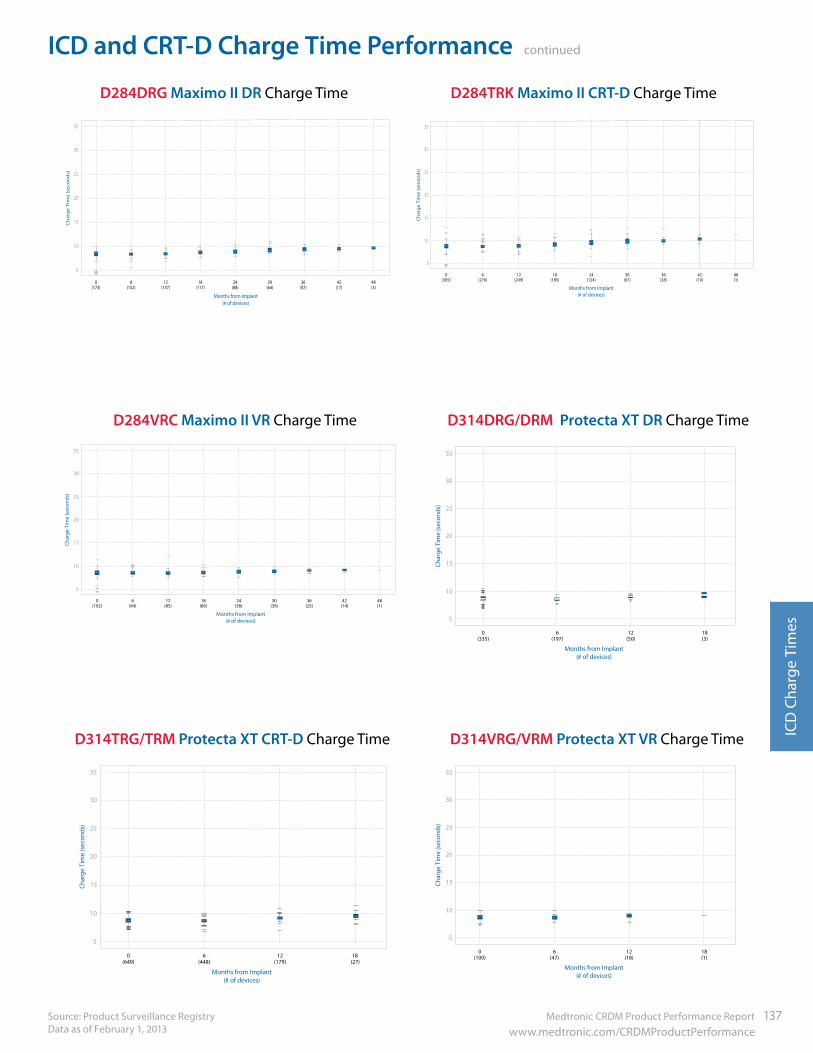
Medtronic CRDM Product Performance Report 137 www.medtronic.com/CRDMProductPerformance
ICD and CRT-D Charge Time Performance continued
ICD
Cha
rge
Tim
es
Source: Product Surveillance RegistryData as of February 1, 2013
Char
ge T
ime
(sec
onds
)
Months from Implant(# of devices)
5
10
15
20
25
30
35
0(335)
12(50)
6(197)
18(3)
D314DRG/DRM Protecta XT DR Charge Time
Char
ge T
ime
(sec
onds
)
Months from Implant(# of devices)
5
10
15
20
25
30
35
0(649)
12(179)
6(448)
18(27)
D314TRG/TRM Protecta XT CRT-D Charge Time
Ch
arg
e Ti
me
(sec
ond
s)
Months from Implant(# of devices)
5
10
15
20
25
30
35
0(305)
12(249)
6(276)
24(124)
18(185)
30(67)
36(28)
42(10)
48(1)
D284TRK Maximo II CRT-D Charge Time
Char
ge T
ime
(sec
onds
)
Months from Implant(# of devices)
5
10
15
20
25
30
35
0(102)
12(85)
6(84)
24(56)
18(66)
30(38)
36(25)
42(14)
48(1)
D284VRC Maximo II VR Charge TimeCh
arge
Tim
e (s
econ
ds)
Months from Implant(# of devices)
5
10
15
20
25
30
35
0(100)
12(18)
6(47)
18(1)
D314VRG/VRM Protecta XT VR Charge Time
Ch
arg
e Ti
me
(sec
on
ds)
Months from Implant(# of devices)
5
10
15
20
25
30
35
0(173)
12(137)
6(152)
24(88)
18(117)
30(64)
36(47)
42(17)
48(3)
D284DRG Maximo II DR Charge Time
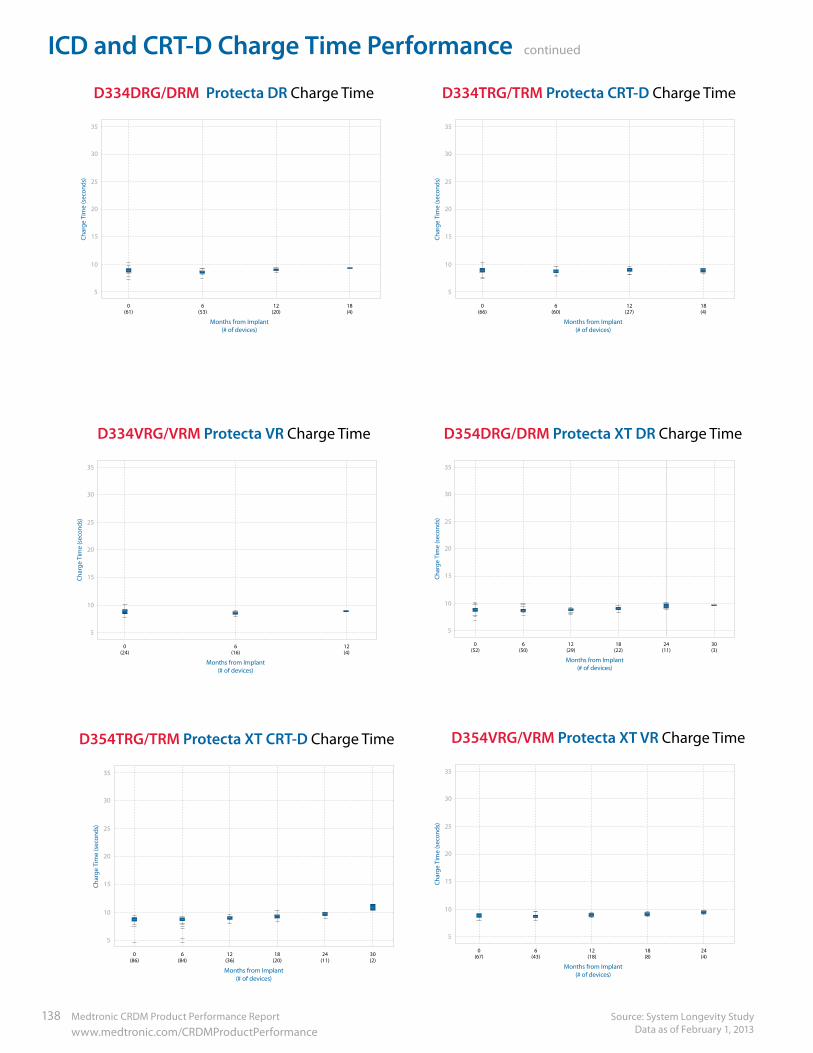
ICD and CRT-D Charge Time Performance continued
Source: System Longevity StudyData as of February 1, 2013
138 Medtronic CRDM Product Performance Report www.medtronic.com/CRDMProductPerformance
Char
ge T
ime
(sec
onds
)
Months from Implant(# of devices)
5
10
15
20
25
30
35
0(66)
12(27)
6(60)
18(4)
D334TRG/TRM Protecta CRT-D Charge TimeCh
arge
Tim
e (s
econ
ds)
Months from Implant(# of devices)
5
10
15
20
25
30
35
0(61)
12(20)
6(53)
18(4)
D334DRG/DRM Protecta DR Charge TimeCh
arge
Tim
e (s
econ
ds)
Months from Implant(# of devices)
5
10
15
20
25
30
35
0(24)
12(4)
6(16)
D334VRG/VRM Protecta VR Charge TimeCh
arge
Tim
e (s
econ
ds)
Months from Implant(# of devices)
5
10
15
20
25
30
35
0(52)
12(29)
6(50)
24(11)
18(22)
30(3)
D354DRG/DRM Protecta XT DR Charge Time
Char
ge T
ime
(sec
onds
)
Months from Implant(# of devices)
5
10
15
20
25
30
35
0(86)
12(36)
6(84)
24(11)
18(20)
30(2)
D354TRG/TRM Protecta XT CRT-D Charge Time
Char
ge T
ime
(sec
onds
)
Months from Implant(# of devices)
5
10
15
20
25
30
35
0(67)
12(18)
6(43)
24(4)
18(8)
D354VRG/VRM Protecta XT VR Charge Time
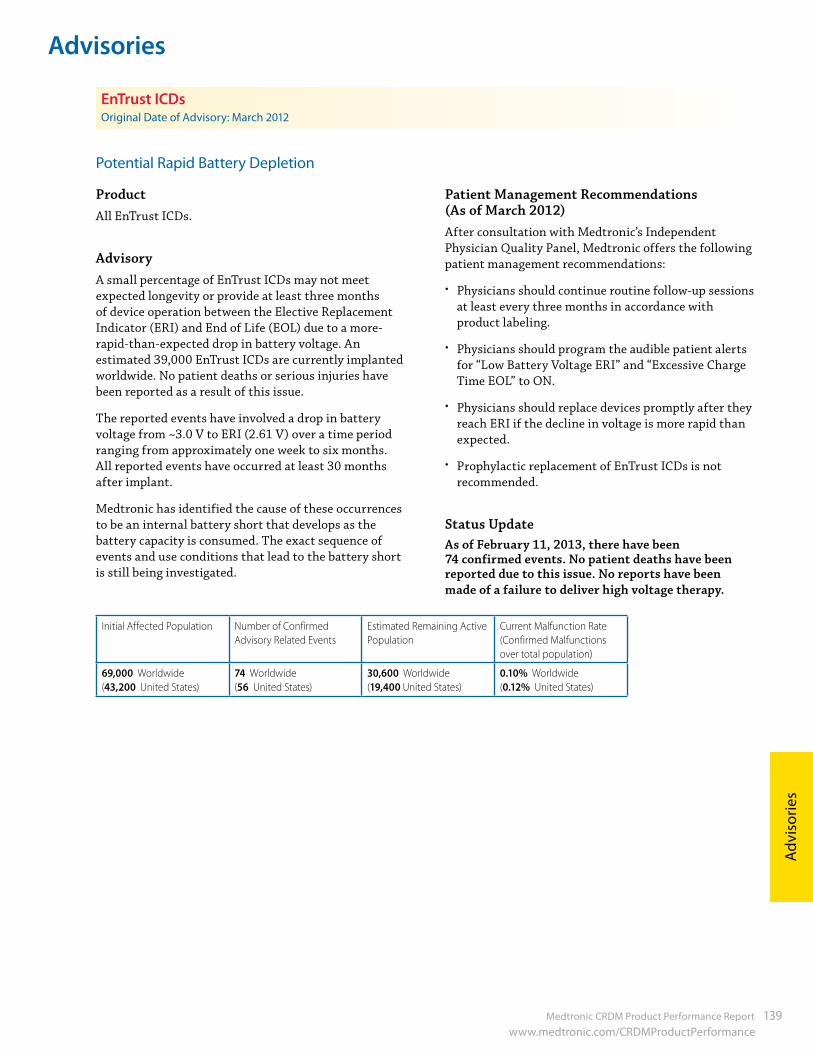
Medtronic CRDM Product Performance Report 139 www.medtronic.com/CRDMProductPerformance
Advisories
Adv
isor
ies
ProductAll EnTrust ICDs.
AdvisoryA small percentage of EnTrust ICDs may not meet expected longevity or provide at least three months of device operation between the Elective Replacement Indicator (ERI) and End of Life (EOL) due to a more-rapid-than-expected drop in battery voltage. An estimated 39,000 EnTrust ICDs are currently implanted worldwide. No patient deaths or serious injuries have been reported as a result of this issue.
The reported events have involved a drop in battery voltage from ~3.0 V to ERI (2.61 V) over a time period ranging from approximately one week to six months. All reported events have occurred at least 30 months after implant.
Medtronic has identified the cause of these occurrences to be an internal battery short that develops as the battery capacity is consumed. The exact sequence of events and use conditions that lead to the battery short is still being investigated.
Patient Management Recommendations (As of March 2012)After consultation with Medtronic’s Independent Physician Quality Panel, Medtronic offers the following patient management recommendations:
• Physicians should continue routine follow-up sessions at least every three months in accordance with product labeling.
• Physicians should program the audible patient alerts for “Low Battery Voltage ERI” and “Excessive Charge Time EOL” to ON.
• Physicians should replace devices promptly after they reach ERI if the decline in voltage is more rapid than expected.
• Prophylactic replacement of EnTrust ICDs is not recommended.
Status UpdateAs of February 11, 2013, there have been 74 confirmed events. No patient deaths have been reported due to this issue. No reports have been made of a failure to deliver high voltage therapy.
EnTrust ICDsOriginal Date of Advisory: March 2012
Potential Rapid Battery Depletion
Initial Affected Population Number of Confirmed Advisory Related Events
Estimated Remaining Active Population
Current Malfunction Rate (Confirmed Malfunctions over total population)
69,000 Worldwide (43,200 United States)
74 Worldwide (56 United States)
30,600 Worldwide (19,400 United States)
0.10% Worldwide (0.12% United States)
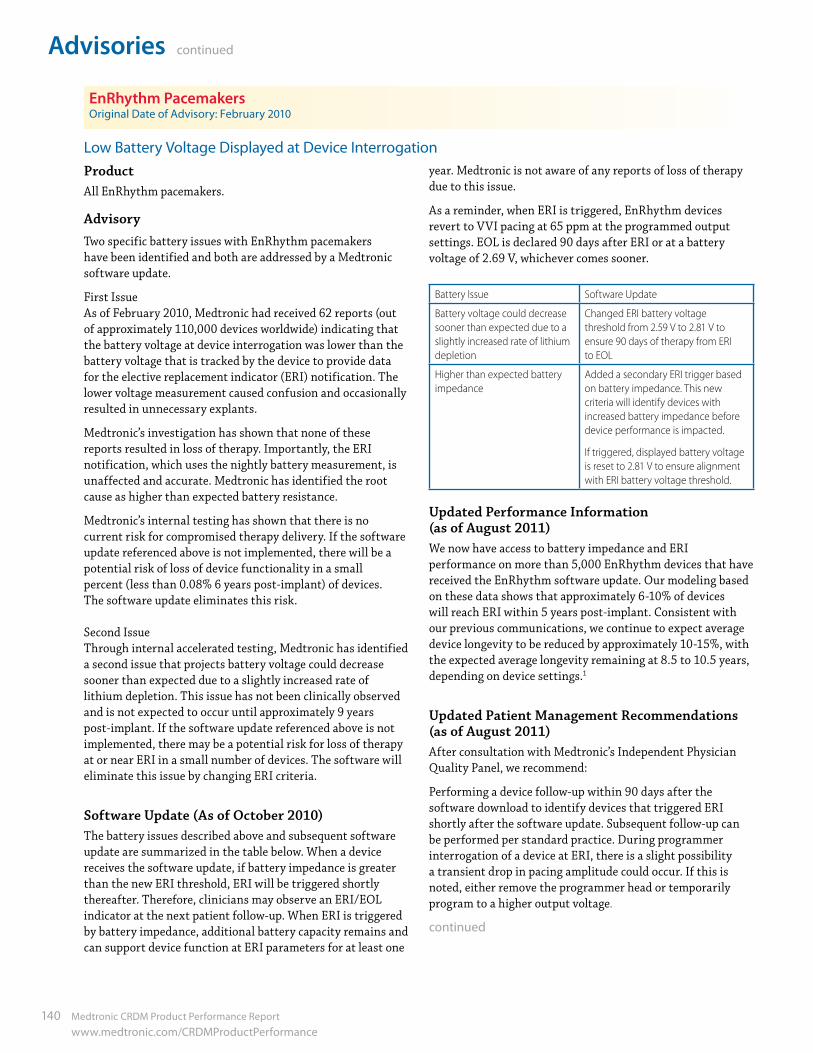
Advisories continued
140 Medtronic CRDM Product Performance Report www.medtronic.com/CRDMProductPerformance
Low Battery Voltage Displayed at Device Interrogation
EnRhythm PacemakersOriginal Date of Advisory: February 2010
ProductAll EnRhythm pacemakers.
AdvisoryTwo specific battery issues with EnRhythm pacemakers have been identified and both are addressed by a Medtronic software update.
First IssueAs of February 2010, Medtronic had received 62 reports (out of approximately 110,000 devices worldwide) indicating that the battery voltage at device interrogation was lower than the battery voltage that is tracked by the device to provide data for the elective replacement indicator (ERI) notification. The lower voltage measurement caused confusion and occasionally resulted in unnecessary explants.
Medtronic’s investigation has shown that none of these reports resulted in loss of therapy. Importantly, the ERI notification, which uses the nightly battery measurement, is unaffected and accurate. Medtronic has identified the root cause as higher than expected battery resistance.
Medtronic’s internal testing has shown that there is no current risk for compromised therapy delivery. If the software update referenced above is not implemented, there will be a potential risk of loss of device functionality in a small percent (less than 0.08% 6 years post-implant) of devices. The software update eliminates this risk.
Second Issue Through internal accelerated testing, Medtronic has identified a second issue that projects battery voltage could decrease sooner than expected due to a slightly increased rate of lithium depletion. This issue has not been clinically observed and is not expected to occur until approximately 9 years post-implant. If the software update referenced above is not implemented, there may be a potential risk for loss of therapy at or near ERI in a small number of devices. The software will eliminate this issue by changing ERI criteria.
Software Update (As of October 2010) The battery issues described above and subsequent software update are summarized in the table below. When a device receives the software update, if battery impedance is greater than the new ERI threshold, ERI will be triggered shortly thereafter. Therefore, clinicians may observe an ERI/EOL indicator at the next patient follow-up. When ERI is triggered by battery impedance, additional battery capacity remains and can support device function at ERI parameters for at least one
year. Medtronic is not aware of any reports of loss of therapy due to this issue.
As a reminder, when ERI is triggered, EnRhythm devices revert to VVI pacing at 65 ppm at the programmed output settings. EOL is declared 90 days after ERI or at a battery voltage of 2.69 V, whichever comes sooner.
Battery Issue Software Update
Battery voltage could decrease sooner than expected due to a slightly increased rate of lithium depletion
Changed ERI battery voltage threshold from 2.59 V to 2.81 V to ensure 90 days of therapy from ERI to EOL
Higher than expected battery impedance
Added a secondary ERI trigger based on battery impedance. This new criteria will identify devices with increased battery impedance before device performance is impacted.
If triggered, displayed battery voltage is reset to 2.81 V to ensure alignment with ERI battery voltage threshold.
Updated Performance Information (as of August 2011) We now have access to battery impedance and ERI performance on more than 5,000 EnRhythm devices that have received the EnRhythm software update. Our modeling based on these data shows that approximately 6-10% of devices will reach ERI within 5 years post-implant. Consistent with our previous communications, we continue to expect average device longevity to be reduced by approximately 10-15%, with the expected average longevity remaining at 8.5 to 10.5 years, depending on device settings.1
Updated Patient Management Recommendations (as of August 2011) After consultation with Medtronic’s Independent Physician Quality Panel, we recommend:
Performing a device follow-up within 90 days after the software download to identify devices that triggered ERI shortly after the software update. Subsequent follow-up can be performed per standard practice. During programmer interrogation of a device at ERI, there is a slight possibility a transient drop in pacing amplitude could occur. If this is noted, either remove the programmer head or temporarily program to a higher output voltage.
continued
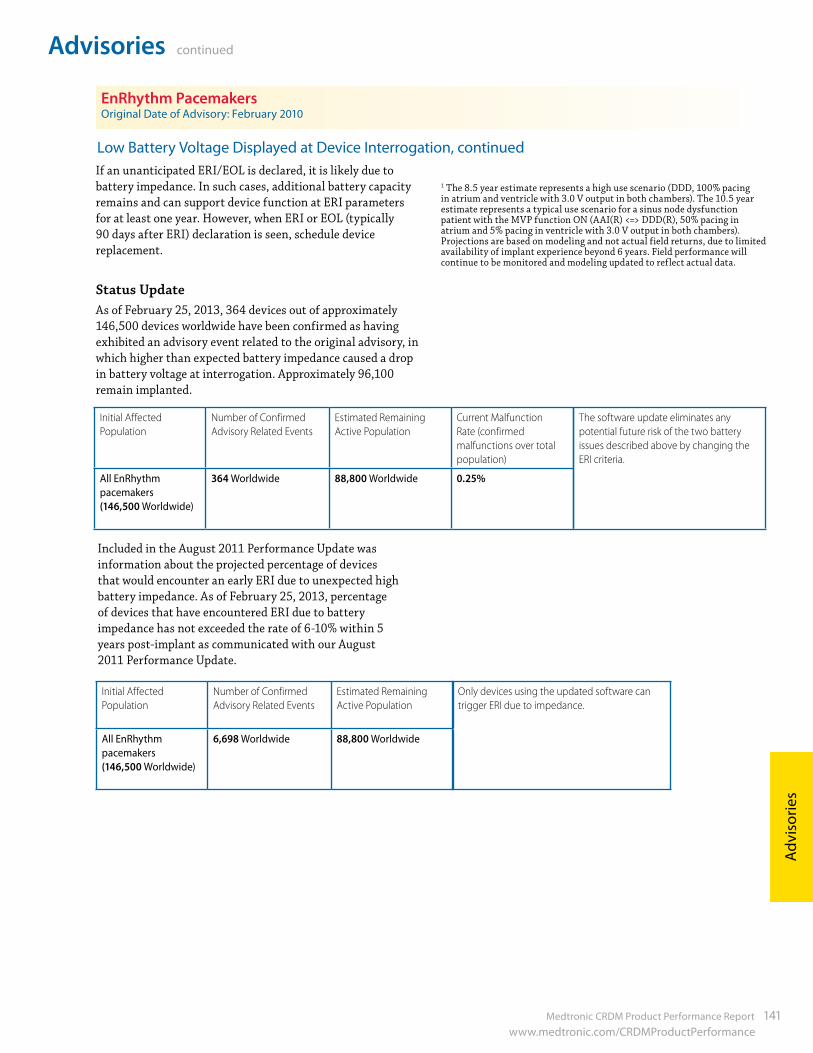
Medtronic CRDM Product Performance Report 141 www.medtronic.com/CRDMProductPerformance
Advisories continued
Adv
isor
ies
EnRhythm PacemakersOriginal Date of Advisory: February 2010
Initial Affected Population
Number of Confirmed Advisory Related Events
Estimated Remaining Active Population
Current Malfunction Rate (confirmed malfunctions over total population)
All EnRhythm pacemakers (146,500 Worldwide)
364 Worldwide 88,800 Worldwide 0.25%
The software update eliminates any potential future risk of the two battery issues described above by changing the ERI criteria.
If an unanticipated ERI/EOL is declared, it is likely due to battery impedance. In such cases, additional battery capacity remains and can support device function at ERI parameters for at least one year. However, when ERI or EOL (typically 90 days after ERI) declaration is seen, schedule device replacement.
Status Update As of February 25, 2013, 364 devices out of approximately 146,500 devices worldwide have been confirmed as having exhibited an advisory event related to the original advisory, in which higher than expected battery impedance caused a drop in battery voltage at interrogation. Approximately 96,100 remain implanted.
1 The 8.5 year estimate represents a high use scenario (DDD, 100% pacing in atrium and ventricle with 3.0 V output in both chambers). The 10.5 year estimate represents a typical use scenario for a sinus node dysfunction patient with the MVP function ON (AAI(R) <=> DDD(R), 50% pacing in atrium and 5% pacing in ventricle with 3.0 V output in both chambers). Projections are based on modeling and not actual field returns, due to limited availability of implant experience beyond 6 years. Field performance will continue to be monitored and modeling updated to reflect actual data.
Low Battery Voltage Displayed at Device Interrogation, continued
Initial Affected Population
Number of Confirmed Advisory Related Events
Estimated Remaining Active Population
All EnRhythm pacemakers (146,500 Worldwide)
6,698 Worldwide 88,800 Worldwide
Only devices using the updated software can trigger ERI due to impedance.
Included in the August 2011 Performance Update was information about the projected percentage of devices that would encounter an early ERI due to unexpected high battery impedance. As of February 25, 2013, percentage of devices that have encountered ERI due to battery impedance has not exceeded the rate of 6-10% within 5 years post-implant as communicated with our August 2011 Performance Update.
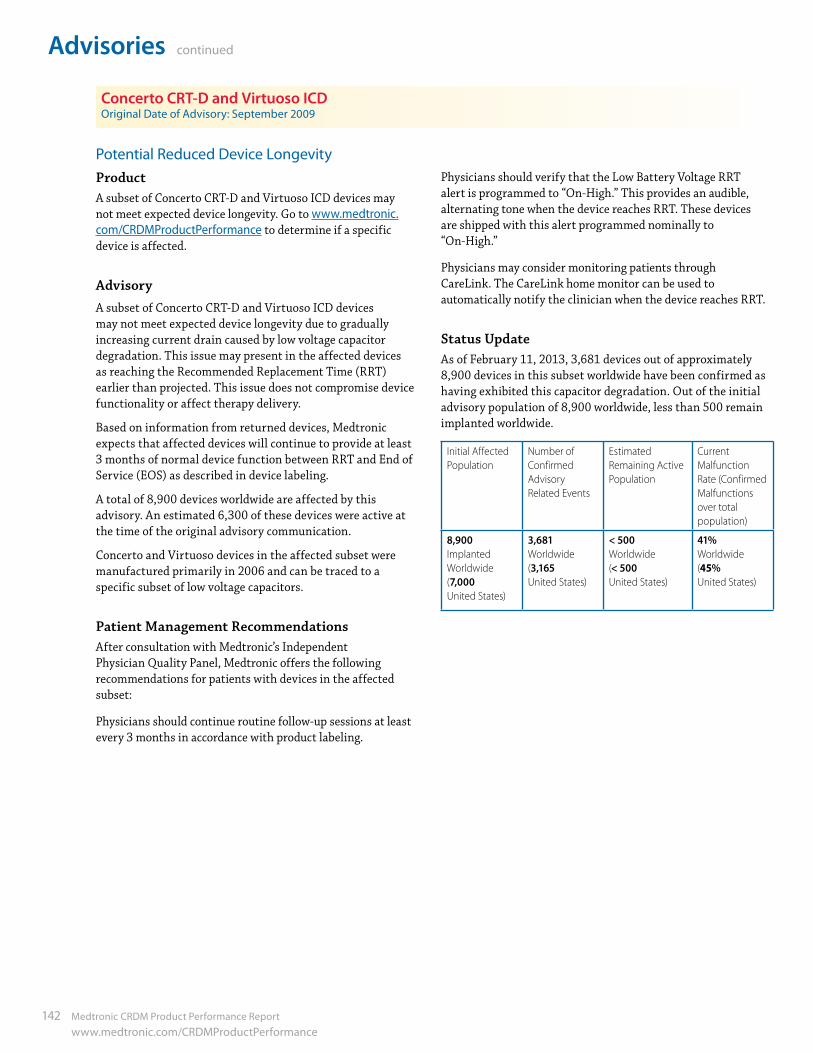
Advisories continued
142 Medtronic CRDM Product Performance Report www.medtronic.com/CRDMProductPerformance
Potential Reduced Device Longevity
Concerto CRT-D and Virtuoso ICDOriginal Date of Advisory: September 2009
ProductA subset of Concerto CRT-D and Virtuoso ICD devices may not meet expected device longevity. Go to www.medtronic.com/CRDMProductPerformance to determine if a specific device is affected.
AdvisoryA subset of Concerto CRT-D and Virtuoso ICD devices may not meet expected device longevity due to gradually increasing current drain caused by low voltage capacitor degradation. This issue may present in the affected devices as reaching the Recommended Replacement Time (RRT) earlier than projected. This issue does not compromise device functionality or affect therapy delivery.
Based on information from returned devices, Medtronic expects that affected devices will continue to provide at least 3 months of normal device function between RRT and End of Service (EOS) as described in device labeling.
A total of 8,900 devices worldwide are affected by this advisory. An estimated 6,300 of these devices were active at the time of the original advisory communication.
Concerto and Virtuoso devices in the affected subset were manufactured primarily in 2006 and can be traced to a specific subset of low voltage capacitors.
Patient Management Recommendations After consultation with Medtronic’s Independent Physician Quality Panel, Medtronic offers the following recommendations for patients with devices in the affected subset:
Physicians should continue routine follow-up sessions at least every 3 months in accordance with product labeling.
Physicians should verify that the Low Battery Voltage RRT alert is programmed to “On-High.” This provides an audible, alternating tone when the device reaches RRT. These devices are shipped with this alert programmed nominally to “On-High.”
Physicians may consider monitoring patients through CareLink. The CareLink home monitor can be used to automatically notify the clinician when the device reaches RRT.
Status UpdateAs of February 11, 2013, 3,681 devices out of approximately 8,900 devices in this subset worldwide have been confirmed as having exhibited this capacitor degradation. Out of the initial advisory population of 8,900 worldwide, less than 500 remain implanted worldwide.
Initial Affected Population
Number of Confirmed Advisory Related Events
Estimated Remaining Active Population
Current Malfunction Rate (Confirmed Malfunctions over total population)
8,900 Implanted Worldwide (7,000 United States)
3,681 Worldwide (3,165 United States)
< 500 Worldwide (< 500 United States)
41% Worldwide (45% United States)

Medtronic CRDM Product Performance Report 143 www.medtronic.com/CRDMProductPerformance
Advisories continued
Adv
isor
ies
ProductA specific subset of Kappa and Sigma series pacemakers may fail due to separation of interconnect wires from the hybrid circuit. Go to www.medtronic.com/CRDMProductPerformance to determine if a specific device is affected.
Advisory Population
Specific subsets of Kappa and Sigma series pacemakers may fail at a higher than expected rate due to separation of wires that connect the electronic circuit to other pacemaker components (e.g., battery, connector). This may present clinically as loss of rate response, premature battery depletion, loss of telemetry, or no output.
Some patients, whose devices experience a wire separation resulting in a loss of pacing output, will experience a return of bradycardia symptoms (e.g., fainting or lightheadedness). In rare cases involving pacemaker dependent patients, loss of pacing output may result in death or serious injury.
Since 1997, there have been over 1.7 million Kappa and Sigma devices implanted worldwide. At the time of the original advisory communication, an estimated 15,200 Kappa and 6,100 Sigma devices affected by the advisory remained implanted and active. These devices were manufactured primarily between November 2000 and November 2002. Most of these devices have been implanted in patients for five years or longer and may be nearing normal elective replacement time.
There is no provocative testing that can predict which specific devices may fail, and no device programming can mitigate this issue if it occurs.
Patient Management Recommendations We realize that each patient requires unique clinical consideration and we support your judgment in caring for your patients. After consultation with Medtronic’s Independent Physician Quality Panel, Medtronic offers the following recommendations for patients:
• Physicians should advise their patients to seek medical attention immediately if they experience symptoms (e.g., fainting or lightheadedness).
• Physicians should consider device replacement for patients who are both pacemaker dependent and who have been implanted with a device in the affected subsets. Medtronic will offer a supplemental device warranty if the device is not already at elective replacement time.
• Physicians should continue routine follow-up in accordance with standard practice for those patients who are not pacemaker dependent.
Status Update
Advisory PopulationPatient management recommendations remain unchanged. As of February 25, 2013, Medtronic has observed 458 Kappa devices and 294 Sigma devices with this failure mechanism from the Kappa and new Sigma device subsets. This represents 0.79% (Kappa) and 1.97% (Sigma) of the original affected implant population.
Four hundred twenty-one (421) of the Kappa devices (0.72%) and 229 of the Sigma devices (1.53%) were returned with information indicating a problem with the patient’s pacing system prior to explant. The remaining 37 Kappa devices (0.06%) and 65 Sigma devices (0.44%) were returned with no information indicating a potential malfunction while implanted or with insufficient information to determine the state of the device at explant. Lacking definite information indicating proper operation until explant, these remaining devices are conservatively categorized as having experienced interconnect wire separation while implanted.
As of May 2009, our modeling predicts failure rates due to this issue of 1.1% (Kappa) and 4.8% (Sigma) over the remaining lifetime of those pacemakers still in service at that time.
Out of the initial advisory population of 58,300 Kappa devices and 14,900 Sigma devices worldwide, less than 500 Kappa devices remain implanted worldwide and 2,400 Sigma devices remain implanted worldwide. Of these, 600 Sigma devices are in the United States.
Continued VigilanceIncluded in the advisory communication was information about an additional subset of Kappa devices where we have observed a much lower rate of occurrence of this issue. Approximately 17,000 devices of this subset remain active. We have observed a failure rate of approximately 0.096% in this subset and our May 2009 modeling predicts a failure rate of 0.12% over the remaining device life of those pacemakers still in service at that time. After review with our Independent Physician Quality Panel, we do not recommend any specific actions for this group of devices. We will continue to monitor performance and inform you if any specific patient management recommendations are warranted.
continued
Potential Separation of Interconnect Wires (2009)
Kappa 600/700/900 PacemakersSigma 100/200/300 PacemakersOriginal Date of Advisory: May 2009
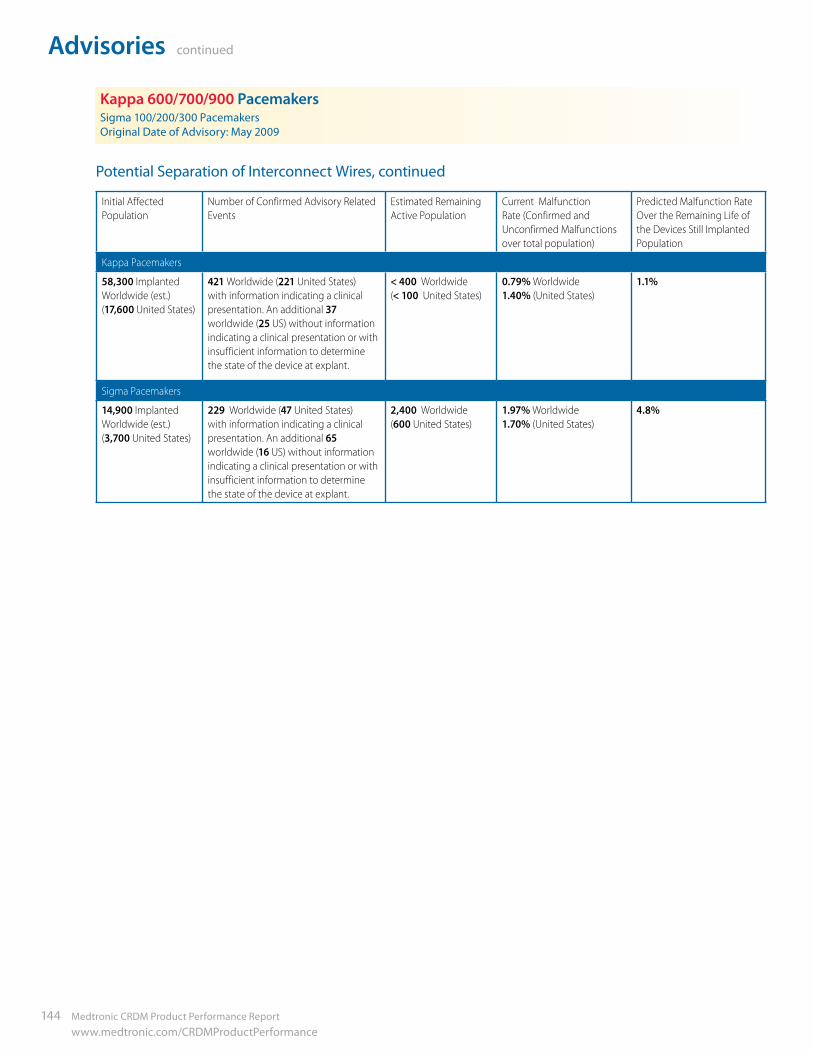
Advisories continued
144 Medtronic CRDM Product Performance Report www.medtronic.com/CRDMProductPerformance
Initial Affected Population
Number of Confirmed Advisory Related Events
Estimated Remaining Active Population
Current Malfunction Rate (Confirmed and Unconfirmed Malfunctions over total population)
Predicted Malfunction Rate Over the Remaining Life of the Devices Still Implanted Population
Kappa Pacemakers
58,300 Implanted Worldwide (est.) (17,600 United States)
421 Worldwide (221 United States) with information indicating a clinical presentation. An additional 37 worldwide (25 US) without information indicating a clinical presentation or with insufficient information to determine the state of the device at explant.
< 400 Worldwide (< 100 United States)
0.79% Worldwide 1.40% (United States)
1.1%
Sigma Pacemakers
14,900 Implanted Worldwide (est.) (3,700 United States)
229 Worldwide (47 United States) with information indicating a clinical presentation. An additional 65 worldwide (16 US) without information indicating a clinical presentation or with insufficient information to determine the state of the device at explant.
2,400 Worldwide (600 United States)
1.97% Worldwide 1.70% (United States)
4.8%
Potential Separation of Interconnect Wires, continued
Kappa 600/700/900 PacemakersSigma 100/200/300 PacemakersOriginal Date of Advisory: May 2009
Medtronic CRDM Product Performance Report 145 www.medtronic.com/CRDMProductPerformance
Advisories continued
Adv
isor
ies
ProductAll Model 6930, 6931, 6948, and 6949 implantable defibrillation leadsAdvisoryThere are two primary locations where chronic conductor fractures have occurred on Sprint Fidelis leads: 1) the distal portion of the lead, affecting the anode (ring electrode) and 2) near the anchoring sleeve tie-down, predominantly affecting the cathode (helix tip electrode), and occasionally the high voltage conductor. These two locations account for approximately 90% of the chronic fractures identified in Returned Product Analysis (RPA). The remaining 10% of chronic fractures occurred in the DF-1 connector leg and the proximal portion of the RV coil. High voltage conductor fractures could result in the inability to deliver defibrillation therapy. Anode or cathode conductor fractures (at either location) may present clinically as increased impedance, oversensing, increased interval counts, multiple inappropriate shocks, and/or loss of pacing output.
Patient Management Recommendations (Updated April 2011)
The Lead Integrity Alert (LIA) provides three days advance notice prior to inappropriate therapy to 76% of patients with lead fractures.1 As a result, we strongly recommend that all Sprint Fidelis patients who have the ability to upgrade to Lead Integrity Alert do so promptly. Also ensure that high voltage lead impedance alerts (maximum of 100 ohms) are programmed. When a lead fracture is suspected or confirmed, immediate patient attention is strongly recommended. Physicians should inform their patients to seek medical attention without delay if they experience unexpected shocks
• If a Fidelis lead fracture of any type has occurred, we recommend implanting a new high voltage lead with or without extraction of the Fidelis lead.
• In patients with normal device function and no manifestation of lead fracture, no action is recommended. The risk of prophylactic intervention appears to be greater than serious injury resulting from lead fracture even for pacemaker dependent patients, except in select individual patient circumstances as determined by the physician.
• In the event of a device change-out or upgrade procedure, with no manifestation of lead fracture, consider the patient age and lead model data above, as well as patient life expectancy, co-morbidities, ease of extraction related to implant time, patient preference, etc., for the following options:
– Leave a properly performing lead intact.
– Implant a new ICD lead without extraction of the existing lead.
– Carefully consider all factors before prophylactic placement of a pace-sense lead. Data shows an increased risk of high voltage conductor fracture if a pace-sense conductor fracture has previously occurred. This data is available at www.medtronic.com/fidelis
– Individual patient circumstances may warrant extracting and implanting a new ICD lead. If warranted, Medtronic’s Independent Physician Quality Panel recommends the lead extraction procedure be performed by a physician with extensive lead extraction experience.2
Status UpdateAs of February 11, 2013, of the initial implant population of 205,600 in the United States, approximately 90,800 remain implanted. According to Product Surveillance Registry results, lead survival is estimated to be 81.0% (+4.3/-5.4) at 81 months. As the implanted population ages and the sample size increases for each time interval, the accuracy of the estimated survival probability will increase as shown by tighter confidence intervals.
1 Swerdlow C, Gunderson B, Ousdigian K, et al. Downloadable Algorithm to Reduce Inappropriate Shocks Caused by Fractures of Implantable Cardioverter-Defibrillator Leads, Circulation. November 2008;118:2122-2129.
2 Wilkoff B, Love C, Byrd C, et al. Transvenous Lead Extraction: Heart Rhythm Society Expert Consensus on Facilities, Training, Indications, and Patient Management. Heart Rhythm. July 2009;6:1085-1104.
continued
Potential Conductor Wire Fracture
6930, 6931, 6948, 6949 Sprint Fidelis Defibrillation LeadsOriginal Date of Advisory: October 2007
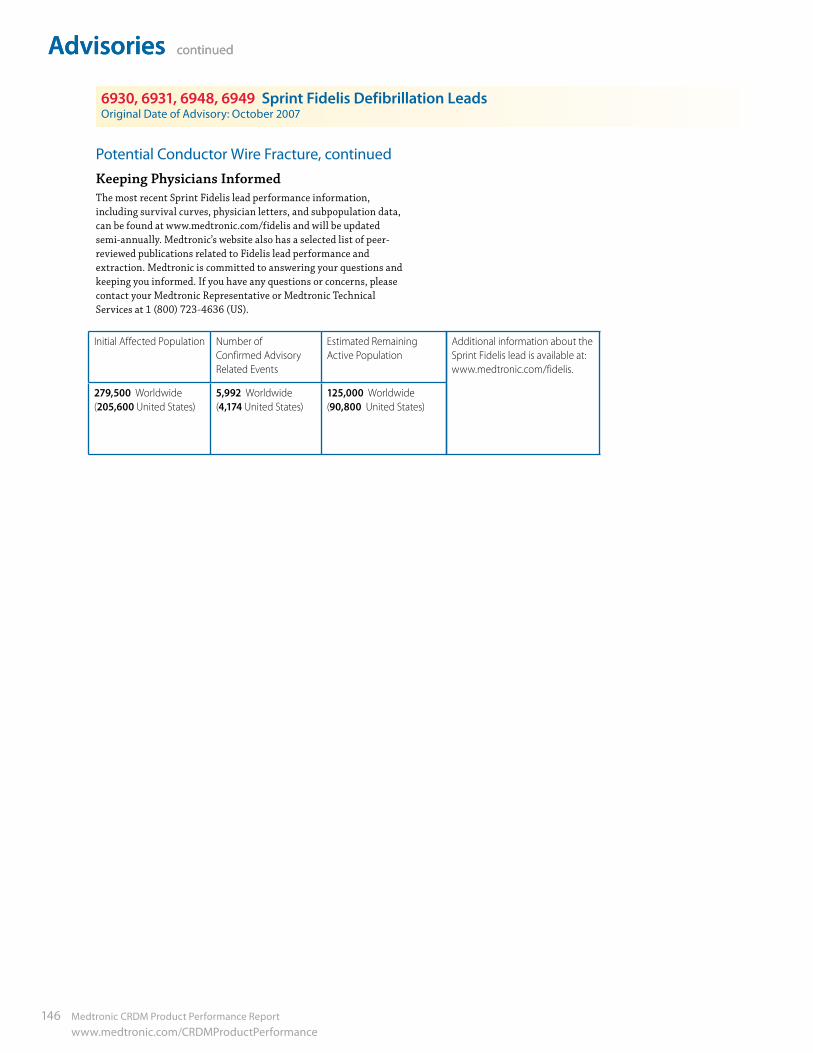
Advisories continued
146 Medtronic CRDM Product Performance Report www.medtronic.com/CRDMProductPerformance
Advisories continued
6930, 6931, 6948, 6949 Sprint Fidelis Defibrillation LeadsOriginal Date of Advisory: October 2007
Potential Conductor Wire Fracture, continued Keeping Physicians Informed The most recent Sprint Fidelis lead performance information, including survival curves, physician letters, and subpopulation data, can be found at www.medtronic.com/fidelis and will be updated semi-annually. Medtronic’s website also has a selected list of peer-reviewed publications related to Fidelis lead performance and extraction. Medtronic is committed to answering your questions and keeping you informed. If you have any questions or concerns, please contact your Medtronic Representative or Medtronic Technical Services at 1 (800) 723-4636 (US).
Initial Affected Population Number of Confirmed Advisory Related Events
Estimated Remaining Active Population
279,500 Worldwide (205,600 United States)
5,992 Worldwide (4,174 United States)
125,000 Worldwide (90,800 United States)
Additional information about the Sprint Fidelis lead is available at: www.medtronic.com/fidelis.
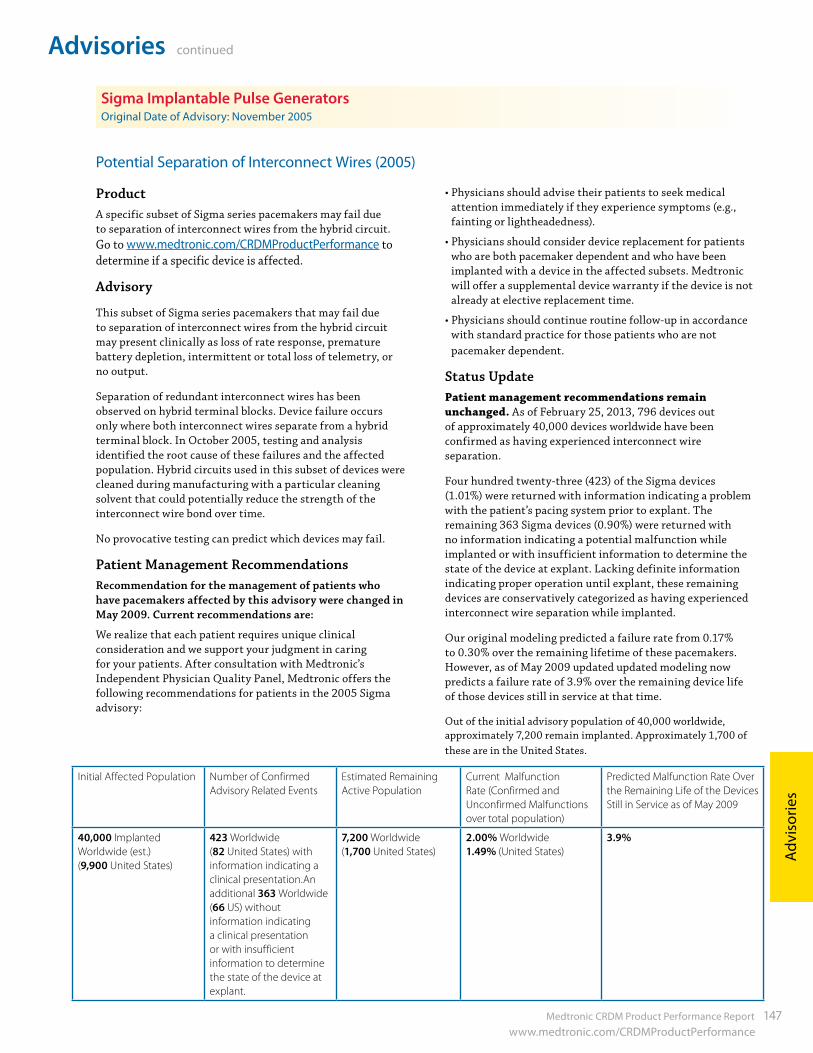
Medtronic CRDM Product Performance Report 147 www.medtronic.com/CRDMProductPerformance
Advisories continued
Adv
isor
ies
ProductA specific subset of Sigma series pacemakers may fail due to separation of interconnect wires from the hybrid circuit. Go to www.medtronic.com/CRDMProductPerformance to determine if a specific device is affected.
Advisory
This subset of Sigma series pacemakers that may fail due to separation of interconnect wires from the hybrid circuit may present clinically as loss of rate response, premature battery depletion, intermittent or total loss of telemetry, or no output.
Separation of redundant interconnect wires has been observed on hybrid terminal blocks. Device failure occurs only where both interconnect wires separate from a hybrid terminal block. In October 2005, testing and analysis identified the root cause of these failures and the affected population. Hybrid circuits used in this subset of devices were cleaned during manufacturing with a particular cleaning solvent that could potentially reduce the strength of the interconnect wire bond over time.
No provocative testing can predict which devices may fail.
Patient Management Recommendations Recommendation for the management of patients who have pacemakers affected by this advisory were changed in May 2009. Current recommendations are:
We realize that each patient requires unique clinical consideration and we support your judgment in caring for your patients. After consultation with Medtronic’s Independent Physician Quality Panel, Medtronic offers the following recommendations for patients in the 2005 Sigma advisory:
• Physicians should advise their patients to seek medical attention immediately if they experience symptoms (e.g., fainting or lightheadedness).
• Physicians should consider device replacement for patients who are both pacemaker dependent and who have been implanted with a device in the affected subsets. Medtronic will offer a supplemental device warranty if the device is not already at elective replacement time.
• Physicians should continue routine follow-up in accordance with standard practice for those patients who are not pacemaker dependent.
Status UpdatePatient management recommendations remain unchanged. As of February 25, 2013, 796 devices out of approximately 40,000 devices worldwide have been confirmed as having experienced interconnect wire separation.
Four hundred twenty-three (423) of the Sigma devices (1.01%) were returned with information indicating a problem with the patient’s pacing system prior to explant. The remaining 363 Sigma devices (0.90%) were returned with no information indicating a potential malfunction while implanted or with insufficient information to determine the state of the device at explant. Lacking definite information indicating proper operation until explant, these remaining devices are conservatively categorized as having experienced interconnect wire separation while implanted.
Our original modeling predicted a failure rate from 0.17% to 0.30% over the remaining lifetime of these pacemakers. However, as of May 2009 updated updated modeling now predicts a failure rate of 3.9% over the remaining device life of those devices still in service at that time.
Out of the initial advisory population of 40,000 worldwide, approximately 7,200 remain implanted. Approximately 1,700 of these are in the United States.
Potential Separation of Interconnect Wires (2005)
Sigma Implantable Pulse GeneratorsOriginal Date of Advisory: November 2005
Initial Affected Population Number of Confirmed Advisory Related Events
Estimated Remaining Active Population
Current Malfunction Rate (Confirmed and Unconfirmed Malfunctions over total population)
Predicted Malfunction Rate Over the Remaining Life of the Devices Still in Service as of May 2009
40,000 Implanted Worldwide (est.) (9,900 United States)
423 Worldwide (82 United States) with information indicating a clinical presentation.An additional 363 Worldwide (66 US) without information indicating a clinical presentation or with insufficient information to determine the state of the device at explant.
7,200 Worldwide (1,700 United States)
2.00% Worldwide 1.49% (United States)
3.9%
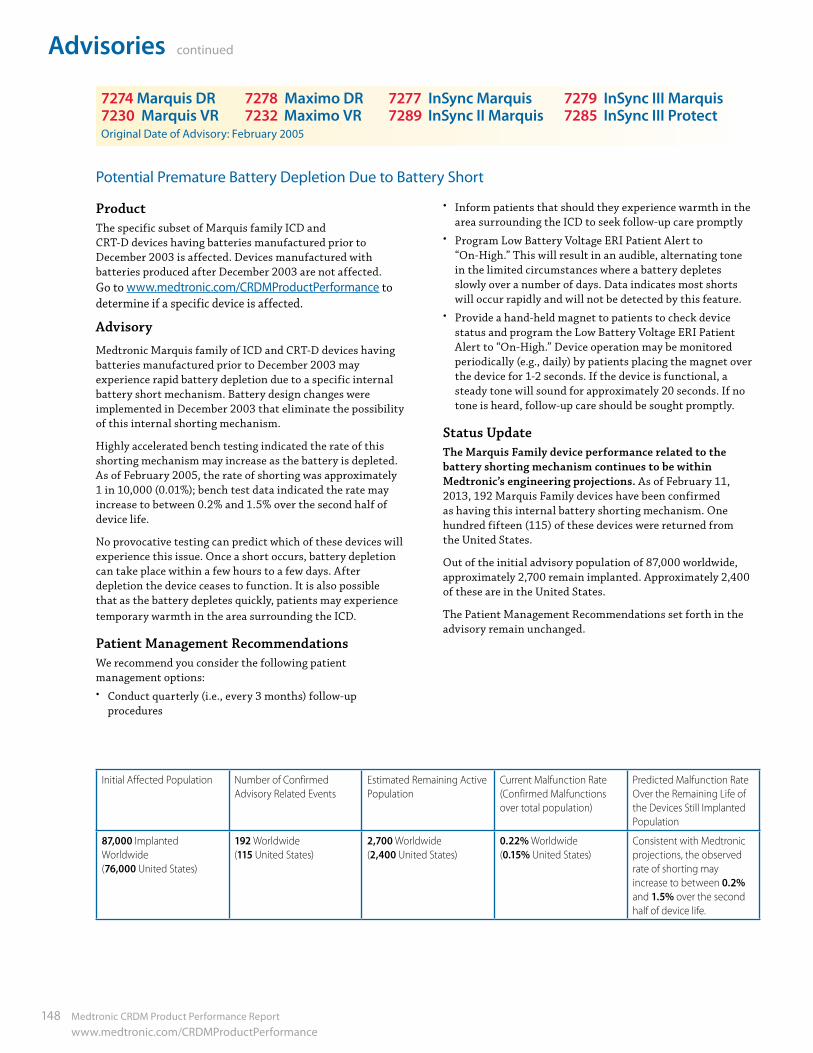
Advisories continued
148 Medtronic CRDM Product Performance Report www.medtronic.com/CRDMProductPerformance
ProductThe specific subset of Marquis family ICD and CRT-D devices having batteries manufactured prior to December 2003 is affected. Devices manufactured with batteries produced after December 2003 are not affected. Go to www.medtronic.com/CRDMProductPerformance to determine if a specific device is affected.
Advisory
Medtronic Marquis family of ICD and CRT-D devices having batteries manufactured prior to December 2003 may experience rapid battery depletion due to a specific internal battery short mechanism. Battery design changes were implemented in December 2003 that eliminate the possibility of this internal shorting mechanism.
Highly accelerated bench testing indicated the rate of this shorting mechanism may increase as the battery is depleted. As of February 2005, the rate of shorting was approximately 1 in 10,000 (0.01%); bench test data indicated the rate may increase to between 0.2% and 1.5% over the second half of device life.
No provocative testing can predict which of these devices will experience this issue. Once a short occurs, battery depletion can take place within a few hours to a few days. After depletion the device ceases to function. It is also possible that as the battery depletes quickly, patients may experience temporary warmth in the area surrounding the ICD.
Patient Management RecommendationsWe recommend you consider the following patient management options:• Conduct quarterly (i.e., every 3 months) follow-up
procedures
• Inform patients that should they experience warmth in the area surrounding the ICD to seek follow-up care promptly
• Program Low Battery Voltage ERI Patient Alert to “On-High.” This will result in an audible, alternating tone in the limited circumstances where a battery depletes slowly over a number of days. Data indicates most shorts will occur rapidly and will not be detected by this feature.
• Provide a hand-held magnet to patients to check device status and program the Low Battery Voltage ERI Patient Alert to “On-High.” Device operation may be monitored periodically (e.g., daily) by patients placing the magnet over the device for 1-2 seconds. If the device is functional, a steady tone will sound for approximately 20 seconds. If no tone is heard, follow-up care should be sought promptly.
Status UpdateThe Marquis Family device performance related to the battery shorting mechanism continues to be within Medtronic’s engineering projections. As of February 11, 2013, 192 Marquis Family devices have been confirmed as having this internal battery shorting mechanism. One hundred fifteen (115) of these devices were returned from the United States.
Out of the initial advisory population of 87,000 worldwide, approximately 2,700 remain implanted. Approximately 2,400 of these are in the United States.
The Patient Management Recommendations set forth in the advisory remain unchanged.
Potential Premature Battery Depletion Due to Battery Short
7274 Marquis DR 7278 Maximo DR 7277 InSync Marquis 7279 InSync III Marquis 7230 Marquis VR 7232 Maximo VR 7289 InSync II Marquis 7285 InSync III ProtectOriginal Date of Advisory: February 2005
Initial Affected Population Number of Confirmed Advisory Related Events
Estimated Remaining Active Population
Current Malfunction Rate (Confirmed Malfunctions over total population)
Predicted Malfunction Rate Over the Remaining Life of the Devices Still Implanted Population
87,000 Implanted Worldwide (76,000 United States)
192 Worldwide (115 United States)
2,700 Worldwide (2,400 United States)
0.22% Worldwide (0.15% United States)
Consistent with Medtronic projections, the observed rate of shorting may increase to between 0.2% and 1.5% over the second half of device life.
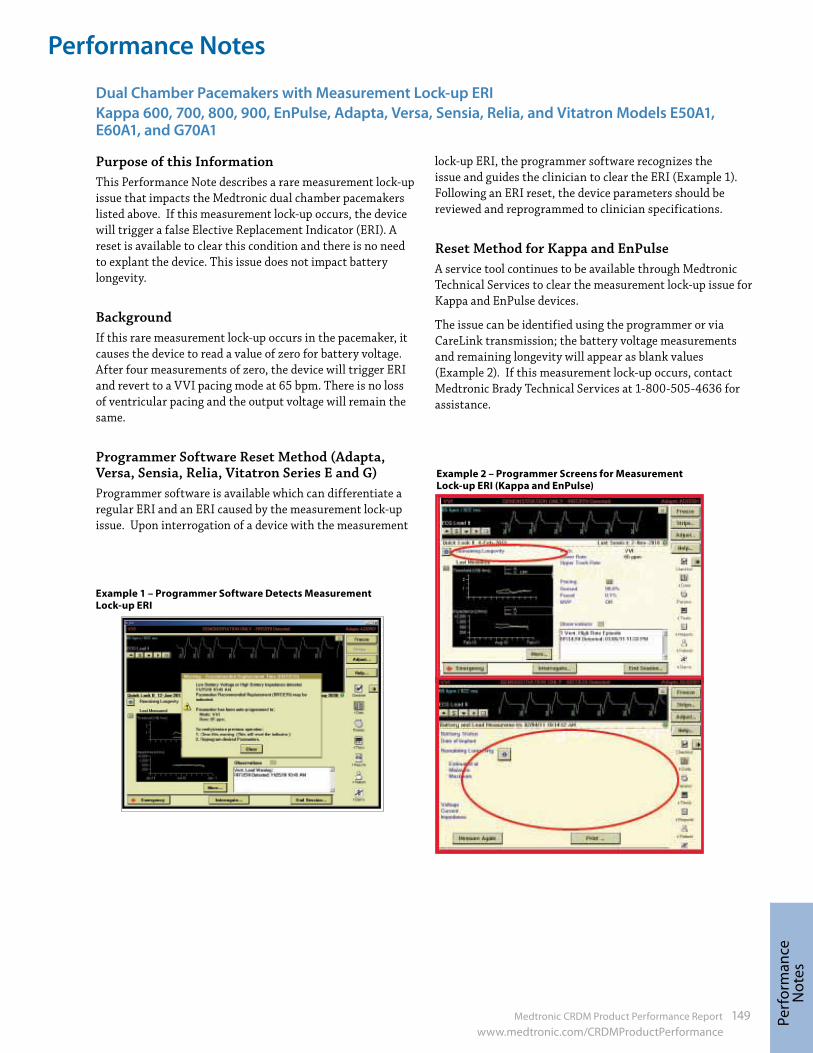
Medtronic CRDM Product Performance Report 149 www.medtronic.com/CRDMProductPerformance
Performance Notes
Perf
orm
ance
N
otes
Purpose of this InformationThis Performance Note describes a rare measurement lock-up issue that impacts the Medtronic dual chamber pacemakers listed above. If this measurement lock-up occurs, the device will trigger a false Elective Replacement Indicator (ERI). A reset is available to clear this condition and there is no need to explant the device. This issue does not impact battery longevity.
BackgroundIf this rare measurement lock-up occurs in the pacemaker, it causes the device to read a value of zero for battery voltage. After four measurements of zero, the device will trigger ERI and revert to a VVI pacing mode at 65 bpm. There is no loss of ventricular pacing and the output voltage will remain the same.
Programmer Software Reset Method (Adapta, Versa, Sensia, Relia, Vitatron Series E and G)Programmer software is available which can differentiate a regular ERI and an ERI caused by the measurement lock-up issue. Upon interrogation of a device with the measurement
lock-up ERI, the programmer software recognizes the issue and guides the clinician to clear the ERI (Example 1). Following an ERI reset, the device parameters should be reviewed and reprogrammed to clinician specifications.
Reset Method for Kappa and EnPulseA service tool continues to be available through Medtronic Technical Services to clear the measurement lock-up issue for Kappa and EnPulse devices.
The issue can be identified using the programmer or via CareLink transmission; the battery voltage measurements and remaining longevity will appear as blank values (Example 2). If this measurement lock-up occurs, contact Medtronic Brady Technical Services at 1-800-505-4636 for assistance.
Dual Chamber Pacemakers with Measurement Lock-up ERI Kappa 600, 700, 800, 900, EnPulse, Adapta, Versa, Sensia, Relia, and Vitatron Models E50A1, E60A1, and G70A1
Example 1 – Programmer Software Detects Measurement Lock-up ERI
Example 2 – Programmer Screens for Measurement Lock-up ERI (Kappa and EnPulse)
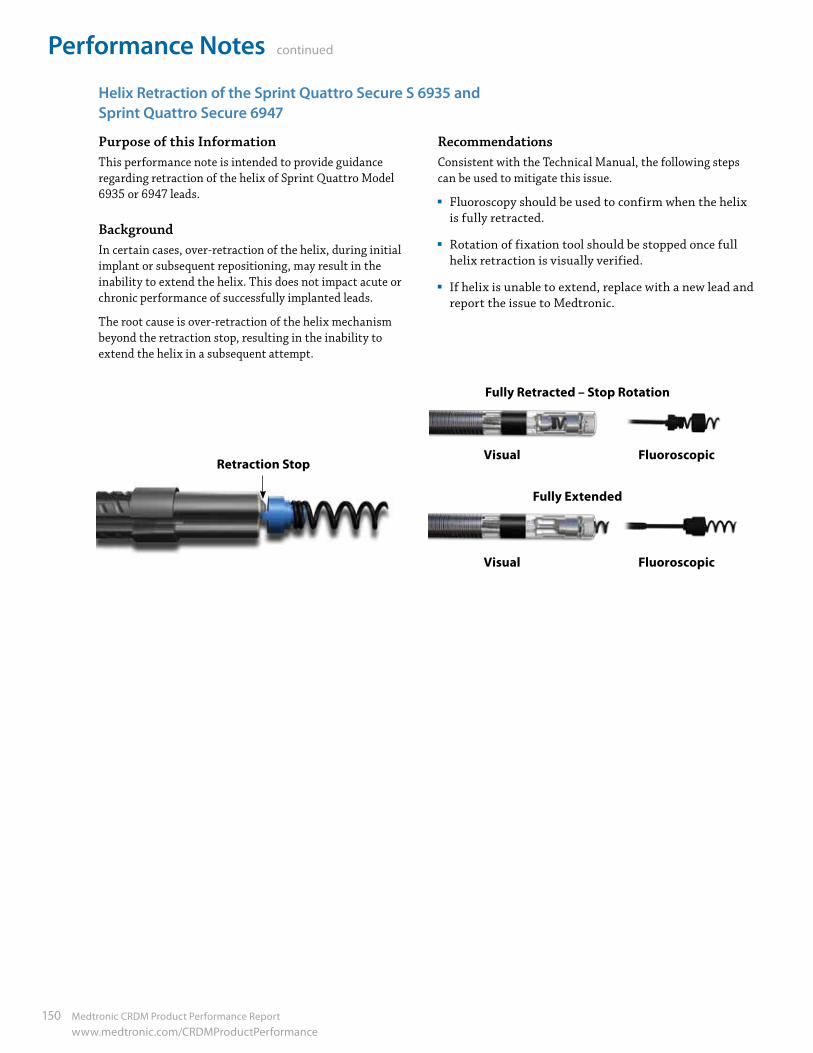
Performance Notes continued
150 Medtronic CRDM Product Performance Report www.medtronic.com/CRDMProductPerformance
Purpose of this InformationThis performance note is intended to provide guidance regarding retraction of the helix of Sprint Quattro Model 6935 or 6947 leads.
BackgroundIn certain cases, over-retraction of the helix, during initial implant or subsequent repositioning, may result in the inability to extend the helix. This does not impact acute or chronic performance of successfully implanted leads.
The root cause is over-retraction of the helix mechanism beyond the retraction stop, resulting in the inability to extend the helix in a subsequent attempt.
RecommendationsConsistent with the Technical Manual, the following steps can be used to mitigate this issue.
Fluoroscopy should be used to confirm when the helix is fully retracted.
Rotation of fixation tool should be stopped once full helix retraction is visually verified.
If helix is unable to extend, replace with a new lead and report the issue to Medtronic.
Helix Retraction of the Sprint Quattro Secure S 6935 and Sprint Quattro Secure 6947
Retraction Stop
Fully Retracted – Stop Rotation
Fully Extended
Visual
Visual Fluoroscopic
Fluoroscopic
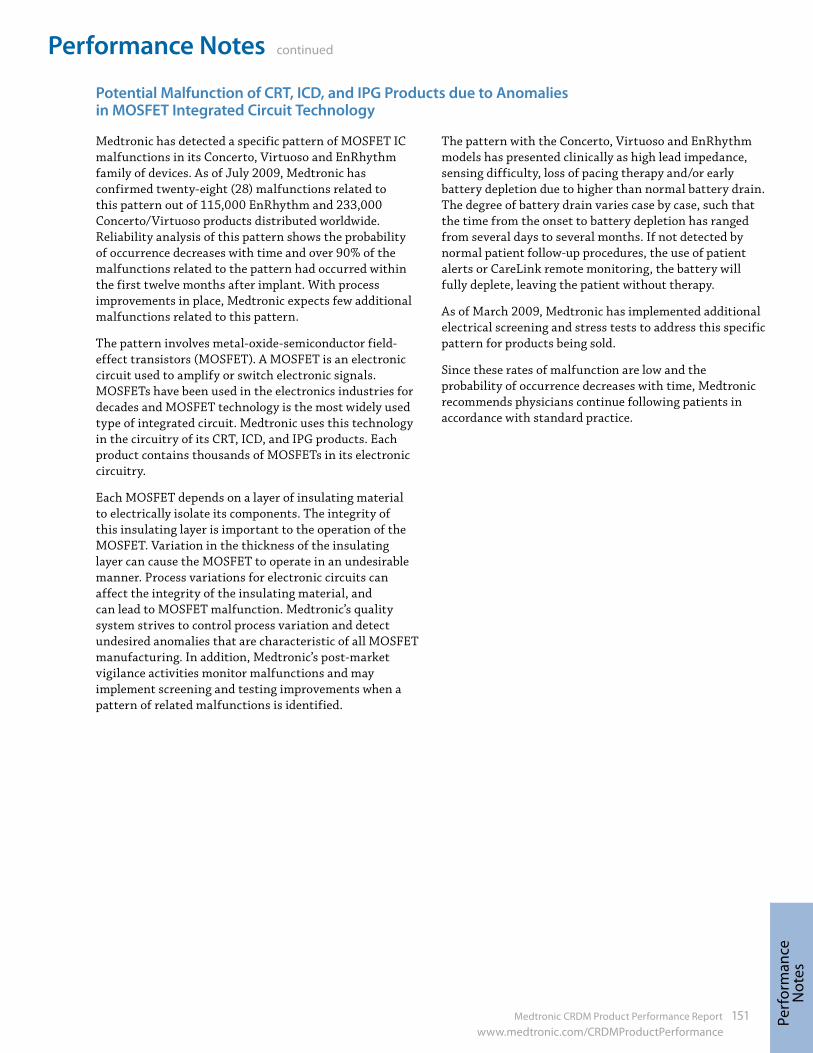
Medtronic CRDM Product Performance Report 151 www.medtronic.com/CRDMProductPerformance
Performance Notes continued
Perf
orm
ance
N
otes
Medtronic has detected a specific pattern of MOSFET IC malfunctions in its Concerto, Virtuoso and EnRhythm family of devices. As of July 2009, Medtronic has confirmed twenty-eight (28) malfunctions related to this pattern out of 115,000 EnRhythm and 233,000 Concerto/Virtuoso products distributed worldwide. Reliability analysis of this pattern shows the probability of occurrence decreases with time and over 90% of the malfunctions related to the pattern had occurred within the first twelve months after implant. With process improvements in place, Medtronic expects few additional malfunctions related to this pattern.
The pattern involves metal-oxide-semiconductor field-effect transistors (MOSFET). A MOSFET is an electronic circuit used to amplify or switch electronic signals. MOSFETs have been used in the electronics industries for decades and MOSFET technology is the most widely used type of integrated circuit. Medtronic uses this technology in the circuitry of its CRT, ICD, and IPG products. Each product contains thousands of MOSFETs in its electronic circuitry.
Each MOSFET depends on a layer of insulating material to electrically isolate its components. The integrity of this insulating layer is important to the operation of the MOSFET. Variation in the thickness of the insulating layer can cause the MOSFET to operate in an undesirable manner. Process variations for electronic circuits can affect the integrity of the insulating material, and can lead to MOSFET malfunction. Medtronic’s quality system strives to control process variation and detect undesired anomalies that are characteristic of all MOSFET manufacturing. In addition, Medtronic’s post-market vigilance activities monitor malfunctions and may implement screening and testing improvements when a pattern of related malfunctions is identified.
The pattern with the Concerto, Virtuoso and EnRhythm models has presented clinically as high lead impedance, sensing difficulty, loss of pacing therapy and/or early battery depletion due to higher than normal battery drain. The degree of battery drain varies case by case, such that the time from the onset to battery depletion has ranged from several days to several months. If not detected by normal patient follow-up procedures, the use of patient alerts or CareLink remote monitoring, the battery will fully deplete, leaving the patient without therapy.
As of March 2009, Medtronic has implemented additional electrical screening and stress tests to address this specific pattern for products being sold.
Since these rates of malfunction are low and the probability of occurrence decreases with time, Medtronic recommends physicians continue following patients in accordance with standard practice.
Potential Malfunction of CRT, ICD, and IPG Products due to Anomalies in MOSFET Integrated Circuit Technology
Performance Notes continued
152 Medtronic CRDM Product Performance Report www.medtronic.com/CRDMProductPerformance
BackgroundMedtronic Technical Services has received reports of devices going to ERI or end of life (EOL) sooner than expected after a normal follow-up in which the device longevity was projected to be approximately 18 months. It has been noted that these cases typically involve Kappa 700 devices where Ventricular Capture Management set the ventricular lead to high output (5 V, 1 ms), which occurs by device design when a high threshold is measured. It is important for physicians and allied professionals to understand VCM behavior as it relates to longevity so that they can, in turn, understand how this affects management of the device and follow-up visits as VCM equipped IPGs near the end of their expected longevity.
Device Longevity and VCM BehaviorVentricular Capture Management is a feature that uses evoked response sensing to determine the stimulation threshold needed to capture the ventricular chamber. Proper detection of the evoked response is crucial to the VCM algorithm determining an accurate capture threshold. There are rare conditions, however, during which the VCM algorithm will not be able to measure the evoked response accurately.1 When this occurs, for safety reasons the VCM algorithm will reprogram the output to 5 V, 1 ms until the subsequent VCM measurement.
If the device has considerable remaining longevity, these occasional excursions to high output do not substantially affect remaining longevity. However, if the device has less than approximately 18 months remaining longevity, there is the possibility that the high output condition caused by the 5 V, 1 ms output will drain the battery and trigger ERI.
When ERI is declared by the device, VCM is disabled and the outputs are left at 5 V, 1 ms until the device is reprogrammed at an in-office follow-up. This increased current drain of a high output condition will speed depletion of the device, possibly resulting in the device getting to the EOL (battery voltage ≤ 2.15 V).
Please note that the following parameter changes occur when the device goes to ERI:
Table: IPG Therapy Parameter Changes at ERI
Parameter ValuePacing Mode VVI
Lower Rate 65 bpm
Single Chamber Hysteresis OFF
Sleep Function OFF
Ventricular Capture Management OFF
Atrial Sensing Assurance OFF
Ventricular Sensing Assurance OFF
Kappa 700 is Medtronic’s first-generation VCM algorithm, which has a relatively higher incidence of evoked response undersensing compared to subsequent algorithms, resulting in more frequent high output conditions. Therefore, Kappa 700 products are the primary focus of this note. It should be noted that IPGs equipped with the second-generation VCM algorithm (Kappa 900, EnPulse, Adapta/Versa/Sensia, and Relia) have not been observed with evoked response undersensing in the general population, though the items listed in “Follow-Up Considerations” may also be used on these devices.
Follow-Up Considerations Estimated longevity in the event the device goes to high
output can be determined by the following steps. This allows the clinician to determine follow-up frequency if he or she is concerned the device may go to ERI due to high output.
– Program the ventricular channel to 5 V, 1 ms
– Navigate to Data/Battery and Lead Measurements
– When the message stating “Warning – Old Data” is displayed, select “Yes” to measure battery voltage and lead impedance at the new ventricular outputs
– An updated remaining longevity estimate will be calculated on the elevated outputs. Note the “Minimum Remaining Longevity.” Clinical decisions can be based on this value.
– Program the Amplitude and Pulse Widths back to their original values before leaving the session
If the capture trends and lead impedance trends are stable, VCM can be programmed to “Monitor Only” for the remaining device life. This should be considered only if remaining longevity is 18 months or less.
Follow-up frequency can be increased for those patients who do not have stable capture or lead impedance trends. This can be done via a CareLink Home Monitor, or in-office.
1 Medtronic, Inc. (2001). Medtronic Kappa 700/600 Series Pacemaker Reference Guide (Chapter 4, p. 27). Can be retrieved from http://manuals.medtronic.com.
Clinical Management of VCM near Elective Replacement
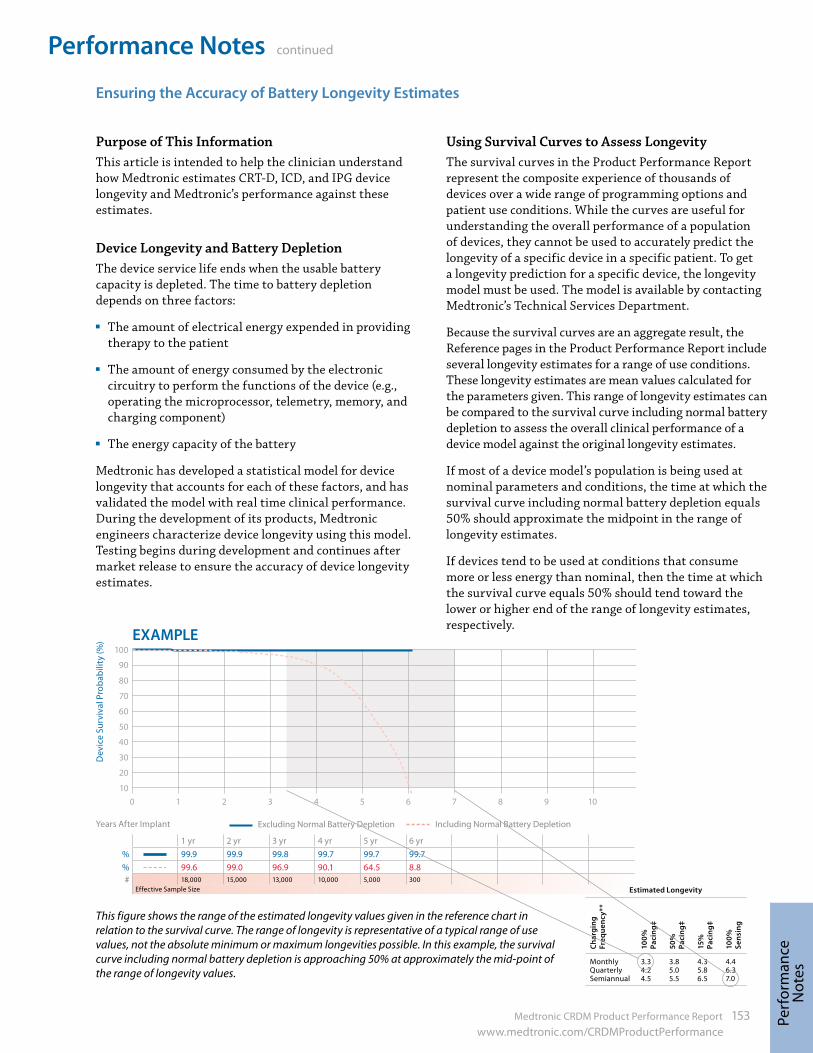
Medtronic CRDM Product Performance Report 153 www.medtronic.com/CRDMProductPerformance
Performance Notes continued
Perf
orm
ance
N
otes
Purpose of This InformationThis article is intended to help the clinician understand how Medtronic estimates CRT-D, ICD, and IPG device longevity and Medtronic’s performance against these estimates.
Device Longevity and Battery DepletionThe device service life ends when the usable battery capacity is depleted. The time to battery depletion depends on three factors:
The amount of electrical energy expended in providing therapy to the patient
The amount of energy consumed by the electronic circuitry to perform the functions of the device (e.g., operating the microprocessor, telemetry, memory, and charging component)
The energy capacity of the battery
Medtronic has developed a statistical model for device longevity that accounts for each of these factors, and has validated the model with real time clinical performance. During the development of its products, Medtronic engineers characterize device longevity using this model. Testing begins during development and continues after market release to ensure the accuracy of device longevity estimates.
Using Survival Curves to Assess LongevityThe survival curves in the Product Performance Report represent the composite experience of thousands of devices over a wide range of programming options and patient use conditions. While the curves are useful for understanding the overall performance of a population of devices, they cannot be used to accurately predict the longevity of a specific device in a specific patient. To get a longevity prediction for a specific device, the longevity model must be used. The model is available by contacting Medtronic’s Technical Services Department.
Because the survival curves are an aggregate result, the Reference pages in the Product Performance Report include several longevity estimates for a range of use conditions. These longevity estimates are mean values calculated for the parameters given. This range of longevity estimates can be compared to the survival curve including normal battery depletion to assess the overall clinical performance of a device model against the original longevity estimates.
If most of a device model’s population is being used at nominal parameters and conditions, the time at which the survival curve including normal battery depletion equals 50% should approximate the midpoint in the range of longevity estimates.
If devices tend to be used at conditions that consume more or less energy than nominal, then the time at which the survival curve equals 50% should tend toward the lower or higher end of the range of longevity estimates, respectively.
Ensuring the Accuracy of Battery Longevity Estimates
This figure shows the range of the estimated longevity values given in the reference chart in relation to the survival curve. The range of longevity is representative of a typical range of use values, not the absolute minimum or maximum longevities possible. In this example, the survival curve including normal battery depletion is approaching 50% at approximately the mid-point of the range of longevity values.
EXAMPLE
90
100
80
70
60
50
40
30
20
10109876543210
Survival Estimate of Gem III DR 7275 July 2008
Dev
ice
Surv
ival
Pro
babi
lity
(%)
Years After Implant Excluding Normal Battery Depletion Including Normal Battery Depletion
1 yr 2 yr 3 yr 4 yr 5 yr 6 yr% 99.9 99.9 99.8 99.7 99.7 99.7% 99.6 99.0 96.9 90.1 64.5 8.8# 18,000 15,000 13,000 10,000 5,000 300
Effective Sample Size Estimated Longevity
Char
ging
Fr
eque
ncy*
*
100%
Pa
cing
‡
50%
Pa
cing
‡
15%
Pa
cing
‡
100%
Se
nsin
g
Monthly Quarterly Semiannual
3.3 4.2 4.5
3.8 5.0 5.5
4.3 5.8 6.5
4.4 6.3 7.0
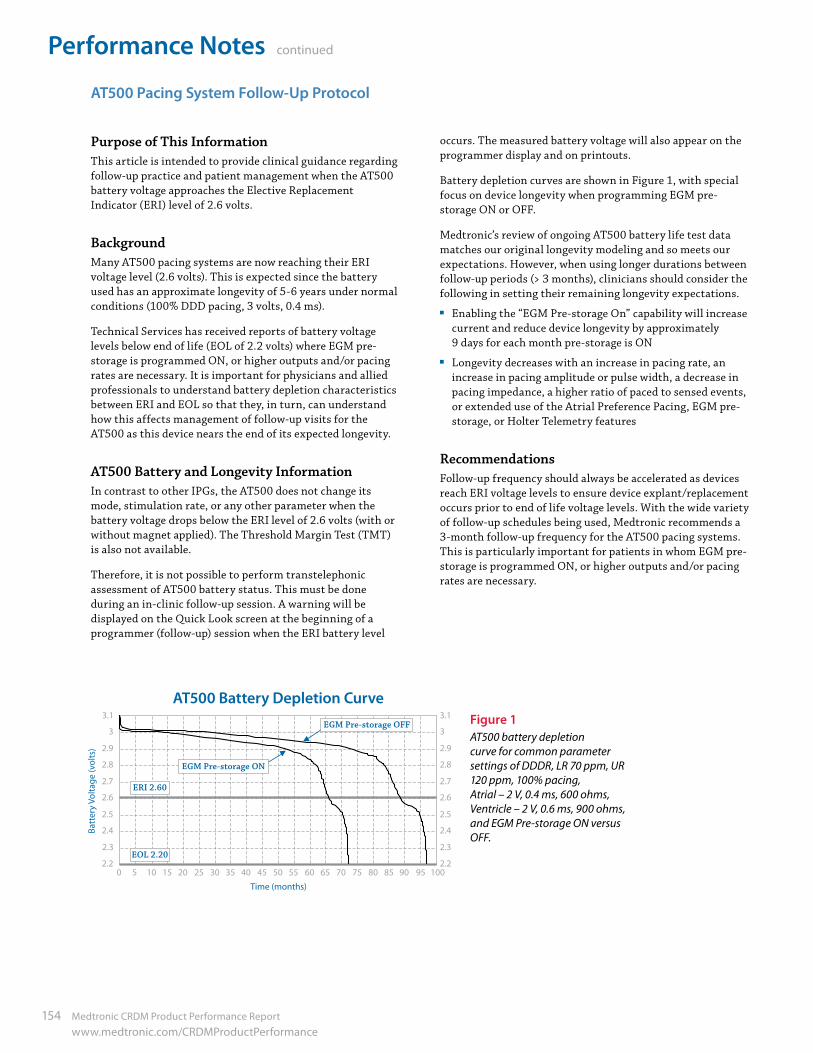
Performance Notes continued
154 Medtronic CRDM Product Performance Report www.medtronic.com/CRDMProductPerformance
Purpose of This InformationThis article is intended to provide clinical guidance regarding follow-up practice and patient management when the AT500 battery voltage approaches the Elective Replacement Indicator (ERI) level of 2.6 volts.
BackgroundMany AT500 pacing systems are now reaching their ERI voltage level (2.6 volts). This is expected since the battery used has an approximate longevity of 5-6 years under normal conditions (100% DDD pacing, 3 volts, 0.4 ms).
Technical Services has received reports of battery voltage levels below end of life (EOL of 2.2 volts) where EGM pre-storage is programmed ON, or higher outputs and/or pacing rates are necessary. It is important for physicians and allied professionals to understand battery depletion characteristics between ERI and EOL so that they, in turn, can understand how this affects management of follow-up visits for the AT500 as this device nears the end of its expected longevity.
AT500 Battery and Longevity InformationIn contrast to other IPGs, the AT500 does not change its mode, stimulation rate, or any other parameter when the battery voltage drops below the ERI level of 2.6 volts (with or without magnet applied). The Threshold Margin Test (TMT) is also not available.
Therefore, it is not possible to perform transtelephonic assessment of AT500 battery status. This must be done during an in-clinic follow-up session. A warning will be displayed on the Quick Look screen at the beginning of a programmer (follow-up) session when the ERI battery level
occurs. The measured battery voltage will also appear on the programmer display and on printouts.
Battery depletion curves are shown in Figure 1, with special focus on device longevity when programming EGM pre-storage ON or OFF.
Medtronic’s review of ongoing AT500 battery life test data matches our original longevity modeling and so meets our expectations. However, when using longer durations between follow-up periods (> 3 months), clinicians should consider the following in setting their remaining longevity expectations. Enabling the “EGM Pre-storage On” capability will increase
current and reduce device longevity by approximately 9 days for each month pre-storage is ON
Longevity decreases with an increase in pacing rate, an increase in pacing amplitude or pulse width, a decrease in pacing impedance, a higher ratio of paced to sensed events, or extended use of the Atrial Preference Pacing, EGM pre-storage, or Holter Telemetry features
RecommendationsFollow-up frequency should always be accelerated as devices reach ERI voltage levels to ensure device explant/replacement occurs prior to end of life voltage levels. With the wide variety of follow-up schedules being used, Medtronic recommends a 3-month follow-up frequency for the AT500 pacing systems. This is particularly important for patients in whom EGM pre-storage is programmed ON, or higher outputs and/or pacing rates are necessary.
Figure 1AT500 battery depletion curve for common parameter settings of DDDR, LR 70 ppm, UR 120 ppm, 100% pacing, Atrial – 2 V, 0.4 ms, 600 ohms, Ventricle – 2 V, 0.6 ms, 900 ohms, and EGM Pre-storage ON versus OFF.
AT500 Battery Depletion Curve
2.2
2.3
2.4
2.5
2.6
2.7
2.8
2.9
3
3.1
0 5 10 15 20 25 30 35 40 45 50 55 60 65 70 75 80 85 90 95 100
Time (months)
Batt
ery
Volta
ge (v
olts
)
2.2
2.3
2.4
2.5
2.6
2.7
2.8
2.9
3
3.1
EGM Pre-storage ON
ERI 2.60
EOL 2.20
EGM Pre-storage OFF
AT500 Battery Depletion Curve
AT500 Pacing System Follow-Up Protocol
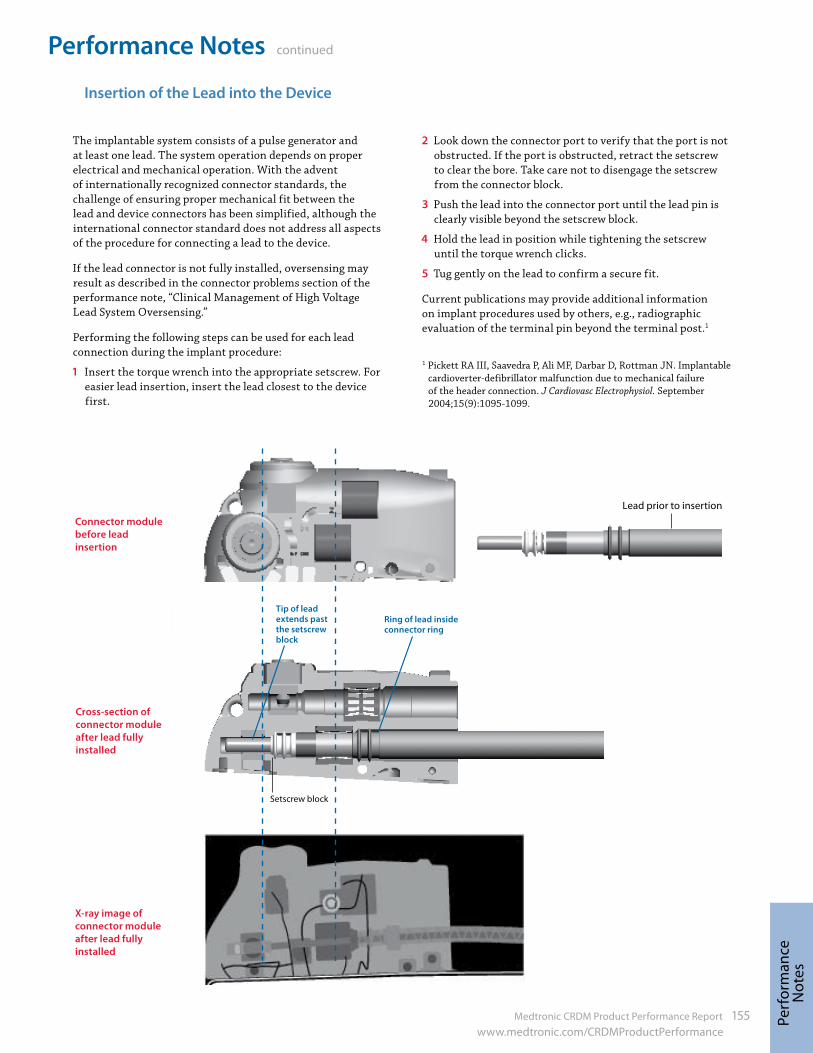
Medtronic CRDM Product Performance Report 155 www.medtronic.com/CRDMProductPerformance
Performance Notes continued
Perf
orm
ance
N
otes
The implantable system consists of a pulse generator and at least one lead. The system operation depends on proper electrical and mechanical operation. With the advent of internationally recognized connector standards, the challenge of ensuring proper mechanical fit between the lead and device connectors has been simplified, although the international connector standard does not address all aspects of the procedure for connecting a lead to the device.
If the lead connector is not fully installed, oversensing may result as described in the connector problems section of the performance note, “Clinical Management of High Voltage Lead System Oversensing.”
Performing the following steps can be used for each lead connection during the implant procedure:
1 Insert the torque wrench into the appropriate setscrew. For easier lead insertion, insert the lead closest to the device first.
2 Look down the connector port to verify that the port is not obstructed. If the port is obstructed, retract the setscrew to clear the bore. Take care not to disengage the setscrew from the connector block.
3 Push the lead into the connector port until the lead pin is clearly visible beyond the setscrew block.
4 Hold the lead in position while tightening the setscrew until the torque wrench clicks.
5 Tug gently on the lead to confirm a secure fit.
Current publications may provide additional information on implant procedures used by others, e.g., radiographic evaluation of the terminal pin beyond the terminal post.1
1 Pickett RA III, Saavedra P, Ali MF, Darbar D, Rottman JN. Implantable cardioverter-defibrillator malfunction due to mechanical failure of the header connection. J Cardiovasc Electrophysiol. September 2004;15(9):1095-1099.
Lead prior to insertion
Connector Module
Tip of lead extends past the setscrew block
Ring of lead inside connector ring
Setscrew block
Insertion of the Lead into the Device
Connector module before lead insertion
Cross-section of connector module after lead fully installed
X-ray image of connector module after lead fully installed
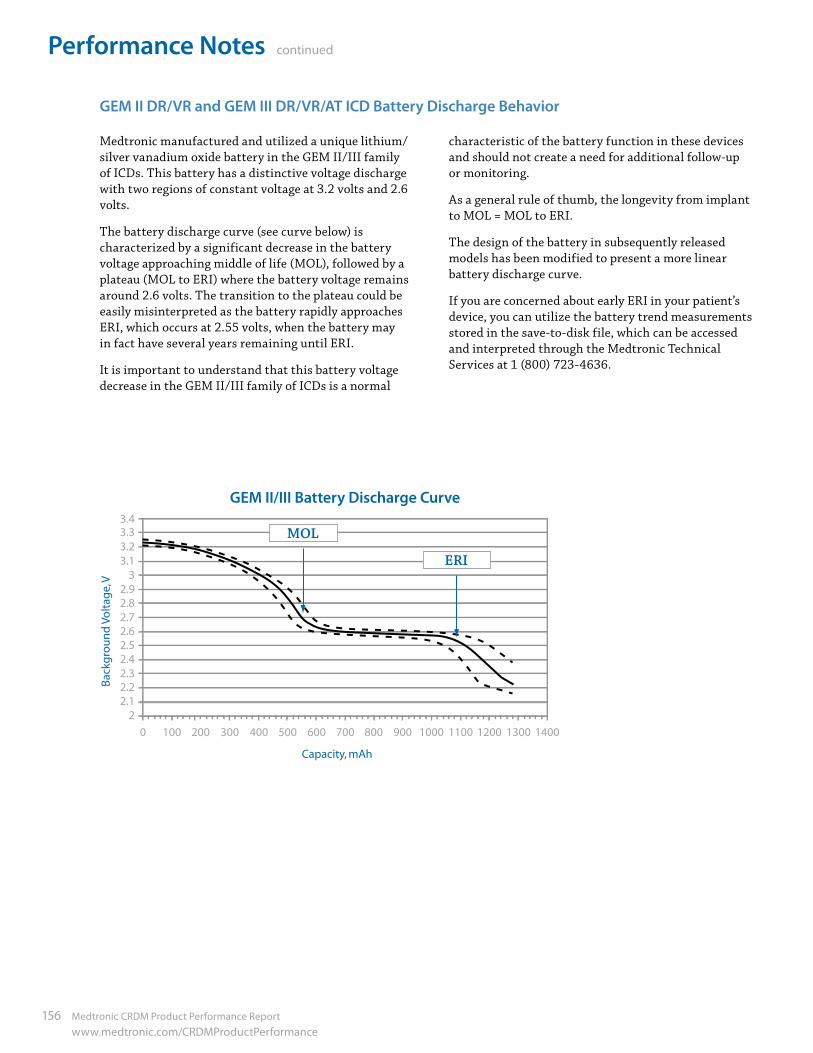
Performance Notes continued
156 Medtronic CRDM Product Performance Report www.medtronic.com/CRDMProductPerformance
GEM II DR/VR and GEM III DR/VR/AT ICD Battery Discharge Behavior
Medtronic manufactured and utilized a unique lithium/silver vanadium oxide battery in the GEM II/III family of ICDs. This battery has a distinctive voltage discharge with two regions of constant voltage at 3.2 volts and 2.6 volts.
The battery discharge curve (see curve below) is characterized by a significant decrease in the battery voltage approaching middle of life (MOL), followed by a plateau (MOL to ERI) where the battery voltage remains around 2.6 volts. The transition to the plateau could be easily misinterpreted as the battery rapidly approaches ERI, which occurs at 2.55 volts, when the battery may in fact have several years remaining until ERI.
It is important to understand that this battery voltage decrease in the GEM II/III family of ICDs is a normal
characteristic of the battery function in these devices and should not create a need for additional follow-up or monitoring.
As a general rule of thumb, the longevity from implant to MOL = MOL to ERI.
The design of the battery in subsequently released models has been modified to present a more linear battery discharge curve.
If you are concerned about early ERI in your patient’s device, you can utilize the battery trend measurements stored in the save-to-disk file, which can be accessed and interpreted through the Medtronic Technical Services at 1 (800) 723-4636.
GEM II/III Battery Discharge Curve
Capacity, mAh
Bac
kgro
un
d V
olt
age,
V
3.43.33.23.1
32.92.82.72.62.52.42.32.22.1
2
0 100 200 300 400 500 600 700 800 900 1000 1100 1200 1300 1400
ERI
MOL
GEM II/III Battery Discharge Curve
Medtronic CRDM Product Performance Report 157 www.medtronic.com/CRDMProductPerformance
Performance Notes continued
Perf
orm
ance
N
otes
Implanted leads operate in the challenging biochemical environment of the human body and the body’s response to foreign objects. Implanted leads are also subject to mechanical stresses associated with heart motion, body motion, and patient anatomy.
In this environment, pacemaker and defibrillation leads cannot be expected to last forever. Unlike implantable cardioverter defibrillators (ICDs), a lead’s longevity cannot be predicted nor are there simple indicators that a lead is approaching the end of its service life. The determination that a lead may be approaching end of service life requires follow-up of the chronically implanted lead and thorough evaluation of lead integrity at ICD replacement.
Follow-Up of Chronically Implanted LeadsThe frequency of follow-up for ICD patients will depend on a number of factors including the patient’s medical condition, ICD system implant time, hospital/clinic follow-up practice, and Medicare guidelines. In all cases, it is important to assess the functionality of the ICD system and the integrity. For newly implanted leads, it is beneficial to establish a baseline of chronic performance parameters once the lead has stabilized, generally within 6 to 12 months after implant. These performance parameters should include pacing and sensing thresholds and impedance. During routine patient follow-up, these procedures can be used to evaluate lead integrity. Measure pacing and sensing threshold and compare to the
chronic baseline. Significant increases or decreases may be indicative of lead failure, dislodgement, perforation, exit block, etc.
Measure pacing impedance where possible and compare to the chronic baseline. Decreases of 30% or more or pacing impedances below 200-250 ohms may be indicative of insulation failure. Sudden and significant increases in pacing impedance may be indicative of conductor fracture.
High voltage lead circuit impedance should be between 10-75 ohms at system implant. Chronic measurements below 10 and above 200 ohms may be indicative of high voltage lead circuit failure.
Carefully review ECGs or the nonsustained detection log on Medtronic ICDs for indications of pacing and/or sensing abnormalities such as oversensing, undersensing, and loss of capture
Elicit and investigate any patient complaints/symptoms that may be suggestive of potential lead failure
Where routine follow-up indicates, additional tools should be used to further evaluate performance. Tools include radiographic data, ICD electrograms, ICD Patient Alert and performance information from the Product Surveillance Registry (PSR).
The final decision on the functional integrity and continued use of an implanted lead must be a matter of medical judgment based on these factors as well as specific patient conditions.
General Criteria for Lead ReplacementThe evaluation of a chronically implanted lead is an important part of the decision to continue to use the lead with a new ICD. However, these results alone do not necessarily predict the future integrity of that lead. With the expected longevity of today’s ICDs varying between approximately 5 and 10 years, a physician replacing a device should consider a number of factors, including those listed below.
Factors that should be considered in a decision to replace or continue to use include: Pacing and sensing thresholds should be evaluated for the
potential to maintain acceptable levels Pacing impedance should be measured. Bear in mind that
pacing impedance below 250 ohms results in excessive battery current drain, which may seriously compromise ICD longevity, regardless of lead integrity.
The physical appearance of the lead should be examined for insulation cracks, breaches, or other indications of lead wear or degradation
Medtronic System Longevity Study data should be referenced. Actuarial survival of the lead and the observed lead failure mechanisms are specific factors to consider. Use of a new lead should be considered if failure mechanisms suggest an increased time dependency as suggested in the shape of performance curve for the specific lead model.
Current publications may provide additional information on the clinical management of leads.1-3 Ultimately, the decision to replace an implanted lead involves medical judgment.
1 Hauser RG, Cannom D, Hayes DL, et al. Long-term structural failure of coaxial polyurethane implantable cardioverter defibrillator leads. PACE. June 2002;25(6):879-882.
2 Ellenbogen KA, Wood MA, Shepard RK, et al. Detection and management of an implantable cardioverter defibrillator lead failure: incidence and clinical implications. J Am Coll Cardiol. January 1, 2003;41(1):73-80.
3 Hauser RG, Kallinen LM, Almquist AK, Gornick CC, Katsiyiannis WT. Early failure of a small-diameter high-voltage implantable cardioverter-defibrillator lead. Heart Rhythm. July 2007;4(7):892-896.
General Follow-Up and Replacement of ICD Leads
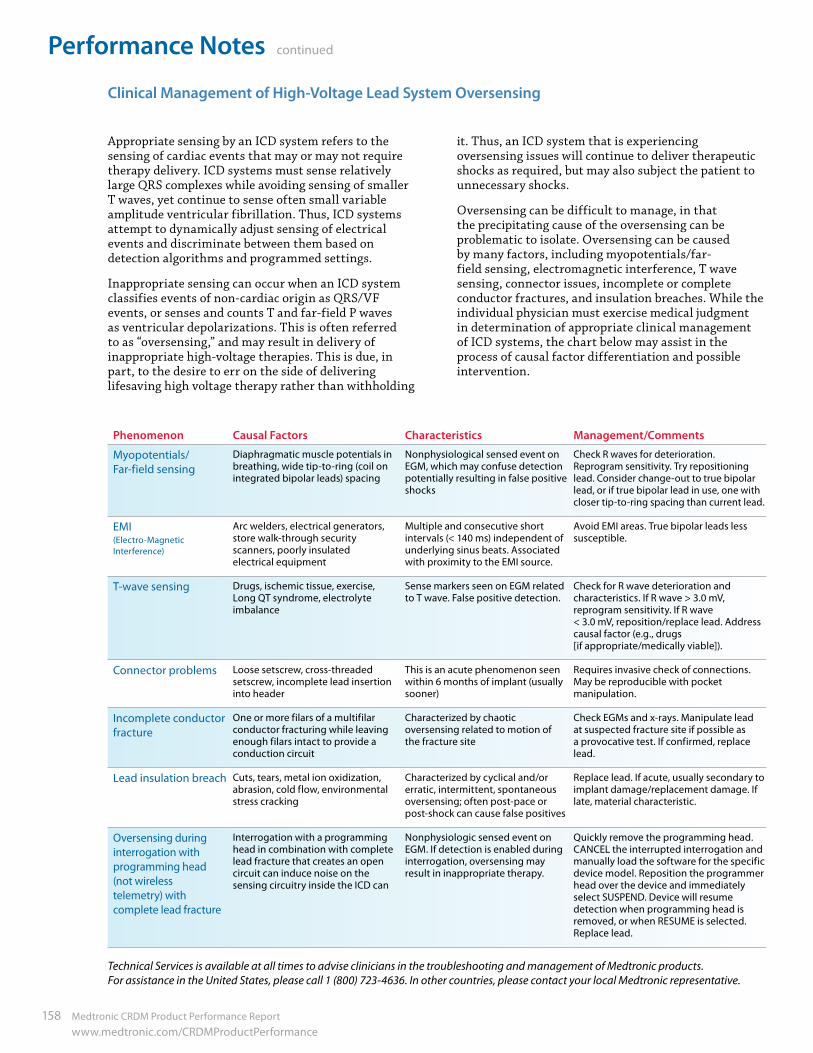
Performance Notes continued
158 Medtronic CRDM Product Performance Report www.medtronic.com/CRDMProductPerformance
Appropriate sensing by an ICD system refers to the sensing of cardiac events that may or may not require therapy delivery. ICD systems must sense relatively large QRS complexes while avoiding sensing of smaller T waves, yet continue to sense often small variable amplitude ventricular fibrillation. Thus, ICD systems attempt to dynamically adjust sensing of electrical events and discriminate between them based on detection algorithms and programmed settings.
Inappropriate sensing can occur when an ICD system classifies events of non-cardiac origin as QRS/VF events, or senses and counts T and far-field P waves as ventricular depolarizations. This is often referred to as “oversensing,” and may result in delivery of inappropriate high-voltage therapies. This is due, in part, to the desire to err on the side of delivering lifesaving high voltage therapy rather than withholding
it. Thus, an ICD system that is experiencing oversensing issues will continue to deliver therapeutic shocks as required, but may also subject the patient to unnecessary shocks.
Oversensing can be difficult to manage, in that the precipitating cause of the oversensing can be problematic to isolate. Oversensing can be caused by many factors, including myopotentials/far-field sensing, electromagnetic interference, T wave sensing, connector issues, incomplete or complete conductor fractures, and insulation breaches. While the individual physician must exercise medical judgment in determination of appropriate clinical management of ICD systems, the chart below may assist in the process of causal factor differentiation and possible intervention.
Phenomenon Causal Factors Characteristics Management/Comments
Myopotentials/ Far-field sensing
Diaphragmatic muscle potentials in breathing, wide tip-to-ring (coil on integrated bipolar leads) spacing
Nonphysiological sensed event on EGM, which may confuse detection potentially resulting in false positive shocks
Check R waves for deterioration. Reprogram sensitivity. Try repositioning lead. Consider change-out to true bipolar lead, or if true bipolar lead in use, one with closer tip-to-ring spacing than current lead.
EMI (Electro-Magnetic Interference)
Arc welders, electrical generators, store walk-through security scanners, poorly insulated electrical equipment
Multiple and consecutive short intervals (< 140 ms) independent of underlying sinus beats. Associated with proximity to the EMI source.
Avoid EMI areas. True bipolar leads less susceptible.
T-wave sensing Drugs, ischemic tissue, exercise, Long QT syndrome, electrolyte imbalance
Sense markers seen on EGM related to T wave. False positive detection.
Check for R wave deterioration and characteristics. If R wave > 3.0 mV, reprogram sensitivity. If R wave < 3.0 mV, reposition/replace lead. Address causal factor (e.g., drugs [if appropriate/medically viable]).
Connector problems Loose setscrew, cross-threaded setscrew, incomplete lead insertion into header
This is an acute phenomenon seen within 6 months of implant (usually sooner)
Requires invasive check of connections. May be reproducible with pocket manipulation.
Incomplete conductor fracture
One or more filars of a multifilar conductor fracturing while leaving enough filars intact to provide a conduction circuit
Characterized by chaotic oversensing related to motion of the fracture site
Check EGMs and x-rays. Manipulate lead at suspected fracture site if possible as a provocative test. If confirmed, replace lead.
Lead insulation breach Cuts, tears, metal ion oxidization, abrasion, cold flow, environmental stress cracking
Characterized by cyclical and/or erratic, intermittent, spontaneous oversensing; often post-pace or post-shock can cause false positives
Replace lead. If acute, usually secondary to implant damage/replacement damage. If late, material characteristic.
Oversensing during interrogation with programming head (not wireless telemetry) with complete lead fracture
Interrogation with a programming head in combination with complete lead fracture that creates an open circuit can induce noise on the sensing circuitry inside the ICD can
Nonphysiologic sensed event on EGM. If detection is enabled during interrogation, oversensing may result in inappropriate therapy.
Quickly remove the programming head. CANCEL the interrupted interrogation and manually load the software for the specific device model. Reposition the programmer head over the device and immediately select SUSPEND. Device will resume detection when programming head is removed, or when RESUME is selected. Replace lead.
Technical Services is available at all times to advise clinicians in the troubleshooting and management of Medtronic products. For assistance in the United States, please call 1 (800) 723-4636. In other countries, please contact your local Medtronic representative.
Clinical Management of High-Voltage Lead System Oversensing
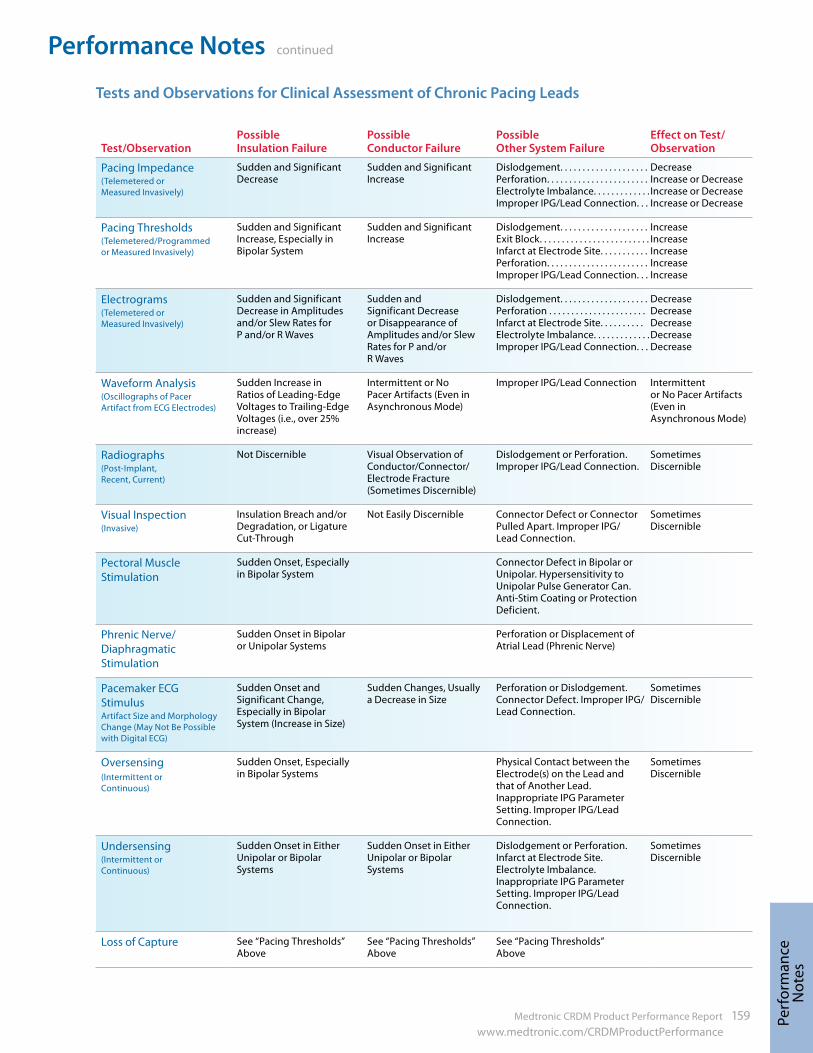
Medtronic CRDM Product Performance Report 159 www.medtronic.com/CRDMProductPerformance
Performance Notes continued
Perf
orm
ance
N
otes
Test/ObservationPossible Insulation Failure
Possible Conductor Failure
Possible Other System Failure
Effect on Test/Observation
Pacing Impedance (Telemetered or Measured Invasively)
Sudden and Significant Decrease
Sudden and Significant Increase
Dislodgement. . . . . . . . . . . . . . . . . . . . Perforation. . . . . . . . . . . . . . . . . . . . . . .Electrolyte Imbalance. . . . . . . . . . . . . Improper IPG/Lead Connection. . .
Decrease Increase or Decrease Increase or Decrease Increase or Decrease
Pacing Thresholds (Telemetered/Programmed or Measured Invasively)
Sudden and Significant Increase, Especially in Bipolar System
Sudden and Significant Increase
Dislodgement. . . . . . . . . . . . . . . . . . . . Exit Block. . . . . . . . . . . . . . . . . . . . . . . . . Infarct at Electrode Site. . . . . . . . . . . Perforation. . . . . . . . . . . . . . . . . . . . . . .Improper IPG/Lead Connection. . .
IncreaseIncrease Increase Increase Increase
Electrograms (Telemetered or Measured Invasively)
Sudden and Significant Decrease in Amplitudes and/or Slew Rates for P and/or R Waves
Sudden and Significant Decrease or Disappearance of Amplitudes and/or Slew Rates for P and/or R Waves
Dislodgement. . . . . . . . . . . . . . . . . . . . Perforation . . . . . . . . . . . . . . . . . . . . . . Infarct at Electrode Site. . . . . . . . . . Electrolyte Imbalance. . . . . . . . . . . . . Improper IPG/Lead Connection. . .
Decrease Decrease Decrease Decrease Decrease
Waveform Analysis (Oscillographs of Pacer Artifact from ECG Electrodes)
Sudden Increase in Ratios of Leading-Edge Voltages to Trailing-Edge Voltages (i.e., over 25% increase)
Intermittent or No Pacer Artifacts (Even in Asynchronous Mode)
Improper IPG/Lead Connection Intermittent or No Pacer Artifacts (Even in Asynchronous Mode)
Radiographs (Post-Implant, Recent, Current)
Not Discernible Visual Observation of Conductor/Connector/Electrode Fracture (Sometimes Discernible)
Dislodgement or Perforation. Improper IPG/Lead Connection.
Sometimes Discernible
Visual Inspection (Invasive)
Insulation Breach and/or Degradation, or Ligature Cut-Through
Not Easily Discernible Connector Defect or Connector Pulled Apart. Improper IPG/ Lead Connection.
Sometimes Discernible
Pectoral Muscle Stimulation
Sudden Onset, Especially in Bipolar System
Connector Defect in Bipolar or Unipolar. Hypersensitivity to Unipolar Pulse Generator Can. Anti-Stim Coating or Protection Deficient.
Phrenic Nerve/Diaphragmatic Stimulation
Sudden Onset in Bipolar or Unipolar Systems
Perforation or Displacement of Atrial Lead (Phrenic Nerve)
Pacemaker ECG Stimulus Artifact Size and Morphology Change (May Not Be Possible with Digital ECG)
Sudden Onset and Significant Change, Especially in Bipolar System (Increase in Size)
Sudden Changes, Usually a Decrease in Size
Perforation or Dislodgement. Connector Defect. Improper IPG/Lead Connection.
Sometimes Discernible
Oversensing(Intermittent or Continuous)
Sudden Onset, Especially in Bipolar Systems
Physical Contact between the Electrode(s) on the Lead and that of Another Lead. Inappropriate IPG Parameter Setting. Improper IPG/Lead Connection.
Sometimes Discernible
Undersensing(Intermittent or Continuous)
Sudden Onset in Either Unipolar or Bipolar Systems
Sudden Onset in Either Unipolar or Bipolar Systems
Dislodgement or Perforation. Infarct at Electrode Site. Electrolyte Imbalance. Inappropriate IPG Parameter Setting. Improper IPG/Lead Connection.
Sometimes Discernible
Loss of Capture See “Pacing Thresholds” Above
See “Pacing Thresholds” Above
See “Pacing Thresholds” Above
Tests and Observations for Clinical Assessment of Chronic Pacing Leads
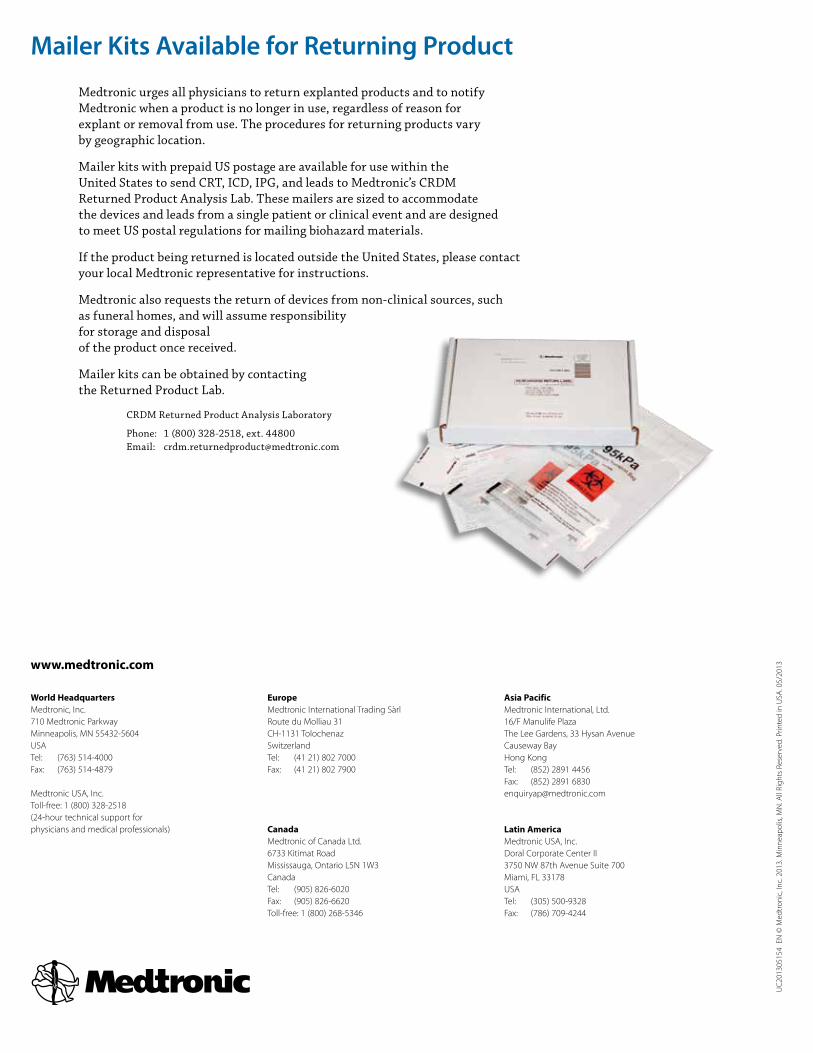
Mailer Kits Available for Returning Product
World HeadquartersMedtronic, Inc. 710 Medtronic Parkway Minneapolis, MN 55432-5604 USA Tel: (763) 514-4000 Fax: (763) 514-4879 Medtronic USA, Inc. Toll-free: 1 (800) 328-2518(24-hour technical support for physicians and medical professionals)
EuropeMedtronic International Trading Sàrl Route du Molliau 31 CH-1131 Tolochenaz Switzerland Tel: (41 21) 802 7000 Fax: (41 21) 802 7900
CanadaMedtronic of Canada Ltd. 6733 Kitimat Road Mississauga, Ontario L5N 1W3 Canada Tel: (905) 826-6020 Fax: (905) 826-6620 Toll-free: 1 (800) 268-5346
Asia PacificMedtronic International, Ltd. 16/F Manulife Plaza The Lee Gardens, 33 Hysan Avenue Causeway Bay Hong Kong Tel: (852) 2891 4456 Fax: (852) 2891 6830 [email protected]
Latin AmericaMedtronic USA, Inc. Doral Corporate Center II 3750 NW 87th Avenue Suite 700 Miami, FL 33178 USA Tel: (305) 500-9328 Fax: (786) 709-4244
UC2
0130
5154
EN
© M
edtr
onic
, Inc
. 201
3. M
inne
apol
is, M
N. A
ll Ri
ghts
Res
erve
d. P
rinte
d in
USA
. 05/
2013
www.medtronic.com
Medtronic urges all physicians to return explanted products and to notify Medtronic when a product is no longer in use, regardless of reason for explant or removal from use. The procedures for returning products vary by geographic location.
Mailer kits with prepaid US postage are available for use within the United States to send CRT, ICD, IPG, and leads to Medtronic’s CRDM Returned Product Analysis Lab. These mailers are sized to accommodate the devices and leads from a single patient or clinical event and are designed to meet US postal regulations for mailing biohazard materials.
If the product being returned is located outside the United States, please contact your local Medtronic representative for instructions.
Medtronic also requests the return of devices from non-clinical sources, such as funeral homes, and will assume responsibility for storage and disposal of the product once received.
Mailer kits can be obtained by contacting the Returned Product Lab.
CRDM Returned Product Analysis Laboratory
Phone: 1 (800) 328-2518, ext. 44800 Email: [email protected]