Cardiac Conduction and EKG’s - grasley.comgrasley.com/pcc/lab/232_lab/232-8_EKG.pdf · ·...
16
Ex 31 Cardiac Conduction and EKG’s Conduction System The heart has its own intrinsic nervous system which travels in the myocardium just under the endocardium cardiac action potential travels from atria to ventricles in these fibers controls the heart rate conducts impulses quickly through the myocardium so each area contracts essentially at once if the myocardium was responsible for propagating the impulse the conduction would be much slower and the heart would not contract uniformly 1 2
Transcript of Cardiac Conduction and EKG’s - grasley.comgrasley.com/pcc/lab/232_lab/232-8_EKG.pdf · ·...

Ex 31
Cardiac Conduction and EKG’s
Conduction SystemThe heart has its own intrinsic nervous system which travels in the myocardium just under the endocardium
cardiac action potential travels from atria to ventricles in these fiberscontrols the heart rateconducts impulses quickly through the myocardium so each area contracts essentially at once
if the myocardium was responsible for propagating the impulse the conduction would be much slower and the heart would not contract uniformly
1
2
Conduction Systemsinoatrial node
located in right atrium inf. to opening of SVCaction potential begins hereinitiates atrial contraction
atrioventricular nodelocated in right atrium ant. to opening of coronary sinusmain job is to delay the action potential to give atria time to contract
bundle of His (AV bundle)only site where atrial impulses can travel to the ventricles
bundle branchesPurkinje fibers (not shown)
small branches that travel from endocardium into myocadium
Conduction SystemReview
cardiac action potential is initated in the SA nodetravels quickly through pathways to simultaneously contract the atria
the atria and ventricles are insulated from each other so atrial action potentials can only enter ventricles through one pathway
action potential enters AV node where the impulses are slowed down and held momentarily
this gives the atria time to contract
the action potential then travels quickly to the rest of the ventricular myocardium through the AV bundle, bundle branches and purkinje fibers
3
4

RhythmicityThe heart has built in pacemakersSA node
main pacemaker of the heartintrinsic rate of 60-100 bpmif the SA node becomes diseased other areas pick up pacemaking responsibility
sometimes other areas of the atrium will begin pacing known as ectopic foci
AV nodesecondary pacemaker of the heartintrinsic rate of 40-60 bpm
Ventricular pacingAV bundle, branches, purkinje fibers20-40 bpm
Electrical Flowresting myocardial cells have a net negative charge at restwhen an AP reaches a cell it depolarizes causing the internal net charge to become positiveelectrically, the action potential traveling through the heart can be viewed as a wave of positive chargeVector
the average direction of all of the positive charges as they travel through the myocardiumthe average vector in a normal heart travels to the left and downward
5
6

Electrical FlowVector Influences
things that influence the overall amount of charge flowing through the myocardium will change the average direction the the charge is flowingInfarction
essentially an area that no longer carries chargewhat would happen to the vector if the posterior wall of the l. ventricle infarcted?
Hypertrophyessentially an area that carries extra chargehow would the vector change with l. ventricular hypertrophy?
vector points towards hypertrophy and away from infarction
7
8

ElectrocardiogramYou can measure the electric flow of the heart through skin sensors placed on the arms and legs
for simplicity we will look only at lead I for nowLead I
goes from left arm to right armleft lead is +right lead is —depolarization towards the positive lead causes upward deflectiondepolarization towards the negative lead causes negative deflection
— +
ElectrocardiogramEKG paper
travels under the pen at 25mm/secondhorizontal squares every 1mm
1mm = 0.04 seconds5mm = 0.2 seconds
5 big boxes/secvertical squares every 1mm
1mm = 0.1 mV5mm = 0.5 mV
keep in mind that the waves on the EKG only measure electrical activity in the heart and that contraction of myocardium delays the waves by a few milliseconds
9
10

ElectrocardiogramThe Waves
P waveatrial depolarization
duration 0.11samplitude < 3mm
detects atrial functionSA node
ElectrocardiogramThe Waves
QRS Complexventricular depolarization
duration 0.10sdetects ventricular function
Q wavefirst downward stroke
R wavefirst upward stroke
S waveany downward stroke preceded by an upward stroke
T waveventricular repolarization
11
12

Intervals and SegmentsPR segment
end of P wave to start of QRSmeasures time of depolarization through AV node
PR intervalstart of P wave to start of QRSmeasures time from start of SA conduction to end of AV node conductionnormal 0.12-0.20s
Intervals and SegmentsST segment
end of QRS complex to start of T wavemeasures start of ventricular repolarizationelevated in MI’s
ST intervalend of QRS to end of T waverepresents complete time of ventricular repolarization
QT intervalstart of QRS to end of T waveduration of ventricular systole< 1/2 of the RR interval
13
14

Intervals and SegmentsIntervals
the timing for depolarizations/repolarizations can be interpreted from the EKGP-R 0.12-0.2 sec
measures the time between the start of atrial depolarization and the start of ventricular depolarizationa long P-Q interval is a sign of AV node dysfunction
QT interval, about 0.4 secstart of QRS to end of T wave
QRS 0.08-0.1 secwider with ventricular dysfunction
ST segment (don’t worry about time)elevated with acute MI
ElectrocardiogramThe waves
more on the QRSnote that the Q or the R or the S wave is not always presentname according to direction of first deflection, second, etcQ waves are often absent
lead V1no Qsmall Rlarge S
lead V2no Qlarge Rsmall S
15
16

Heart RateHeart Ratedefined as beats per minuteeasy way to estimate rate
find an R wave on a thick linecount off on the thick lines
300, 150, 100, 75, 60, 50until you reach another R wave
in our example the middle R wave falls on the dark line
the next R falls just before the 75, so estimate about 80 bpm
300
150
100
75
Normal Sinus Rhythmheart rate between 60-100 bpm pacing by SA node.QRS after every P waverhythm is regular
Sinus Tachycardiaheart rate > 100 bpmp wave is there but hidden by the T waveregular QRS rhythm
Sinus Bradycardiaheart rate < 60 bpmQRS after every P waveregular rhythm
Heart Rate
17
18

ST segment elevationischemia
Q wavein some leads may indicate ischemia and necrosis
T wave inversionlate sign of necrosis and fibrosis
Wave Abnormalities
Atrial Fibrillationmultifocal areas in atria firing
no p waves and irregular heart rate
Rhythm Abnormalities
19
20

Complete (3rd degree) AV Block AV node cannot conduct impulse
p waves and QRS not connectedirregular heart rate
Rhythm Abnormalities
Premature Ventricular Contractionsventricles pace early
early heart beatlarge QRS
Rhythm Abnormalities
21
22
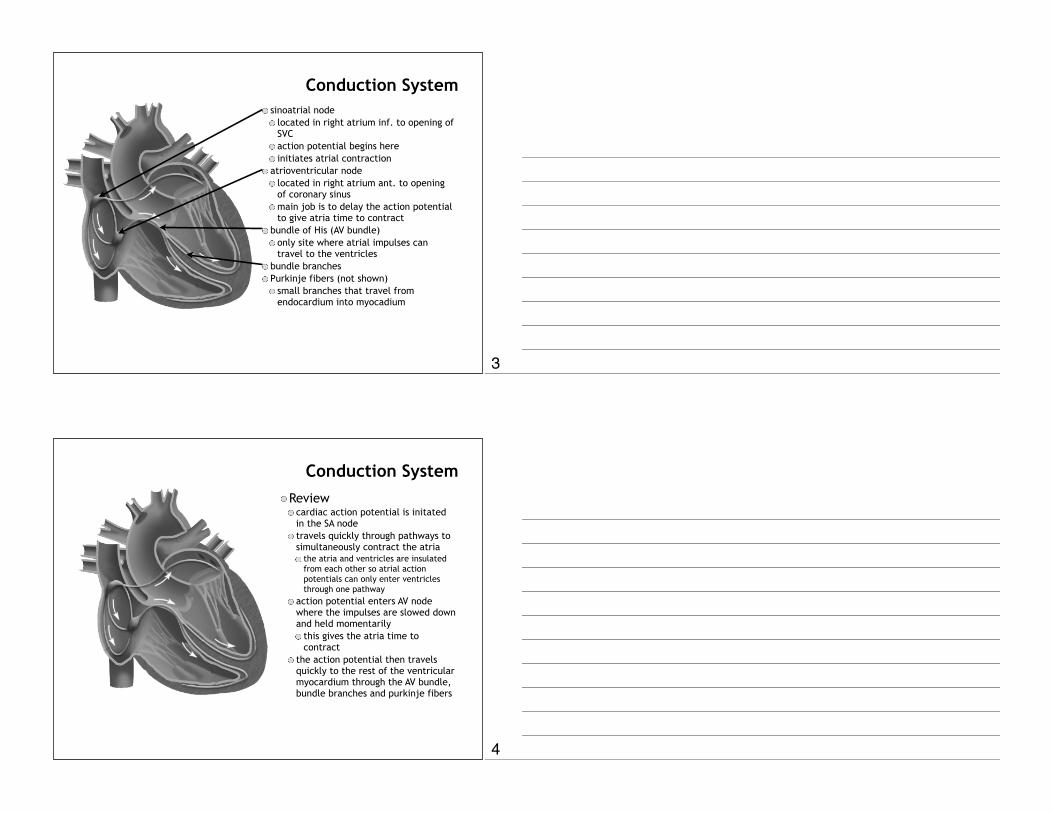
Ventricular Tachycardiarapid ventricular pacing
rapid, regular ratewide QRS
Rhythm Abnormalities
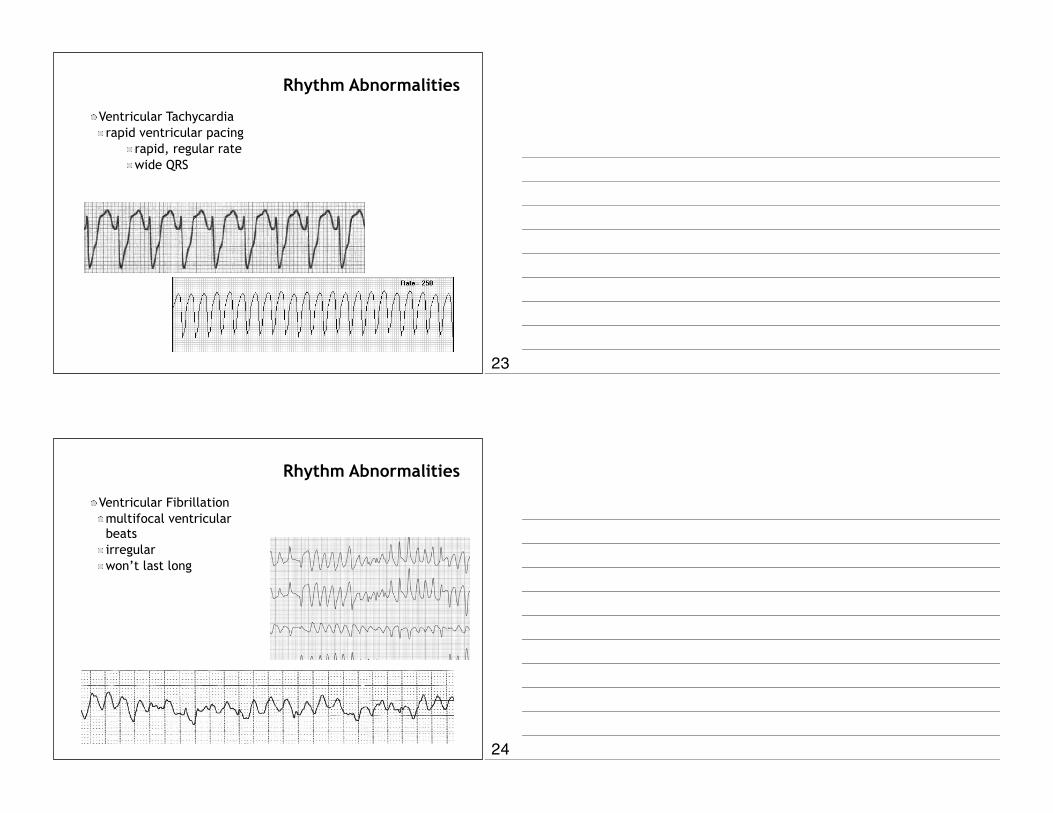
Ventricular Fibrillationmultifocal ventricular beatsirregularwon’t last long
Rhythm Abnormalities
23
24

0
+90
180
-90
AxisQRS AXIS
another name for the vector of depolarizationan axis is measured in degrees the axis is measured by adding the positive deflection and subtracting the negative deflection
overall + is left axis directionoverall - is right axis direction
for lead one most of the QRS is positive, therefore it has a leftward axisif an MI caused the QRS to be mostly negative the lead would have a rightward axis
— +
QRS AXISlead II
positive on left legnegative on right arm
looking at the tracing we see that the QRS is mostly positive
what does this mean?0
+90
180
-90
—
+
Axis
25
26
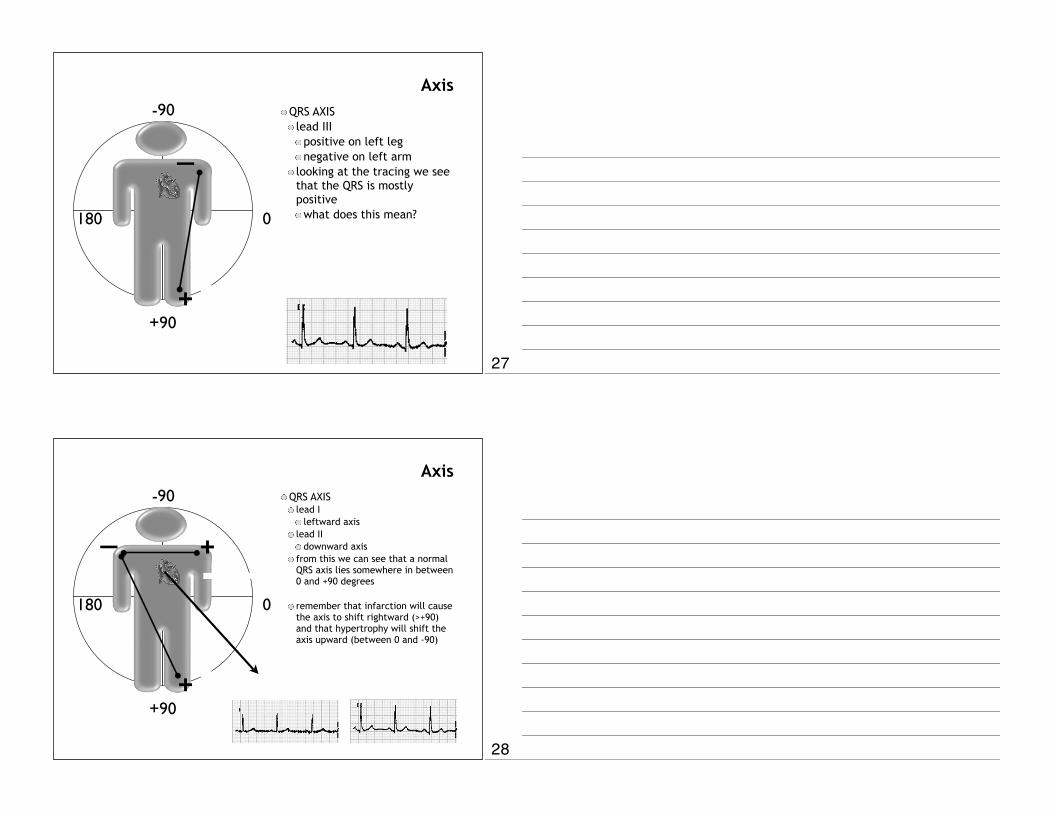
QRS AXISlead III
positive on left legnegative on left arm
looking at the tracing we see that the QRS is mostly positive
what does this mean?0
+90
180
-90
—
+
Axis
QRS AXISlead I
leftward axislead II
downward axisfrom this we can see that a normal QRS axis lies somewhere in between 0 and +90 degrees
remember that infarction will cause the axis to shift rightward (>+90) and that hypertrophy will shift the axis upward (between 0 and -90)
0
+90
180
-90
—
+
+
Axis
27
28

Blood Vessel Histologyarteries
usually round and thick walledthree layers
tunica intimasimple squamous epitheliuminternal elastic lamina
tunica mediasmooth muscle cellselastic tissue
tunica externa (adventitia)areolar or fibrous connective tissue
Blood Vessel Histologyveins
irregular, thin-walledthree layers (but thinner!)
tunica intimasimple squamous epitheliuminternal elastic lamina
tunica mediasmooth muscle cellselastic tissue
tunica externa (adventitia)areolar or fibrous connective tissue
valves seen in extremitiesshown at black arrows
29
30
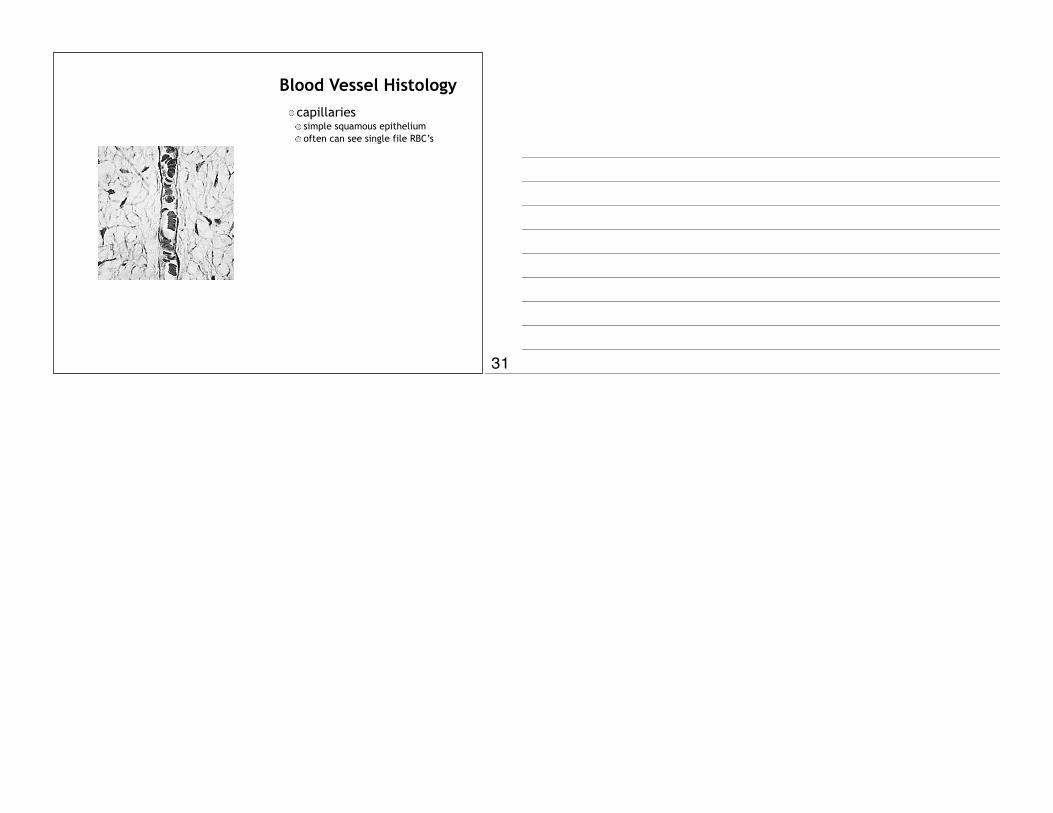
Blood Vessel Histologycapillaries
simple squamous epitheliumoften can see single file RBC’s
31