Cardiac arrhythmias detection in an ECG beat signal using ... · PDF fileCardiac arrhythmias...
8
J. Biomedical Science and Engineering, 2011, 4, 289-296 JBiSE doi:10.4236/jbise.2011.44039 Published Online April 2011 (http://www.SciRP.org/journal/jbise/ ). Published Online April 2011 in SciRes. http://www.scirp.org/journal/JBiSE Cardiac arrhythmias detection in an ECG beat signal using fast fourier transform and artificial neural network Himanshu Gothwal 1 , Silky Kedawat 1 , Rajesh Kumar 2 1 Department of Computer Science and Engineering, Malaviya National Institute of Technology, Jaipur, India; 2 Department of Electrical Engineering, Malaviya National Institute of Technology, Jaipur, India. Email: [email protected] , [email protected] , [email protected] Received 15 April 2010; revised 13 May 2010; accepted 17 May 2010. ABSTRACT Cardiac Arrhythmias shows a condition of abnor- mal electrical activity in the heart which is a threat to humans. This paper presents a method to analyze electrocardiogram (ECG) signal, extract the fea- tures, for the classification of heart beats according to different arrhythmias. Data were obtained from 40 records of the MIT-BIH arrhythmia database (only one lead). Cardiac arrhythmias which are found are Tachycardia, Bradycardia, Supraventricular Tachycar- dia, Incomplete Bundle Branch Block, Bundle Branch Block, Ventricular Tachycardia. A learning dataset for the neural network was obtained from a twenty records set which were manually classified using MIT-BIH Arrhythmia Database Directory and docu- mentation, taking advantage of the professional ex- perience of a cardiologist. Fast Fourier transforms are used to identify the peaks in the ECG signal and then Neural Networks are applied to identify the diseases. Levenberg Marquardt Back-Propagation algorithm is used to train the network. The results obtained have better efficiency then the previously proposed methods. Keywords: Cardiac Arrhythmias; Neural Network; Electrocardiogram (ECG); Fast Fourier Transform (FFT) 1. INTRODUCTION Electrocardiogram contains a wealth of diagnostic in- formation routinely used to guide clinical decision mak- ing. ECG remains the reference standard for diagnosis despite the advance of many other diagnostic techniques [1]. With the features present in ECG Signal various Cardiac Arrythmias can be predicted. Within the last decade many new approaches to feature extraction have been proposed, for example, algorithms from the field of artificial neural networks [2-5], genetic algorithms [6], wavelet transforms [7], filter as well as heuristic meth- ods mostly based on nonlinear transforms. In our Project twenty records (chosen arbitrarily) are used each in the training and testing of the EKG classifier in this project. The overview is focused on the description of the princi- ples. Algorithmic details can be found in the original papers that are referenced at the end of this article. Be- yond feature extraction and deflection identification, many papers have been published in related fields. Con- ventional approach to predict these diseases is to analyze the ECG signal by the doctor manually. Various con- figurations of neural network are tried and the best con- figuration is proposed here. The results obtained are bet- ter then earlier approaches. The method used for peak identification is also very flexible for detecting peaks in ECGs that do not follow the normal pattern. Section 2 discusses the problem and various aspects related to it. The methodology for Identification of QRS complex and disease prediction is discussed in Section 3. Section 4 deals with the results and discussions. 2. PROBLEM FORMULATION Cardiac arrhythmias can be detected using an ECG Sig- nal. By determining the features present in an ECG sig- nal various arrhythmias like Tachycardia, Bradycardia, Supraventricular Tachycardia, Incomplete Bundle Bran- ch Block, Bundle Branch Block, Ventricular Tachycardia can be detected. Using Fast Fourier Transform noise can be removed form ECG signal and using Neural Net- works Arrhythmias can be detected efficiently. The ECG is a noninvasive technique that is inexpen- sive, simple, and reproducible. It is one of the most commonly used diagnostic test that can be recorded rap- idly with the extremely portable equipment and gener- ally is always obtainable [1]. Electrocardiography has a basic role in cardiology since it consists of effective, simple, noninvasive, low-cost procedures for the diag- nosis of cardiovascular disorders that have a high epi-
Transcript of Cardiac arrhythmias detection in an ECG beat signal using ... · PDF fileCardiac arrhythmias...
J. Biomedical Science and Engineering, 2011, 4, 289-296 JBiSE doi:10.4236/jbise.2011.44039 Published Online April 2011 (http://www.SciRP.org/journal/jbise/).
Published Online April 2011 in SciRes. http://www.scirp.org/journal/JBiSE
Cardiac arrhythmias detection in an ECG beat signal using fast fourier transform and artificial neural network Himanshu Gothwal1, Silky Kedawat1, Rajesh Kumar2 1Department of Computer Science and Engineering, Malaviya National Institute of Technology, Jaipur, India; 2Department of Electrical Engineering, Malaviya National Institute of Technology, Jaipur, India. Email: [email protected], [email protected], [email protected] Received 15 April 2010; revised 13 May 2010; accepted 17 May 2010. ABSTRACT
Cardiac Arrhythmias shows a condition of abnor-mal electrical activity in the heart which is a threat to humans. This paper presents a method to analyze electrocardiogram (ECG) signal, extract the fea-tures, for the classification of heart beats according to different arrhythmias. Data were obtained from 40 records of the MIT-BIH arrhythmia database (only one lead). Cardiac arrhythmias which are found are Tachycardia, Bradycardia, Supraventricular Tachycar-dia, Incomplete Bundle Branch Block, Bundle Branch Block, Ventricular Tachycardia. A learning dataset for the neural network was obtained from a twenty records set which were manually classified using MIT-BIH Arrhythmia Database Directory and docu- mentation, taking advantage of the professional ex- perience of a cardiologist. Fast Fourier transforms are used to identify the peaks in the ECG signal and then Neural Networks are applied to identify the diseases. Levenberg Marquardt Back-Propagation algorithm is used to train the network. The results obtained have better efficiency then the previously proposed methods. Keywords: Cardiac Arrhythmias; Neural Network; Electrocardiogram (ECG); Fast Fourier Transform (FFT)
1. INTRODUCTION
Electrocardiogram contains a wealth of diagnostic in-formation routinely used to guide clinical decision mak-ing. ECG remains the reference standard for diagnosis despite the advance of many other diagnostic techniques [1]. With the features present in ECG Signal various Cardiac Arrythmias can be predicted. Within the last decade many new approaches to feature extraction have been proposed, for example, algorithms from the field of artificial neural networks [2-5], genetic algorithms [6],
wavelet transforms [7], filter as well as heuristic meth-ods mostly based on nonlinear transforms. In our Project twenty records (chosen arbitrarily) are used each in the training and testing of the EKG classifier in this project. The overview is focused on the description of the princi-ples. Algorithmic details can be found in the original papers that are referenced at the end of this article. Be-yond feature extraction and deflection identification, many papers have been published in related fields. Con-ventional approach to predict these diseases is to analyze the ECG signal by the doctor manually. Various con-figurations of neural network are tried and the best con-figuration is proposed here. The results obtained are bet-ter then earlier approaches. The method used for peak identification is also very flexible for detecting peaks in ECGs that do not follow the normal pattern. Section 2 discusses the problem and various aspects related to it. The methodology for Identification of QRS complex and disease prediction is discussed in Section 3. Section 4 deals with the results and discussions.
2. PROBLEM FORMULATION
Cardiac arrhythmias can be detected using an ECG Sig-nal. By determining the features present in an ECG sig-nal various arrhythmias like Tachycardia, Bradycardia, Supraventricular Tachycardia, Incomplete Bundle Bran- ch Block, Bundle Branch Block, Ventricular Tachycardia can be detected. Using Fast Fourier Transform noise can be removed form ECG signal and using Neural Net-works Arrhythmias can be detected efficiently.
The ECG is a noninvasive technique that is inexpen-sive, simple, and reproducible. It is one of the most commonly used diagnostic test that can be recorded rap-idly with the extremely portable equipment and gener-ally is always obtainable [1]. Electrocardiography has a basic role in cardiology since it consists of effective, simple, noninvasive, low-cost procedures for the diag-nosis of cardiovascular disorders that have a high epi-

H. Gothwal et al. / J. Biomedical Science and Engineering 4 (2011) 289-296
Copyright © 2011 SciRes. JBiSE
290
demiologic incidence and are very relevant for their im-pact on patient life and on social costs. Biomedical en-gineering is the application of engineering principles and techniques to the medical field. It combines the design and problem solving skills of engineering with medical and biological sciences to help improve patient health care and the quality of life of individuals. Cardiac dis-ease is an umbrella term for a number of different dis-eases affecting the heart [8]. Cardiac arrhythmias are a common accompaniment of a variety of cardiac diseases [9]. Cardiac arrhythmias become important when they cause symptoms, threaten life, or are indicative of an adverse prognosis. In the last few years, most attention has been paid to ventricular ectopic beats. They have prolonged implications for a variety of cardiac patholo-gists. The research in cardiac arrhythmia has increased a lot but a system which can detect various arrhythmias present with a high accuracy and in real time is still not available. Due to this several people die as they have no idea of any arrhythmia present till it reaches to a level which can be risky for the life. The large majority of the deaths are sudden deaths after a heart attack. Sudden death is defined as death rising less than one hour after the first symptoms felt by the victim. It concerns about 300 000 people who die suddenly each year in the U.S. and 60 000 people per year in France. 90% of sudden deaths are due essentially to cardiac arrhythmias: 20% of cardiac arrhythmias are caused by heart block or pause (bradycardia) and 80% of them are caused by ventricular fibrillation (VF), frequently initiated by ventricular ta-chycardia (VT) [10].
Fundamentally an ECG is a graphic representation of the electrical activity of the heart muscle. A brief over-view of this electrical activity follows.
When cardiac muscle cells are excited, they produce an electrical impulse lasting approximately 300 ms. [11] [12].This is followed shortly by mechanical contraction of the muscle cells. The electrocardiographic deflections are termed P, QRS complex, T and U as in Figure 1. The P wave represents Atrial activation; QRS complex represents ventricular activation or depolarization. The T wave represents ventricular recovery or re-polarization and the S-T segment, the T wave and the U wave to-gether represent the total duration of ventricular recovery. The QRS complex is the most striking waveform within the electrocardiogram (ECG). Since it reflects the elec-trical activity within the heart during the ventricular contraction, the time of its occurrence as well as its shape provide much information about the current state of the heart. Due to its characteristic shape (see Figure 1) it serves as the basis for the automated determination of the heart rate, as an entry point for classification schemes
Figure 1. Diagrammatic representation of the basic electrocar-diographic deflections.
of the cardiac cycle. The standard clinical apparatus is the 12-lead system [13], whereas in this project a 3-lead system is used. Both feature 3 electrodes placed on the limbs. The MIT-BIH database is collaboration between MIT (Massachusetts Institute of Technology) and the Beth Israel Hospital (BIH) to produce a public database of EKG recordings for the analysis of arrhythmia and other cardiovascular conditions [14] .It consists of two- channel, half-hour ambulatory EKG recordings, totaling forty-eight records collected from forty-seven anony-mous patients, collected from 1976 to 1979.
Sinus node lies in the superior part of the right atrium at its junction with the superior vena cava. It is heart’s dominant pacemaker. Its intrinsic rate is modulated by a variety of neurohormonal influences to cause rate accel-eration in situations of increased demand for cardiac output. Normal Sinus rhythm is defined as rate between 60 and 100 beats per minute. Lower rates are termed sinus bradycardia and faster rates sinus tachycardia. Si-nus tachycardia reflects extracardiac pathology, for ex-ample, hyperthyroidism, anemia, or a catecholamine- secreting tumor. The term Supraventricular tachycardia (SVT) encompasses a range of common arrhythmias in which the atrial or atrioventricular (AV) node is essential for the perpetuation of the tachyarrhythmia [15,16]. Su-praventricular Tachycardia (SVT) is a fast heart rate that begins in the upper part of the heart (atria), above the ventricles. Normally, the heart’s electrical system pre-cisely controls the heart’s rhythm; in this condition, ab-normal electrical connections cause the heart to beat too fast. [17] Most Supraventricular Tachycardias result from abnormal electrical connections (bypass tracts) in the heart that short-circuit the normal electrical system and cause an increase in electrical activity. Supraventricular tachycardia may cause an uncomfortable feeling that the heart is racing, pounding, and/or beating irregularly (pal-pitations). If Supraventricular tachycardia recurs, medica-tions or a procedure called catheter ablation may be needed to correct the abnormal heartbeat. Bundle branch block (BBB) is a disruption in the normal flow of elec-
H. Gothwal et al. / J. Biomedical Science and Engineering 4 (2011) 289-296
Copyright © 2011 SciRes. JBiSE
291
trical pulses that drive the heart beat. Bundle branch block belongs to a group of heart problems called Intra-ventricular conduction defects (IVCD) [18]. There are two bundle branches, right and left. The right bundle carries nerve impulses that cause contraction of the right ventricle (the lower chamber of the heart) and the left bundle carries nerve impulses that cause contraction of the left ventricle. Bundle branch block is a slowing or interruption of nerve impulses. A problem may exist in any of the three bundles. Patients with BBB are gener-ally without symptoms unless the disease is severe enough to cause a complete. Left bundle branch block usually happens as a consequence of other diseases such as arteriosclerosis, rheumatic fever, congenital heart disease, myocarditis, myocardial infarction, metastatic heart tu-mors, or other invasions of the heart tissue. Right bundle branch block happens less often from underlying heart disease. Detection of BBB usually takes place during a normal physical examination. The block shows up as a widening of the second heart sound. Confirmation of BBB is obtained by electrocardiogram (ECG). The pat-tern seen in the electrocardiogram indicates pulses in a heart beat and their duration. QRS duration of greater than 110 milliseconds is a diagnostic indication of BBB [14].
Conventionally these diseases are treated by the symptoms shown or for verification by analyzing ECG manually. A better approach to analyze the ECG effi-ciently with high accuracy is proposed in this paper.
3. PROPOSED METHODOLOGY
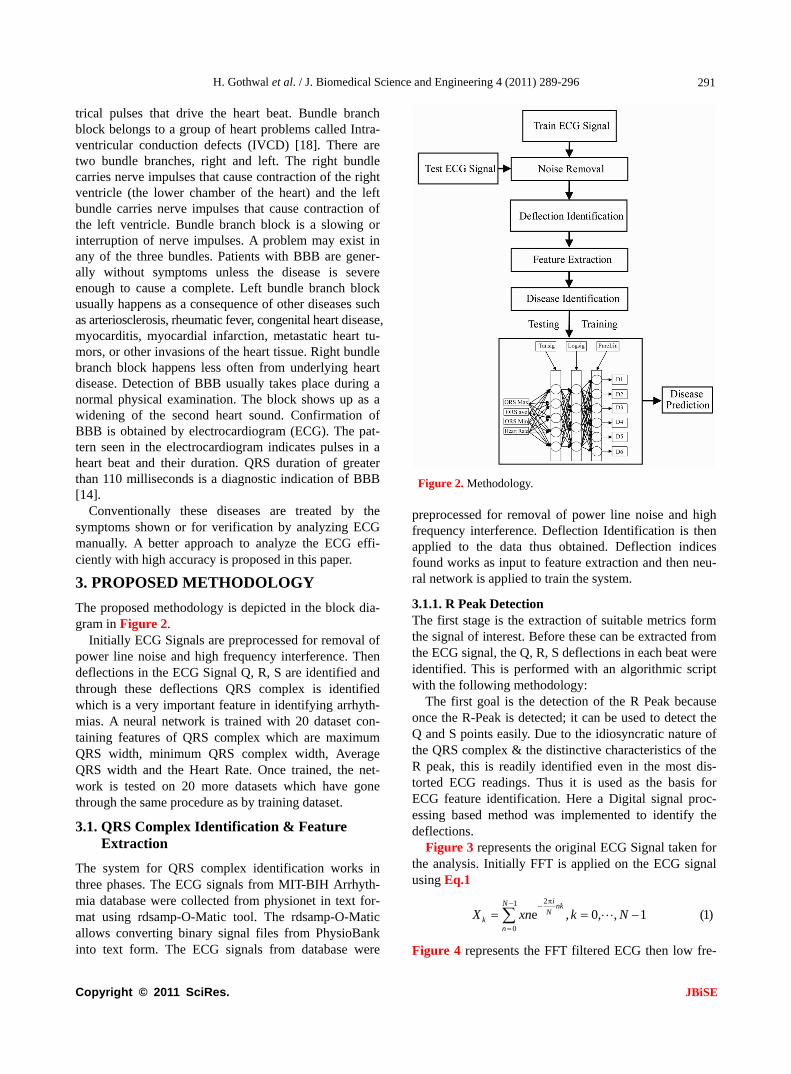
The proposed methodology is depicted in the block dia-gram in Figure 2.
Initially ECG Signals are preprocessed for removal of power line noise and high frequency interference. Then deflections in the ECG Signal Q, R, S are identified and through these deflections QRS complex is identified which is a very important feature in identifying arrhyth-mias. A neural network is trained with 20 dataset con-taining features of QRS complex which are maximum QRS width, minimum QRS complex width, Average QRS width and the Heart Rate. Once trained, the net-work is tested on 20 more datasets which have gone through the same procedure as by training dataset.
3.1. QRS Complex Identification & Feature Extraction
The system for QRS complex identification works in three phases. The ECG signals from MIT-BIH Arrhyth-mia database were collected from physionet in text for-mat using rdsamp-O-Matic tool. The rdsamp-O-Matic allows converting binary signal files from PhysioBank into text form. The ECG signals from database were
Figure 2. Methodology. preprocessed for removal of power line noise and high frequency interference. Deflection Identification is then applied to the data thus obtained. Deflection indices found works as input to feature extraction and then neu-ral network is applied to train the system.
3.1.1. R Peak Detection The first stage is the extraction of suitable metrics form the signal of interest. Before these can be extracted from the ECG signal, the Q, R, S deflections in each beat were identified. This is performed with an algorithmic script with the following methodology:
The first goal is the detection of the R Peak because once the R-Peak is detected; it can be used to detect the Q and S points easily. Due to the idiosyncratic nature of the QRS complex & the distinctive characteristics of the R peak, this is readily identified even in the most dis-torted ECG readings. Thus it is used as the basis for ECG feature identification. Here a Digital signal proc-essing based method was implemented to identify the deflections.
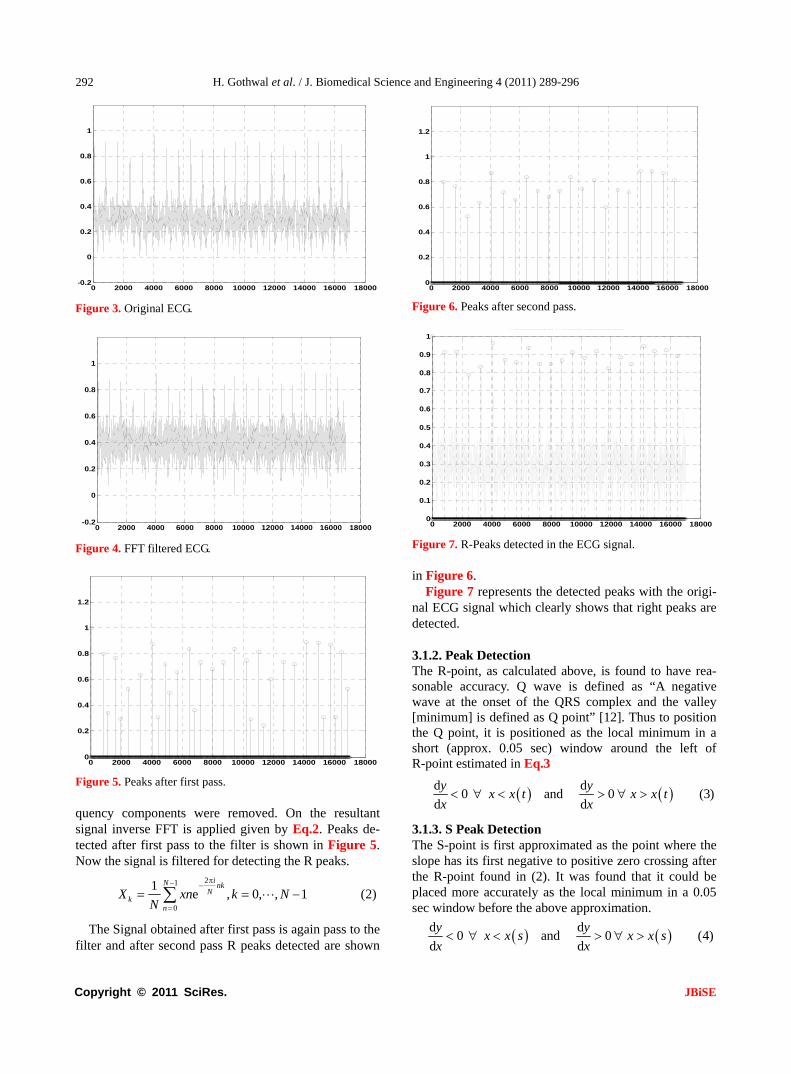
Figure 3 represents the original ECG Signal taken for the analysis. Initially FFT is applied on the ECG signal using Eq.1
21
0
e , 0, , 1 (1)iN nk
Nk
n
X xn k N
Figure 4 represents the FFT filtered ECG then low fre-
H. Gothwal et al. / J. Biomedical Science and Engineering 4 (2011) 289-296
Copyright © 2011 SciRes. JBiSE
292
0 2000 4000 6000 8000 10000 12000 14000 16000 18000-0.2
0
0.2
0.4
0.6
0.8
1
Figure 3. Original ECG.
0 2000 4000 6000 8000 10000 12000 14000 16000 18000-0.2
0
0.2
0.4
0.6
0.8
1
Figure 4. FFT filtered ECG.
0 2000 4000 6000 8000 10000 12000 14000 16000 180000
0.2
0.4
0.6
0.8
1
1.2
Figure 5. Peaks after first pass. quency components were removed. On the resultant signal inverse FFT is applied given by Eq.2. Peaks de-tected after first pass to the filter is shown in Figure 5. Now the signal is filtered for detecting the R peaks.
21
0
1e , 0, , 1 (2)
iN nkN
kn
X xn k NN
The Signal obtained after first pass is again pass to the filter and after second pass R peaks detected are shown
0 2000 4000 6000 8000 10000 12000 14000 16000 180000
0.2
0.4
0.6
0.8
1
1.2
Figure 6. Peaks after second pass.
0 2000 4000 6000 8000 10000 12000 14000 16000 180000
0.1
0.2
0.3
0.4
0.5
0.6
0.7
0.8
0.9
1Comparative ECG R-Peak Detection Plot
Figure 7. R-Peaks detected in the ECG signal. in Figure 6.
Figure 7 represents the detected peaks with the origi-nal ECG signal which clearly shows that right peaks are detected. 3.1.2. Peak Detection The R-point, as calculated above, is found to have rea-sonable accuracy. Q wave is defined as “A negative wave at the onset of the QRS complex and the valley [minimum] is defined as Q point” [12]. Thus to position the Q point, it is positioned as the local minimum in a short (approx. 0.05 sec) window around the left of R-point estimated in Eq.3
d d0 and 0 (3)
d d
y yx x t x x t
x x
3.1.3. S Peak Detection The S-point is first approximated as the point where the slope has its first negative to positive zero crossing after the R-point found in (2). It was found that it could be placed more accurately as the local minimum in a 0.05 sec window before the above approximation.
d d0 and 0 (4)
d d
y yx x s x x s
x x

H. Gothwal et al. / J. Biomedical Science and Engineering 4 (2011) 289-296
Copyright © 2011 SciRes. JBiSE
293
This is to be true for the s window length of 0.05 sec.
3.2. Feature Extraction
Feature as RR interval (used medically as an indicator of Ventricular Heart Rate) metrics are generated from the deflection positional information. To determine RR in-terval two R peaks in consecutive beats is calculated and their difference is computed. Heart Rate is 60/RR inter-val beats per minute.
60Rate =
RR interval beats per minute (5)
With these features various Cardiovascular Arrhyth-mias are detected as Right bundle branch block. Right bundle branch block is a delay or block of conduction within the right bundle branch. A delay of conduction manifests as incomplete right bundle branch block. A QRS duration greater than 0.14 sec results in right bun-dle branch block. Bradycardia occurs on resting heart rate of under 60 beats per minute, though it is seldom symptomatic until the rate drops below 50 beat/min. Tachycardia refers to rapid beating of the heart as a heart rate greater than 100 beats per minute in adult. Diseases were predicted from these features derived as according to medical science for Tachycardia heart rate > 100 bpm (beats per minute) [19]. Normal Sinus Rhythm is 60 to 100 bpm. Ventricular tachycardia for heart rate is from 101 to 250 bpm and QRS width > 0.12 sec. Normal QRS width is 0.04 - 0.10 sec. Incomplete Bundle Branch Block for QRS width between 0.10 sec and 0.12 sec and Bundle Branch Block for QRS width > 0.12 sec [11,12].
3.3. Disease Prediction Using ANN
The artificial neural networks play a significant role in the field of artificial intelligence. In spite of the advent of computers, a system which can imitate the human brain is of a great demand. Artificial Neural Network is the technique where we try to copy the working of hu-man brain. It has a very significant role in the field of artificial intelligence. An ANN comprises of intercon-nection of artificial neurons which follows the function of biological neurons and are basic building blocks of the network. They learn from the data fed to them and keep on decreasing the error during training time and once trained properly, their results are very much same to the results required from them [20] thus referred to as universal approximators [21]. The error is decreased by modifying weights of individual neurons.
The most popular neural networks used by researchers are the multilayer feed forward neural network trained by the back propagation algorithm [20,22]. There are different kinds of neural networks classified according to operations they perform or the way of interconnection of neurons. The ANNs are capable of learning the desired
mapping between the inputs and outputs signals of the system without knowing the exact mathematical model of the system. Since the ANNs do not use the mathe-matical model of the system, they are excellent estima-tors in non linear systems.
3.4. Network Architecture and Training
To solve the problem of identifying diseases, a Feed- Forward Network with one input layer, one hidden layer and one output layer is proposed as shown in the Figure 8. The input layer consist of five neurons with the trans-fer function of tan-sigmoid, the hidden layer consist of four neurons with the transfer function of log-sigmoid whereas the output layer consist of six neurons with the linear transfer function. The inputs given to the input layer are maximum QRS width, minimum QRS complex width, Average QRS width and the Heart Rate whereas the outputs obtained are the presence of diseases namely Tachycardia, Bradycardia, Super Ventricular Tachycardia, Incomplete Bundle Branch Block, Bundle Branch Block, Ventricular Tachycardia.
Where, D1 is Tachycardia, D2 is Bradycardia, D3 is Super Ventricular Tachycardia, D4 is Incomplete Bundle Branch Block, D5 is Bundle Branch Block, D6 is Ven-tricular tachycardia.
Hence the output from the network will be governed by the following equations:
4
1 1 11
tan sig (6)a aj j aj
T w P b
5
2 2 1 21
logsig (7)a aj j aj
T w T b
Figure 8. Network architecture.
H. Gothwal et al. / J. Biomedical Science and Engineering 4 (2011) 289-296
Copyright © 2011 SciRes. JBiSE
294
4
3 3 2 31
purelin (8)a a aj j aj
T D w T b
Where Tmn is output from nth neuron of mth layer, wpqr is weight for jth input for qth neuron of pth layer and bmn is bias for nth neuron of mth layer.
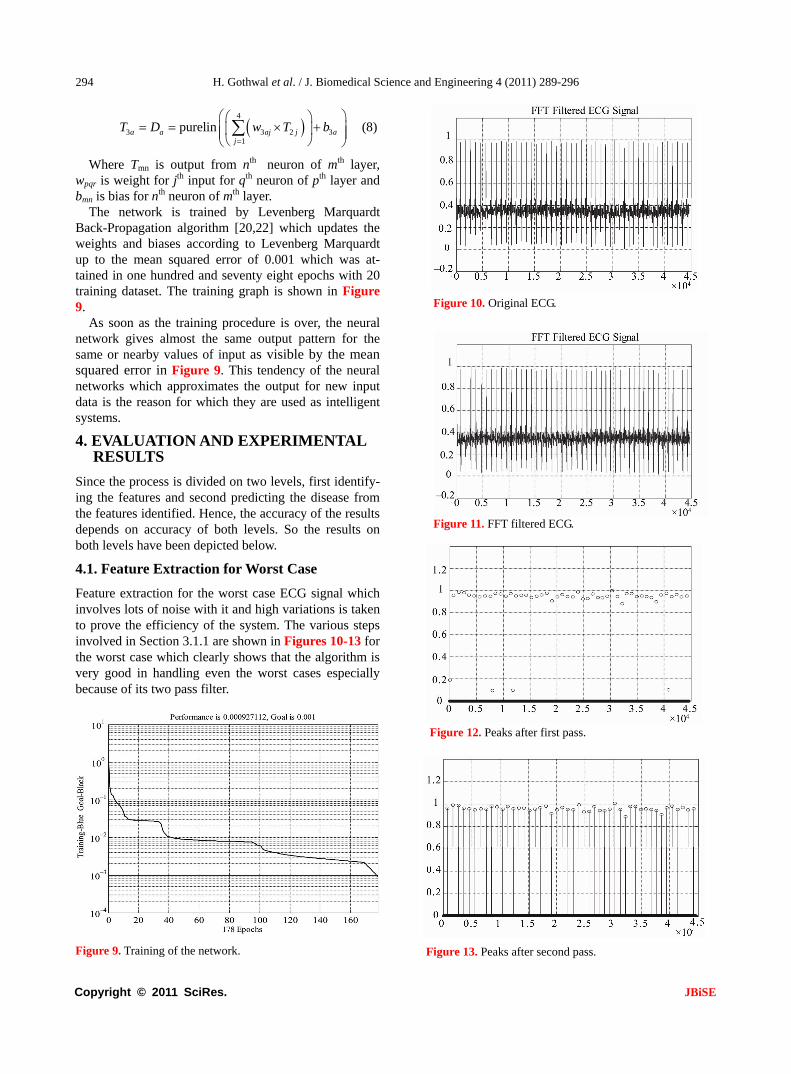
The network is trained by Levenberg Marquardt Back-Propagation algorithm [20,22] which updates the weights and biases according to Levenberg Marquardt up to the mean squared error of 0.001 which was at-tained in one hundred and seventy eight epochs with 20 training dataset. The training graph is shown in Figure 9.
As soon as the training procedure is over, the neural network gives almost the same output pattern for the same or nearby values of input as visible by the mean squared error in Figure 9. This tendency of the neural networks which approximates the output for new input data is the reason for which they are used as intelligent systems.
4. EVALUATION AND EXPERIMENTAL RESULTS
Since the process is divided on two levels, first identify-ing the features and second predicting the disease from the features identified. Hence, the accuracy of the results depends on accuracy of both levels. So the results on both levels have been depicted below.
4.1. Feature Extraction for Worst Case
Feature extraction for the worst case ECG signal which involves lots of noise with it and high variations is taken to prove the efficiency of the system. The various steps involved in Section 3.1.1 are shown in Figures 10-13 for the worst case which clearly shows that the algorithm is very good in handling even the worst cases especially because of its two pass filter.
Figure 9. Training of the network.
Figure 10. Original ECG.
Figure 11. FFT filtered ECG.
Figure 12. Peaks after first pass.
Figure 13. Peaks after second pass.

H. Gothwal et al. / J. Biomedical Science and Engineering 4 (2011) 289-296
Copyright © 2011 SciRes. JBiSE
295
Figure 14. R-Peaks detected in ECG signal.
As clear by the Figure 14, the algorithm is able to de-
tect the R-Peaks even in a very irregular ECG. Hence once the features are identified correctly, we are sure that correct input will be given to the neural network.
4.2. Effect of Hidden Layer Neurons and Final Network
Several combinations were tried with different number of neurons in the hidden layer. The results of these changes are depicted in the Table 1.
The decrement in performance on increasing the num- ber of neurons could be due to overtraining. On the basis of above readings, the network with five neurons in the input layer, four neurons in the hidden layer and six neurons in the output layer was selected. The network so formed was then tested on 20 dataset with an accuracy of 98.48%.
Figure 15 shows the predictions and the actual dis-ease identification for each of the twenty dataset. X-axis represents the dataset id whereas the Y-axis represents the disease id. A circle represents the actual value (target value) and the star (*) represent the value predicted b the network. The results shown above clearly indicate that the system can assist a doctor to a very good level about disease indications from the ECG and hence the neces-sary steps could be taken before the disease strikes the patient.
The solution proposed has an accuracy of 98.48%. Table 2 depict a comparative study of various tech-niques used previously and clearly indicates that pro-
Table 1. Effect of hidden layer neurons on accuracy.
Number of neurons in Hidden Layer
Accuracy
2 94.17% 3 96.25% 4 98.48% 5 97.50% 6 96.67% 7 96.67%
Figure 15. Predicted output against desired output.
Table 2. Comparative results of different methods.
Method Accuracy
BSS-Fourier [7] 85.04%
MOE [23] 94.0%
Fhyb-HOSA [25] 96.06%
DWT-NN [26] 96.79%
FTNN [24] 98.0%
ICANN [3] 98.37%
Proposed 98.48%
posed method is better than previous ones.
5. CONCLUSION AND FUTURE WORK
In this paper, Fast Fourier Transform has been used to identify features from an ECG signal. Those features generated the training as well as testing dataset for the Artificial Neural Network to predict diseases. It is found that the system is very robust and can identify and pre-dict features even from highly abnormal ECG. This is a big benefit since the ECG pattern varies in many factors from person to person. These factors may be height of peaks, width of QRS complex, presence or absence of peaks, heart rate etc. QRS complex is the most important section of any ECG and once it has been detected, one can use it in other study or system also. High accuracy of the system makes it highly reliable and efficient.
REFERENCES
[1] Barbara, J. (2006) Pitfalls and artifacts in electrocardi-ography. Cardiology Clinics, 24, 309-315. doi:10.1016/j.ccl.2006.04.006
[2] G. Karraz, G.M. (2006) Automatic classification of heart-beats using neural network classifier based on a bayesian framework. 28th Annual International Conference of the IEEE Publication, 4016-4019.
[3] Yu1, S.-N. and Chou, K.-T. (2006) Combining inde-pendent component analysis and backpropagation neural network for ECG beat classification. Proceeding of IEEE

H. Gothwal et al. / J. Biomedical Science and Engineering 4 (2011) 289-296
Copyright © 2011 SciRes. JBiSE
296
Engineering in Medicine and Biology Society, 1, 3090- 3093.
[4] Issac, N.S., Shantha, S.K.R. and Sadasivam, V. (2005) Artificial neural network based automatic cardiac ab-normalities classification. 6th International Conference, 41-46.
[5] Alexakis, C., Nyongesal, H.O., Saatchi, R., Harris, N.D., Davies, C., Emery, C., Ireland, R.H. and Helle, S.R. (2003) Feature extraction and classification of electro-cardiogram (ECG) signals related to hypoglycaemia. Computers in Cardiology, 537-540.
[6] Poli, R., Cagnoni, S. and Valli, G. (1995) Genetic design of optimum linear and nonlinear QRS detectors. IEEE Transactiom Biomedical Engineering, 42, 1137-1141. doi:10.1109/10.469381
[7] Prasad, G.K. and Sahambi, J.S. (2003) Classification of ECG arrhythmias using multi-resolution analysis and neural networks. Proceedings of IEEE Conference on Convergent Technologies, 1, 227-231.
[8] http://www.organizedwisdom.com/Heart_disease [9] Ronald, W.C. (1997) International handbook of arrhyth-
mia. Informa Healthcare. [10] World Health Organization (2005) The premise program:
Prevention of recurrences of myocardial infarction and stroke study. WHO, 83, 801-880.
[11] Leo, S. (2006) An introduction to electrocardiography. Bleackwell Science.
[12] Wagner GS (2000) Marriot’s practical electrocardiogra-phy. Williams & Wilkins.
[13] Dines, D.E. and Parkin, T.W. (1959) Some observations on P wave morphology in precordial lead V1 in patients with elevated left atrial pressures and left atrial enlarge-ment. Proceedings of Staff Meeting Mayo Clinic, 34, 401.
[14] http://www.physionet.org/physiobank/database/mitdb/index.htm
[15] Uday, N.K., Rajni, K.R. and Melvin, M.S. (2006) The 12-lead electrocardiogram in supraventricular tachy-
cardia. Cardiology Clinics, 24, 427-437. doi:10.1016/j.ccl.2006.04.004
[16] Hurst, J.W. (1998) Ventricular electrocardiography. J. B. Lippincott Company.
[17] http://www.aolhealth.com/health-concern [18] Francis, M., June, E., William, J.B. and John, C. (2003)
ABC of Electrocardiography. BMG publishing Group. [19] John, M.M., Mithilesh, K.D., Anil, V.Y.D.B., Girish, N.
and Cesar, A. (2006) Value of the 12-lead ECG in wide QRS tachycardia. Cardiology Clinics, 24, 439-451. doi:10.1016/j.ccl.2006.03.003
[20] Haykin, S. (2005) Neural networks—A comprehensive foundation. Prentice Hall.
[21] Fu, L.M. (2004) Neural networks in computer intelli-gence. McGraw-Hill Inc., 153-264.
[22] Hagan, M.T., and Menhaj, M.B. (1994) Training feed forward networks with the marquardt algorithm. IEEE Transactions on Neural Networks, 5, 989-993. doi:10.1109/72.329697
[23] Hu, Y.H., Palreddy, S. and Tompkins, W.J. (1997) A pa-tient-adaptable ECG beat classifier using a mixture of experts approach. IEEE Transactions on Biomedical En-gineering, 44, 891-900. doi:10.1109/10.623058
[24] Minami, K., Nakajima, H. and Toyoshima, T. (1999) Real-time discrimination of ventricular tachyarrhythmia with Fourier-transform neural network. IEEE Transac-tions on Biomedical Engineering, 46, 179-185. doi:10.1109/10.740880
[25] Osowski, S. and Lin, T.H. (2001) ECG beat recognition using fuzzy hybrid neural network. IEEE Transactions on Biomedical Engineering, 48, 1265-1271. doi:10.1109/10.959322
[26] Owis, M.I., Youssef, A.B.M. and Kadah, Y.M. (2002) Characterization of ECG signals based on blind source separation. Medical & Biological Engineering & Com-puting, 40, 557-564. doi:10.1007/BF02345455


![NONINVASIVE ECG IMAGING [ ECGI ] OF CARDIAC ARRHYTHMIAS · electrocardiographic measurements, noninvasively • Noninvasive imaging is a corner stone of the practice of modern medicine](https://static.fdocuments.in/doc/165x107/5f022a177e708231d402e402/noninvasive-ecg-imaging-ecgi-of-cardiac-arrhythmias-electrocardiographic-measurements.jpg)