CARDIAC ARREST OR DIZZY SPELL: WHY IS WORLD … · Cardiac Arrest or Dizzy Spell: Why is World...
39
OECD ECONOMIC POLICY PAPER September 2016 No. 18 CARDIAC ARREST OR DIZZY SPELL: WHY IS WORLD TRADE SO WEAK AND WHAT CAN POLICY DO ABOUT IT? © Victoria Kalinina/shutterstock.com
Transcript of CARDIAC ARREST OR DIZZY SPELL: WHY IS WORLD … · Cardiac Arrest or Dizzy Spell: Why is World...

OECD ECONOMICPOLICY PAPERSeptember 2016 No. 18
CARDIAC ARREST OR DIZZY SPELL: WHY IS WORLD TRADE SO WEAK AND WHAT CAN POLICY DO ABOUT IT?
© V
icto
ria K
alin
ina/
shut
ters
tock
.com

Cardiac Arrest or Dizzy Spell: Why is World Trade So Weak and
What can Policy Do About It?
This paper has been prepared by:
David Haugh
Alexandre Kopoin
Elena Rusticelli
David Turner
Richard Dutu
With contributions from:
Anthony de Carvalho
Authorised for publication by Catherine L. Mann, OECD Chief Economist and G20 Finance Deputy

The OECD Economic Policy Paper Series is published on the responsibility of the Secretary-General of the OECD. The opinions expressed and arguments employed herein do not necessarily reflect the official views of the Organisation or of the governments of its member countries.
Results from the paper were presented at the International Trade and Macroeconomic Interdependence in the Age of Global Value Chains conference in Vilnius, Lithuania. The authors would like to thank participants for their comments. The authors are also indebted to Catherine Mann and Jean-Luc Schneider for their guidance and to Ken Ash, Sebastian Barnes, Christian Daude, Alberto Gonzalez Pandiella, Vincent Koen, William Witheridge, Koen de Backer, Nadim Ahmad and Katheryn Russ, United States Council of Economic Advisors for their comments. The authors express their gratitude to Anthony de Carvalho, Science, Technology and Innovation Directorate, for material related to the steel industry. They also thank Véronica Humi for excellent editorial assistance.
Series: OECD Economic Policy Papers ISSN 2226583X This document and any map included herein are without prejudice to the status of or sovereignty over any territory, to the delimitation of international frontiers and boundaries and to the name of any territory, city or area. The statistical data for Israel are supplied by and under the responsibility of the relevant Israeli authorities. The use of such data by the OECD is without prejudice to the status of the Golan Heights, East Jerusalem and Israeli settlements in the West Bank under the terms of international law.
© OECD 2016 You can copy, download or print OECD content for your own use, and you can include excerpts from OECD publications, databases and multimedia products in your own documents, presentations, blogs, websites and teaching materials, provided that suitable acknowledgment of OECD as source and copyright owner is given. All requests for public or commercial use and translation rights should be submitted to [email protected]. Requests for permission to photocopy portions of this material for public or commercial use shall be addressed directly to the Copyright Clearance Center (CCC) at [email protected] or the Centre français d’exploitation du droit de copie (CFC) at [email protected].

TABLE OF CONTENTS
3 OECD ECONOMIC POLICY PAPERS, NO. 18 © OECD 2016
TABLE OF CONTENTS
Introduction and summary............................................................................................................................ 6
Timing and measurement issues ................................................................................................................. 9
Causes of the slowdown in world trade growth ........................................................................................... 9 Cyclical factors ....................................................................................................................................... 10 Trade policy liberalisation ....................................................................................................................... 12 Global value chains ................................................................................................................................ 15 China ...................................................................................................................................................... 20
What can policy do about the slowdown? .................................................................................................. 22 Further trade liberalisation ...................................................................................................................... 22 Promoting global value chains ............................................................................................................... 24 Boosting services trade .......................................................................................................................... 25 Removing restrictions to FDI .................................................................................................................. 25 Spreading the benefits wider .................................................................................................................. 26
Bibliography ................................................................................................................................................... 28
Appendix 1. What Factors Explain the Slowdown in World Trade Growth? ................................................. 31
Appendix 2. The Effect of China On The Ratio Of World Trade To World GDP Growth .............................. 32
Appendix 3. An Indicator of Recent Global Value Chain Movements ........................................................... 33
Appendix 4. A Panel Model of Long-Term Trade Intensity ............................................................................ 37
Tables
Table 1. The source of the slowdown appears multifaceted...................................................................... 10 Table 2. Policy actions to boost trade and productivity. ............................................................................. 25

TABLE OF CONTENTS
4 OECD ECONOMIC POLICY PAPERS, NO. 18 © OECD 2016
Figures
Figure 1 Global trade has disappointed. ...................................................................................................... 6 Figure 2. World trade growth remains weak ................................................................................................ 7 Figure 3. Policy action to increase world trade intensity would also boost productivity .............................. 8 Figure 4. The ratio of trade to GDP growth measured at PPP exchange rates is downward biased .......... 9 Figure 5. Investment has been weak post-crisis ........................................................................................ 11 Figure 6. Weakness in intra-Euro area trade no longer explains the slowdown........................................ 12 Figure 7. The pace of trade liberalisation has slowed ............................................................................... 13 Figure 8. The ratio of intermediate imports to total imports at current prices ............................................ 16 Figure 9. World import volume growth of goods and services ................................................................... 16 Figure 10. Measures of the importance of global value chains ................................................................. 18 Figure 11. Contributions to world merchandise import growth by country ................................................. 19 Figure 12. Major importers of global value chain intermediate products, 2015 ......................................... 20 Figure 13. Chinese trade growth has slowed dramatically ........................................................................ 21 Figure 14. The Asian trade machine is spluttering .................................................................................... 21 Figure 15. The trade intensity frontier has potential to expand in the long-term ....................................... 23 Figure 16. Increase in trade intensity from trade liberalisation .................................................................. 24 Figure 17. The majority of the population in advanced countries are sceptical about trade ..................... 26
Boxes
Box 1. Over-capacity and trade tensions in the steel industry .................................................................. 14

CARDIAC ARREST OR DIZZY SPELL: WHY IS WORLD TRADE SO WEAK AND WHAT CAN POLICY DO ABOUT IT?
5 OECD ECONOMIC POLICY PAPERS, NO. 18 © OECD 2016
ABSTRACT/RÉSUMÉ
Cardiac Arrest or Dizzy Spell: Why is World Trade so Weak and What Can Policy Do About It?
World trade growth was rapid in the two decades prior to the global financial crisis but has halved subsequently. There are both structural and cyclical reasons for the slowdown. A deceleration in the rate of trade liberalisation post 2000 was initially obscured by the ongoing expansion of global value chains and associated rapid emergence of China in the world economy. Post the financial crisis global value chains started to unwind and, possibly associated with this, Chinese and Asian trade weakened markedly. These structural changes were compounded by insipid demand due to anaemic growth of global investment, as well as intra-euro area trade, both of which are trade intensive. The slowdown in world trade growth post crisis, if sustained, will have serious consequences for the medium-term growth of productivity and living standards. Trade policy has significant potential to reinvigorate trade growth but the political environment for reforms is difficult, with a growing polarisation of OECD electorates into pro- and anti- globalisation supporters. Further trade and investment policy liberalisation should be introduced as part of a wider package of structural reforms to spread the benefits of freer trade and investment more widely.
JEL Codes:F01;F02;F13;F14;F15;F17;F21;F62
Keywords: World Trade; World Trade Intensity; Slowdown; Weak; Structural; Cyclical; Output Gap; Global Value Chains; GVCs; Trade Policy; Investment; Euro Area; China; Asia; Services Trade; FDI; Foreign Investment; Intermediates; Steel; Productivity; Inclusion; Growth; Inclusive Growth; Political Economy; Reform.
*****
Arrêt cardiaque ou crise passagère : Pourquoi le commerce mondial est-il si faible et que peut faire la politique économique pour le relancer ?
Le commerce mondial a cru rapidement au court des deux décennies qui ont précédé la crise financière de 2008. Mais sa croissance a été divisée par deux depuis. Des facteurs à la fois structurels et conjoncturels expliquent ce changement. Le ralentissement de la libéralisation du commerce mondial après 2000 a été masqué par l’expansion des chaines de valeur mondiale et l’insertion rapide de la Chine dans le commerce international. Après la crise, les chaines de valeur mondiale se sont détendues et le commerce Chinois et asiatique a ralenti, les deux phénomènes étant peut-être liés. Ces changements structurels ont été aggravés par une faible demande due à une croissance anémique de l’investissement international et du commerce intra-européen, les deux étant une source importante d’échanges commerciaux. S’il perdure, ce ralentissement de la croissance du commerce mondial aura des conséquences fâcheuses pour la croissance de la productivité et du niveau de vie. La politique commerciale dispose d’un potentiel pour relancer cette croissance, mais l’environnement politique actuel est peu favorable du fait d’une polarisation croissance au sein de l’électorat des pays de l’OCDE entre partisans de la globalisation et ceux plus sceptiques sur ses bienfaits. Une politique plus volontariste en matière de libéralisation des échanges et de l’investissement devrait être mise en place dans le cadre d’un plan global de reformes structurelles.
Code JEL: F01;F02;F13;F14;F15;F17;F21;F62
Mots clés: Commerce Mondial; Intensité du Commerce Mondial; Ralentissement ; Faible ; Structurel ; Conjoncturel ; Écart de Production ; Chaines de Valeur Mondiale ; GVCs ; Politique Commerciale ; Investissement ; Zone Euro ; Asie ; Commerce de Services ; Investissement Direct à l’Étranger ; Investissement Étranger ; Biens Intermédiaires ; Acier ; Productivité ; Croissance ; Croissance Inclusive ; Économie Politique ; Réforme.

CARDIAC ARREST OR DIZZY SPELL: WHY IS WORLD TRADE SO WEAK AND WHAT CAN POLICY DO ABOUT IT?
6 OECD ECONOMIC POLICY PAPERS, NO. 18 © OECD 2016
Cardiac Arrest or Dizzy Spell: Why is World Trade so Weak and What Can Policy Do About It?
Introduction and summary
A remarkable two decade period of rapid globalisation, during which the trade intensity of global GDP increased rapidly, came to an end with the financial crisis (Figure 1). Instead of world trade growing at more than double the rate of global GDP, in the wake of the crisis it has barely exceeded the growth rate of global GDP, slowing sharply from an average of 6½ per cent per annum over the two decades to 2008 to 3¼ per cent per annum over 2012-2015 (Figure 2). During 2015 trade volume growth weakened further to 2½ per cent, and was again anaemic in the first half of 2016.
Figure 1. Global trade has disappointed
World trade intensity, (world exports plus imports/GDP), per cent.
Note: Trade and GDP measured at market exchange rates in constant US dollars. Source: OECD (2016) Economic Outlook 99 Database.
There are both cyclical and structural contributions to this slowdown. Trade growth in the pre-crisis period was boosted by world-wide liberalisation of trade policy, particularly through multi-lateral agreements, NAFTA and deepening of the EU single market during the 1990s. A further boost to trade came from the growing importance of global value added chains (GVCs), whereby production processes are fragmented across countries and so increased trade, particularly in intermediate products. As trade liberalisation measures slowed around 2000, world trade remained supported by the ongoing expansion of GVCs and was given a further boost by a growing contribution from the rapid emergence of China into the world economy.
0
10
20
30
40
50
60
70
1961
1963
1965
1967
1969
1971
1973
1975
1977
1979
1981
1983
1985
1987
1989
1991
1993
1995
1997
1999
2001
2003
2005
2007
2009
2011
2013
2015
2017
%
Avg. growth 1986-2007 = 3.4%Avg. growth 2011-2015 = 1.3%
Avg. growth 1974-1985 = 0.8%
Avg. growth 1961-1973 = 2.7%

CARDIAC ARREST OR DIZZY SPELL: WHY IS WORLD TRADE SO WEAK AND WHAT CAN POLICY DO ABOUT IT?
7 OECD ECONOMIC POLICY PAPERS, NO. 18 © OECD 2016
Figure 2. World trade volume growth remains weak
Percentage change, year on year
Note: Measured at market exchange rates in constant 2010 US dollars. Source: OECD (2016) Economic Outlook 99 Database.
Since the financial crisis the contribution to world trade from GVCs and trade liberalisation has plateaued and with creeping protectionism from a myriad of small measures has gone into reverse. The fading of the impetus from these structural factors has been compounded by cyclical weakness following the 2008-09 global financial crisis. Weak demand in Europe, which is a trade-intensive region, and weak investment, which is a trade-intensive component of expenditure, have both exacerbated the weakness in world trade. More recently in 2015, the weakness is explained by faltering trade in China and other Asian countries, possibly associated with some withdrawal of China from GVCs.
The exceptional nature and coincidence of favourable structural factors that boosted trade in the pre-crisis period suggests that, world trade is unlikely to return to sustained high growth rates without substantial policy action. Any recovery in world trade will also partly depend on how changing production specialisation in China and other emerging markets affect the expansion of GVCs. A more rapid entry of lower income countries in Africa and Asia into manufacturing GVCs would boost their productivity and counter-balance the effect on world trade of greater concentration of China in more domestically focussed services.
Additionally, how far world trade growth recovers from the current nadir will also depend on policy action. Policy action would ideally take place across a range of fronts, including rolling back protectionist measures, implementing agreements already reached (trade facilitation and the Trans-Pacific Partnership), concluding on-going sectorial negotiations in services and reviving multilateral negotiations on new issues such as digital trade. Empirical estimates presented in this paper suggest that trade liberalisation at the same pace as occurred during the 1990s could boost world trade growth by 1-2% per annum.
-20
-15
-10
-5
0
5
10
15
20
2000 2002 2004 2006 2008 2010 2012 2014 2016
%

CARDIAC ARREST OR DIZZY SPELL: WHY IS WORLD TRADE SO WEAK AND WHAT CAN POLICY DO ABOUT IT?
8 OECD ECONOMIC POLICY PAPERS, NO. 18 © OECD 2016
Such policy action is warranted because trade is an important engine of growth, in a context where growth and productivity performance in many countries has been poor. Trade, and the related expansion of global value chains, boosts growth through increased productivity by improving resource allocation, increasing scale and specialisation, encouraging innovation activities, facilitating knowledge transfer, fostering the expansion of more productive firms and the exit of the least productive ones (OECD, 2000; Nicoletti et al. 2003; Westmore, 2013; Melitz and Ottaviano; 2008, Kiriyama, 2012; Bloom et al. 2016; Taglioni, 2016). Policy action to restore growth in world trade intensity might be expected to raise medium-term total factor productivity growth on average by around 0.2% per annum (Figure 3), based on recent OECD estimates of the effect of trade intensity on productivity (Égert and Gal, 2016). This is substantial in the context of OECD total factor productivity growth, which has averaged only 0.5% per annum over the past ten years.
Figure 3. Policy action to increase world trade intensity would also boost productivity
Note: In the baseline scenario, trade intensity remains constant at its 2016 level. In the policy scenario, trade intensity increases by 1.3 percentage points per annum (average from 1986-2007) from 2017. The effect of the change in trade intensity on productivity is calculated using estimates from Egert and Gal (2016).
Source: Economic Outlook Database 99, Egert and Gal (2016), author’s calculations.
The political environment for trade related reform in the OECD is, however, difficult, with the electorate increasingly polarized into pro- and anti-globalisation groups. A pre-requisite for reform is better evidence and communication of the net benefits of freer trade as well as acknowledging the costs and how these will be tackled. The benefits of greater trade do not affect all parts of the economy and society equally and the associated income re-distribution and reallocation of resources has also likely affected the level of political and social opposition to freer trade, which has grown in Europe and North America in recent years. Trade and investment reforms need to be introduced as part of a package of structural reforms to improve labour and product markets and to spread the benefits of freer trade more widely.
The remainder of the paper is organised as follows: section 2 addresses timing and measurement issues; section 3 attempts to distinguish the relative importance of the factors accounting for the world trade slowdown; and section 4 considers what policy can do to facilitate trade and so further underpin stronger GDP growth and higher living standards.
0
10
20
30
40
50
60
70
80
0.0%
0.2%
0.4%
0.6%
0.8%
1.0%
1.2%
1992 1996 2000 2004 2008 2012 2016 2020 2024 2028
Trad
e in
tens
ity, %
of G
DP
Prod
uctiv
ity g
row
th ra
te, %
pa
Productivity baseline Productivity scenario
Trade intensity baseline Trade intensity scenario

CARDIAC ARREST OR DIZZY SPELL: WHY IS WORLD TRADE SO WEAK AND WHAT CAN POLICY DO ABOUT IT?
9 OECD ECONOMIC POLICY PAPERS, NO. 18 © OECD 2016
Timing and measurement issues
The extent and timing of the world trade slowdown partly depends on measurement issues. Using market exchange rates to aggregate trade volumes, but PPP exchange rates to aggregate global GDP, may exaggerate world purchasing power when emerging markets are growing faster than advanced economies. This in turn will bias downwards the growth of the ratio of world-trade to global GDP and exacerbate the extent of the slowdown in the ratio (Figure 4). Thus aggregating both trade and GDP using market exchange rates is preferable, as it better represents the purchasing power for tradable goods and so is the procedure that is followed throughout this paper.
Constantinescu et al. (2015) using a PPP exchange based measure of GDP claim that the slowdown started from around the turn of the century. However, using GDP at market exchange rates Ollivaud and Schwellnus (2015) show that the slowdown started in 2009 and is smaller than when it is measured using GDP at PPP exchange rates (Figure 4). Nevertheless, dating the trade slowdown as coinciding with the financial crisis, does not necessarily imply that the slowdown is mostly cyclical or that the financial crisis was the major causal factor. Instead, it is also important to recognise that the period immediately preceding the global financial crisis was itself exceptional in being driven by massive structural changes in the global economy, as discussed in the next section.
Figure 4: The ratio of trade to GDP growth measured at PPP exchange rates is downward biased Ratio of world trade to GDP, percent
Source: OECD Economic Outlook Database 99, Ollivaud and Schwellnus (2015).
Causes of the slowdown in world trade growth
To establish a preliminary idea of the importance of competing explanations for the world trade slowdown, and as an organising device, a simple aggregate regression to explain world trade growth is estimated over the period 1991 to 2015 (for further details see Appendix 1). Explanatory variables include both cyclical factors, in the form of the World output gap and OECD investment growth, and structural factors, in the form of a new measure of global GVCs (Appendix 3), a measure of the extent of global trade liberalisation (Appendix 1) and Chinese trade growth. The percentage point contribution to the slowdown suggests that each of these factors has played a role in the slowdown by various magnitudes and at varying times (Table 1). Because the relationships between the explanatory variables are complex, with trade liberalisation and Chinese trade growth likely having helped expand GVCs, these results should be taken as indicative.
405060708090
100110120
1990 1995 2000 2005 2010 2015
GDP at market exchange rates
Actual Pre-Crisis Trend
405060708090
100110120
1990 1995 2000 2005 2010 2015
GDP at PPP exchange rates
Actual Pre-Crisis Trend

CARDIAC ARREST OR DIZZY SPELL: WHY IS WORLD TRADE SO WEAK AND WHAT CAN POLICY DO ABOUT IT?
10 OECD ECONOMIC POLICY PAPERS, NO. 18 © OECD 2016
Table 1. The source of the slowdown appears multifaceted Percentage point contribution1.
World Trade
Intensity2. Total
Explained Constant GVC3. Trade Policy Liberalism4. Output gap5. Investment6 China7.
1991-1999 3.6% 3.7% -0.5% 1.3% 0.9% -0.3% 1.6% 0.7% 2000-2007 3.8% 3.9% -0.5% 0.8% -0.3% 0.2% 1.5% 2.2% 1991-2007 3.7% 3.8% -0.5% 1.1% 0.3% -0.1% 1.5% 1.4% 2009 -8.8% -8.3% -0.5% 0.1% -0.3% -1.7% -5.7% -0.7% 2010 7.8% 6.6% -0.5% 1.6% 0.9% -0.9% 1.0% 3.9% 2011-2015 1.3% 1.2% -0.5% -0.1% -0.3% -0.7% 1.2% 1.7% 2015 0.2% -0.7% -0.5% -1.1% 0.0% -0.7% 1.3% 0.2% 2011-2015 minus 1991-2007
-2.4% -2.5% 0.0% -1.2% -0.6% -0.7% -0.3% 0.2%
2015 minus 1991-2007 -3.5% -4.5% 0.0% -2.1% -0.3% -0.6% -0.2% -1.2%
Note: Based on an OLS regression of world trade growth on measures of GVC and Trade Policy described in Appendix 1. 1. Percentage point contribution calculated as the coefficient in the regression in Appendix 1 multiplied by the percentage change
in that variable. For multi-year periods the average contribution for the period is shown. 2. Percentage change in world trade intensity, calculated as the sum of exports and imports as a ratio of GDP at market exchange
rates. 3. GVC is a new summary indicator of the importance of global value chains in the global economy (see Appendix 3). 4. Trade policy liberalism is a global measure of barriers to trade including tariff and non-tariff barriers (see Appendix 1). 5. Output Gap is the world output gap defined in Appendix 4. 6. Investment is the growth rate of the volume of investment in the OECD. 7. China is the growth rate of Chinese trade volume weighted by the share of China in world trade.
Source: Economic Outlook 99 Database; Fraser Institute; author calculations.
Cyclical factors
The results of the aggregate regression suggest that weak demand (as captured by the output gap and investment growth), accounts for around 40% of the slowdown over 2011-15 compared to 1991-2007, but played a much larger role earlier in the crisis. The role of investment made a strong negative cyclical contribution at the beginning of the crisis, but also appears to have had a longer lasting effect, contributing 0.3 percentage points to the post-crisis slowdown in trade, perhaps reflecting lower trend growth and the weakness of investment in the recovery (Figure 5, OECD, 2015).

CARDIAC ARREST OR DIZZY SPELL: WHY IS WORLD TRADE SO WEAK AND WHAT CAN POLICY DO ABOUT IT?
11 OECD ECONOMIC POLICY PAPERS, NO. 18 © OECD 2016
Figure 5. Investment has been weak post-crisis
Ratio of global investment to GDP Index 2007=100)
Source: OECD Economic Outlook Database No. 99; Ollivaud and Schwellnus (2015).
Other studies also find a role for weak demand, particularly weak investment (Constantinescu et al., 2015; Ollivaud and Schwellnus, 2015; and Bussiere et al., 2011). Bussière et al. (2011) emphasise the importance of distinguishing between the differing import content of different components of demand, especially import-intensive investment; they find that 85% of the initial collapse in trade in 2009Q1 was attributable to demand components once they have been adjusted for their import intensity, compared to only 51% if aggregate GDP is used.
Other cyclically related factors, such as weak trade finance, especially earlier in the crisis period may have also played a role (Cheung and Guichard, 2009; Ahn et al., 2011). Ollivaud and Schwellnus (2015) find that most of the slowdown, at least initially, was cyclical, highlighting the role of weak euro area GDP growth and the associated weak intra-euro area trade. However, the more recent weakness in world trade in 2015, when the euro area was experiencing a cyclical upturn, cannot be explained by this (Figure 6).
80
85
90
95
100
105
2007 2008 2009 2010 2011 2012 2013 2014 2015
World World excluding China

CARDIAC ARREST OR DIZZY SPELL: WHY IS WORLD TRADE SO WEAK AND WHAT CAN POLICY DO ABOUT IT?
12 OECD ECONOMIC POLICY PAPERS, NO. 18 © OECD 2016
Figure 6. Weakness in intra-Euro area trade no longer explains the slowdown
Ratio of Global import volume to global GDP volume, index 2007=100
Note: Global imports and GDP are measured at market exchange rates in constant 2010 US dollars. The trend represents the pre-crisis trend 1990-2007. Source: OECD Economic Outlook 98 database; and OECD calculations.
Trade policy liberalisation
The results of the aggregate regression suggest that the pace of trade liberalisation is an important factor in the slowdown in world trade growth, explaining about one-quarter of the slowdown from 2011-15 compared to 1991-2007. This is partly because there is some evidence of creeping protectionism since the crisis including major state intervention in some industries (Box 1), but mainly because of the absence of the positive boost that came from strong trade liberalisation over the period 1990-2001.
The extent of global trade liberalisation is here measured by aggregating, using GDP weights, a country-specific index constructed by the Fraser Institute (Gwartney et al., 2015) measuring the extent of (absence of) tariff and non-tariff barriers (Figure 7), for further details see Appendix 1. The profile of the resulting Global Trade Liberalisation Index reflects an active period of lowering tariff and non-tariff barriers from the mid-1980s through to the early 2000s. In 1986 the European Community passed the Single European Act to establish the single market in goods, services, labour and capital from 1992. In 1989 the Asia Pacific Economic Partnership (APEC) of 21 countries to promote free trade was established. In 1994 the 1986-1994 Uruguay round of the GATT (General Agreement on Tariffs and Trade) multilateral trade negotiation was successfully concluded. Importantly, the Uruguay round expanded the GATT’s authority to new areas—agreements regarding trade in textiles, agriculture, services, and intellectual property were major achievements of the round (Crowley, 2003).
405060708090
100110120
1990 1995 2000 2005 2010 2015
World
Actual Pre-Crisis Trend
405060708090
100110120
1990 1995 2000 2005 2010 2015
World, excluding intra-EA trade flows
Actual Pre-Crisis Trend
CARDIAC ARREST OR DIZZY SPELL: WHY IS WORLD TRADE SO WEAK AND WHAT CAN POLICY DO ABOUT IT?
13 OECD ECONOMIC POLICY PAPERS, NO. 18 © OECD 2016
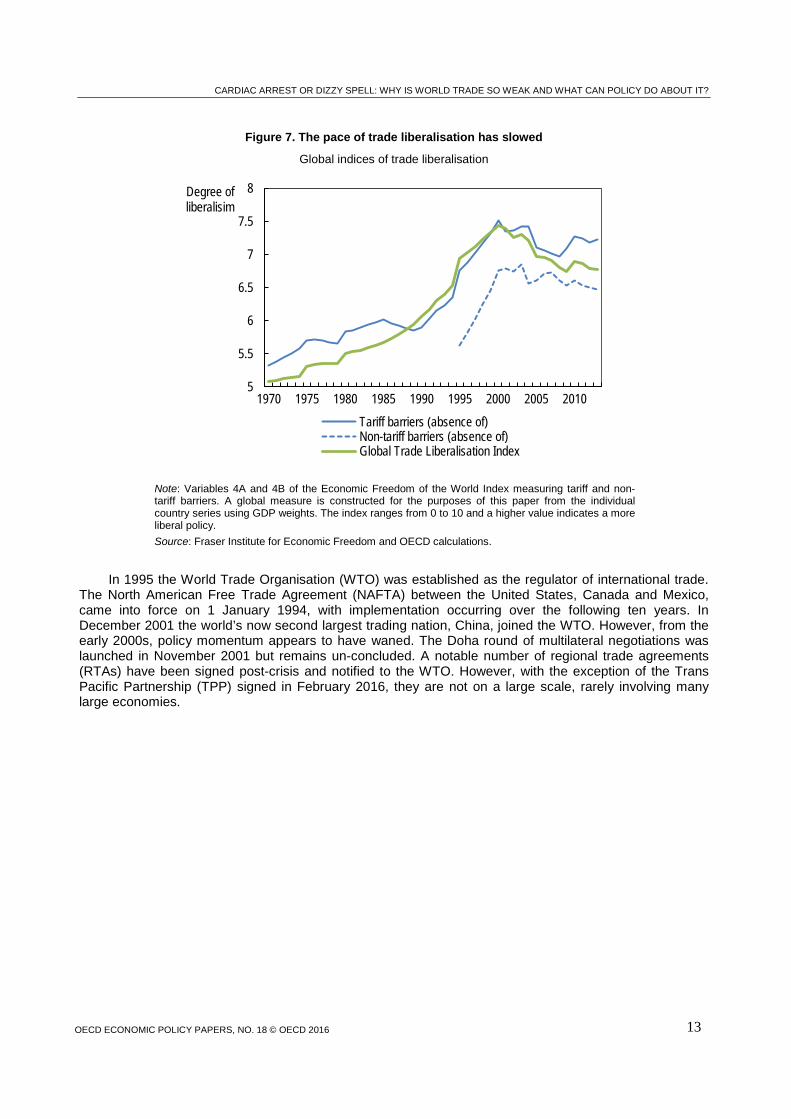
Figure 7. The pace of trade liberalisation has slowed
Global indices of trade liberalisation
Note: Variables 4A and 4B of the Economic Freedom of the World Index measuring tariff and non-tariff barriers. A global measure is constructed for the purposes of this paper from the individual country series using GDP weights. The index ranges from 0 to 10 and a higher value indicates a more liberal policy. Source: Fraser Institute for Economic Freedom and OECD calculations.
In 1995 the World Trade Organisation (WTO) was established as the regulator of international trade. The North American Free Trade Agreement (NAFTA) between the United States, Canada and Mexico, came into force on 1 January 1994, with implementation occurring over the following ten years. In December 2001 the world’s now second largest trading nation, China, joined the WTO. However, from the early 2000s, policy momentum appears to have waned. The Doha round of multilateral negotiations was launched in November 2001 but remains un-concluded. A notable number of regional trade agreements (RTAs) have been signed post-crisis and notified to the WTO. However, with the exception of the Trans Pacific Partnership (TPP) signed in February 2016, they are not on a large scale, rarely involving many large economies.
5
5.5
6
6.5
7
7.5
8
1970 1975 1980 1985 1990 1995 2000 2005 2010
Degree of liberalisim
Tariff barriers (absence of)Non-tariff barriers (absence of)Global Trade Liberalisation Index

CARDIAC ARREST OR DIZZY SPELL: WHY IS WORLD TRADE SO WEAK AND WHAT CAN POLICY DO ABOUT IT?
14 OECD ECONOMIC POLICY PAPERS, NO. 18 © OECD 2016
Box 1. Over-capacity and trade tensions in the steel industry Steel is a key input to the economy, notably for the automotive and construction sectors. The impact of current low growth and
the consequences of excess investment over recent years are particularly severe in the steel sector. Global excess capacity, as defined by the capacity-demand gap, has increased to 32% of capacity. While the steel industry is highly cyclical and has undergone a number of crises in recent decades, this is the largest ever gap between capacity and use. This overcapacity has significant consequences for prices, the need for structural adjustment and global trade policy.
World steel demand contracted sharply in the aftermath of the global economic and financial crisis of 2008, recovering slowly in the subsequent years before dipping again in 2015. Demand for steel is now declining significantly in China, after a decade of robust growth, and is weak in many OECD economies. The weakness in business investment has particularly depressed steel demand given that it is largely used in capital investment.
The gap between steel production capacity and demand has grown
Million metric tonnes (mmt)
However, the world steel industry’s capacity has also increased rapidly since the early 2000s and continues to rise. Most of the capacity expansion has occurred in emerging economies, to support construction and manufacturing activity, and to help build the infrastructure necessary for economic development. More than half of steel production world-wide now occurs in China. Like many economies experiencing rapid development, steel-intensity in China underwent a rapid increase over the past decade, which then slowed and has now gone into reverse. While China's steel-intensity rose unusually quickly compared with historical experience of other countries such as Japan and Korea, it has also slowed more quickly, leading to excess capacity. This has been aggravated by the slowing pace of overall growth.
An underlying cause of the over-capacity problem is that steel industries in many countries have benefited from subsidies and other government interventions. While such support ebbed in most OECD countries decades ago, it has continued elsewhere. Moreover, government interventions to prevent the collapse of ailing firms continue in developed and developing countries alike. Past subsidies and other support measures for the industry represent a significant "legacy" cost given the longevity of steel mills.
Trade frictions related to steel may have wider consequences for trade policy with more than half of WTO anti-dumping cases in the past three years related to the steel industry. Subsidies and government support measures that promote investment in steelmaking facilities or sustain companies in distress that would otherwise shut down are a major source of trade disputes. Improved international cooperation is required and G-20 Trade Ministers have committed in July to take actions to address global over-capacity in steel, including discussing the feasibility to set up a Global Forum on steel.
Falling prices and growing losses for steel producers create significant challenges, even if demand growth were to recover. Excess capacity in one region can displace efficient production in other regions and lead to wasteful energy use. The high concentration of directly or indirectly affected jobs in certain locations means that addressing the impacts of steel sector restructuring can be difficult. A key priority is to identify appropriate policy approaches to address excess capacity, including removing market distorting policies such as subsidies that promote the emergence of new capacity or delay the closure of failing companies, eliminating trade and investment barriers that slow needed restructuring of the industry, allowing market-based investment decisions in the steel sector, and ensuring that new plants are subject to standards that protect the environment and uphold worker safety.
Source: OECD Science, Technology and Innovation Directorate
0
500
1000
1500
2000
2500
2000 2001 2002 2003 2004 2005 2006 2007 2008 2009 2010 2011 2012 2013 2014 2015
Excess capacity Nominal capacity Crude steel demand
Avg. 2008-2015=551 mmt
Avg. 2000-2007=204 mmt

CARDIAC ARREST OR DIZZY SPELL: WHY IS WORLD TRADE SO WEAK AND WHAT CAN POLICY DO ABOUT IT?
15 OECD ECONOMIC POLICY PAPERS, NO. 18 © OECD 2016
Other research confirms the slowdown of trade liberalisation and rising protectionism is taking its toll
on trade flows (Evenett and Fritz, 2015). The number of trade restrictive measures has continued to grow since 2008. G-20 economies implemented 1087 net new measures between 2008 and mid-October 2015, although the estimated economic impact of protectionist measures appears to be small so far. The estimated effect in the OECD’s METRO model of 40% of the new protectionist measures introduced by December 2014, which were more easily quantifiable, was to reduce world trade and GDP by 0.2% and 0.1% respectively (OECD/UNCTAD/WTO, 2015).
To further examine the effect of trade policy and other variables on trade intensity, a panel model of trade intensity was estimated for 130 countries from 1970 to 2013, where trade intensity is defined as the sum of exports and imports as a ratio of GDP (Appendix 4). Both global and country-specific measures of the trade liberalisation index are found to be important and statistically significant in explaining trade intensity amongst other variables measuring income, population, remoteness and the cyclical position (Appendix 4). The magnitude of a standardised change in the global liberalisation index is larger for a particular country than the country-specific measure, suggesting the additional benefits of multi-lateral trade deals. The magnitude of the global trade liberalisation effect from the panel regression is also larger than the aggregate regression summarised in Table 1; the panel regression results imply that trade liberalisation over the 1990s boosted world trade intensity by more than 2 percentage points per annum.
Global value chains
A further explanation for the slowdown is that international fragmentation of production processes have come to a limit and will remain or return to being regional production networks rather than globally-distributed supply chains (Srinivasan et al., 2014; Crozet et al. 2015; Kee and Tang, 2015; ECB, 2015). Following two decades of expansion in vertical specialisation trade, i.e. trade in goods that incorporate imported inputs, the support of global value chains to world trade growth seems to have stalled (Figure 8). Stagnating intermediate imports are reflected in the recent slowdown in world trade, with the growth rate of trade in goods declining more sharply than that of services (Figure 9). In 2015, the world import volume of goods grew only by about 2.3%, while trade in services grew by 4.3%.

CARDIAC ARREST OR DIZZY SPELL: WHY IS WORLD TRADE SO WEAK AND WHAT CAN POLICY DO ABOUT IT?
16 OECD ECONOMIC POLICY PAPERS, NO. 18 © OECD 2016
Figure 8. The ratio of intermediate imports to total imports at current prices
Note: Both the numerator and denominator are expressed in current price terms and consequently the ratio is affected by relative price movements including large commodity price movements. Source: OECD Structural Analysis (STAN) database.
Figure 9. World import volume growth of goods and services
Average annual percentage change
Source: IMF World Economic Outlook (WEO) database, April 2016.
50
51
52
53
54
55
56
57
58
1991 1992 1993 1994 1995 1996 1997 1998 1999 2000 2001 2002 2003 2004 2005 2006 2007 2008 2009 2010 2011 2012 2013 2014 2015
%
0
2
4
6
8
10
1991-2000 2001-2010 2011-2015
%
Goods Services

CARDIAC ARREST OR DIZZY SPELL: WHY IS WORLD TRADE SO WEAK AND WHAT CAN POLICY DO ABOUT IT?
17 OECD ECONOMIC POLICY PAPERS, NO. 18 © OECD 2016
Although global value chains (GVCs) play a crucial role in shaping the link between production processes and international trade, there are important limitations in providing up-to-date time series measures of their importance given the lack of timely up-to-date international input-output (I-O) matrices and measures of value-added trade flows. Currently Trade in Value Added (TiVA) data, a joint initiative of the OECD and WTO (OECD-WTO, 2012), are only available from 1995 until 2011, preventing a thorough and timely analysis of the most recent developments in global trade. New more timely TiVA measures are currently being developed by the OECD's Statistics and Science, Technology and Innovation Directorates. Los et al. (2016) are also carrying out an update of the World Input Output Database (WIOD) to 2014. The WIOD update will be released later in 2016 and provides a large, consistent database to examine detailed questions related to trade in value added. As a complement to these comprehensive database extensions a more timely and up to date indicator of GVC activity is developed in this paper. Given the close link between trade of intermediate goods and vertical specialisation, an alternative indicator for backwards participation in GVCs has been computed as the ratio of intermediate goods imports to final domestic demand as a proxy for the TiVA measure of the foreign value added share of final demand (Appendix 3).
Both the official OECD TiVA measures and the new GVC indicator are influenced by commodity price and cyclical effects. If commodity prices fall then the ratio of intermediate goods imports to final demand will tend to fall and vice versa. In a cyclical upswing, final demand is likely to expand more than intermediates reducing the ratio. To remove these effects and focus on structural developments in GVCs, the new indicator of backward participation in GVCs has been corrected for the effect of commodity price developments by deflating the nominal values of both intermediate imports and final domestic demand to create a GVC volume measure. This latter measure is then regressed on a measure of the output gap to extract cyclical effects. Purging these two effects provides a time series variable that gives a better indication of more structural developments in GVCs (structural GVC) and which is reasonably up-to-date (Figure 10, panel A).
Using a global aggregate of this new measure in the aggregate world trade equation confirms that GVCs have indeed played a role in the slowdown of world trade (Table 1). At a global level the strongest increase in GVCs came during the 1990s, also a period of rapid trade liberalisation, when they contributed strongly to the growth of world trade. On a world level, trade liberalisation and GVCs went into reverse in more recent years. After expanding at 4% per annum on average from 1991 to 2011, structural global value chains have contracted by an average of 1.7% per annum since 2011 (Figure 10, panel B). These preliminary findings based on new more up-to-date data on bilateral trade by end-use category are in line with new studies on the contribution of GVCs to the current trade slowdown (ECB, 2015; Ferrantino and Taglioni, 2014; Constantinescu, 2015, Los at al., 2016).
The new measure also follows closely with the share of foreign value added embodied in domestic final demand for most OECD countries. For some countries, notably the advanced economies, the two measures exhibit broad consistency (Appendix 3). The two indices exhibit a larger divergence in case of the emerging economies, where the share of re-exported foreign value added is the highest. In 2011, about 50% of all imported intermediate goods that are re-exported worldwide come from the Asia and Pacific region.

CARDIAC ARREST OR DIZZY SPELL: WHY IS WORLD TRADE SO WEAK AND WHAT CAN POLICY DO ABOUT IT?
18 OECD ECONOMIC POLICY PAPERS, NO. 18 © OECD 2016
Figure 10. Measures of the importance of global value chains
(A) Indicators in level
GVC indicator =100 in 1995
(B) Change in the indicators
Average annual percentage change
Source: Appendix 3.
50
75
100
125
150
175
200
50
75
100
125
150
175
200
1990
1992
1994
1996
1998
2000
2002
2004
2006
2008
2010
2012
2014
GVC index Structural GVC index TiVA index
-6
-4
-2
0
2
4
6
1991-2000 2001-2005 2006-2010 2011-2015
% pts
GVC indicator Structural GVC indicator

CARDIAC ARREST OR DIZZY SPELL: WHY IS WORLD TRADE SO WEAK AND WHAT CAN POLICY DO ABOUT IT?
19 OECD ECONOMIC POLICY PAPERS, NO. 18 © OECD 2016
Once corrected for cyclical and commodity price movements, overall the G7 economies show a gradual slowdown in their participation in global value chains, with the United States and Japan undergoing the largest reduction, 20% and 10% respectively in the latest five-year period to 2015. While weak import demand in the aftermath of the global financial crisis has mainly affected advanced economies, which contributed 70% of the fall in world merchandise trade in 2009, the trade downturn in 2015 is more closely related to economic developments in emerging economies (Figure 11).
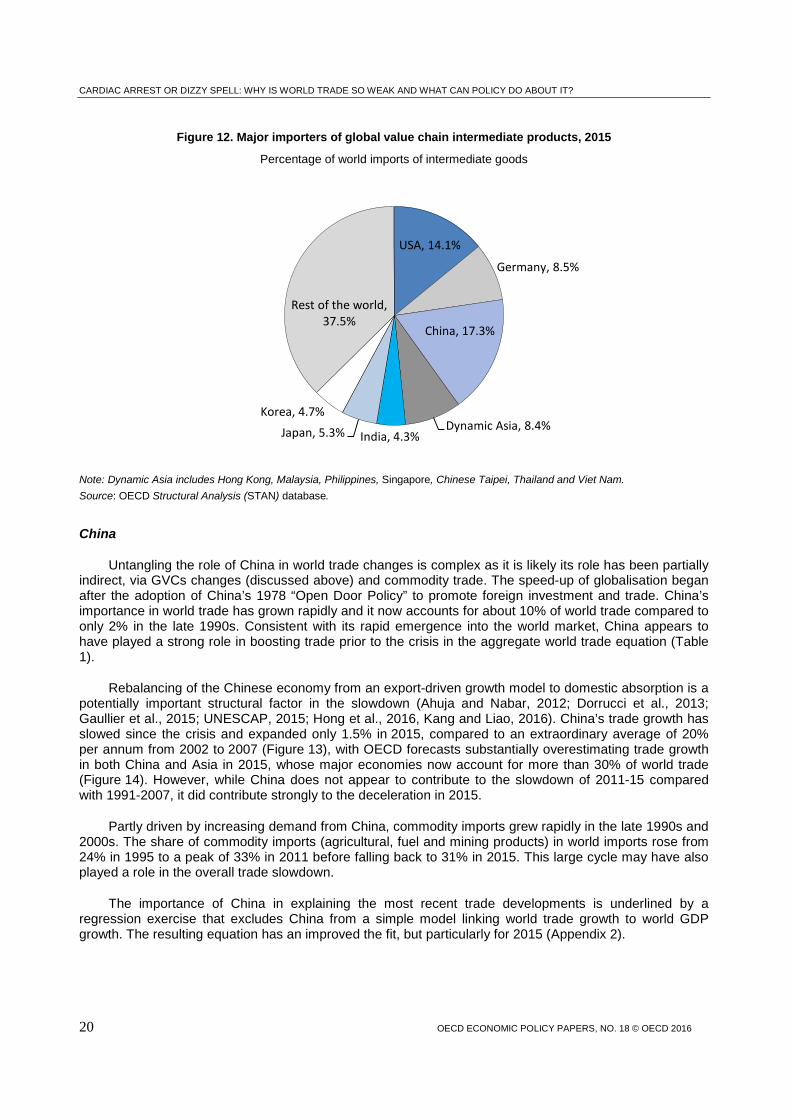
A strong regional value chain exists in Asia, where China, Dynamic Asia, Japan, Korea and India account for around 40% of world imports of intermediate goods (Figure 12). The regional value chain appears to be shrinking overall, led by the largest economies of the region. The downward trend in China’s adjusted GVC indicator over the most recent period after the global financial crisis is consistent with China moving-up the global value chain with a more mature domestic intermediate production sector supporting its manufactured exports (Kee and Tang, 2015). Developments in Chinese GVCs are highly correlated with changes in other countries in Asia including Korea and Japan suggesting that China may play a role in the trade slowdown via GVCs. A contraction in imports of intermediate inputs to production in Japan and dynamic Asia appears to have further contributed to the shortening of the regional supply chain.
Figure 11. Contributions to world merchandise import growth by country
Volumes, percentage point
Source: CPB Netherlands Bureau of Economic Policy Analysis.
- 15
- 10
- 5
0
5
10
15
2007 2008 2009 2010 2011 2012 2013 2014 2015
%
Advanced economiesEmerging economiesWorld imports growth
CARDIAC ARREST OR DIZZY SPELL: WHY IS WORLD TRADE SO WEAK AND WHAT CAN POLICY DO ABOUT IT?
20 OECD ECONOMIC POLICY PAPERS, NO. 18 © OECD 2016
Figure 12. Major importers of global value chain intermediate products, 2015
Percentage of world imports of intermediate goods
Note: Dynamic Asia includes Hong Kong, Malaysia, Philippines, Singapore, Chinese Taipei, Thailand and Viet Nam. Source: OECD Structural Analysis (STAN) database.
China
Untangling the role of China in world trade changes is complex as it is likely its role has been partially indirect, via GVCs changes (discussed above) and commodity trade. The speed-up of globalisation began after the adoption of China’s 1978 “Open Door Policy” to promote foreign investment and trade. China’s importance in world trade has grown rapidly and it now accounts for about 10% of world trade compared to only 2% in the late 1990s. Consistent with its rapid emergence into the world market, China appears to have played a strong role in boosting trade prior to the crisis in the aggregate world trade equation (Table 1).
Rebalancing of the Chinese economy from an export-driven growth model to domestic absorption is a potentially important structural factor in the slowdown (Ahuja and Nabar, 2012; Dorrucci et al., 2013; Gaullier et al., 2015; UNESCAP, 2015; Hong et al., 2016, Kang and Liao, 2016). China’s trade growth has slowed since the crisis and expanded only 1.5% in 2015, compared to an extraordinary average of 20% per annum from 2002 to 2007 (Figure 13), with OECD forecasts substantially overestimating trade growth in both China and Asia in 2015, whose major economies now account for more than 30% of world trade (Figure 14). However, while China does not appear to contribute to the slowdown of 2011-15 compared with 1991-2007, it did contribute strongly to the deceleration in 2015.
Partly driven by increasing demand from China, commodity imports grew rapidly in the late 1990s and 2000s. The share of commodity imports (agricultural, fuel and mining products) in world imports rose from 24% in 1995 to a peak of 33% in 2011 before falling back to 31% in 2015. This large cycle may have also played a role in the overall trade slowdown.
The importance of China in explaining the most recent trade developments is underlined by a regression exercise that excludes China from a simple model linking world trade growth to world GDP growth. The resulting equation has an improved the fit, but particularly for 2015 (Appendix 2).
USA, 14.1%
Germany, 8.5%
China, 17.3%
Dynamic Asia, 8.4% India, 4.3% Japan, 5.3%
Korea, 4.7%
Rest of the world, 37.5%

CARDIAC ARREST OR DIZZY SPELL: WHY IS WORLD TRADE SO WEAK AND WHAT CAN POLICY DO ABOUT IT?
21 OECD ECONOMIC POLICY PAPERS, NO. 18 © OECD 2016
Figure 13. Chinese trade growth has slowed dramatically
Trade volume, goods and services, annual percentage change
Source: Economic Outlook Database 99.
Figure 14. The Asian trade machine is spluttering
Export to GDP ratio, volume, index 2007=100
Note: These economies accounted for 30% of world trade in 2015. Source: Economic Outlook Database 99.
-20
-10
0
10
20
30
40
50
60
1984 1986 1988 1990 1992 1994 1996 1998 2000 2002 2004 2006 2008 2010 2012 2014
%
Imports Exports Total trade
405060708090
100110120130140
2000 2005 2010 2015
China Dynamic Asia IndonesiaIndia Japan Korea

CARDIAC ARREST OR DIZZY SPELL: WHY IS WORLD TRADE SO WEAK AND WHAT CAN POLICY DO ABOUT IT?
22 OECD ECONOMIC POLICY PAPERS, NO. 18 © OECD 2016
What can policy do about the slowdown?
There is likely to be some recovery in world trade growth to rates above the global GDP growth rate, however in the absence of specific policy action to boost trade, the gains in trade intensity are likely to be modest. Some cyclical recovery in the trade intensity of world GDP is likely as economies further recover from the current downturn. More importantly as countries, especially developing countries, become richer, trade intensity tends to rise. The panel model explaining country trade intensity (Appendix 4) suggests that growth and income convergence consistent with the most recent OECD long-term scenarios (OECD, 2014) will generate a baseline increase in global trade intensity of 8 percentage points by 2060, consistent with maintaining a ratio of world trade-to-GDP growth of about 1.1, suggesting 1.1 is the lower limit for the ratio providing policy ensures GDP per capita continues to grow and protectionism does not continue to increase.
Further trade liberalisation
Calculations were carried out using the panel model to gauge the maximum potential for trade intensity to increase i.e. to define a trade intensity frontier. The maximum is defined as trade intensity when trade regulation and tariff policy worldwide converges to the country where trade restrictions are the lowest (Hong Kong) and GDP per capita converges according to the OECD long-term scenario (OECD, 2016). These calculations suggest that if the OECD and BRIICs lowered trade barriers to the minimum world trade intensity would increase by around 22 percentage points.
Combining the growth and convergence assumptions of the baseline scenario with full trade policy liberalisation suggests that world trade is around 30 percentage points inside the frontier so that trade policy as well as policies to boost GDP growth still have significant potential (Figure 15). On the basis of the global projections underlying the OECD long-term baseline, this is equivalent to maintaining a world trade to GDP growth ratio of 1.4, around the average from 2008-2014, until 2060. This indicates 1.5 is perhaps the upper limit for the long-term ratio conditional on current OECD GDP growth assumptions.
An important feature of the panel model is that there is both a country-specific effect from trade liberalisation and a global effect, with the latter being more important. The country-specific effect of unilaterally fully liberalising trade policy ranges from over 10 percentage points of extra trade intensity for Russia and Korea to 2 percentage points and below for Australia, Chile and New Zealand, which already have liberal trade policies close to the frontier (Figure 16). Underlining the importance of international cooperation and reciprocity in trade policy, the effect of all countries fully liberalising trade policy would add a sizeable further 16 percentage points of trade intensity across countries.

CARDIAC ARREST OR DIZZY SPELL: WHY IS WORLD TRADE SO WEAK AND WHAT CAN POLICY DO ABOUT IT?
23 OECD ECONOMIC POLICY PAPERS, NO. 18 © OECD 2016
Figure 15. The trade intensity frontier has potential to expand in the long-term
Trade Intensity, % of GDP
Source: Trade Intensity is measured as the ratio of imports plus exports to GDP, authors' calculations.
A number of studies suggest that there are a range of policy actions that could be made to further boost trade intensity, with consequent benefits for productivity (Table 2). Even though tariffs are generally low, the increased fragmentation of production has amplified their negative effects on trade (Johansson et al., 2014). Moreover, non-tariff barriers have been increasing since the crisis. Multilateral trade liberalisation would be more effective than regional agreements among OECD members because the emerging market share of world trade has risen significantly and their trade barriers are the highest (Chateau et al., 2014).
0102030405060708090
100
1961 1971 1981 1991 2001 2011 2021 2031 2041 2051
%
Baseline no policy action Baseline and full trade liberalisation

CARDIAC ARREST OR DIZZY SPELL: WHY IS WORLD TRADE SO WEAK AND WHAT CAN POLICY DO ABOUT IT?
24 OECD ECONOMIC POLICY PAPERS, NO. 18 © OECD 2016
Figure 16. Increase in trade intensity from trade liberalisation
Ratio of exports plus imports to GDP, percentage point increase 2017 to 2060
Source: Authors' calculations based on estimates in Appendix 4.
Promoting global value chains
While the benefits to trade may be greatest from multi-lateral trade agreements, most GVCs are regional in nature, giving policymakers an added incentive to engage in regional trading agreements to further reinforce the benefits from these (UNESCAP, 2015). GVC participation is driven by a multitude of factors and can be further encouraged by increasing the scope of bilateral and regional economic agreements regarding the protection of intellectual property rights, customs procedures at the border and trade in financial and insurance services (ECB, 2015; OECD, 2013; UNESCAP, 2015; WTO 2014; Kowalski et al. 2015). Domestic policies favouring the cross-country interconnection of production and trade flows include increasing regulatory transparency, and improving transport and ICT infrastructure. Public technical and legal support for SMEs to meet international product and process standards can also play a role in enhancing a country’s GVC participation.
0% 5% 10% 15% 20% 25% 30%
RUSKORCHETURIND
NORISL
ARGMEXJPNZAFCANBRASAUIDN
COLCRI
CHNEU
ISRSVKUSAAUSNZLCHL
individual
global

CARDIAC ARREST OR DIZZY SPELL: WHY IS WORLD TRADE SO WEAK AND WHAT CAN POLICY DO ABOUT IT?
25 OECD ECONOMIC POLICY PAPERS, NO. 18 © OECD 2016
Table 2. Policy actions to boost trade and productivity
Policy Coefficients source Effect on Trade Effect on Productivity
Multilateral Package of Liberalisation Chateau et al. (2014) and Égert and Gal (2016)
15% higher world trade by 2060
3.2% higher
Large Regional Trade Agreement Chateau et al. (2014) and Égert and Gal (2016)
4% higher world trade by 2060
1.2% higher
Reducing the Level of Services Regulatory restrictiveness in the OECD
Nordas and Rouzet (2015) and Égert and Gal (2016)
7.2% higher OECD services exports, 1.6% higher total trade
0.7% higher
Reducing barriers to FDI Nicoletti et al. (2003) 2.3% higher OECD services exports, 0.6% higher total trade
0.5% higher
Improvement of institutional quality of the bottom half of the OECD to the median
Li and Samsell. (2009) and Égert and Gal (2016)
10% higher OECD trade
2.3% higher
Note: Productivity calculations are carried out for this paper by converting the change in world trade into a change in trade intensity. The change in trade intensity is then converted to a change in productivity using estimates from Égert and Gal (2016).
Boosting services trade
A narrower focussed set of reforms may have a greater chance of implementation in the current political environment. A promising area is in the regulation of services trade. Although a growing share of total trade in many OECD countries, services trade remains under-developed relative to goods trade and its high share of the GDP of OECD economies of around 75 to 80%.
Recent OECD work (Nordas and Rouzet, 2015; Nordas, 2016) suggests that both lowering the level and heterogeneity of service regulations helps to boost services trade. The effect is found to be asymmetric, so that action by a country to reduce the restrictiveness of its services regulation tends to boost its exports more than imports. The effect of reducing heterogeneity is stronger the lower the level of regulatory restrictiveness, implying that countries should first concentrate on reducing the level and then focus on heterogeneity. There is a marked variation across industries with the service regulation having the strongest effects on banking and insurance.
Lowering the restrictiveness of regulatory barriers to services trade would also increase competition in the economy with knock-on benefits such as cheaper transport with shorter delivery times. It would also help to improve the competitiveness of goods exporting firms as on average around one third of value added in goods exports is from services. There is empirical evidence that countries with more competitive regulatory frameworks for services achieve higher added value, productivity and export growth in the manufacturing sectors that use services as inputs more intensively (Barone and Cingano, 2011).
Removing restrictions to FDI
Reducing barriers to FDI can also play an important role in boosting trade. In the relationship between FDI and trade depends on whether the FDI is part of a strategy to access foreign markets or to fragment production across borders and extend global value chains. In the latter case it will help to boost trade. In services, establishing a presence is one of the main ways of supplying services across borders.

CARDIAC ARREST OR DIZZY SPELL: WHY IS WORLD TRADE SO WEAK AND WHAT CAN POLICY DO ABOUT IT?
26 OECD ECONOMIC POLICY PAPERS, NO. 18 © OECD 2016
FDI increases competition in the domestic market and can also potentially facilitate technology transfer. By boosting both trade and innovation, increased FDI can help to lift growth and productivity (Nicoletti et al., 2003). Cross-country, industry level evidence suggests the productivity enhancing effects of FDI tend to be stronger in emerging markets and where trade intensity is higher (Fillat and Woerz, 2011). It also shows explicit FDI restrictions as well as restrictive product market and labour market policies and heterogeneity in product market regulations reduce FDI and consequently trade (Nicoletti et al., 2003; Fournier et al., 2015).
Spreading the benefits wider
While there is substantial scope for policy to boost trade intensity, the extent to which this can be realised depends on whether the democratic and policy process can not only convince their electorates of the benefits, but that will be widely spread. Income stagnation among large segments of the population in OECD countries has left the impression that increasing globalisation is not benefiting most people. The current political environment is not encouraging. Election results and polls point towards a shift in several OECD countries away from a traditional left–right divide towards anti- and pro-globalisation electorates based on actual or perceived benefits and costs of more liberal movement of goods, capital and people (Figure 17). The WTO’s Doha round of multilateral level trade negotiations launched in 2001 has not been concluded, and the outcome of the December 2015 ministerial conference makes it even less likely that it can ever be concluded as a multilateral, single undertaking agreement. Political enthusiasm for regional liberalisation projects such as the Trans-Atlantic Trade and Investment Partnership is also waning.
Figure 17. The majority of the population in advanced countries are sceptical about trade
Views on trade, 2014. Per cent
Note: Advanced excludes the US. Based on a stratified sample of around 1000 people in each of 44 countries in April 2014. Source: Pew Research Centre.
0 20 40 60 80
Foreign acquisitions are good
Trade raises wages
Trade creates jobs
%
US Advanced Emerging Developing

CARDIAC ARREST OR DIZZY SPELL: WHY IS WORLD TRADE SO WEAK AND WHAT CAN POLICY DO ABOUT IT?
27 OECD ECONOMIC POLICY PAPERS, NO. 18 © OECD 2016
A pre-requisite for sustainable policy action is first and foremost more evidence and better
communication of the benefits of greater integration and greater transparency about the costs and how this will be dealt with in a way that meets the preferences of the electorate. The gains and losses from greater trade intensity are not evenly spread across regions, occupations or industries. In advanced OECD countries, losses tend to be concentrated in traditional manufacturing regions and lower skilled occupations. Without better communication and more effective tools for spreading the gains from greater trade and assisting displaced workers into new work the political costs are likely to outweigh the economic benefits leading to no policy action.
CARDIAC ARREST OR DIZZY SPELL: WHY IS WORLD TRADE SO WEAK AND WHAT CAN POLICY DO ABOUT IT?
28 OECD ECONOMIC POLICY PAPERS, NO. 18 © OECD 2016
Bibliography
Ahn, J., M.Amiti, and D. E. Weinstein (2011), "Trade Finance and the Great Trade Collapse", American Economic Review: Papers & Proceedings 2011, 101:3, 298–302.
Ahuja, A. and M. Nabar (2012) Investment-Led Growth in China: Global Spillovers, IMF Working papers, 12/257.
Barone, G. and F. Cingano, (2011), “Service Regulation and Growth: Evidence from OECD Countries”, The Economic Journal,Vol. 121, No. 555,Wiley Blackwell, http://dx.doi.org/10.1111/j.1468-0297.2011.02433.x.
Bloom, N, M. Draca, J. Van Reenen (2016), “Trade Induced Technical Change? The Impact of Chinese Imports on Innovation, IT and Productivity”. Review of Economic Studies. 83, 1, 87-117, January. 2016.
Bussière, M. G. et al. (2011), "Estimating Trade Elasticities: Demand Composition and the Trade Collapse of 2008-09", NBER Working Paper 17712.
Château, J., et al. (2014), “Trade Patterns in the 2060 World Economy”, OECD Economics Department Working Papers, No. 1142, OECD Publishing, Paris, DOI: http://dx.doi.org/10.1787/5jxrmdk5f86j-en
Cheung, C. and S. Guichard (2009), "Understanding the World Trade Collapse", OECD Economics Department Working Papers, No. 729, OECD Publishing, Paris, DOI: http://dx.doi.org/10.1787/220821574732.
Constantinescu, C., A. Mattoo, M. Ruta (2015) The Global Trade Slowdown: Cyclical or Structural?, IMF Working Paper, 15/6.
Crowley, M.A. (2003) An introduction to the WTO and the GATT, Federal Reserve Bank of Chicago Economic Perspectives, 4th quarter.
Crozet, M., C. Emlinger, and S. Jean, , (2015), "On the gravity of world trade's slowdown" in The Global Trade Slowdown: A New Normal, B. Hoekman (ed.), Vox.EU.org Ebook.
Dorrucci, E., G. Pula and D. Santabárbara (2013), “China’s Economic Growth and Rebalancing”, ECB Occasional Paper. No. 142.
ECB (2015), “Understanding the Weakness in World Trade”, ECB Economic Bulletin, Issue 3 / 2015.
Égert, B. and P. Gal (forthcoming), “The Quantification of Structural Reforms: A New Framework”, OECD Economics Department Working Paper, OECD Publishing, Paris.
Evenett, S.J. and J. Fritz (2015) “Crisis-era trade distortions cut LDC export growth by 5.5% per annum” in The Global Trade Slowdown: A New Normal, B. Hoekman (ed.), Vox.EU.org Ebook.
Ferrantino, Michael J.; Taglioni, Daria (2014), "Global value chains in the current trade slowdown", Economic Premise ; no. 137. Washington, DC ; World Bank Group, http://documents.worldbank.org/curated/en/2014/03/19301893/global-value-chains-current-trade-slowdown
Fillat, C. and J. Woerz (2011), "Good or bad? The influence of FDI on productivity growth. An industry-levelanalysis", The Journal of International Trade & EconomicDevelopment, 20:3, 293-328 http://dx.doi.org/10.1080/09638190903003010

CARDIAC ARREST OR DIZZY SPELL: WHY IS WORLD TRADE SO WEAK AND WHAT CAN POLICY DO ABOUT IT?
29 OECD ECONOMIC POLICY PAPERS, NO. 18 © OECD 2016
Fournier, J. et al. (2015), “Implicit Regulatory Barriers in the EU Single Market: New Empirical Evidence from Gravity Models”, OECD Economics Department Working Papers, No. 1181, OECD Publishing, Paris, DOI: http://dx.doi.org/10.1787/5js7xj0xckf6-en.
Gaulier, G., et al. (2015), “The Power of the few in determining trade accelerations and slowdowns” in The Global Trade Slowdown: A New Normal, B. Hoekman (ed.), Vox.EU.org.
Gwartney, J. R. Lawson and J. Hall (2015) Economic Freedom of the World Annual Report 2015, Fraser Institute.
Hong, G.H., J. Lee, W. Liao, and D. Seneviratne “China and Asia in Global Trade Slowdown”, IMF Working Paper 16/105.
Johansson, Å. et al. (2014), “What Explains the Volume and Composition of Trade?: Industrial Evidence from a Panel of Countries”, OECD Economics Department Working Papers, No. 1128, OECD Publishing, Paris, DOI: http://dx.doi.org/10.1787/5jz2hz3tm6vj-en.
Kang, J.S. and W. Liao (2016), “Chinese Imports: What’s Behind the Slowdown?”, IMF Working paper 16/106
Kee, H.L. and Tang, H. (2015), “Domestic Value in Exports: Theory and Firm Evidence from China”, World Bank Policy Research Working Paper, 7491.
Kiriyama, N. (2012), “Trade and Innovation: Synthesis Report”, OECD Trade Policy Papers, No. 135, OECD Publishing, Paris, DOI: http://dx.doi.org/10.1787/5k9gwprtbtxn-en.
Li, S. and D. P. Samsell (2009), “Why Some Countries Trade More Than Others: The Effect of the Governance Environment on Trade Flows”, Corporate Governance: An International Review, 17(1), 47-61.
Los, B., R. Stehrer, M. P. Timmer and G. J. De Vries (2016, forthcoming), “Peak trade? An Anatomy of the Global Trade Slowdown”, GGDC Research memorandum Nr. 162, October 2016, Groningen Growth and Development Centre.
Melitz, M. and P. Ottaviano (2008), “Market Size, Trade and Productivity”, Review of Economic Studies, 75, 295-316.
Nicoletti, G. et al. (2003), “Policies and International Integration: Influences on Trade and Foreign Direct Investment”, OECD Economics Department Working Papers, No. 359, OECD Publishing, Paris, DOI: http://dx.doi.org/10.1787/062321126487.
Nordås, H. K. and D. Rouzet (2015), “The Impact of Services Trade Restrictiveness on Trade Flows: First Estimates”, OECD Trade Policy Papers, No. 178, OECD Publishing, Paris, DOI: http://dx.doi.org/10.1787/5js6ds9b6kjb-en.
Nordås, H. K. (2016), “Services Trade Restrictiveness Index (STRI): The Trade Effect of Regulatory Differences”, OECD Trade Policy Papers, No. 189, OECD Publishing, Paris, DOI: http://dx.doi.org/10.1787/5jlz9z022plp-en.
OECD-WTO (2012), Trade in Value Added: Concepts, Methodologies, Challenges (Joint OECD-WTO note) available at: http://www.oecd.org/sti/ind/49894138.pdf
OECD (2014), Economic Outlook No. 95, Chapter 4, OECD Publishing, Paris.
OECD (2015), Economic Outlook No. 97, Chapter 3, OECD Publishing, Paris.
OECD/UNCTAD/WTO (2015), Reports on G-20 Trade and Investment Measures (Mid-May to Mid-October 2015), http://www.oecd.org/daf/inv/investment-policy/14th-G20-Report.pdf.

CARDIAC ARREST OR DIZZY SPELL: WHY IS WORLD TRADE SO WEAK AND WHAT CAN POLICY DO ABOUT IT?
30 OECD ECONOMIC POLICY PAPERS, NO. 18 © OECD 2016
OECD (2000), OECD Economic Outlook, No. 68, OECD Publishing, Paris, DOI: http://dx.doi.org/10.1787/eco_outlook-v2000-2-en.
OECD (2016), OECD Economic Outlook, Volume 2016 Issue 1, OECD Publishing, Paris. DOI: http://dx.doi.org/10.1787/eco_outlook-v2016-1-en.
Ollivaud, P. and C. Schwellnus (2015), “Does the Post-Crisis Weakness of Global Trade Solely Reflect Weak Demand?”, OECD Economics Department Working Papers, No. 1216,OECD Publishing, Paris, DOI: http://dx.doi.org/10.1787/5js1qvnff3hk-en.
Srinivasan, M.M. et al. (2014), Global Supply Chains: Evaluating Regions on an EPIC Framework—Economy, Politics, Infrastructure and Competence, McGraw-Hill Education.
Taglioni, D. (2016), “Overcoming the middle-income trap: The Role of Global Value Chain Integration for Climbing Up the Income Ladder”, World Bank, 5 March 2016.
UNESCAP (United Nations Economic and Social Council) (2015), Global Value Chains, regional development and sustainable development: linkages and policy implications, E/ESCAP/71/8.
Westmore, B. (2013), "R&D, Patenting and Growth: The Role of Public Policy", OECD Economics Department Working Papers, No. 1047, OECD Publishing, Paris, DOI: http://dx.doi.org/10.1787/5k46h2rfb4f3-en.

CARDIAC ARREST OR DIZZY SPELL: WHY IS WORLD TRADE SO WEAK AND WHAT CAN POLICY DO ABOUT IT?
31 OECD ECONOMIC POLICY PAPERS, NO. 18 © OECD 2016
Appendix 1. What Factors Explain the Slowdown in World Trade Growth?
In order to explain global trade intensity defined as the sum of world import and export volumes (X+M) normalised on world GDP (GDP), both measured as volumes in US dollars at market exchange rates, a simple regression (table 3) is estimated in the following form:
𝑔𝑔(𝑋𝑋 + 𝑀𝑀𝐺𝐺𝐺𝐺𝐺𝐺
)𝑡𝑡 = 𝜃𝜃0 + 𝜃𝜃1𝑔𝑔(𝑤𝑤_𝑡𝑡𝑡𝑡𝑡𝑡𝑡𝑡𝑡𝑡𝑡𝑡𝑡𝑡𝑡𝑡𝑡𝑡) + 𝜃𝜃2𝑔𝑔(𝐺𝐺𝐺𝐺𝐺𝐺𝑡𝑡) + 𝜃𝜃3𝐺𝐺𝐺𝐺𝐺𝐺𝑡𝑡 + 𝜃𝜃4𝑔𝑔(𝐼𝐼𝐼𝐼𝐺𝐺𝑡𝑡) + 𝜃𝜃5𝑔𝑔(𝐺𝐺ℎ𝑡𝑡𝑖𝑖𝑡𝑡𝑡𝑡) + ε𝑡𝑡
where g(x) denotes the annual growth rate of variable x.
Each of the explanatory variables are defined as follows:
• w_tradelib is a measure of the openness of trade policy. It is defined as the sum of the individual country measures of trade regulation and tariffs (area 4) from the Fraser Institute (Gwartney et al., 2015) weighted by GDP. For each country the trade regulation and tariffs area is made up of four components: tariff barriers, non-tariff barriers, costs of importing and exporting, controls on the movement of capital and exchange rate controls. Each component is made up of sub-components. For example, the tariff component is made up of three sub-components: revenues from tariffs as share of exports and imports, the mean tariff rate and the standard deviation of tariff rates. Each area is the average of its components and each component is the average of its sub-components. Gwartney et al. (2015) find that the summary index is robust to different weighting schemes. Each area, component and sub-component ranges from 0 (most restrictive) to 10 (most liberal). The formula used to calculate the zero-to-10 rating for each country is (Vmax − Vi)/ (Vmax −Vmin) multiplied by 10.
• GVC is the adjusted structural indicator for GVCs aggregated for the world, described in Appendix 3. • GAP is a measure the world output gap measured as a percentage of GDP described in Appendix 4. • ITV is investment volume for the OECD. • China is China's trade weighted by China’s share in world trade.
Table 3. Explaining the changes in world trade intensity, g(X+M/GDP)
Note: *, **, and *** indicate statistical significance at the 10%, 5% and 1% level, respectively. Source: OECD Economic Outlook Database 99; Fraser Institute; authors' calculations.
VariableEstimated coefficient
(std. error)Constant -0.005
(0.005)
g(w_tradelib) 0.422***
(0.16)g(GVC) 0.561***
(0.14)GAP 0.006***
(0.002)g(ITV) 0.518***
(0.09)g(China) 2.24***
(0.56)Sample 1991-2015R 2 0.91

CARDIAC ARREST OR DIZZY SPELL: WHY IS WORLD TRADE SO WEAK AND WHAT CAN POLICY DO ABOUT IT?
32 OECD ECONOMIC POLICY PAPERS, NO. 18 © OECD 2016
Appendix 2. The Effect of China on the Ratio of World Trade to World GDP Growth
A global equation, linking world trade to world GDP growth, is estimated over 1988-2014:
Δlog ( 𝑚𝑚𝑡𝑡) = α + 𝛽𝛽1Δ log ( 𝑚𝑚𝑡𝑡−1) + 𝛽𝛽2Δ log ( 𝑦𝑦𝑡𝑡) + 𝛽𝛽3Δ log ( 𝑦𝑦𝑡𝑡−1) + 𝜀𝜀𝑡𝑡 ,
where Δ denotes first differences, 𝑚𝑚𝑡𝑡 denotes global import volume and 𝑦𝑦𝑡𝑡 is global GDP volume at time t, 𝛼𝛼 is the regression intercept and 𝜀𝜀𝑡𝑡 is the error term (Ollivaud and Schwellnus, 2015). The estimation results show that when the equation is estimated excluding China from both world GDP and world trade the prediction error for the ratio of world trade to world GDP growth is smaller in 2015.
Table 4: The Ratio of World Trade to GDP growth: What role does China play?
Global equation (1988-2015) Global equation (1988-2015) -
NO CHINA
Constant -2.04 -1.54
World import growth (lag) 0.25 0.21
World GDP growth 3.36 3.14
World GDP growth (lag) -1.14 -0.91
GDP growth in 2015 2.48 1.91
Projected ratio in 2015 1.86 1.81 Actual ratio in 2015 1.02 1.55
Prediction error for the ratio in 2015 -0.84 -0.26
CARDIAC ARREST OR DIZZY SPELL: WHY IS WORLD TRADE SO WEAK AND WHAT CAN POLICY DO ABOUT IT?
33 OECD ECONOMIC POLICY PAPERS, NO. 18 © OECD 2016
Appendix 3. An Indicator of Recent Global Value Chain Movements
In order to address the limited data availability of updated international input-output (I-O) matrices and measures of trade flows in value-added, an alternative partial indicator of countries’ backward participation in global value chains is calculated. As a backward participation indicator it will likely capture more of the global value chain activity of emerging markets than advanced countries, which have a higher tendency to be at the beginning of value chains. The indicator has been computed for all OECD member states, the BRIICS, Argentina, Saudi Arabia, the OECD accessing countries (Colombia, Costa Rica and Lithuania) and two aggregate zones: Dynamic Asian Economies (Viet Nam, Thailand, Philippines, Hong Kong, Malaysia, Singapore and Chinese Taipei) and World (Figure 18).
The new measure (GVC) relates each country’s import value of intermediate goods to the value of its final domestic demand, with data extracted from the OECD STAN Bilateral Trade Database by industry and end-use category and the OECD Economic Outlook 99 Database, respectively. The new GVC indicator covers the period 1990-2015 and has been compared to the TiVA index, which is only available over the period 1995 to 2011.1 The average correlation between the two series is about 50% across all countries and aggregates over the common period. TiVA data refer to foreign value added embodied in final domestic demand and are available from the OECD Trade in Value Added Database for all single countries. Indices for Dynamic Asian Economies (DAE) and the world, are calculated by aggregating countries. For sake of consistency, the TiVA index has then been built as a ratio to the same final domestic demand figures employed for the construction of the GVC indicator.
There are several caveats on the GVC indicator including that a share of intermediate imports is used for exporting and not final demand, it like TiVA measures is affected by relative price movements and the business cycle will also likely affect the ratio of intermediate imports to final demand. Commodities represent between 37% and 40% of the value of total intermediate imports for China and Japan, 30% for the USA and almost 25% for Germany. To control for the impact that commodity price fluctuations have on imports of intermediate goods, the new GVC indicator expressed in nominal terms has been deflated. For this purpose, the price of total imports of goods and services has been applied to deflate imports of intermediate goods, whereas the deflator for total domestic expenditure had been used for final domestic demand. The new measure expressed in real terms (GVCV) can be used to analyse drivers and movements of world trade flows on a country or a more aggregate level.
1. The indicator has been constructed by interpolating single available data waves for 1995, 2000, 2005, 2008-
2011.

CARDIAC ARREST OR DIZZY SPELL: WHY IS WORLD TRADE SO WEAK AND WHAT CAN POLICY DO ABOUT IT?
34 OECD ECONOMIC POLICY PAPERS, NO. 18 © OECD 2016
To purge the new indicator of cyclical movements affecting production processes and cross-border transactions, the change in country i indicator GVCV has been regressed on the change in the country’s output gap2 as follows:
∆log (𝐺𝐺𝐺𝐺𝐺𝐺𝐺𝐺𝑖𝑖𝑡𝑡) = 𝛼𝛼 + 𝛽𝛽1∆(𝐺𝐺𝐺𝐺𝐺𝐺𝑖𝑖𝑡𝑡) + 𝜀𝜀𝑖𝑖𝑡𝑡
The residuals series εi has been used to compute the structural component of the country’s GVCV indicator and is adopted to infer structural developments in international value chains. The output gap estimate is statistically significant in explaining cyclical fluctuations in the GVCV indicator in around 70% of the countries3 at least at the 10% confidence level, and in two-thirds of these cases it is significant at the 1% confidence level.
These GVC structural indicators show a very high correlation across regions of the world (Figure 19). In particular, this suggests a high degree of interconnections among Asian regional value chains as well as main trading partners in Europe and America. Therefore, structural economic developments in one large trading country can quickly propagate throughout the globe via participation in international value chains.
2. Output gap estimates for all OECD and most of the largest non-OECD countries are published in the OECD
Economic Outlook 99 Database. The estimate of the output gap for the aggregates Dynamic Asian Economies (DAE) and Rest of the World (ROW) is calculated as the difference between actual output and potential output estimated as an Hodrick-Prescott filter applied to their respective GDP series in real terms. World potential output has been computed as a weighted aggregation of each country’s potential output estimate and then used to calculate the output gap series as the difference from the world GDP.
3. For some of the countries the output gap is insignificant because the length of the output gap data series is not very long, which lower the power of the significance test.

CARDIAC ARREST OR DIZZY SPELL: WHY IS WORLD TRADE SO WEAK AND WHAT CAN POLICY DO ABOUT IT?
35 OECD ECONOMIC POLICY PAPERS, NO. 18 © OECD 2016
Figure 18. Comparing the GVC indicator and TiVA Index
50
75
100
125
150
175
200
225
250
1990
1991
1992
1993
1994
1995
1996
1997
1998
1999
2000
2001
2002
2003
2004
2005
2006
2007
2008
2009
2010
2011
2012
2013
2014
2015
Canada
50
75
100
125
150
175
200
225
250
1990
1991
1992
1993
1994
1995
1996
1997
1998
1999
2000
2001
2002
2003
2004
2005
2006
2007
2008
2009
2010
2011
2012
2013
2014
2015
USA
50
100
150
200
250
300
350
1990
1991
1992
1993
1994
1995
1996
1997
1998
1999
2000
2001
2002
2003
2004
2005
2006
2007
2008
2009
2010
2011
2012
2013
2014
2015
Japan
50
75
100
125
150
175
200
225
250
1990
1991
1992
1993
1994
1995
1996
1997
1998
1999
2000
2001
2002
2003
2004
2005
2006
2007
2008
2009
2010
2011
2012
2013
2014
2015
I taly
50
75
100
125
150
175
200
225
250
1990
1991
1992
1993
1994
1995
1996
1997
1998
1999
2000
2001
2002
2003
2004
2005
2006
2007
2008
2009
2010
2011
2012
2013
2014
2015
France
50
75
100
125
150
175
200
225
250
1990
1991
1992
1993
1994
1995
1996
1997
1998
1999
2000
2001
2002
2003
2004
2005
2006
2007
2008
2009
2010
2011
2012
2013
2014
2015
Germany
5075
100125150175200225250
1990
1991
1992
1993
1994
1995
1996
1997
1998
1999
2000
2001
2002
2003
2004
2005
2006
2007
2008
2009
2010
2011
2012
2013
2014
2015
UK
50
75
100
125
150
175
200
225
250
990
991
992
993
994
995
996
997
998
999
2000
2001
2002
2003
2004
2005
2006
2007
2008
2009
2010
2011
2012
2013
2014
2015
China
50
75
100
125
150
175
200
225
250
990
991
992
993
994
995
996
997
998
999
000
001
002
003
004
005
006
007
008
009
010
011
012
013
014
015
Dynamic Asia
50
75
100
125
150
175
200
225
250
1990
1991
1992
1993
1994
1995
1996
1997
1998
1999
2000
2001
2002
2003
2004
2005
2006
2007
2008
2009
2010
2011
2012
2013
2014
2015
Korea
50
75
100
125
150
175
200
225
250
1990
1991
1992
1993
1994
1995
1996
1997
1998
1999
2000
2001
2002
2003
2004
2005
2006
2007
2008
2009
2010
2011
2012
2013
2014
2015
Australia
0255075
100125150175200225250
1990
1991
1992
1993
1994
1995
1996
1997
1998
1999
2000
2001
2002
2003
2004
2005
2006
2007
2008
2009
2010
2011
2012
2013
2014
2015
Indonesia
TIVA indicator GVC indicator Structural GVC indicator

CARDIAC ARREST OR DIZZY SPELL: WHY IS WORLD TRADE SO WEAK AND WHAT CAN POLICY DO ABOUT IT?
36 OECD ECONOMIC POLICY PAPERS, NO. 18 © OECD 2016
Figure 19. Correlation between China’s structural global value chain indicator and other trade partners’ indicators
0.5
0.6
0.7
0.8
0.9
1
Japan Dynamic Asia Germany Australia World Korea United States

CARDIAC ARREST OR DIZZY SPELL: WHY IS WORLD TRADE SO WEAK AND WHAT CAN POLICY DO ABOUT IT?
37 OECD ECONOMIC POLICY PAPERS, NO. 18 © OECD 2016
Appendix 4. A Panel Model of Long-Term Trade Intensity
To explain trade intensity over the long-term, the following panel equation (Table 5) using data for 130 countries over the period 1980-2013 is estimated:
𝑡𝑡𝑡𝑡𝑡𝑡𝑡𝑡𝑡𝑡𝑡𝑡𝑖𝑖𝑡𝑡𝑡𝑡𝑖𝑖𝑡𝑡𝑡𝑡𝑡𝑡𝑦𝑦𝑖𝑖𝑡𝑡 = 𝜃𝜃0 + 𝜃𝜃1 log(𝑝𝑝𝑝𝑝𝑝𝑝𝑖𝑖𝑡𝑡) + 𝜃𝜃2 log(𝑔𝑔𝑡𝑡𝑝𝑝/𝑝𝑝𝑝𝑝𝑝𝑝𝑖𝑖𝑡𝑡) + 𝜃𝜃4𝑡𝑡𝑡𝑡𝑚𝑚𝑝𝑝𝑡𝑡𝑡𝑡𝑖𝑖 + +𝜃𝜃6𝑤𝑤_𝑡𝑡𝑡𝑡𝑡𝑡𝑡𝑡𝑡𝑡𝑡𝑡𝑡𝑡𝑡𝑡𝑡𝑡 + 𝜃𝜃7𝑡𝑡𝑡𝑡𝑡𝑡𝑡𝑡𝑡𝑡𝑡𝑡𝑡𝑡𝑡𝑡𝑖𝑖𝑡𝑡+ 𝜃𝜃8𝐺𝐺𝐺𝐺𝐺𝐺𝑡𝑡 + 𝜀𝜀𝑖𝑖𝑡𝑡,
for country i and time t where trade intensity is measured as the ratio to GDP of the sum of exports
and imports, pop is the country population, w_tradelib is defined a measure of global trade liberalisation as in Appendix 1, tradelib is the corresponding country-specific measure of trade liberalisation and gdp/pop is GDP per capita.
Remote is defined as the trade-weighted average of the distance from world markets. Its measures remoteness of individual countries by considering only countries that are located relatively close to it. Thereby, the remoteness indicator accounts for the potential benefits of a country from easier access to major neighbouring markets. To compute the index, the United Nations uses a threshold of 50% of the world market. Hence, remoteness is measured as the average distance needed to reach a minimum of 50% of the world market. The five most remote OECD countries in order are New Zealand, Australia, Japan, the United States and Korea. The five least remote OECD countries in order are Turkey, Israel, Iceland, Norway and Denmark.
GAP is a GDP-weighted world output gap index, defined as the sum of the individual country gap measures weighted by GDP valued at purchasing power parities (PPPs) as a share of total world GDP. For the OECD countries, the output gap data are sourced from the OECD Economic Outlook database 99. For 63 non-OECD countries including the BRIICS, the output gap series are from the IMF World Economic Outlook released in April 2016. For all other remaining countries, the output gap is computed as the difference between actual output and potential output obtained by applying a HP filter to actual output with a lambda of 100.

CARDIAC ARREST OR DIZZY SPELL: WHY IS WORLD TRADE SO WEAK AND WHAT CAN POLICY DO ABOUT IT?
38 OECD ECONOMIC POLICY PAPERS, NO. 18 © OECD 2016
Table 5. Explaining world trade intensity (X+M/GDP)
Note: *, **, and *** indicate statistical significance at the 10%, 5% and 1% level, respectively.
Sources: United Nations Committee for Development Policy Secretariat; Fraser Institute, OECD Economic Outlook Database 99, IMF WEO Database; authors calculations
VariableEstimated coefficient
(std. error)Constant 1.637***
(0.092)log(pop) -0.126***
(0.003)log(gdp/pop) 0.056***
(0.005)remote -0.033***
(0.002)
w_tradelib 0.106***
(0.009)tradelib 0.018***
(0.003)GAP 0.011***
(0.004)Sample 1980-2013
R 2 0.41