A model for fracture toughness evaluation of the carburized layer for ...

2007-01-1007
The Fatigue Performance of High Temperature Vacuum Carburized Nb Modified 8620 Steel
Richard E. Thompson, David K. Matlock, and John G. Speer Colorado School of Mines
Copyright © 2007 SAE International
ABSTRACT
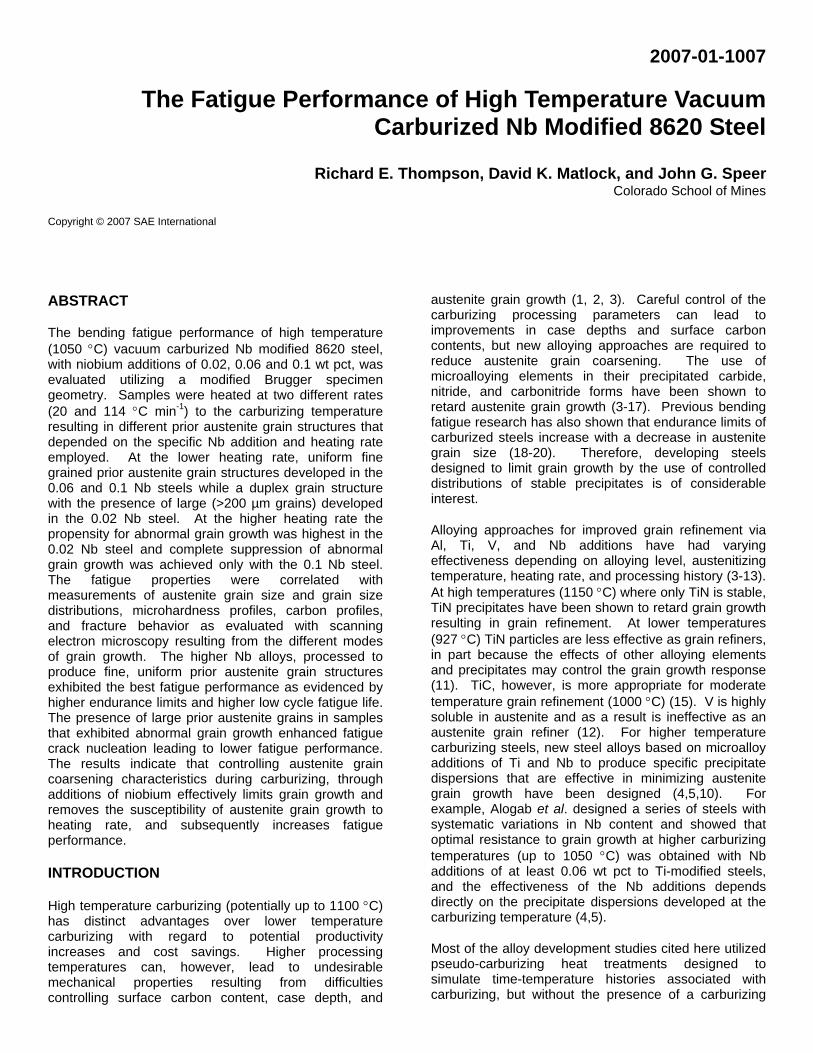
The bending fatigue performance of high temperature (1050 °C) vacuum carburized Nb modified 8620 steel, with niobium additions of 0.02, 0.06 and 0.1 wt pct, was evaluated utilizing a modified Brugger specimen geometry. Samples were heated at two different rates (20 and 114 °C min-1) to the carburizing temperature resulting in different prior austenite grain structures that depended on the specific Nb addition and heating rate employed. At the lower heating rate, uniform fine grained prior austenite grain structures developed in the 0.06 and 0.1 Nb steels while a duplex grain structure with the presence of large (>200 µm grains) developed in the 0.02 Nb steel. At the higher heating rate the propensity for abnormal grain growth was highest in the 0.02 Nb steel and complete suppression of abnormal grain growth was achieved only with the 0.1 Nb steel. The fatigue properties were correlated with measurements of austenite grain size and grain size distributions, microhardness profiles, carbon profiles, and fracture behavior as evaluated with scanning electron microscopy resulting from the different modes of grain growth. The higher Nb alloys, processed to produce fine, uniform prior austenite grain structures exhibited the best fatigue performance as evidenced by higher endurance limits and higher low cycle fatigue life. The presence of large prior austenite grains in samples that exhibited abnormal grain growth enhanced fatigue crack nucleation leading to lower fatigue performance. The results indicate that controlling austenite grain coarsening characteristics during carburizing, through additions of niobium effectively limits grain growth and removes the susceptibility of austenite grain growth to heating rate, and subsequently increases fatigue performance.
INTRODUCTION
High temperature carburizing (potentially up to 1100 °C) has distinct advantages over lower temperature carburizing with regard to potential productivity increases and cost savings. Higher processing temperatures can, however, lead to undesirable mechanical properties resulting from difficulties controlling surface carbon content, case depth, and
austenite grain growth (1, 2, 3). Careful control of the carburizing processing parameters can lead to improvements in case depths and surface carbon contents, but new alloying approaches are required to reduce austenite grain coarsening. The use of microalloying elements in their precipitated carbide, nitride, and carbonitride forms have been shown to retard austenite grain growth (3-17). Previous bending fatigue research has also shown that endurance limits of carburized steels increase with a decrease in austenite grain size (18-20). Therefore, developing steels designed to limit grain growth by the use of controlled distributions of stable precipitates is of considerable interest.
Alloying approaches for improved grain refinement via Al, Ti, V, and Nb additions have had varying effectiveness depending on alloying level, austenitizing temperature, heating rate, and processing history (3-13). At high temperatures (1150 °C) where only TiN is stable, TiN precipitates have been shown to retard grain growth resulting in grain refinement. At lower temperatures (927 °C) TiN particles are less effective as grain refiners, in part because the effects of other alloying elements and precipitates may control the grain growth response (11). TiC, however, is more appropriate for moderate temperature grain refinement (1000 °C) (15). V is highly soluble in austenite and as a result is ineffective as an austenite grain refiner (12). For higher temperature carburizing steels, new steel alloys based on microalloy additions of Ti and Nb to produce specific precipitate dispersions that are effective in minimizing austenite grain growth have been designed (4,5,10). For example, Alogab et al. designed a series of steels with systematic variations in Nb content and showed that optimal resistance to grain growth at higher carburizing temperatures (up to 1050 °C) was obtained with Nb additions of at least 0.06 wt pct to Ti-modified steels, and the effectiveness of the Nb additions depends directly on the precipitate dispersions developed at the carburizing temperature (4,5).
Most of the alloy development studies cited here utilized pseudo-carburizing heat treatments designed to simulate time-temperature histories associated with carburizing, but without the presence of a carburizing

gas. Furthermore, the heating rate to the carburizing temperature was typically not reported and thus assumed by each investigator to be a variable of secondary importance in controlling the effectiveness of the microalloy additions to control grain growth. In a recent study, Alogab et al. (5) illustrated the importance of heating rate on the effectiveness of specific Nb additions to suppress grain growth at higher carburizing temperatures (1050 °C). Specifically, with a decrease in heating rate from 145 °C min-1 to 20 °C min-1, Ti-modified 8620 steels with 0.06 and 0.1 wt pct Nb exhibited a transition in grain growth behavior from extensive abnormal grain growth at the higher heating rate to suppressed grain growth leading to a finer uniform austenite grain size at the lower heating rate. In the same base steel with 0.02 wt pct Nb, various degrees of abnormal grain growth were observed at all heating rates. Suppression of grain growth in the higher Nb-containing steels was correlated with the development of a higher density of fine precipitates in samples processed at the lower heating rates.
The current study was designed to follow the recent results of Alogab et al. and assess the response of Nb alloy additions to a Ti-modified 8620 steel on the microstructures and fatigue properties of vacuum carburized steels processed at a temperature significantly higher than that normally used for gas carburized steels. Two primary objectives were outlined: (a) evaluate the effects of the higher carbon contents associated with carburizing on abnormal grain growth in Nb-modified steels and compare the results to similar results obtained previously on steels that were pseudo-carburized, and (b) quantify the effects of grain size and grain size distributions, as controlled by Nb content and heating rate on the bending fatigue properties of carburized steels and compare the results to previously obtained data on gas and vacuum carburized samples of conventional alloys.
EXPERIMENTAL PROCEDURE
COMPOSITION AND SPECIMEN PREPARATION
Three microalloyed steels with Nb additions to a reference Ti-modified SAE 8620 steel were produced as laboratory heats with the compositions shown in Table 1. These Ti-Nb-modified steels contained nominally constant levels of carbon, nitrogen, and titanium, with different niobium contents (0.02, 0.06, and 0.1 wt pct). The laboratory melted alloys were processed to simulate conventional hot-rolling (HR; finish rolling temperature of 1100 °C) or controlled-rolling (CR; finish rolling temperature of 850 °C) with the details of the alloy design and processing history summarized elsewhere (4, 5). Modified Brugger bending fatigue specimens were machined, with the specimen geometry shown in Figure 1, from the 19 mm thick plate material remaining from previous studies (4, 5). The fatigue specimen orientation was parallel to the rolling direction and the fillet was oriented for fatigue crack growth in the transverse rolling direction. Prior to carburizing, the rounded edges and fillets of all samples were lightly ground with an alumina rod; the samples were then chemically polished in a HF-H2O2 solution prior to carburizing (21).
Figure 1. Schematic drawing of the modified Brugger bending fatigue specimen. Dimensions are in millimeters.
TABLE 1 - Chemical Composition of Experimental Steels in Weight Percent (N and O in ppm) (4).
Alloy C Nb Ti 0.02 Nb 0.21 0.022 0.03 0.06 Nb 0.22 0.054 0.034 0.1Nb 0.22 0.109 0.032
Alloy Mn P S Si Cr Ni Mo Cu Al O N
0.02 Nb 0.82 0.016 0.002 0.24 0.60 0.42 0.20 0.01 0.023 24 950.06 Nb 0.80 0.017 0.003 0.24 0.60 0.43 0.21 0.01 0.022 28 920.1Nb 0.85 0.019 0.003 0.25 0.59 0.43 0.20 0.01 0.024 24 87

CARBURIZING All samples were vacuum carburized in a commercial vacuum carburizing system. Based on the results of Alogab et al. (4, 5), carburizing parameters were selected to produce samples with significantly different grain size distributions. Alogab et al. showed that, for a given alloy, a slower heating rate to the carburizing temperature produced a finer more uniform microstructure as opposed to a higher heating rate that produced abnormally grown austenite grains (4, 5). AlOgab et al. also showed that, for a given heating rate, a decrease in Nb content was accompanied by an increase in abnormal grain growth (4, 5). In light of this evidence, a carburizing experimental matrix was designed to evaluate both the effects of Nb content and heating rate (20 and 145 °C min-1) to the carburizing temperature on the grain size. As Alogab et al. showed, the thermomechanical history was a second order variable when compared to Nb content and heating rate, so the available fatigue samples were divided into two groups based on thermomechanical history as shown in Table 2. The aim heating rates and the actual heating rates obtained from the carburizing process history are
also summarized in Table 2 along with the anticipated austenite grain structures from the pseudo-carburizing experiments (4, 5). Table 2 shows that the aim heating rate to the carburizing temperature of 20 °C min-1 was applied to the specimens with the hot rolled thermomechanical history whereas the aim heating rate of 145 °C min-1 was applied to the specimens with the control rolled thermomechanical history. The heat treating process was designed to carburize specimens at 1050 °C to a depth of 1 mm with a carbon content of 0.8 wt pct at the surface. The carburizing temperature of 1050 °C was chosen as it represented the upper limit in carburizing temperature, for these alloys, which resulted in significantly different grain size distributions (4, 5). Although the heating rate for the control rolled specimens was lower than the aim values based on the pseudo-carburizing experiments (4, 5), the heating rate obtained was sufficiently high to achieve the desired grain size distributions. The precise nine step boost and diffuse cycle employed during carburizing of both the 20 and 114 °C min-1 fatigue specimens is presented in Table 3. After carburizing, the fatigue specimens were oil quenched from the equalizing temperature and then tempered at 177 °C for 1 hour.
TABLE 2 - Summary of aim and actual heating rates obtained for each alloy system. Also shown are the anticipated prior
austenite grain structures based on the previous work of Alogab et al. (4, 5).
Aim Heating
Rate (°C min-1)
Actual Heating
Rate (°C min-1)
Thermomechanical History
Alloy Designation
Anticipated Microstructure
0.02 Duplex Structure 0.06 Fine/Uniform 20 20 HR 0.1 Fine/Uniform 0.02 Normal Growth 0.06 Duplex Structure 145 114 CR 0.1 Duplex Structure
TABLE 3 - Carburizing Cycles for Processed Fatigue Specimens
20 °C min-1 – (HR) 114 °C min-1 – (CR)
Cycle Time (min)
Temp (°C) Cycle Carburize
(min) Diffuse (min) Cycle Time
(min) Temp (°C)
Ramp to set point 51 1050 1 0.42 0.42 Ramp to
set point 9 1050
2 0.42 0.42 3 0.50 0.58 4 0.50 0.58 5 0.62 2.83 6 0.57 3.70 7 0.53 4.50 8 0.52 5.30 9 0 2.63
Cool prior to quench 0 29
Totals 4.08 49.96

METALLOGRAPHY
Case and core prior austenite grain sizes were determined for each alloy and carburizing combination. The prior austenite grian size measurements were conducted as per ASTM E112 on the case and core microstructures. The prior austenite grain boundaries were revealed with a saturated aqueous picric acid solution with two drops of concentrated hydrochloric acid with teepol added as a wetting agent (22). The martensitic microstructure as well as the retained austenite were revealed through the use of a 4% nital etch. Micrographs were obtained using a light optical microscope equipped with a digital camera.
CARBON AND MICROHARDNESS PROFILES
Rectangular carbon profile coupons were carburized along with the fatigue specimens. Layers were machined off at specific depths and the shavings were collected and analyzed for carbon using a Leco carbon and sulfur analyzer. Untested fatigue specimens were sectioned, mounted in Bakelite, ground, and polished to 1 µm and microhardness profiles were obtained with a 500 gram indention force for 10 seconds.
FATIGUE AND FRACTURE
All specimens were tested in cantilever bending fatigue at room temperature in the as carburized condition following standard procedures used previously (18-20, 24–29). The fatigue machines operate in displacement control at a frequency of 30 Hz. To preserve the appearance of the fracture surfaces, the specimens were tested with a minimum/maximum stress ratio of 0.1. Three specimens were tested at each stress level with an endurance limit criteria based on the observance of three consecutive run-outs (ten million cycles) for a given stress level. Light optical macro photographs and scanning electron microscope images of fractured fatigue samples were obtained on selected samples.
RESULTS
METALLOGRAPHY
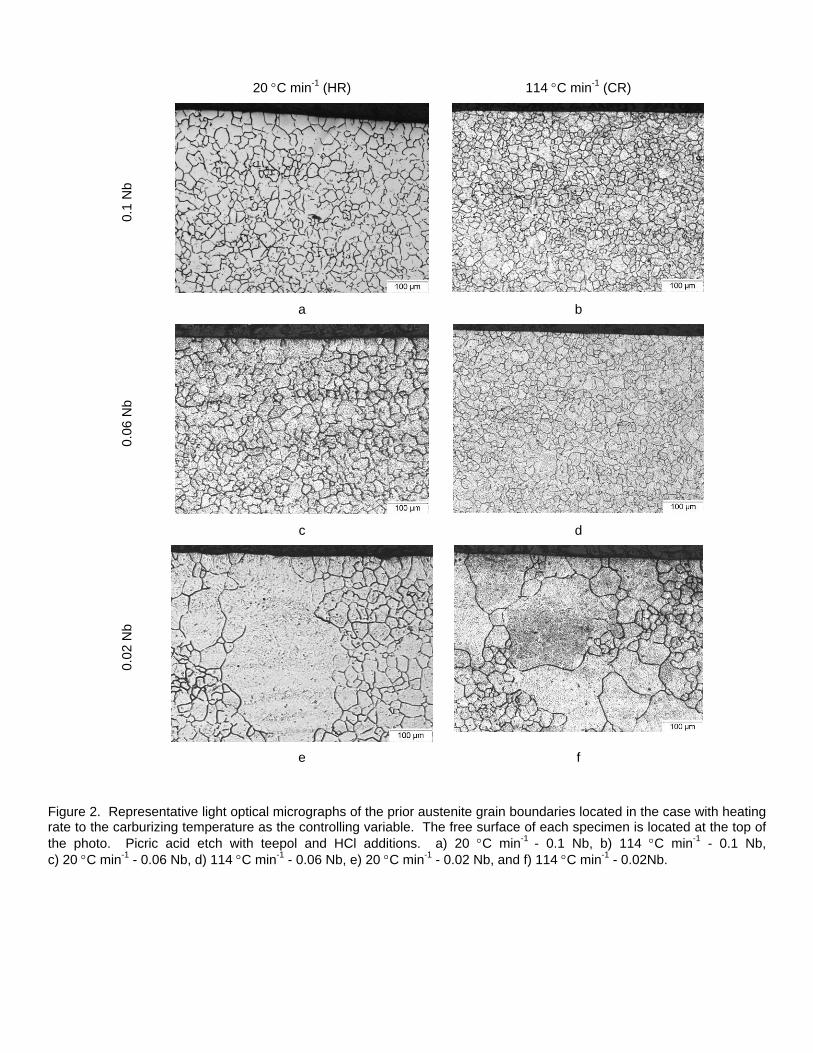
Figures 2 and 3 show light optical micrographs of the case and core microstrucures of samples etched to reveal prior austenite grain boundaries. Consistent with previous studies (4,5), both figures show systematic transitions in microstrucure with Nb additions and heating rate in samples carburized at 1050 °C. For a 20 °C min-1 heating rate, fine equiaxed grain strucures developed for high Nb contents (0.1 and 0.06 wt pct). In contrast, a duplex grain structure characteristic of abnormal grain growth with low (0.02 wt pct) Nb content was observed. For the higher heating rate of 114 °C min-1, similar transitions were observed except that the onset of a duplex grain structure was evident in
the 0.06 Nb steel and a higher area fraction of large grains was observed in the 0.02 Nb steel. A comparison of Figures 2 and 3 showed similar results in the case to the lower carbon containing core. This latter observation is significant as it supports an interpretation presented previously by Alogab et al. (5) in the pseduo-carburizing heat treating studies where it was indicated that sufficient carbon exists in the base steel to control precipitate formation and the additional carbon in the case will not likely alter the effectiveness of Nb to develop precipitates to suppress grain growth. Table 5 summarizes prior austenite grain size measurements from the microstructures shown in Figures 2 and 3. These results confirm through a comparison of case and core grain sizes for each alloy and processing history combination, that the mode of grain growth depends on Nb content and heating rate, but is independent of the evolving carbon content.
TABLE 4 – Average Grain Size Results in µm
Heating Rate
Alloy Designation Case Core
0.1 Nb 21 20 0.06 Nb 23 20 20 °C min-1
0.02 Nb 38 31 0.1 Nb 20 21
0.06 Nb 25 23 114 °C min-1
0.02 Nb 39 37
Figure 4 presents light optical micrographs of samples etched to reveal the microstructural features in the case near the free surface. Figure 4 shows that the case microstructure consists of a mixture of lath and plate martensite, etched dark, with discrete amounts of retained austenite appearing white. The micrographs that comprise Figure 4 show that Nb content and heating rate have little effect on the amounts of retained austenite in the case. Also, there appears to be little difference in the martensite morphology between alloy and carburizing conditions. The micrographs in Figure 4 indicate that the alloy and heating rate combinations have little effect on the transformation behavior of these steels.
20 °C min-1 (HR) 114 °C min-1 (CR)
0.1
Nb
a b
0.06
Nb
c d
0.02
Nb
e f
Figure 2. Representative light optical micrographs of the prior austenite grain boundaries located in the case with heating rate to the carburizing temperature as the controlling variable. The free surface of each specimen is located at the top of the photo. Picric acid etch with teepol and HCl additions. a) 20 °C min-1 - 0.1 Nb, b) 114 °C min-1 - 0.1 Nb, c) 20 °C min-1 - 0.06 Nb, d) 114 °C min-1 - 0.06 Nb, e) 20 °C min-1 - 0.02 Nb, and f) 114 °C min-1 - 0.02Nb.

20 °C min-1 (HR) 114 °C min-1 (CR)
0.1
Nb
a b
0.06
Nb
c d
0.02
Nb
e f
Figure 3. Representative light optical micrographs of the prior austenite grain boundaries located in the core with heating rate to the carburizing temperature as the controlling variable. Picric acid etch with teepol and HCl additions. a) 20 °C min-1 - 0.1 Nb, b) 114 °C min-1 - 0.1 Nb, c) 20 °C min-1 - 0.06 Nb, d) 114 °C min-1 - 0.06 Nb, e) 20 °C min-1 - 0.02 Nb, and f) 114 °C min-1 - 0.02Nb.

20 °C min-1 (HR) 114 °C min-1 (CR) 0.
1 N
b
a b
0.06
Nb
c d
0.02
Nb
e f
Figure 4. Light optical micrographs of the case microstructure for every alloy and carburizing condition. 4% nital etch. The surface of each specimen is located at the top of the photo. a) 20 °C min-1 - 0.1 Nb, b) 114 °C min-1 - 0.1 Nb, c) 20 °C min-1 - 0.06 Nb, d) 114 °C min-1 - 0.06 Nb, e) 20 °C min-1 - 0.02 Nb, and f) 114 °C min-1 - 0.02Nb.

CARBON PROFILES
Carbon content versus depth for each alloy and heating rate combination are shown in Figure 5. The carbon profiles are similar for each heat treatment and alloy condition and show a maximum carbon content of approximately 0.8 wt pct at the surface. The core carbon content is 0.21 wt pct which occurs in all samples at a depth of approximatley 0.75 mm from the surface. The carbon profiles indicate that the case depth of 0.75 mm was slightly shallower than the desired 1 mm case depth. The plots that comprise Figure 5 are essentially identical indicating that the materials used in this study have a similar response to carburizing.
MICROHARDNESS PROFILES
Microhardness profiles for each alloy and process condition are similar, as shown in Figure 6. For each condition, a hardness peak of approximately 60 HRC occurs just below the surface with a core hardness of approximately 45 HRC. The core hardness in the fatigue samples is higher than would typically be observed in a production gear due to the faster cooling rate associated with the small samples during quenching. The microhardness profiles also indicate that the effective case depth, defined as the depth at which a hardness of 50 HRC is achieved, occurs at about 0.75 mm from the surface.
FATIGUE
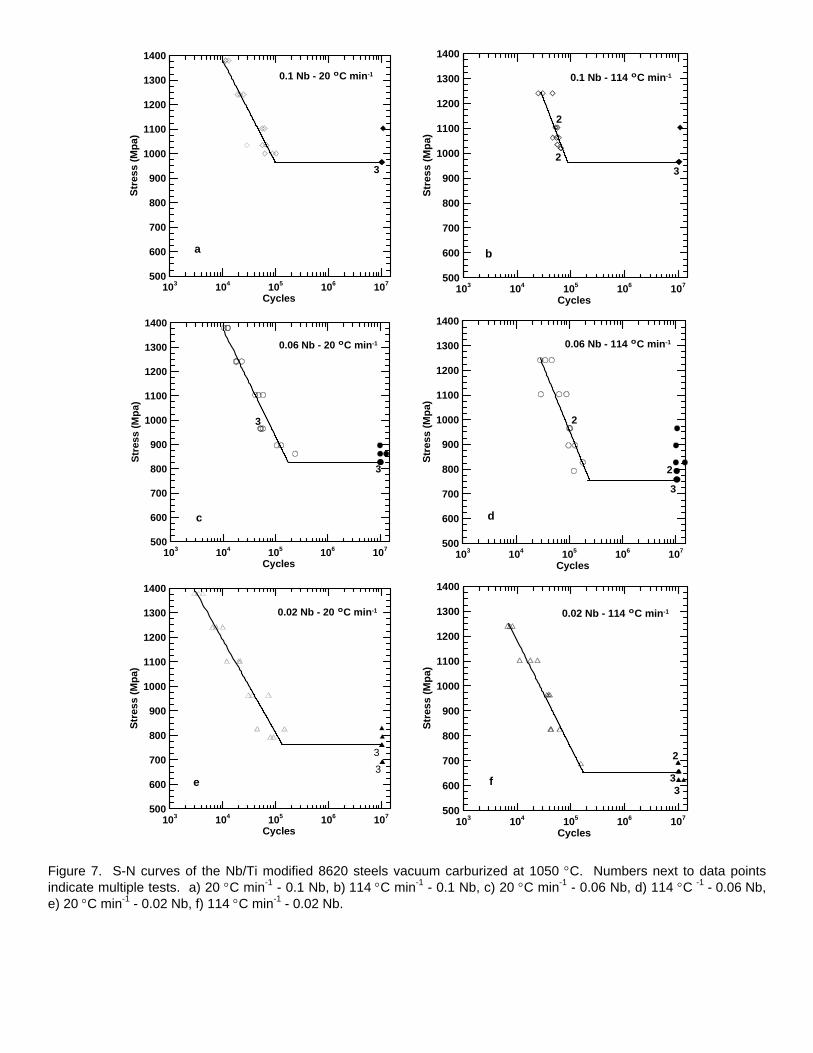
Figure 7 shows fatigue data for the modified Brugger bending fatigue tests. Each S-N data set is interpreted by two straight lines, one representing the finite life, and one horizontal line corresponding to the endurance limit. For each curve, the low cycle data group with limited scatter and the endurance limit line corresponds to the highest stress at which three consecutive tests exhibited runout (i.e. 107 cycles). Figure 8a and 8b compare the effects of Nb addition at the low and high heating rates; the data points shown in Figure 7 are removed for clarity. Each figure shows a systematic increase in the endurance limit with increasing Nb content for all three alloys. In the low cycle region, at either heating rate, the data for the 0.06 and 0.1 Nb steels superimpose and exhibit an improvement in fatigue properties when compared to the 0.02 Nb alloy. Table 5 summarizes the endurance limits obtained and shows that endurance limits ranged from a low of 655 MPa for the 0.02 Nb steel heated at the highest rate to 965 MPa for the 0.1 Nb steel heated at either rate.
TABLE 5 - Summary of Endurance Limits for the Tested Specimens (all values in MPa)
Heating Rate Alloy Designation
Endurance Limit
0.1 Nb 965 0.06 Nb 827 20 °C min-1
0.02 Nb 758 0.1 Nb 965 0.06 Nb 758 114 °C min-1
0.02 Nb 655
FRACTURE BEHAVIOR
The fracture surfaces were photographed using both light and electron microscopic techniques and selected light optical fractographs are presented in Figure 9. Each fractograph shows a transition in the appearance of the fracture surface from the case to the core. Figure 9 also shows an overall increase in the fracture surface roughness with a decrease in Nb content. For the 0.02 and 0.06 Nb steels, the fracture surface transition and increased roughness is independent of heating rate, while for the 0.1Nb steel, the higher heating rate exhibited a slightly smoother overall appearance. Also observed in Figure 9 are ratchet marks, displayed as offsets in the fracture surface along the top surface adjacent to the sample fillet. Ratchet marks indicate multiple crack nucleation (23) and represent the location where independent fatigue cracks grew together. As highlighted by the arrow in Figure 9f, some initiation sites, visible as light shiny half hemispherical discontinuities along the top free surface, were apparent. For the low Nb steel the fractographs also show an increase in the number of large and shiny facets distributed throughout the case and core of the material. These reflective facets highlight brittle fracture features associated with the large grains produced by abnormal grain growth.
SEM images of selected crack initiation sites are shown in Figure 10. Each image shows that crack initiation was associated with a localized zone, one to two austenite grains deep, of intergranular nucleation and crack propagation followed by transgranular fracture. As shown in Figure 10, the large facets result from transgranular crack propagation in a region of the fracture surface otherwise dominated by intergranular crack growth. The transgranular regions appear to be on the same size scale as the large grains produced by abnormal grain growth. Some of the transgranular facets are adjacent to the surface of the specimen, but are not associated with crack initiation.

0 0.25 0.5 0.75 1 1.25 1.5Depth (mm)
0.2
0.4
0.6
0.8
1
Car
bon
(%)
a
0.1 Nb - 20 ºC min-1
0 0.25 0.5 0.75 1 1.25 1.5Depth (mm)
0.2
0.4
0.6
0.8
1
Car
bon
(wt.
%)
b
0.1 Nb - 114 ºC min-1
0 0.25 0.5 0.75 1 1.25 1.5Depth (mm)
0.2
0.4
0.6
0.8
1
Car
bon
(%)
0.06 Nb - 20 ºC min-1
c
0 0.25 0.5 0.75 1 1.25 1.5Depth (mm)
0.2
0.4
0.6
0.8
1
Car
bon
(wt.
%)
d
0.06 Nb - 114 ºC min-1
0 0.25 0.5 0.75 1 1.25 1.5Depth (mm)
0.2
0.4
0.6
0.8
1
Car
bon
( wt.
%)
e
0.02 Nb - 20 ºC min-1
0 0.25 0.5 0.75 1 1.25 1.5Depth (mm)
0.2
0.4
0.6
0.8
1
Car
bon
(wt.
%)
f
0.02 Nb - 114 ºC min-1
Figure 5. Carbon profiles for each alloy and carburizing history. a) 20 °C min-1 - 0.1 Nb, b) 114 °C min-1 - 0.1 Nb, c) 20 °C min-1 - 0.06 Nb, d) 114 °C min-1 - 0.06 Nb, e) 20 °C min-1 - 0.02 Nb, f) 114 °C min-1 - 0.02 Nb.

0 0.5 1 1.5 2Depth (mm)
30
35
40
45
50
55
60
65
70
Har
dnes
s (H
RC
)
a
0.1 Nb - 20 ºC min-1
0 0.5 1 1.5 2
Depth (mm)
30
35
40
45
50
55
60
65
70
Har
dnes
s (H
RC
)
b
0.1 Nb - 114 ºC min-1
0 0.5 1 1.5 2Depth (mm)
30
35
40
45
50
55
60
65
70
Har
dnes
s (H
RC
)
c
0.06 Nb - 20 ºC min-1
0 0.5 1 1.5 2
Depth (mm)
30
35
40
45
50
55
60
65
70
Har
dnes
s (H
RC
)
d
0.06 Nb - 114 ºC min-1
0 0.5 1 1.5 2Depth (mm)
30
35
40
45
50
55
60
65
70
Har
dnes
s (H
RC
)
e
0.02 Nb - 20 ºC min-1
0 0.5 1 1.5 2
Depth (mm)
30
35
40
45
50
55
60
65
70
Har
dnes
s (H
RC
)
f
0.02 Nb - 114 ºC min-1
Figure 6. Microhardness profiles for each alloy and carburizing history. a) 20 °C min-1 - 0.1 Nb, b) 114 °C min-1 - 0.1 Nb, c) 20 °C min-1 - 0.06 Nb, d) 114 °C min-1 - 0.06 Nb, e) 20 °C min-1 - 0.02 Nb, f) 114 °C min-1 - 0.02 Nb.
103 104 105 106 107
Cycles
500
600
700
800
900
1000
1100
1200
1300
1400
Stre
ss (M
pa)
3
a
0.1 Nb - 20 ºC min-1
0.1 Nb - 114 ºC min-1
3
2
2
103 104 105 106 107
Cycles
500
600
700
800
900
1000
1100
1200
1300
1400
Stre
ss (M
pa)
b
103 104 105 106 107
Cycles
500
600
700
800
900
1000
1100
1200
1300
1400
Stre
ss (M
pa)
3
c
3
0.06 Nb - 20 ºC min-1
103 104 105 106 107
Cycles
500
600
700
800
900
1000
1100
1200
1300
1400
Stre
ss (M
pa)
0.06 Nb - 114 ºC min-1
2
2
3
d
103 104 105 106 107
Cycles
500
600
700
800
900
1000
1100
1200
1300
1400
Stre
ss (M
pa)
0.02 Nb - 20 ºC min-1
33
e
103 104 105 106 107
Cycles
500
600
700
800
900
1000
1100
1200
1300
1400
Stre
ss (M
pa)
0.02 Nb - 114 ºC min-1
f 33
2
Figure 7. S-N curves of the Nb/Ti modified 8620 steels vacuum carburized at 1050 °C. Numbers next to data points indicate multiple tests. a) 20 °C min-1 - 0.1 Nb, b) 114 °C min-1 - 0.1 Nb, c) 20 °C min-1 - 0.06 Nb, d) 114 °C -1 - 0.06 Nb, e) 20 °C min-1 - 0.02 Nb, f) 114 °C min-1 - 0.02 Nb.

103 104 105 106 107
Cycles
500
600
700
800
900
1000
1100
1200
1300
1400
Stre
ss (M
pa)
0.1 Nb
0.06 Nb
0.02 Nb
a
All Alloys - 20 ºC min-1
103 104 105 106 107
Cycles
500
600
700
800
900
1000
1100
1200
1300
1400
Stre
ss (M
pa)
0.1 Nb
0.06 Nb
0.02 Nb
All Alloys - 114 ºC min-1
b
Figure 8. S-N comparison curves for the vacuum carburized Nb/Ti modified 8620 steel. a) 20 °C min-1 and b) 114 °C min-1 comparison.
20 °C min-1 (HR) 114 °C min-1 (CR)
0.1
Nb
a b
0.06
Nb
c d
0.02
Nb
e f
Figure 9. Fracture surfaces of failed specimens. Each photograph shows at least one ratchet mark. Each unit on the scale is 0.25 millimeter. The top of the fractographs represent the tensile side of the fatigue specimen with crack growth traveling from the top to the bottom. a) 20 °C min-1 - 0.1 Nb, b) 114 °C min-1 - 0.1 Nb, c) 20 °C min-1 - 0.06 Nb, d) 114 °C min-1 - 0.06 Nb, e) 20 °C min-1 - 0.02 Nb, f) 114 °C min-1 - 0.02 Nb.

20 °C min-1 (HR) 114 °C min-1 (CR)
0.1
Nb
a b
0.06
Nb
c d
0.02
Nb
e f
100 µm 100 µm
100 µm 100 µm
250 µm200 µm
Figure 10. Crack initiation sites for each alloy and carburizing condition. Crack initiation in all SEM images is intergranular. a) 20 °C min-1 - 0.1 Nb, b) 114 °C min-1 - 0.1 Nb, c) 20 °C min-1 - 0.06 Nb, d) 114 °C min-1 - 0.06 Nb, e) 20 °C min-1 - 0.02 Nb, f) 114 °C min-1 - 0.02 Nb.

20 °C min-1 (HR) 114 °C min-1 (CR)
Figure 11. Representative large transgranular (along with intergranular) facets associated with the 0.02 Nb alloy for both heating rates. a) 20 °C min-1, b) 114 °C min-1
DISCUSSION
The fatigue data in Figure 8 show that the endurance limits for the 0.1 Nb steel were the same (965 MPa) for both processing conditions. However, the measured endurance limits for the 0.06 and 0.02 Nb containing steels depended on heating rate. With a decrease in heating rate, the endurance limit for the 0.06 Nb steel increased from 758 MPa to 827 MPa while the 0.02 Nb steel exhibited a more significant increase from 655 MPa to 758 MPa. The lower endurance limits correlate directly to higher amounts of abnormal grain growth and correspondingly to larger overall average austenite grain sizes.
As shown in Figure 10, all fatigue samples exhibited intergranular crack nucleation followed by stable transgranular crack growth, observations which are consistent with previous studies (18-20, 24-26). In the vacuum carburized samples considered here, intergranular oxide formation resulting from gas carburizing was not visible. Therefore, the intergranular fracture is interpreted as a potential result of quench embrittlement (25-27). The depth of intergranular nucleation observed, approximately 100 µm in the 0.02 Nb samples, was greater than observed in previous studies that exhibited intergranular fracture to depths of less than 30 µm. The presence of large austenite grains due to abnormal grain growth led to the development of large transgranular facets distributed throughout the fracture surface as shown in Figure 11. The presence of large austenite grains in the 0.02 Nb steel and, to a lesser extent in the 0.06 Nb 114 °C min-1 steel, decreased the resistance to fatigue crack nucleation. The decrease in resistance to fatigue crack initiation resulted in lower observed endurance limits and the
appearance of multiple crack nucleation sites as revealed by the ratchet marks present on the fracture surfaces of Figure 9.
To assess the primary reason for the lower endurance limits due to the presence of large grains resulting from abnormal grain growth two questions were considered: 1) can the relative decrease in fatigue performance be explained by simply applying an average grain size to the duplex structured specimens through a Hall-Petch type of relationship? and 2) does a decrease in the fatigue performance correlate with a preferred crack path through the large grains (transgranular facets) that effectively lowers the fracture toughness of the material?
The finest grain size evaluated in this study was 20 µm. Finer grain sizes have been achieved in most of the previous studies that utilized the same fatigue specimen geometry and, consequently, the observed endurance limits were greater than those measured here (18-20, 24-29). As per the first assessment above, the average grain sizes and corresponding endurance limits for this research, as well as previous research on vacuum and gas carburized 8620 steel with the same sample geometry used here, are compared in Figure 12. In this figure, grain sizes are plotted following the convention used in the Hall-Petch plots, i.e. the inverse of the square root of grain size. The comparative materials were carburized at lower temperatures and consequently exhibit finer austenite grain sizes ranging between 9 and 20 µm. The results from the current study extend the apparent trend of decreasing endurance limits with an increase in grain size. The fact that the current data apparently extend the trend of previous results, as shown in Figure 12, suggests that the increase in overall average grain size associated
100 µm 100 µm
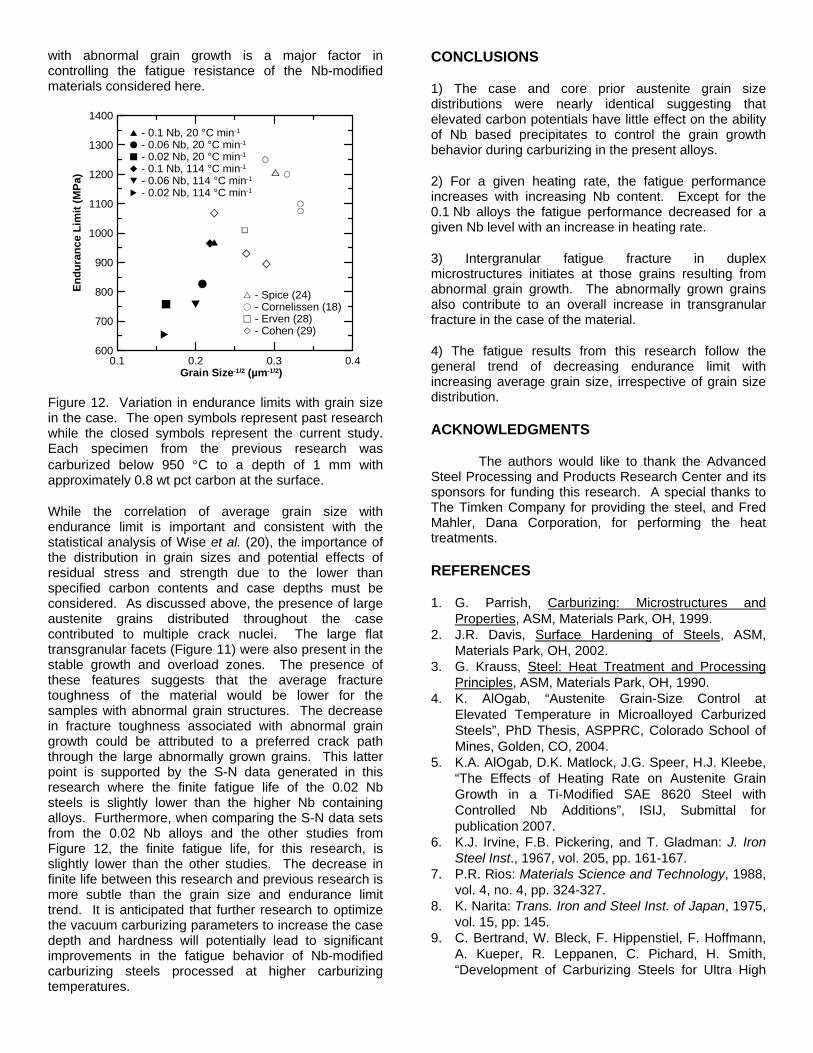
with abnormal grain growth is a major factor in controlling the fatigue resistance of the Nb-modified materials considered here.
0.1 0.2 0.3 0G
.4rain Size-1/2 (µm-1/2)
600
700
800
900
1000
1100
1200
1300
1400
Endu
ranc
e Li
mit
(MPa
)
. - Spice (24)+ - Cornelissen (18)( - Erven (28)$ - Cohen (29)
/ - 0.1 Nb, 20 °C min-1
, - 0.06 Nb, 20 °C min-1
* - 0.02 Nb, 20 °C min-1
& - 0.1 Nb, 114 °C min-1
5 - 0.06 Nb, 114 °C min-1
8 - 0.02 Nb, 114 °C min-1
Figure 12. Variation in endurance limits with grain size in the case. The open symbols represent past research while the closed symbols represent the current study. Each specimen from the previous research was carburized below 950 °C to a depth of 1 mm with approximately 0.8 wt pct carbon at the surface.
While the correlation of average grain size with endurance limit is important and consistent with the statistical analysis of Wise et al. (20), the importance of the distribution in grain sizes and potential effects of residual stress and strength due to the lower than specified carbon contents and case depths must be considered. As discussed above, the presence of large austenite grains distributed throughout the case contributed to multiple crack nuclei. The large flat transgranular facets (Figure 11) were also present in the stable growth and overload zones. The presence of these features suggests that the average fracture toughness of the material would be lower for the samples with abnormal grain structures. The decrease in fracture toughness associated with abnormal grain growth could be attributed to a preferred crack path through the large abnormally grown grains. This latter point is supported by the S-N data generated in this research where the finite fatigue life of the 0.02 Nb steels is slightly lower than the higher Nb containing alloys. Furthermore, when comparing the S-N data sets from the 0.02 Nb alloys and the other studies from Figure 12, the finite fatigue life, for this research, is slightly lower than the other studies. The decrease in finite life between this research and previous research is more subtle than the grain size and endurance limit trend. It is anticipated that further research to optimize the vacuum carburizing parameters to increase the case depth and hardness will potentially lead to significant improvements in the fatigue behavior of Nb-modified carburizing steels processed at higher carburizing temperatures.
CONCLUSIONS
1) The case and core prior austenite grain size distributions were nearly identical suggesting that elevated carbon potentials have little effect on the ability of Nb based precipitates to control the grain growth behavior during carburizing in the present alloys.
2) For a given heating rate, the fatigue performance increases with increasing Nb content. Except for the 0.1 Nb alloys the fatigue performance decreased for a given Nb level with an increase in heating rate.
3) Intergranular fatigue fracture in duplex microstructures initiates at those grains resulting from abnormal grain growth. The abnormally grown grains also contribute to an overall increase in transgranular fracture in the case of the material.
4) The fatigue results from this research follow the general trend of decreasing endurance limit with increasing average grain size, irrespective of grain size distribution.
ACKNOWLEDGMENTS
The authors would like to thank the Advanced Steel Processing and Products Research Center and its sponsors for funding this research. A special thanks to The Timken Company for providing the steel, and Fred Mahler, Dana Corporation, for performing the heat treatments.
REFERENCES
1. G. Parrish, Carburizing: Microstructures and Properties, ASM, Materials Park, OH, 1999.
2. J.R. Davis, Surface Hardening of Steels, ASM, Materials Park, OH, 2002.
3. G. Krauss, Steel: Heat Treatment and Processing Principles, ASM, Materials Park, OH, 1990.
4. K. AlOgab, “Austenite Grain-Size Control at Elevated Temperature in Microalloyed Carburized Steels”, PhD Thesis, ASPPRC, Colorado School of Mines, Golden, CO, 2004.
5. K.A. AlOgab, D.K. Matlock, J.G. Speer, H.J. Kleebe, “The Effects of Heating Rate on Austenite Grain Growth in a Ti-Modified SAE 8620 Steel with Controlled Nb Additions”, ISIJ, Submittal for publication 2007.
6. K.J. Irvine, F.B. Pickering, and T. Gladman: J. Iron Steel Inst., 1967, vol. 205, pp. 161-167.
7. P.R. Rios: Materials Science and Technology, 1988, vol. 4, no. 4, pp. 324-327.
8. K. Narita: Trans. Iron and Steel Inst. of Japan, 1975, vol. 15, pp. 145.
9. C. Bertrand, W. Bleck, F. Hippenstiel, F. Hoffmann, A. Kueper, R. Leppanen, C. Pichard, H. Smith, “Development of Carburizing Steels for Ultra High

Process Temperatures”, European Commission, Report no. EUR 20630, 2003.
10. T. Murakami, H. Hatano, H. Yaguchi, “Effects of the Conditions of Nb Carbo-nitride Precipitate on Abnormal Grain Growth in Nb Added Case Hardening Steels”, New Developments in Long and Forged Products Proceedings, AIST, June 2006.
11. S.G. Davidson, “The Influence of Titanium on Grain Size During High-Temperature Carburizing”, M.S. Thesis, ASPPRC, Colorado School of Mines, Golden, CO, 2001.
12. R. Lagneborg, T. Siwecki, S. Zajac, and B. Hutchinson, “The Role of Vanadium in Microalloyed Steels”, Scandinavian Journal of Metallurgy, Vol. 28, no. 5, October 1999.
13. E.J. Palmiere, C.I. Garcia, and A.J. DeArdo: Metall Trans, 1994, vol. 25A, no. 2, pp. 277-286.
14. J.G. Speer, J.R. Michael, and S.S. Hansen: Metall Trans, 1987, vol. 18A, pp. 211-222.
15. K. Hashimoto, T. Tanaka, H. Nishimori, K. Hiraoka, “Grain Growth Property of Ti-Modified Carburizing Steels”, SAE Report No. 2005-01-0985, Warrendale, Pa, 2005.
16. T. Gladman, The Physical Metallurgy of Microalloyed Steels, The Institute of Materials, 1997.
17. T. Gladman, Grain Size Control, The Institute of Materials, Minerals, and Mining, 2004.
18. B.E. Cornelissen, “Alloying and Processing Approaches to Improved Bending Fatigue Performance of Carburized Gear Steels”, PhD Thesis, ASPPRC, Colorado School of Mines, Golden, CO, 1999.
19. B.E. Cornelissen, G. Krauss, and D.K. Matlock, “Effects of Alloying and Processing on Surface Oxidation and Bending Fatigue of Carburized Steels”, 5th ASM Heat Treating Congress, Gothenburg, Sweden, pp. 117-127, June 2000.
20. J.P. Wise, and D.K. Matlock, “Bending Fatigue of Carburized Steels: A Statistical Analysis of Process and Microstructural Parameters”, SAE Paper No. 2000-01-0611, 2000.
21. G. Vander Voort, Metallography Principles and Practice, McGraw-Hill, pp. 555, 1984.
22. Metallography Principles and Procedures, Leco Corporation, St. Joseph, MI, 1996.
23. R. Honeycomb, The Plastic Deformation of Metals, Edward Arnold, London, 1984.
24. J.J. Spice, D.K. Matlock, and G. Fett, “Optimized Carburized Steel Fatigue Performance as Assessed with Gear and Modified Brugger Fatigue Tests”, SAE Technical Publication #2002-01-1003, SAE, Warrendale, PA, 2002.
25. J.J. Spice, “Evaluation of Silicon and Boron Additions to Reduce Quench Embrittlement in Modified 4320 Carburizing Grade Steel”, PhD Thesis, Colorado School of Mines, Golden, CO, 2006.
26. R.S. Hyde, “Quench Embrittlement and Intergranular Oxide Embrittlement: Effects on Bending Fatigue Initiation of Gas-Carburized Steel”, PhD Thesis, Colorado School of Mines, Golden, CO, 1994.
27. R.S. Hyde, G. Krauss, and D.K. Matlock, “Phosphorous and Carbon Segregation: Effects on Fatigue and Fracture of Gas-Carburized Modified 4320 Steel”, Metall Trans, vol. 25A, no. 6, 1994, pp. 1229-1240.
28. K.A. Erven, D.K. Matlock, and G. Krauss, “Effect of Sulfur on Bending Fatigue of Carburized Steel”, Journal of Heat Treating, vol. 9, pp. 27-35, 1991.
29. R.E. Cohen, Unpublished Research, ASPPRC, Colorado School of Mines, Golden, CO, 1994.