Carbonic Anhydrase: A New Therapeutic Target for Managing Diabetes Salihu Ibrahim Ismail College of...
43
Carbonic Anhydrase: A New Therapeutic Target for Managing Diabetes Salihu Ibrahim Ismail College of Medicine and Allied Health Professions Federal University, Dutse. Nigeria.
-
Upload
stephen-merritt -
Category
Documents
-
view
223 -
download
1
Transcript of Carbonic Anhydrase: A New Therapeutic Target for Managing Diabetes Salihu Ibrahim Ismail College of...
Carbonic Anhydrase: A New Therapeutic Target for Managing Diabetes
Salihu Ibrahim Ismail
College of Medicine and Allied Health Professions
Federal University, Dutse.Nigeria.

• The manifestations of diabetes cause considerable human suffering and enormous economic costs.
• Diabetes caused at least USD 612 billion dollars in health expenditure in 2014, with an estimated 4.9 million deaths in 2014.1
• Every seven seconds a person dies from diabetes. 1
Introduction
1. IDF DIABETES ATLAS SIXTH EDITION POSTER UPDATE 2014

• 387 million people presently have diabetes; by 2035 this will rise to 592 million. 1
• 77% of people with diabetes live in low- and middle-income countries. 1
• More than 22 million people in the Africa Region have Diabetes; by 2035 this figure will almost double. 1
1. IDF DIABETES ATLAS SIXTH EDITION POSTER UPDATE 2014

• There were 3.747 million cases of diabetes in Nigeria in 2014.1
• Prevalence of diabetes in adults in Nigeria is 4.6%. 1
• Number of death in adults due to diabetes is 105,091.1
• Cost per person with diabetes in Nigeria is USD 178.4.1
1. IDF DIABETES ATLAS SIXTH EDITION POSTER UPDATE 2014

• The development of long-term complications in diabetes is influenced by hyperglycemia.
• Poor control of hyperglycemia accelerates its progression. • The resulting chronic hyperglycemic condition in diabetes
is associated with long term damage, dysfunction, and failure of various organs, such as eyes, kidneys, nerves, heart, and blood vessels.2
• To prevent complications, Good management of diabetes should be to monitor the development of such complications and to provide timely intervention.
2. American Diabetes Association. Diagnosis and classification of diabetes mellitus. Diabetes Care, 30(Suppl. 1), S42–S47. (2007).
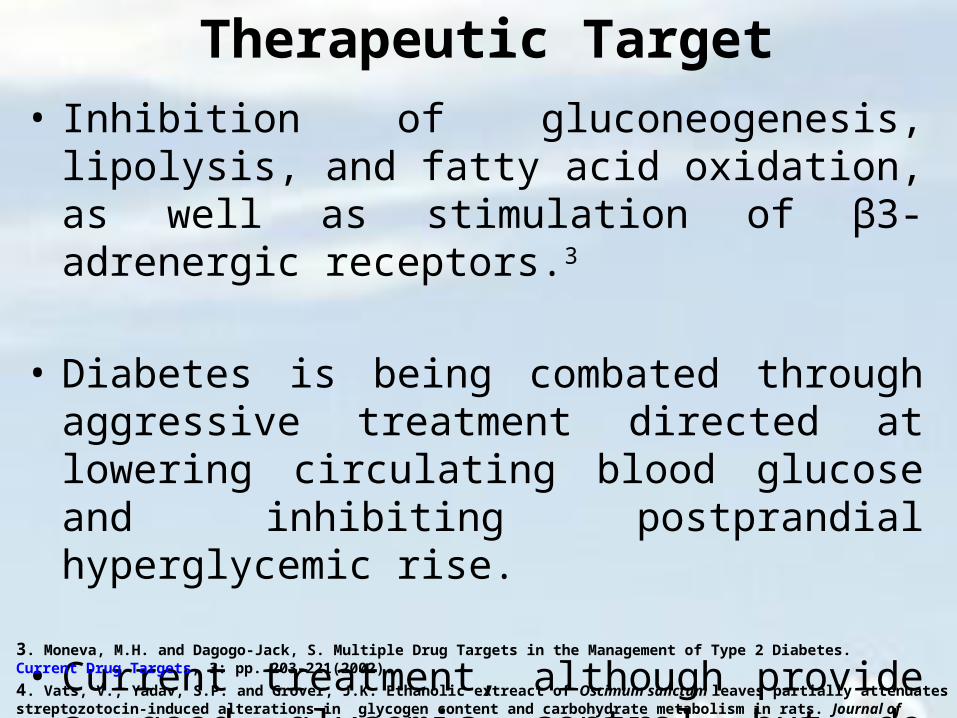
Therapeutic Target• Inhibition of gluconeogenesis, lipolysis, and fatty acid
oxidation, as well as stimulation of β3-adrenergic receptors.3
• Diabetes is being combated through aggressive treatment directed at lowering circulating blood glucose and inhibiting postprandial hyperglycemic rise.
• Current treatment, although provide a good glycemic control but do little in preventing complications.4
3. Moneva, M.H. and Dagogo-Jack, S. Multiple Drug Targets in the Management of Type 2 Diabetes. Current Drug Targets, 3: pp. 203-221(2002).
4. Vats, V., Yadav, S.P. and Grover, J.K. Ethanolic extreact of Oscimum sanctum leaves partially attenuates streptozotocin-induced alterations in glycogen content and carbohydrate metabolism in rats. Journal of Ethnopharmacology, 91: 109-113. (2004).

Current Strategies for The Treatment of Diabetes
• Reducing insulin resistance using glitazones.
• Supplementing insulin supplies with exogenous insulin.
• Increasing endogenous insulin production with
sulfonylureas and meglitinides.
• Stimulating insulin secretion with Gliptins.
• Reducing hepatic glucose production through biguanides.
• And limiting postprandial glucose absorption with alpha-
glucosidase inhibitors.

Emerging Therapeutic Targets
• Insulin sensitizers including protein tyrosine phosphatase-1B (PTP-1B) and glycogen synthase kinase 3 (GSK3).5
• Inhibitors of gluconeogenesis like pyruvate dehydrogenase kinase (PDH) inhibitors. 5
• Lipolysis inhibitors. 5
• Fat oxidation including carnitine palmitoyltransferase (CPT) I and II inhibitors, 5 and.
• Energy expenditure by means of beta 3-adrenoceptor agonists. 5
5. Wagman A.S., Nuss J.M., Current therapies and emerging targets for the treatment of diabetes. Curr. Pharm. Des. 7(6):417-50. (2001)

• It is well established that the risk of microvascular and macrovascular complications is related to glycemia, as measured by HbA1c; this remains a major focus of therapy.
• Our study aimed at assessing whether carbonic anhydrase is associated with short and long term implication in diabetes mellitus. The study aimed to provide therapeutic target at the same time a new marker to assist in identifying diabetic individuals at a high risk of developing diabetic complications.
Carbonic Anhydrase
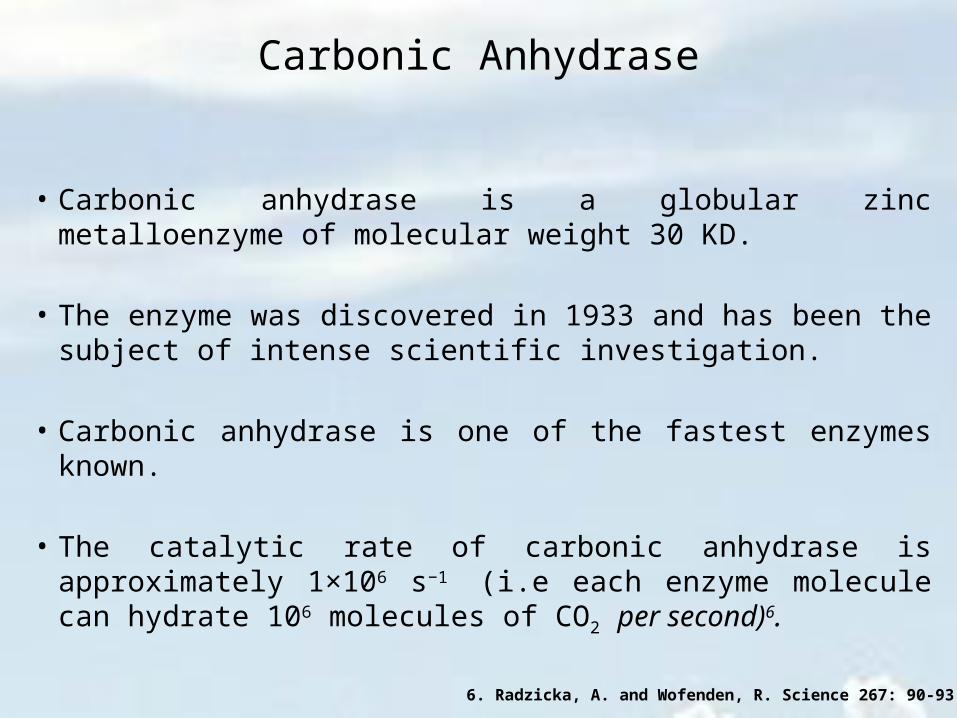
• Carbonic anhydrase is a globular zinc metalloenzyme of molecular weight 30 KD.
• The enzyme was discovered in 1933 and has been the subject of intense scientific investigation.
• Carbonic anhydrase is one of the fastest enzymes known.
• The catalytic rate of carbonic anhydrase is approximately 1×10⁶ s−1 (i.e each enzyme molecule can hydrate 106 molecules of CO2 per second)6.
6. Radzicka, A. and Wofenden, R. Science 267: 90-93 (1995)
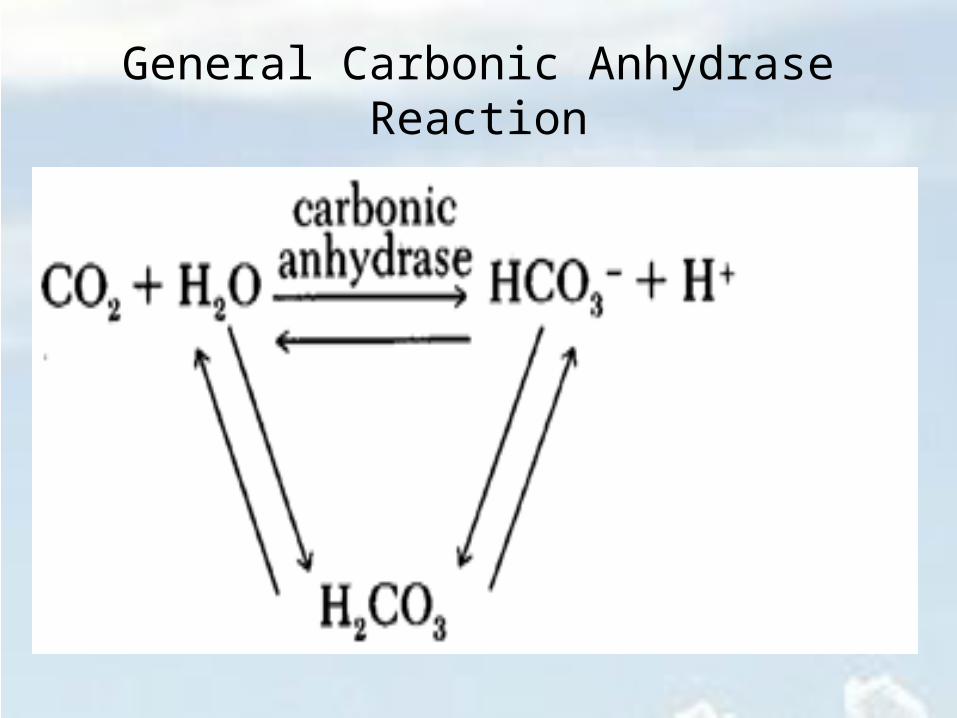
General Carbonic Anhydrase Reaction
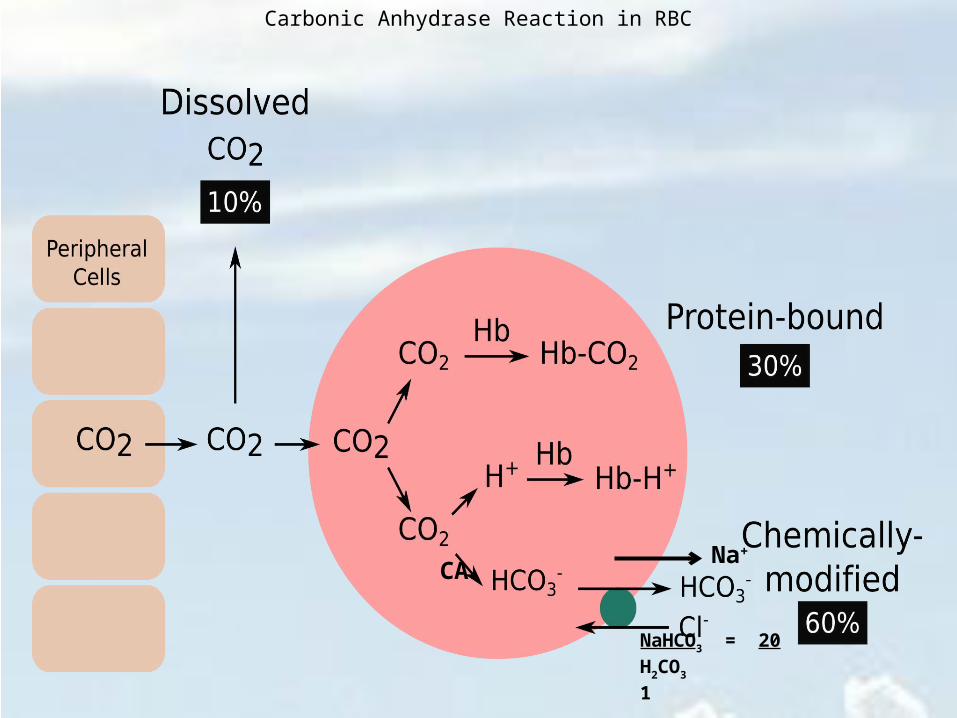
Carbonic Anhydrase Reaction in RBC
NaHCO3 = 20H2CO3 1
Na+
CA

Role of CA in Lactate and CO2 Transport
CA

H+ H+ H+
H+ H+ H+
H+ H+ H+
H+
H+ H+
H+
pH = 7.4

Metabolic Acidosis in DiabetesI. Metabolic acidosis is the
most common serious acid-base disorder complicating diabetes mellitus.
II. Carbonic anhydrase inhibitors produce metabolic acidosis by their action on carbonic anhydrase in the proximal and distal renal tubules. This blocks excretion of hydrogen ions, producing an alkali urine.
X X
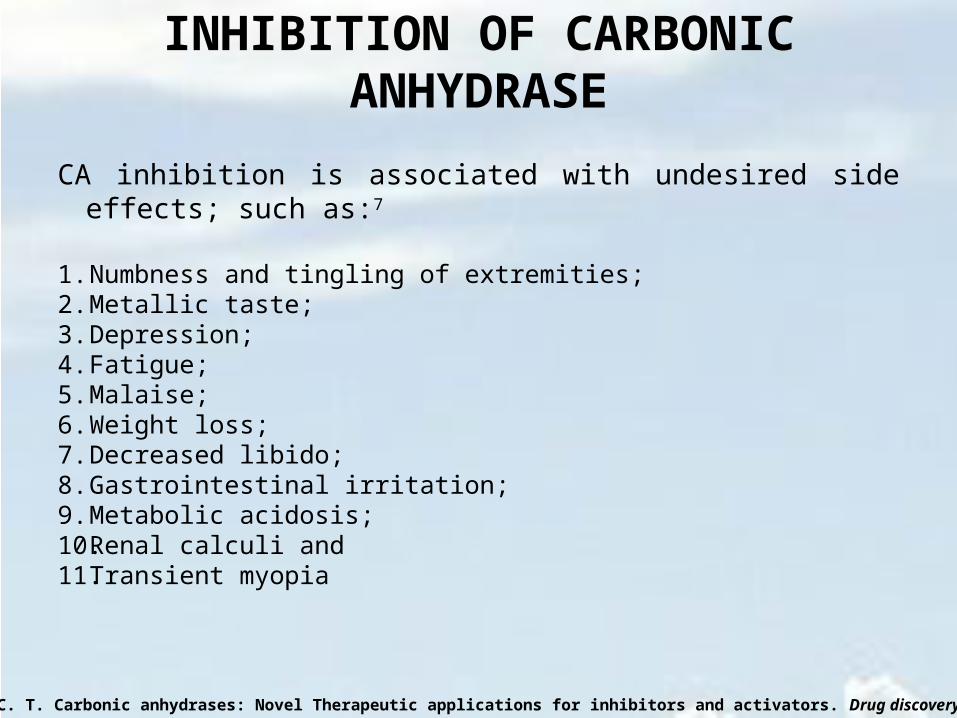
INHIBITION OF CARBONIC ANHYDRASE
CA inhibition is associated with undesired side effects; such as:7
1. Numbness and tingling of extremities; 2. Metallic taste;3. Depression; 4. Fatigue; 5. Malaise; 6. Weight loss; 7. Decreased libido; 8. Gastrointestinal irritation; 9. Metabolic acidosis; 10. Renal calculi and11. Transient myopia
7. Supuran, C. T. Carbonic anhydrases: Novel Therapeutic applications for inhibitors and activators. Drug discovery 7: 168-181 (2008)
RESEARCH DESIGNIN VIVO STUDIES

IN VITRO STUDIES
FT-IR GC-MS

MATERIALS AND METHODSPreparation of extract of cadaba farinosa leaves
he leaves of Cadaba farinosa were, washed, air-dried at room temperature, grinded to powder.
The crude extract was obtained through successive soxhlet extraction by dissolving 800g of
powdered plant leaves in 2.5L of n-Hexane followed by ethyl acetate and finally methanol for 48
hours each in a soxhlet apparatus. The crude fractions were concentrated using rotary evaporator
and stored in a dessicator until use.
Study animalsMale wister albino rats of 180–220 grams weight were used for this study.
Induction of diabetes
Diabetes was induced in all the rats except in the normal controls, by Streptozotocin (STZ) 60
mg per kg body weight, dissolved in ice cold citrate buffer (0.1 M, pH 4.5), through
intraperitoneal route. Fasting hyperglycemia was confirmed by the elevated glucose level > 200
mg/dl in plasma, determined at 72 h after injection. Hyperglycemic rats were included for the
study along with the normal control animals.

Biochemical Analysis
Metabolic parameters: Blood glucose, lactate, cholesterol and triglycerides triglycerides were measured using (Accutrend GCT Meter, Roche, Germany with Cobas® test strips).
Glycosylated haemoglobin determination: HbA1c was measured according to the manufacturers instruction, using standard reagent kits (Spectrum-diagnostics, Egypt).
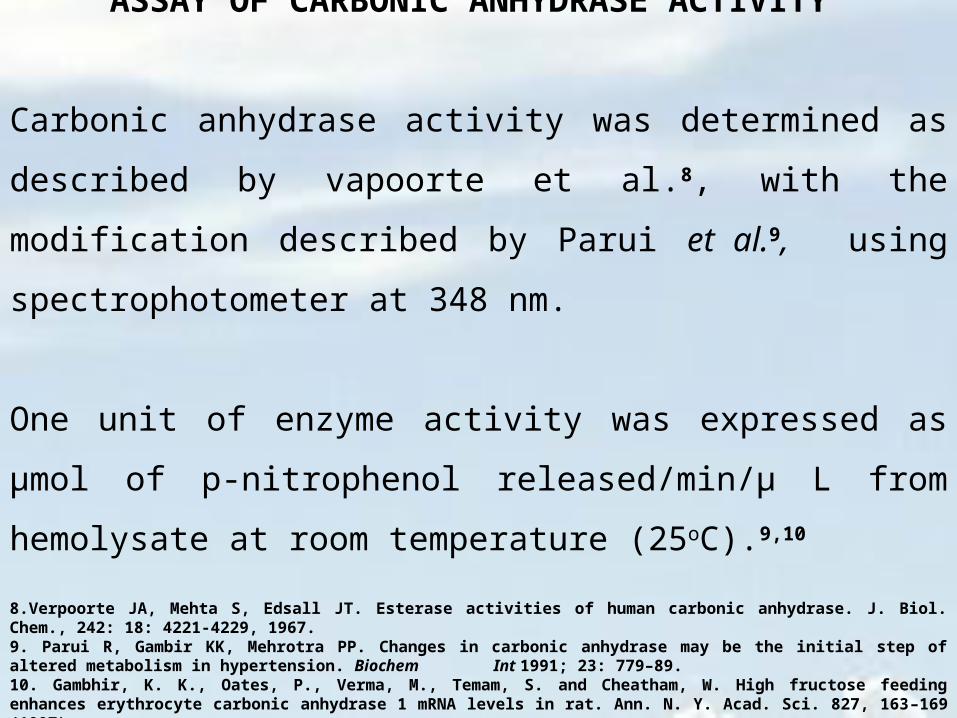
ASSAY OF CARBONIC ANHYDRASE ACTIVITY
Carbonic anhydrase activity was determined as described by vapoorte
et al.8, with the modification described by Parui et al.9, using
spectrophotometer at 348 nm.
One unit of enzyme activity was expressed as μmol of p-nitrophenol
released/min/μ L from hemolysate at room temperature (25oC).9,10
8.Verpoorte JA, Mehta S, Edsall JT. Esterase activities of human carbonic anhydrase. J. Biol. Chem., 242: 18: 4221-4229, 1967.9. Parui R, Gambir KK, Mehrotra PP. Changes in carbonic anhydrase may be the initial step of altered metabolism in hypertension. Biochem Int 1991; 23: 779–89.10. Gambhir, K. K., Oates, P., Verma, M., Temam, S. and Cheatham, W. High fructose feeding enhances erythrocyte carbonic anhydrase 1 mRNA levels in rat. Ann. N. Y. Acad. Sci. 827, 163–169 (1997).
STATISTICAL ANALYSIS
Results were presented as mean ± standard Deviation (SD). Within
and between groups, comparisons were performed by the analysis of
variance (ANOVA) (using SPSS 20.0 for windows Computer
Software Package). Significant differences were compared by
Duncan‟s new Multiple Range test; a probability level of less than 5%
(P< 0.05) was considered significant.10
10. Duncan, D.B. (1955). Multiple range and multiple F-test. Biometrics, 11, 1–42.
CHANGES IN ERYTHROCYTE CARBONIC
ANHYDRASE ACTIVITY IN UNTREATED
DIABETIC RATS
Normal Control Normal Control Fasting Diabetic Control 0
2
4
6
8
10
12
14
*
Normal Random Normal Fasting Diabetic Fasting
Carb
onic
anh
ydra
se a
ctivi
ty
(μm
ol/m
in/
μL)
Normal Control Normal Control Fasting Diabetic Control 0
1
2
3
4
5
6
7
8
9
10 *
Normal Random Normal Fasting Diabetic Fasting
Lact
ate
conc
entr
ation
(mM
ol/L
)
Glu
cose
con
cent
ratio
n (m
Mol
/L)
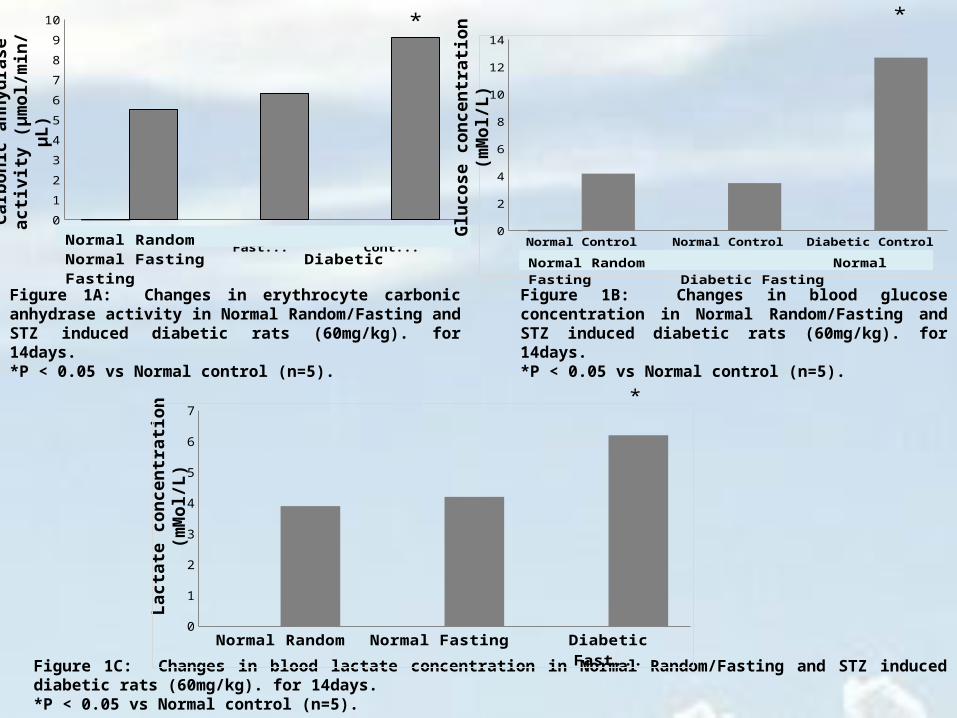
Figure 1A: Changes in erythrocyte carbonic anhydrase activity in Normal Random/Fasting and STZ induced diabetic rats (60mg/kg). for 14days.*P < 0.05 vs Normal control (n=5).
Figure 1B: Changes in blood glucose concentration in Normal Random/Fasting and STZ induced diabetic rats (60mg/kg). for 14days.*P < 0.05 vs Normal control (n=5).
Figure 1C: Changes in blood lactate concentration in Normal Random/Fasting and STZ induced diabetic rats (60mg/kg). for 14days.*P < 0.05 vs Normal control (n=5).
Normal Random Normal Fasting Diabetic Fasting 0
1
2
3
4
5
6
7*

Normal Control Normal Control Fasting Diabetic Control 0
0.5
1
1.5
2
2.5
3
3.5
4
4.5
5
*
Normal Control Normal Control Fasting Diabetic Control 0
0.5
1
1.5
2
2.5
3 *
Normal Random Normal Fasting Diabetic Fasting
Normal Random Normal Fasting Diabetic Fasting
Chol
este
rol c
once
ntra
tion
(mM
ol/L
)
Trig
lyce
ride
conc
entr
ation
(m
Mol
/L)
Figure 1D: Changes in blood Cholesterol concentration in Normal Random/Fasting and STZ induced diabetic rats (60mg/kg). for 14days.*P < 0.05 vs Normal control (n=5).
Figure 1E: Changes in blood Triglyceride concentration in Normal Random/Fasting and STZ induced diabetic rats (60mg/kg). for 14days.*P < 0.05 vs Normal control (n=5).
28 DAYS CHANGES IN ERYTHROCYTE
CARBONIC ANHYDRASE ACTIVITY IN
DIABETIC RATS TREATED WITH
ACETAZOLAMIDE
Normal
Control
Diabeti
c Contro
l
Diabeti
c + Acet
azolam
ide 0123456
*"
*
Normal Control Diabetic Control Diabetic + Acetazolamide 0
2
4
6
8
10
12
14
16
18 *
"
Normal Control Diabetic Control Diabetic + Acetazolamide 0
2
4
6
8
10
12
14
16
*
*"
Carb
onic
anh
ydra
se a
ctivi
ty
(μm
ol/m
in/
μL)
Glu
cose
con
cent
ratio
n (m
Mol
/L)
Lact
ate
conc
entr
ation
(mM
ol/L
)
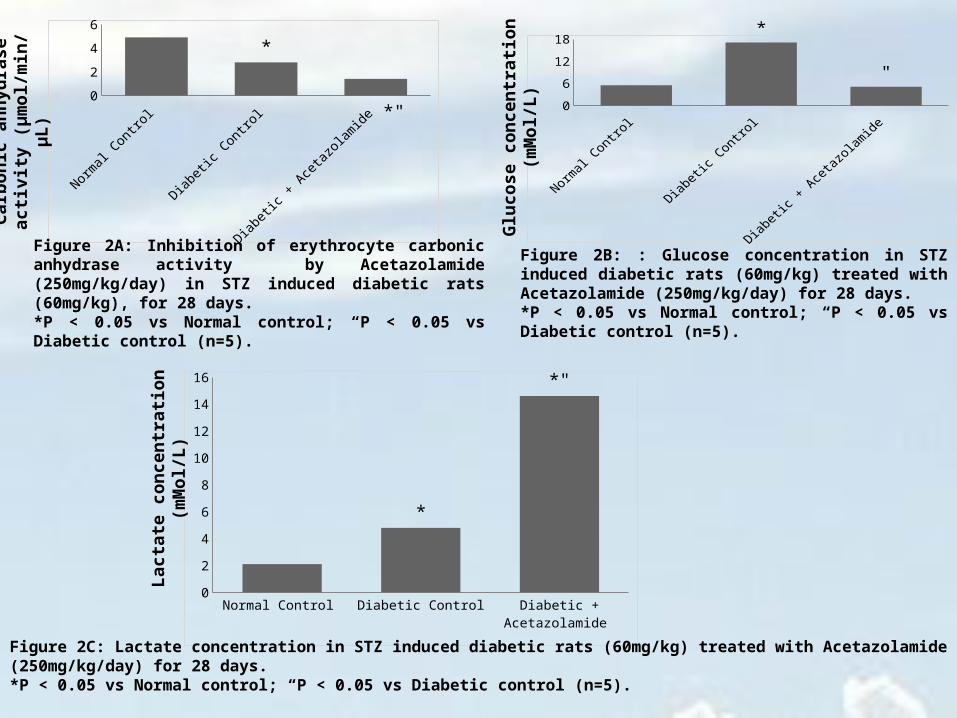
Figure 2A: Inhibition of erythrocyte carbonic anhydrase activity by Acetazolamide (250mg/kg/day) in STZ induced diabetic rats (60mg/kg), for 28 days. *P < 0.05 vs Normal control; “P < 0.05 vs Diabetic control (n=5).
Figure 2B: : Glucose concentration in STZ induced diabetic rats (60mg/kg) treated with Acetazolamide (250mg/kg/day) for 28 days. *P < 0.05 vs Normal control; “P < 0.05 vs Diabetic control (n=5).
Figure 2C: Lactate concentration in STZ induced diabetic rats (60mg/kg) treated with Acetazolamide (250mg/kg/day) for 28 days. *P < 0.05 vs Normal control; “P < 0.05 vs Diabetic control (n=5).

Normal Control Diabetic Control Diabetic + Acetazolamide 0
0.5
1
1.5
2
2.5
3
3.5
4
4.5
5
*
Normal Control Diabetic Control Diabetic + Acetazolamide 0
0.5
1
1.5
2
2.5
3
3.5
4
4.5 *
Chol
este
rol c
once
ntra
tion
(mM
ol/L
)
Trig
lyce
ride
conc
entr
ation
(m
Mol
/L)
Figure 2D: Cholesterol concentration in STZ induced diabetic rats (60mg/kg) treated with Acetazolamide (250mg/kg/day) for 28 days. *P < 0.05 vs Normal control (n=5).
Figure 2E: Triglyceride concentration in STZ induced diabetic rats (60mg/kg) treated with Acetazolamide (250mg/kg/day) for 28 days. *P < 0.05 vs Normal control (n=5).
28 DAYS CHANGES IN ERYTHROCYTE
CARBONIC ANHYDRASE ACTIVITY IN
DIABETIC RATS TREATED WITH
ACETAZOLAMIDE, METFORMIN AND
METHANOL LEAF EXTRACT OF CADABA
FARINOSA
Normal
Control
Diabeti
c Contro
l
Diabeti
c + Acet
azolam
ide
Diabeti
c + M
etform
in
Diabeti
c + M
eth. E
xtrc
0
0.4
0.8
1.2
1.6
2
* *" *"
Normal
Control
Diabeti
c Contro
l
Diabeti
c + Acet
azolam
ide
Diabeti
c + M
etform
in
Diabeti
c + M
eth. E
xtrc
0
5
10
15
20
25
*
*
0
5
10
15
20
25 *
* **
02468
101214
*
*
Carb
onic
anh
ydra
se a
ctivi
ty
(μm
ol/m
in/
μL)
HbA
1C c
once
ntra
tion
(mM
ol/L
)
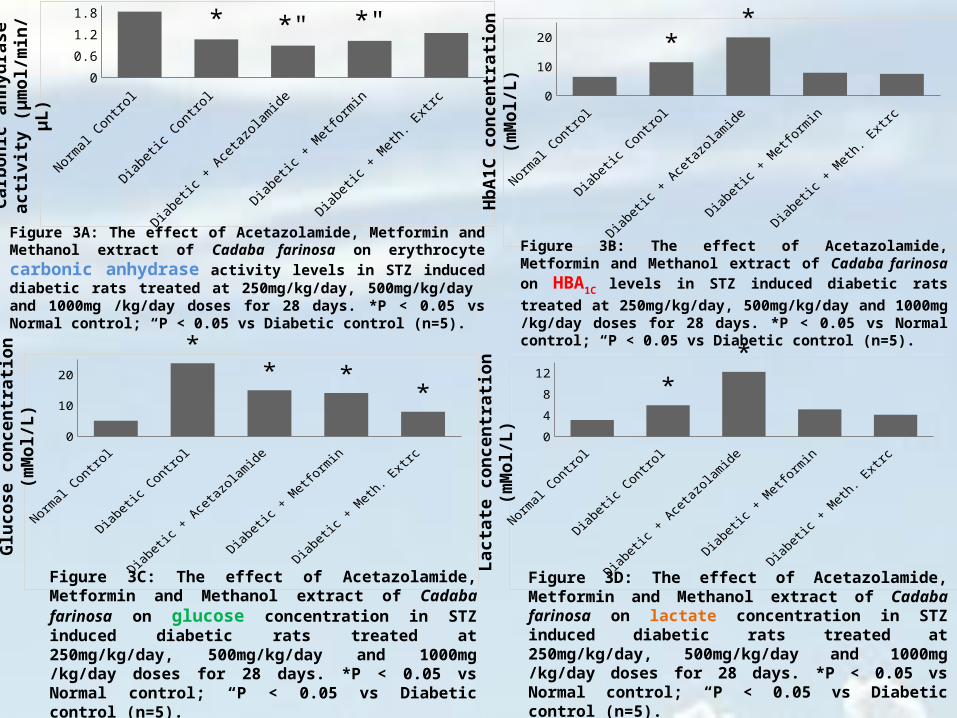
Figure 3A: The effect of Acetazolamide, Metformin and Methanol extract of Cadaba farinosa on erythrocyte carbonic anhydrase activity levels in STZ induced diabetic rats treated at 250mg/kg/day, 500mg/kg/day and 1000mg /kg/day doses for 28 days. *P < 0.05 vs Normal control; “P < 0.05 vs Diabetic control (n=5).
Figure 3B: The effect of Acetazolamide, Metformin and Methanol extract of Cadaba farinosa on HBA1C levels in STZ induced
diabetic rats treated at 250mg/kg/day, 500mg/kg/day and 1000mg /kg/day doses for 28 days. *P < 0.05 vs Normal control; “P < 0.05 vs Diabetic control (n=5).
Glu
cose
con
cent
ratio
n (m
Mol
/L)
Lact
ate
conc
entr
ation
(mM
ol/L
)
Figure 3C: The effect of Acetazolamide, Metformin and Methanol extract of Cadaba farinosa on glucose concentration in STZ induced diabetic rats treated at 250mg/kg/day, 500mg/kg/day and 1000mg /kg/day doses for 28 days. *P < 0.05 vs Normal control; “P < 0.05 vs Diabetic control (n=5).
Figure 3D: The effect of Acetazolamide, Metformin and Methanol extract of Cadaba farinosa on lactate concentration in STZ induced diabetic rats treated at 250mg/kg/day, 500mg/kg/day and 1000mg /kg/day doses for 28 days. *P < 0.05 vs Normal control; “P < 0.05 vs Diabetic control (n=5).

Normal
Control
Diabeti
c Contro
l
Diabeti
c + Acet
azolam
ide
Diabeti
c + M
etform
in
Diabeti
c + M
eth. E
xtrc
00.5
11.5
22.5
33.5
44.5
5
*
*
00.5
11.5
22.5
33.5
44.5 *
Chol
este
rol c
once
ntra
tion
(mM
ol/L
)
Trig
lyce
ride
conc
entr
ation
(m
Mol
/L)
Figure 3D: The effect of Acetazolamide, Metformin and Methanol extract of Cadaba farinosa on Cholesterol concentration in STZ induced diabetic rats treated at 250mg/kg/day, 500mg/kg/day and 1000mg /kg/day doses for 28 days. *P < 0.05 vs Normal control; “P < 0.05 vs Diabetic control (n=5).
Figure 3D: The effect of Acetazolamide, Metformin and Methanol extract of Cadaba farinosa on Triglyceride concentration in STZ induced diabetic rats treated at 250mg/kg/day, 500mg/kg/day and 1000mg /kg/day doses for 28 days. *P < 0.05 vs Normal control; “P < 0.05 vs Diabetic control (n=5).
INVITRO INHIBITORY STUDY OF CRUDE
EXTRACT OF CADABA FARINOSA ON
CARBONIC ANHYDRASE ACTIVITY

Enzyme Acetazolamide Metformin Meth.Extract Eth. Ac. Extract n-Hex. Extract 0
2
4
6
8
10
12
Enzyme Acetazolamide Metformin Meth.Extract Eth. Ac. Extract n-Hex. Extract
-20
0
20
40
60
80
100
0
89.6
68.2
-9
65.972.4
Carb
onic
anh
ydra
se a
ctivi
ty
(μm
ol/m
in/
μL)
% IN
HIB
ITIO
N
Figure 4A: In-Vitro inhibitory effect of Acetazolamide, Metformin and Crude extract of Cadaba farinosa on Bovine erythrocyte carbonic anhydrase activity treated at 15μg/10μg enzyme concentration each.
Figure 4B: Percentage inhibition

INVITRO INHIBITORY STUDY OF PURIFIED
FRACTIONS OF METHANOL LEAF EXTRACT
OF CADABA FARINOSA ON CARBONIC
ANHYDRASE ACTIVITY

Enzyme Acetazolamide Fraction A Fraction B Fraction C Fraction D Fraction E 0
5
10
15
20
25
30
35
40
45
39
16.8
21.8
3336 35
41.2
Enzyme Acetazolamide Fraction A Fraction B Fraction C Fraction D Fraction E
-10
0
10
20
30
40
50
60
70
0
56.9
44.1
13.2
5.37.9
-5.4
Carb
onic
anh
ydra
se a
ctivi
ty
(μm
ol/m
in/
μL)
% IN
HIB
ITIO
NFigure 5A: In-Vitro inhibitory effect of Acetazolamide, Metformin and purified fractions of methanol leaf extract of Cadaba farinosa on Bovine erythrocyte carbonic anhydrase activity treated at 15μg/10μg enzyme concentration each.
Figure 5B: Percentage Inhibition

EXTRACT WEIGHT OBTAINED (g)
%YIELD
Methanol 23.18/800g 2.9
Ethyl Acetate 15.2/800g 1.9
n-Hexane 100.6/800g 12.6
Weight of Different Crude Extract of Cadaba farinosa obtained from soxhlet extraction

Proposed Mechanism of lactate-induced cell acidification (LIA) by Carbonic Anhydrase Inhibition in
Diabetes Mellitus

MUSCLE
LIVER
RBCG
luco
se
Glu
cose
Lactate
Lactate
MCT
H+
PROPOSED MECHANISM OF “Lactate Induced Acidemia” CYCLE IN DIABETES
CA
MCT
CA
H+
H+H+
H+H+
H+H+
H+H+
H+ H+H+
H+
H+
H+
H+H+
H+
H+
H+
H+
H+
H+H+
H+ H+
H+
H+
H+
H+ H+H+
H+
MCT CA

fErythrocyte/MuscleLiver
BLOOD
Proposed Mechanism of Carbonic Anhydrase Inhibition Induced Lactic Acidosis (CAIILA) in Diabetes Mellitus
CO2
CO2
CO2 + H2O HCO3- + H+
CO2
CO2
CO2CO2 + H2O HCO3
- + H+
CAX
X
H+ H+ H+ H+ H+H+
H+ H+ H+ H+
H+ H+ H+
H+ H+ H+ H+
H+ H+ H+ H+ H+ H+
H+ H+ H+ H+ H+ H+ H+ H+ H+
H+ H+ H+
H+ H+ H+
H+ H+ H+ H+ H+
H+ H+ H+
H+ H+ H+ H+ H+ H+
H+ H+ H+
H+ H+ H+ H+ H+
H+ H+
H+
H+ H+ H+ H H+
CO2
CO2CO2
CO2
CO2
CO2
CO2
CO2
CO2
CO2
CO2
CO2
CA
XCO2
CO2CO2
CO2
CO2
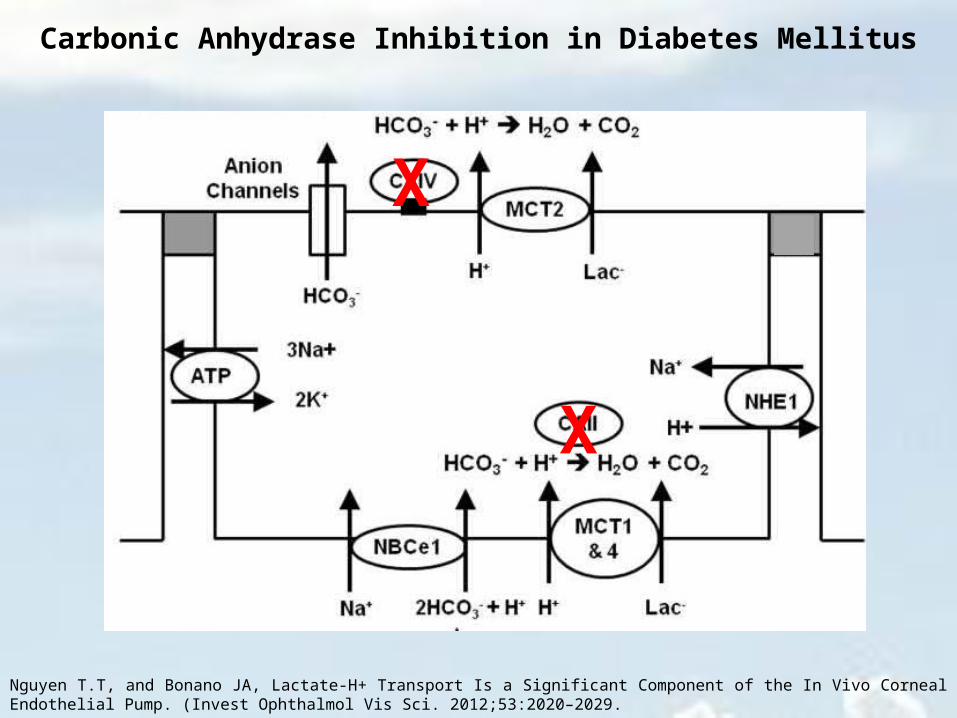
Nguyen T.T, and Bonano JA, Lactate-H+ Transport Is a Significant Component of the In Vivo Corneal Endothelial Pump. (Invest Ophthalmol Vis Sci. 2012;53:2020–2029.
X
X
Carbonic Anhydrase Inhibition in Diabetes Mellitus
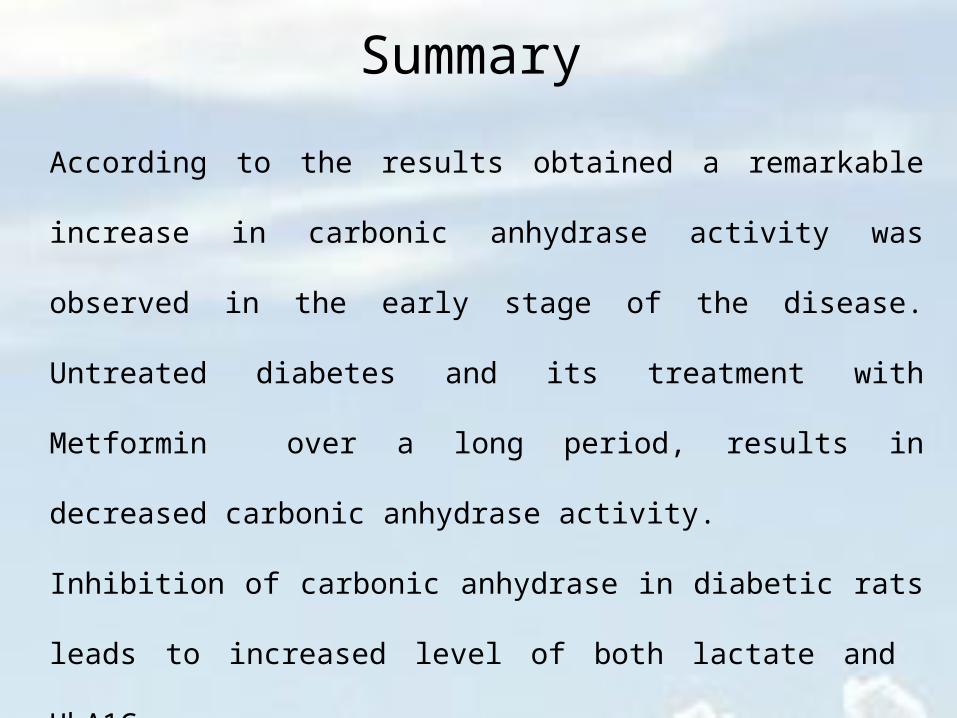
Summary
According to the results obtained a remarkable increase in carbonic
anhydrase activity was observed in the early stage of the disease.
Untreated diabetes and its treatment with Metformin over a long period,
results in decreased carbonic anhydrase activity.
Inhibition of carbonic anhydrase in diabetic rats leads to increased level of
both lactate and HbA1C.

ConclusionCarbonic anhydrase inhibition may be the key factor enhancing HbA1c formation,
which may be associated with increased lactic acid level. Disrupting the carbonic
anhydrase buffering system in vivo may lead to lactate induced acidosis.
These data may provide a new evidence that uncontrolled diabetes for a long
period of time and pharmacological agents that can inhibit carbonic anhydrase,
may prove harmful in protecting diabetic patients, from developing vascular
complications.

THANK YOU FOR
LISTENING!!!