
Carbon sequestration by forests - Governo do Estado de ... · Estimate carbon stocks through ......
34
Curitiba, Brazil August 25, 2004 Carbon sequestration by forests Sandra Brown Winrock International [email protected]
Transcript of Carbon sequestration by forests - Governo do Estado de ... · Estimate carbon stocks through ......
Curitiba, BrazilAugust 25, 2004
Carbon sequestration by forests
Sandra BrownWinrock [email protected]
2©Winrock International
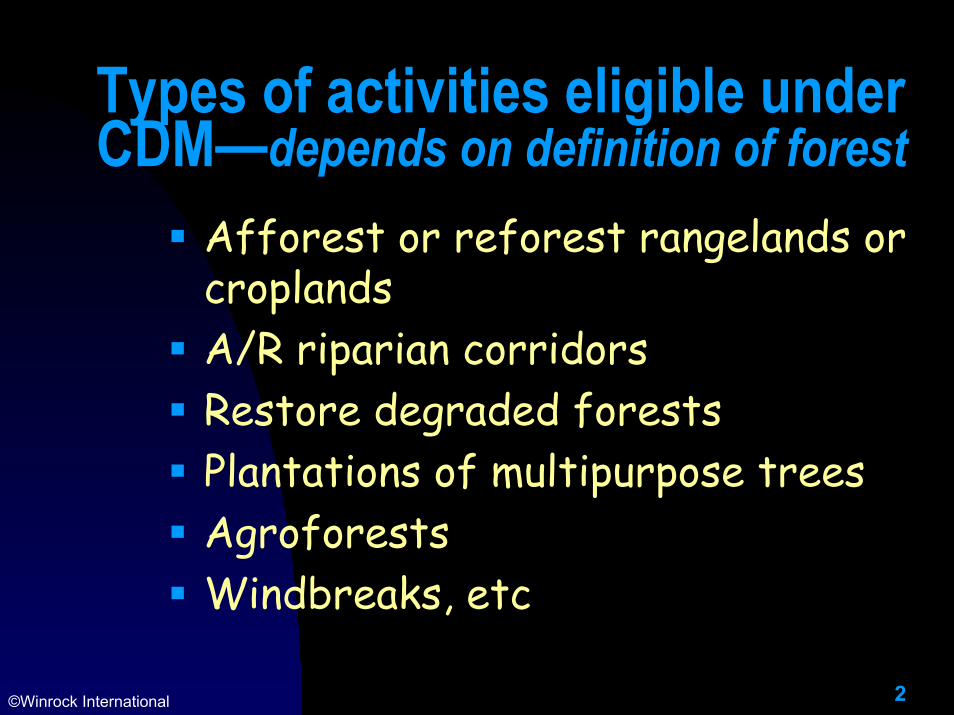
Types of activities eligible under CDM—depends on definition of forest
Afforest or reforest rangelands or croplandsA/R riparian corridorsRestore degraded forestsPlantations of multipurpose trees AgroforestsWindbreaks, etc
3©Winrock International
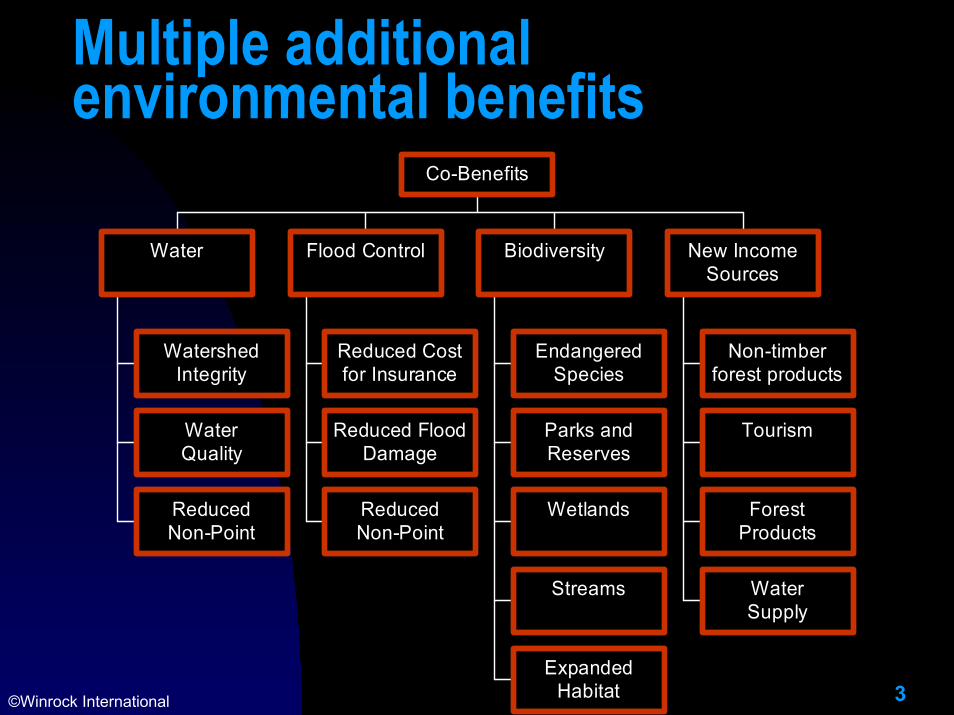
Multiple additional environmental benefits
WatershedIntegrity
WaterQuality
ReducedNon-Point
Water
Reduced Costfor Insurance
Reduced FloodDamage
ReducedNon-Point
Flood Control
EndangeredSpecies
Parks andReserves
Wetlands
Streams
ExpandedHabitat
Biodiversity
Non-timberforest products
Tourism
ForestProducts
WaterSupply
New IncomeSources
Co-Benefits
Chapter 4: Supplementary methods and good practice guidance arising
from the Kyoto ProtocolSection 4.3 LULUCF Projects
CLA: Sandra Brown (USA), Omar Masera (Mexico)
LA: Vitus Ambia (Papua New Guinea), Barbara Braatz (USA), Markku Kanninen (Finland), Thelma Krug (Brazil), Daniel Martino (Uruguay), Richard Tipper (UK), Phanuel Oballa (Kenya), Jenny Wong (Malaysia)
CA: Ben de Jong (Mexico), David Shoch (USA)
RE: Soobaraj N Sok Appadu (Mauritius)
5©Winrock International
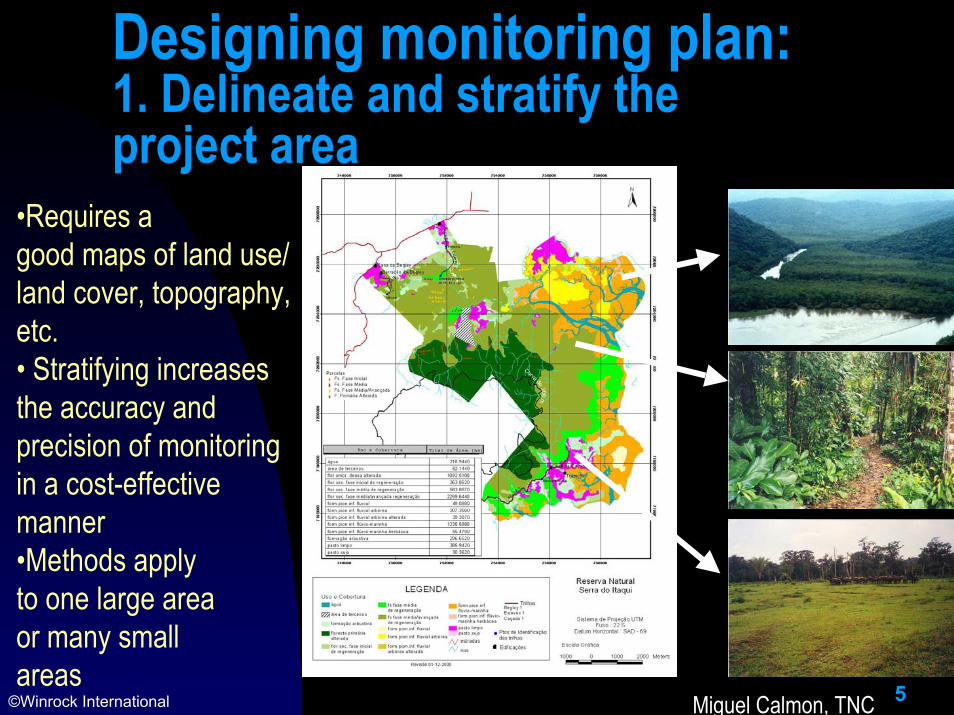
Designing monitoring plan: 1. Delineate and stratify the project area
•Requires agood maps of land use/land cover, topography, etc. • Stratifying increases the accuracy and precision of monitoring in a cost-effective manner •Methods applyto one large areaor many smallareas
Miguel Calmon, TNC
6©Winrock International
Decide which carbon pools to measure and monitor
Carbon pools: aboveground biomass, belowground biomass, litter, dead wood, and soil organic carbonCan choose not to monitor all of them if evidence provided that they are not a source of GHG• E.g. soil can be more expensive to measure and
changes are often small and in an afforestation activity on degraded lands soil is unlikely to be a source of GHGs
7©Winrock International
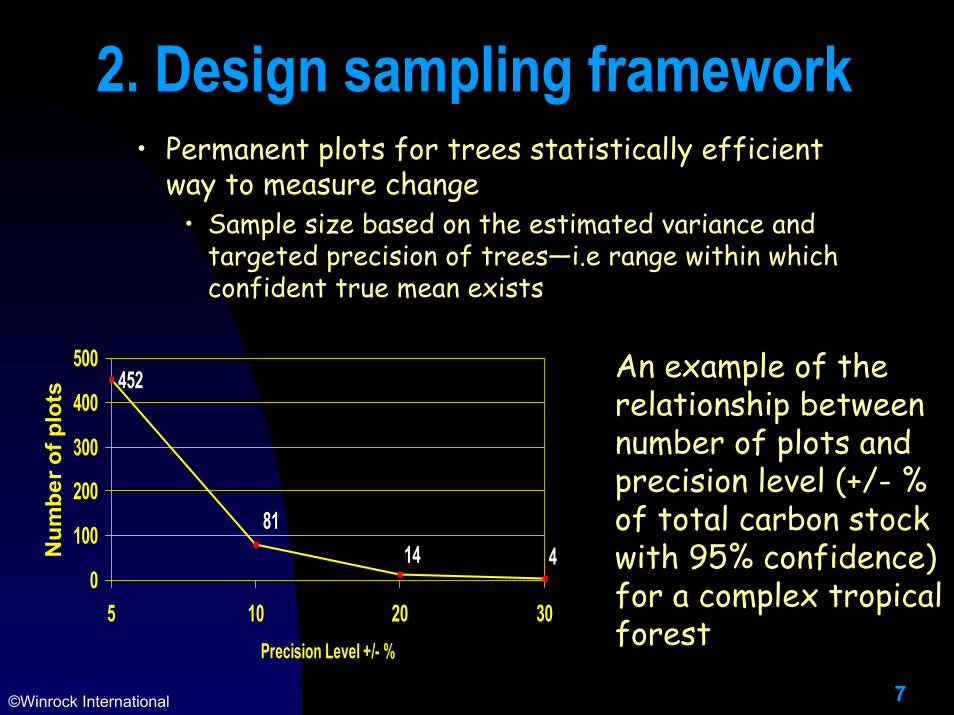
2. Design sampling framework• Permanent plots for trees statistically efficient
way to measure change• Sample size based on the estimated variance and
targeted precision of trees—i.e range within which confident true mean exists
452
8114 4
0
100
200
300
400
500
5 10 20 30Precision Level +/- %
Num
ber o
f plo
ts
An example of the relationship between number of plots and precision level (+/- % of total carbon stock with 95% confidence) for a complex tropical forest
8©Winrock International
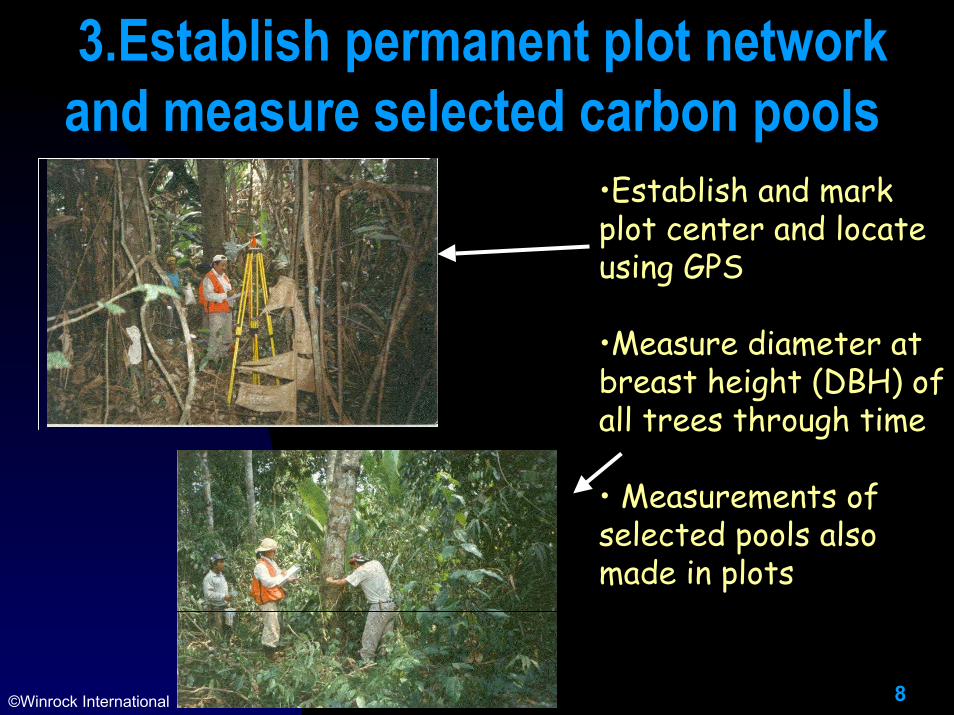
3.Establish permanent plot network and measure selected carbon pools
•Establish and mark plot center and locate using GPS
•Measure diameter at breast height (DBH) of all trees through time
• Measurements of selected pools also made in plots
9©Winrock International
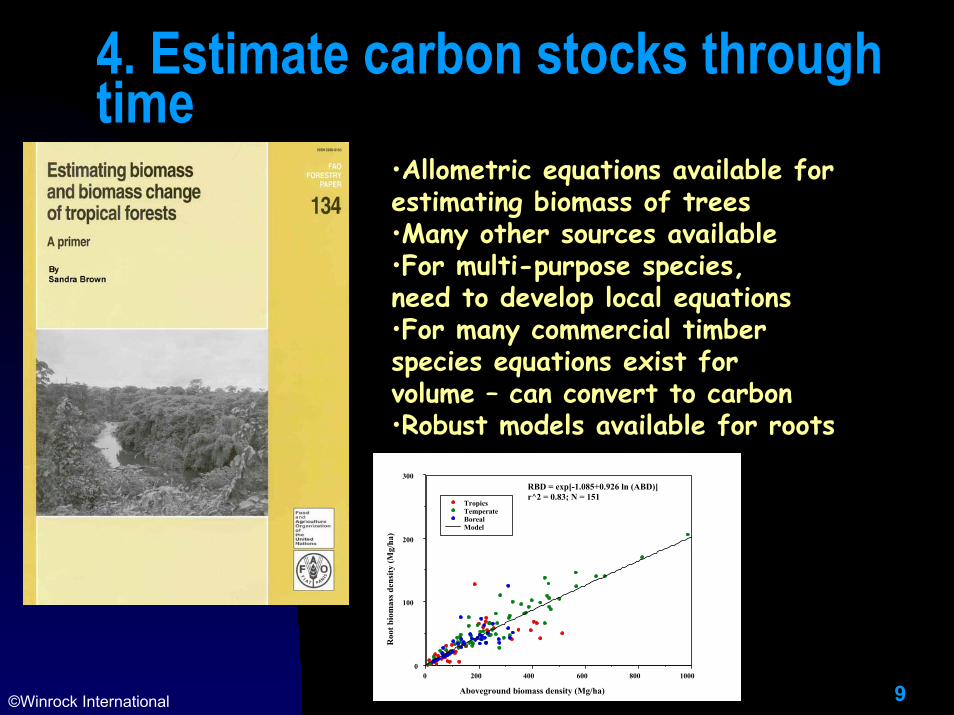
4. Estimate carbon stocks through time
•Allometric equations available for estimating biomass of trees•Many other sources available•For multi-purpose species,need to develop local equations•For many commercial timberspecies equations exist for volume – can convert to carbon•Robust models available for roots
100080060040020000
100
200
300
TropicsTemperateBorealModel
Aboveground biomass density (Mg/ha)
Roo
t bio
mas
s den
sity
(Mg/
ha)
RBD = exp[-1.085+0.926 ln (ABD)]r^2 = 0.83; N = 151
10©Winrock International
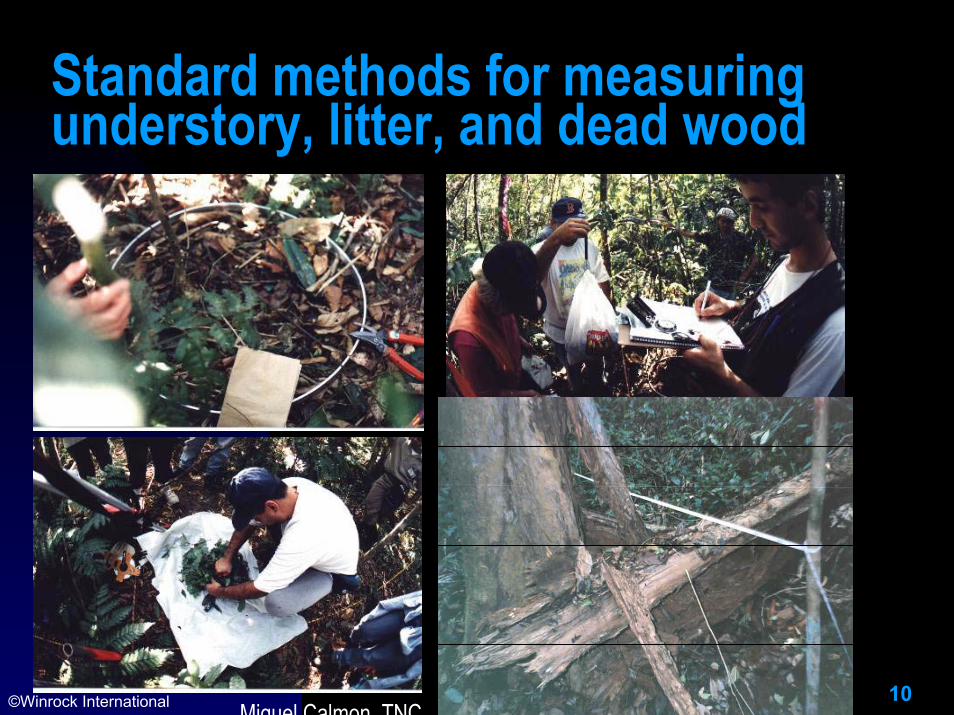
Standard methods for measuring understory, litter, and dead wood
Photo by Matt Delaney
Miguel Calmon TNC
11©Winrock International
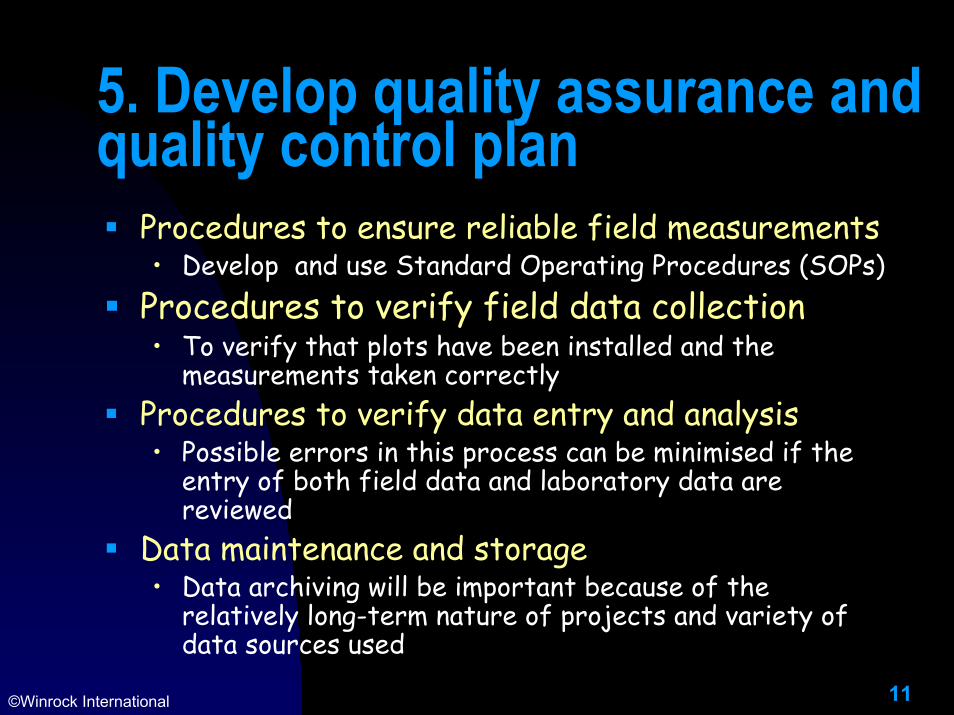
5. Develop quality assurance and quality control plan
Procedures to ensure reliable field measurements• Develop and use Standard Operating Procedures (SOPs)
Procedures to verify field data collection• To verify that plots have been installed and the
measurements taken correctlyProcedures to verify data entry and analysis• Possible errors in this process can be minimised if the
entry of both field data and laboratory data are reviewed
Data maintenance and storage• Data archiving will be important because of the
relatively long-term nature of projects and variety of data sources used
Example of carbon monitoring
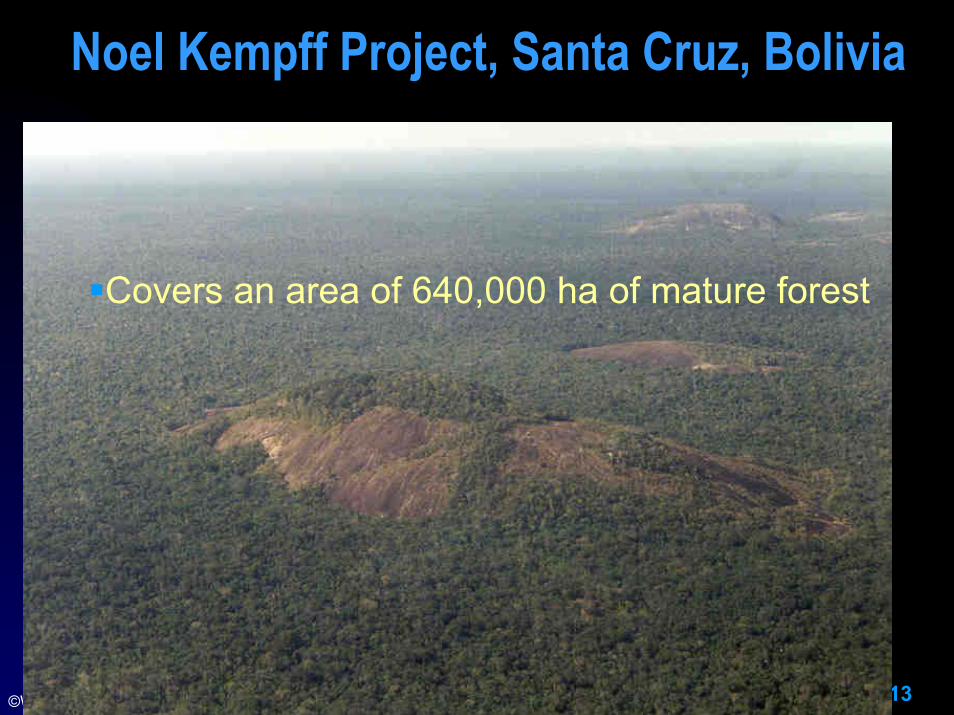
Noel Kempff pilot project in Bolivia--a complex tropical forest
13©Winrock International
Noel Kempff Project, Santa Cruz, Bolivia
Covers an area of 640,000 ha of mature forest
14©Winrock International
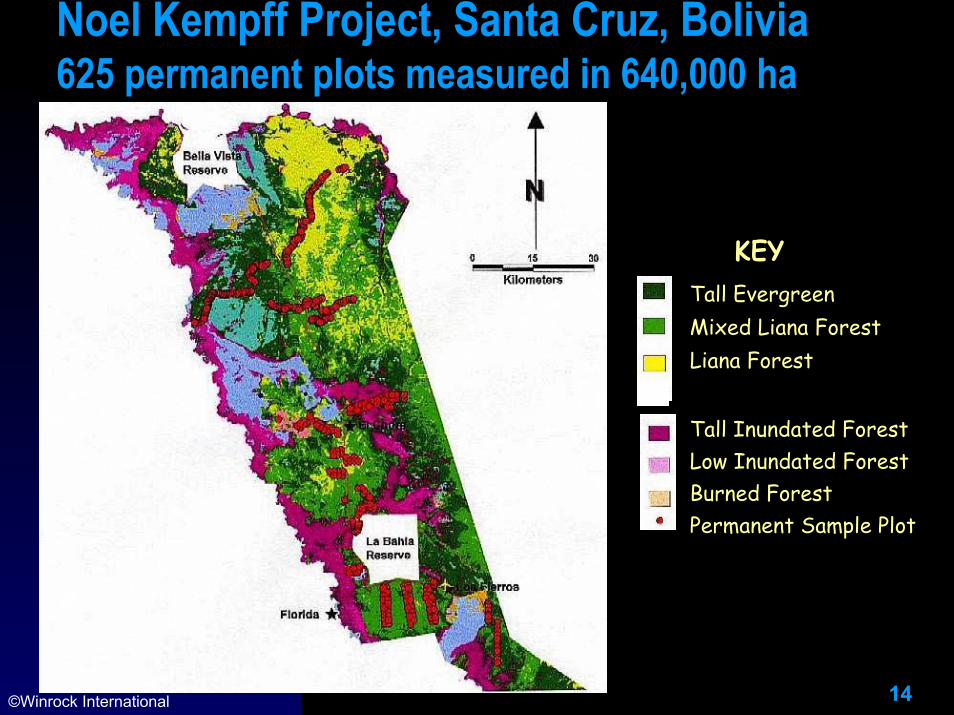
Noel Kempff Project, Santa Cruz, Bolivia625 permanent plots measured in 640,000 ha
KEYTall EvergreenMixed Liana ForestLiana Forest
Tall Inundated ForestLow Inundated ForestBurned ForestPermanent Sample Plot
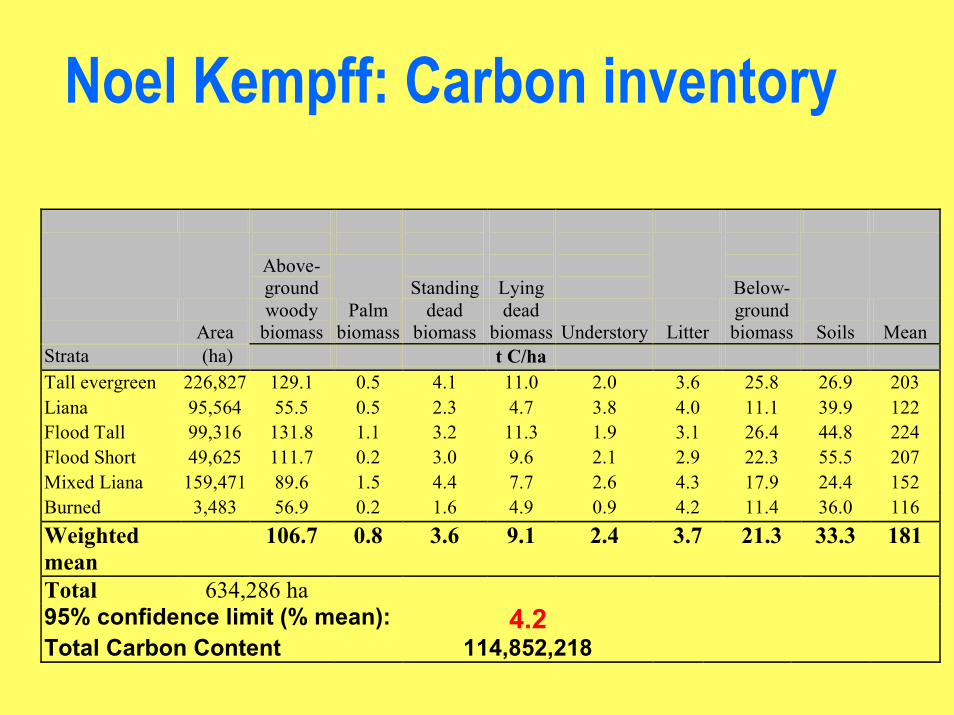
Noel Kempff: Carbon inventory
Above-ground
Standing
Lying
Below-
Area
woody biomass
Palm biomass
dead biomass
dead biomass
Understory
Litter
ground biomass
Soils
Mean
Strata (ha) t C/ha Tall evergreen 226,827 129.1 0.5 4.1 11.0 2.0 3.6 25.8 26.9 203 Liana 95,564 55.5 0.5 2.3 4.7 3.8 4.0 11.1 39.9 122 Flood Tall 99,316 131.8 1.1 3.2 11.3 1.9 3.1 26.4 44.8 224 Flood Short 49,625 111.7 0.2 3.0 9.6 2.1 2.9 22.3 55.5 207 Mixed Liana 159,471 89.6 1.5 4.4 7.7 2.6 4.3 17.9 24.4 152 Burned 3,483 56.9 0.2 1.6 4.9 0.9 4.2 11.4 36.0 116 Weighted mean
106.7 0.8 3.6 9.1 2.4 3.7 21.3 33.3 181
Total 634,286 ha 95% confidence limit (% mean): 4.2
Total Carbon Content 114,852,218
16©Winrock International
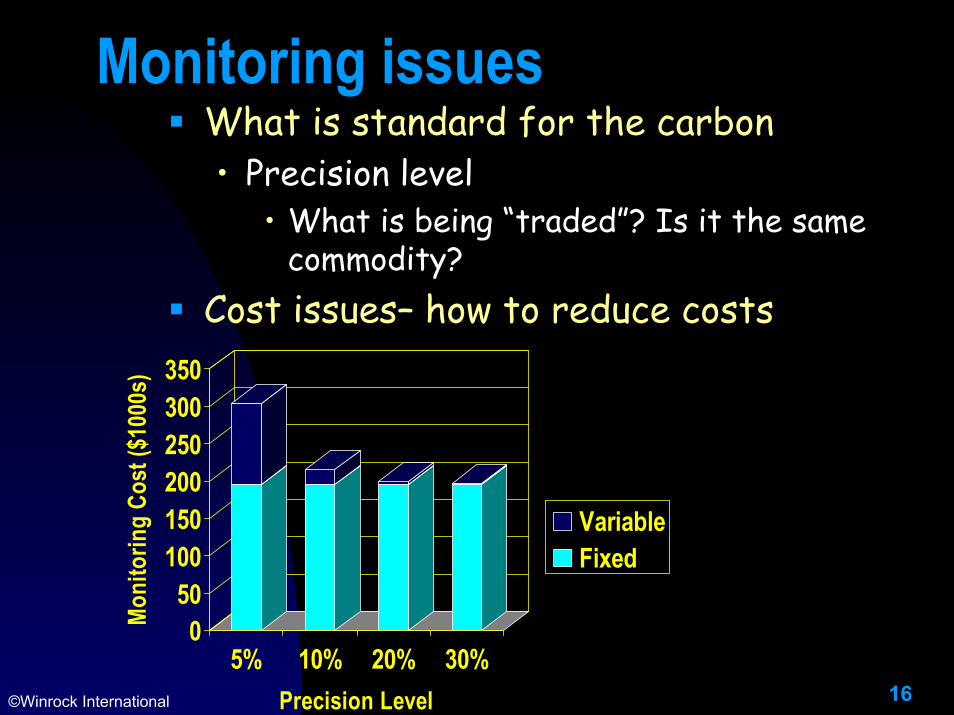
Monitoring issuesWhat is standard for the carbon• Precision level
• What is being “traded”? Is it the same commodity?
Cost issues– how to reduce costs
050
100150200250300350
Moni
torin
g Co
st ($
1000
s)
5% 10% 20% 30%Precision Level
VariableFixed
17©Winrock International
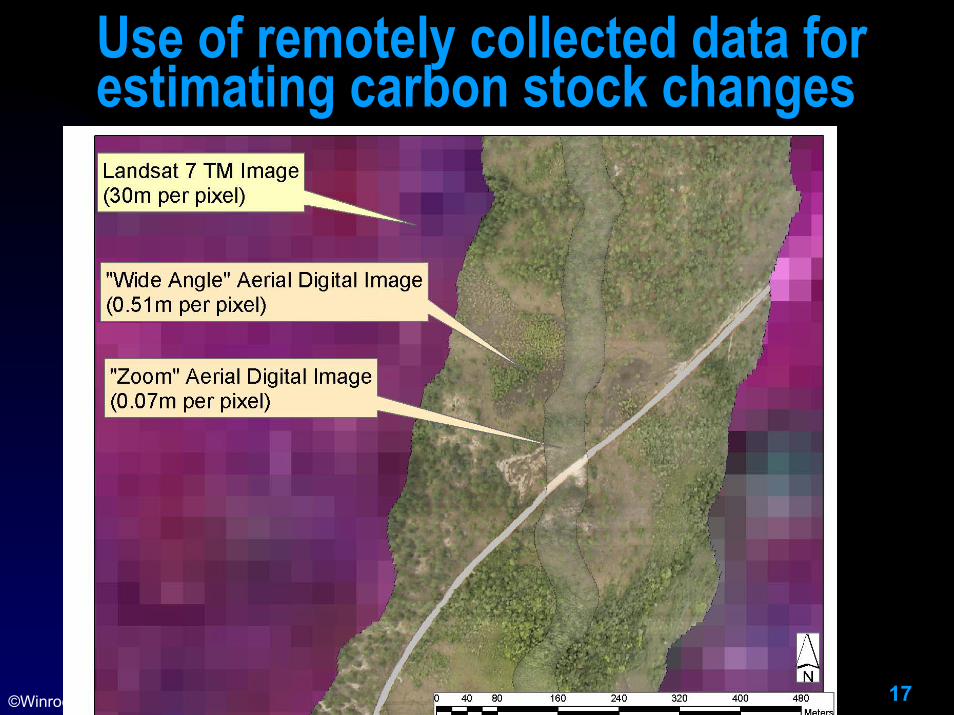
Use of remotely collected data for estimating carbon stock changes
18©Winrock International
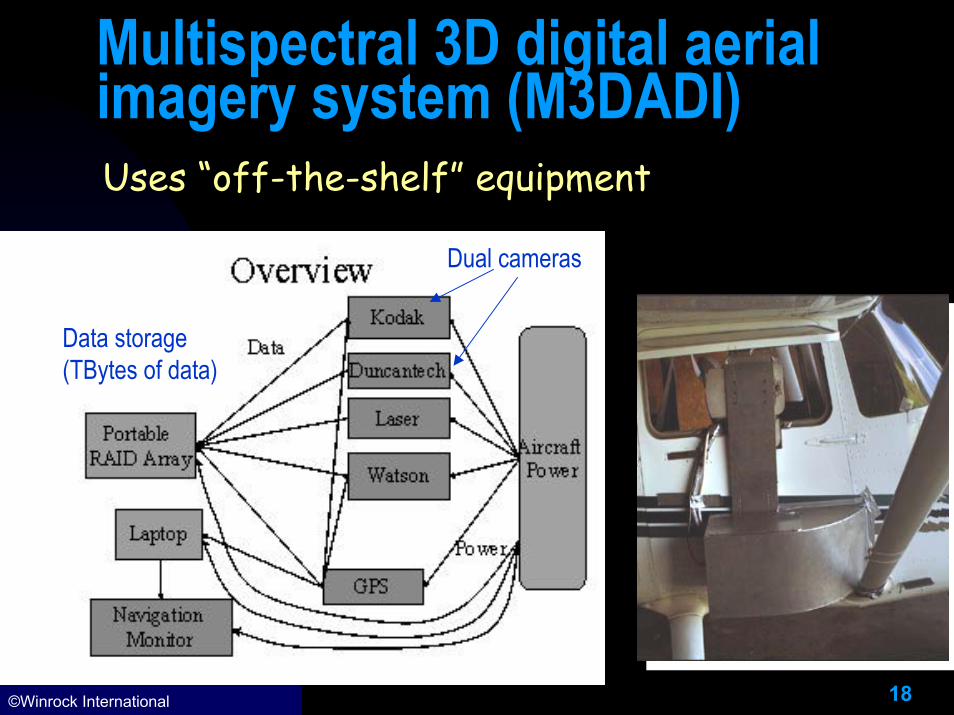
Multispectral 3D digital aerial imagery system (M3DADI)Uses “off-the-shelf” equipment
Data storage(TBytes of data)
Dual cameras
19©Winrock International
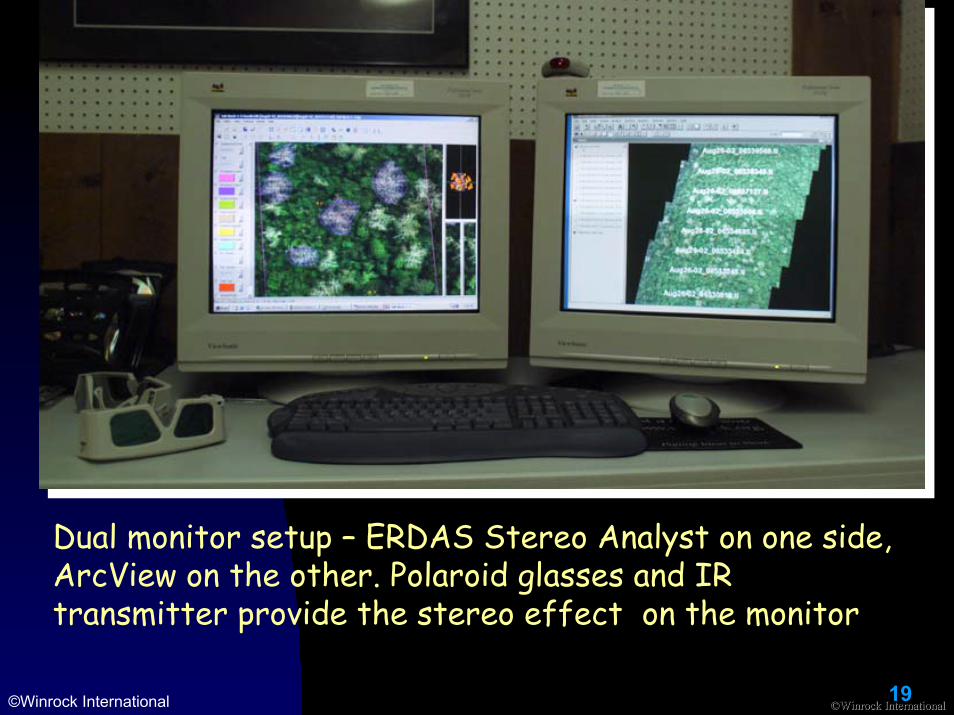
Dual monitor setup – ERDAS Stereo Analyst on one side, ArcView on the other. Polaroid glasses and IR transmitter provide the stereo effect on the monitor
©©Winrock InternationalWinrock International
20©Winrock International
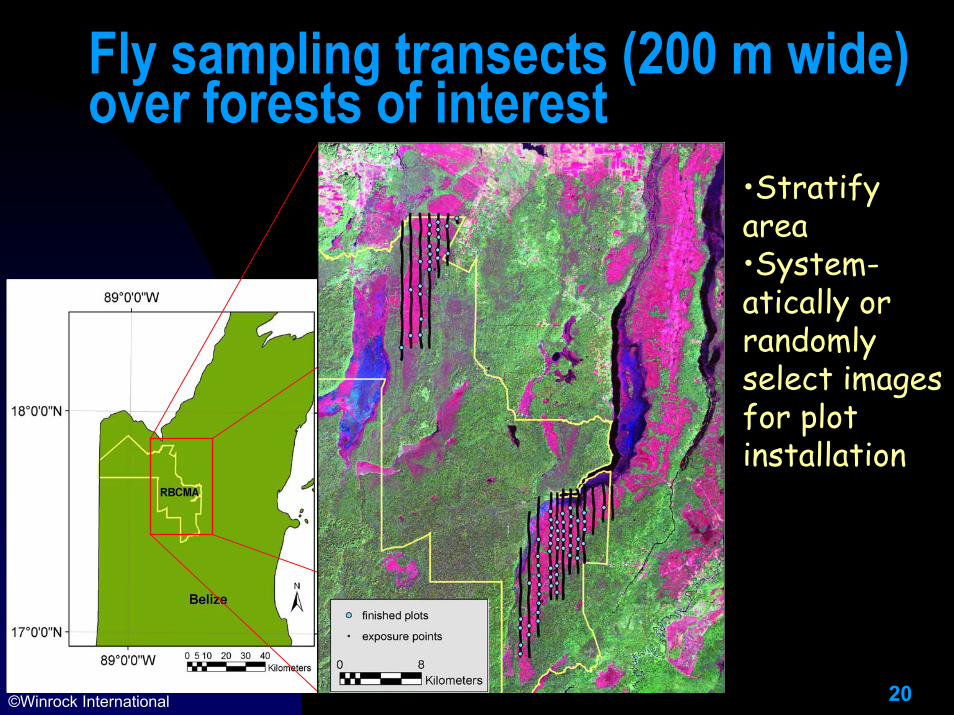
Fly sampling transects (200 m wide) over forests of interest
•Stratify area •System-atically or randomly select images for plot installation
21©Winrock International
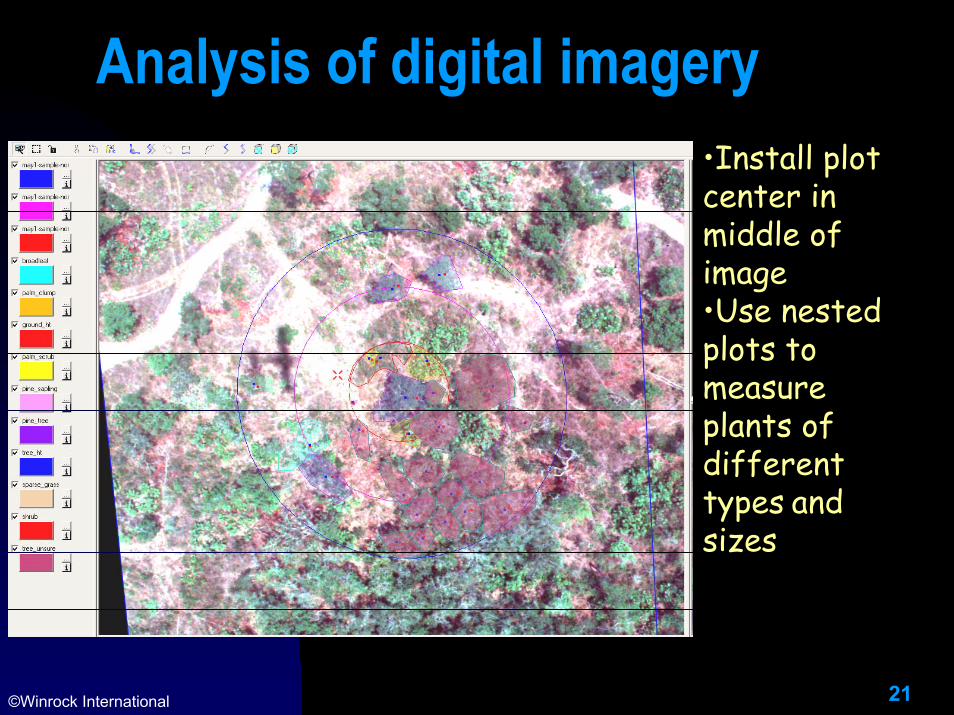
Analysis of digital imagery•Install plot center in middle of image•Use nested plots to measure plants of different types and sizes
22©Winrock International
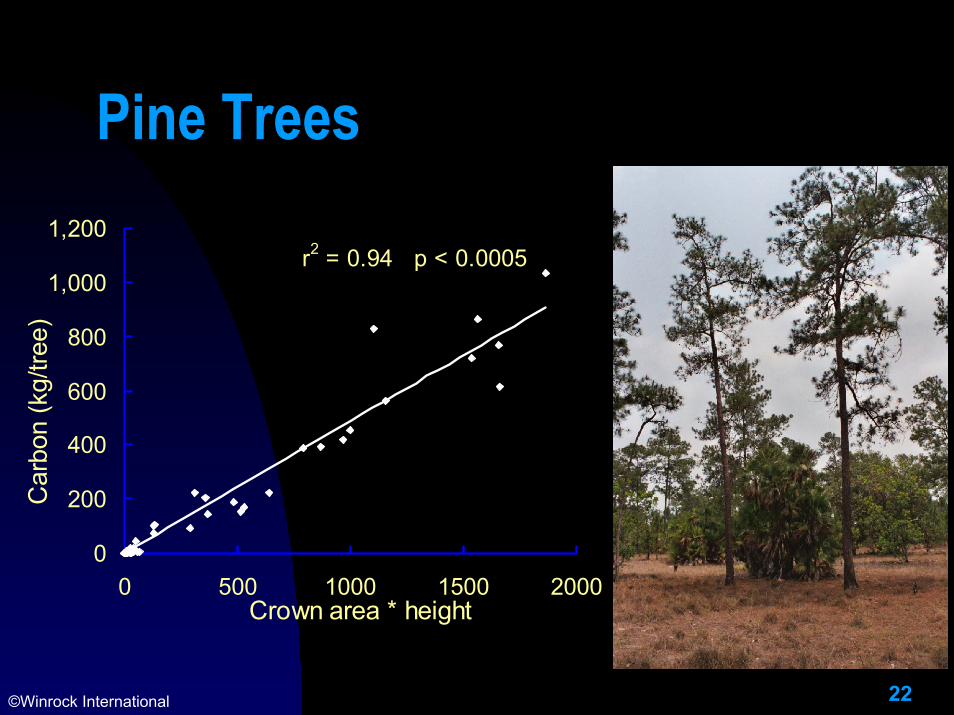
Pine Trees
0
200
400
600
800
1,000
1,200
0 500 1000 1500 2000
Car
bon
(kg/
tree)
Crown area * height
r2 = 0.94 p < 0.0005
23©Winrock International
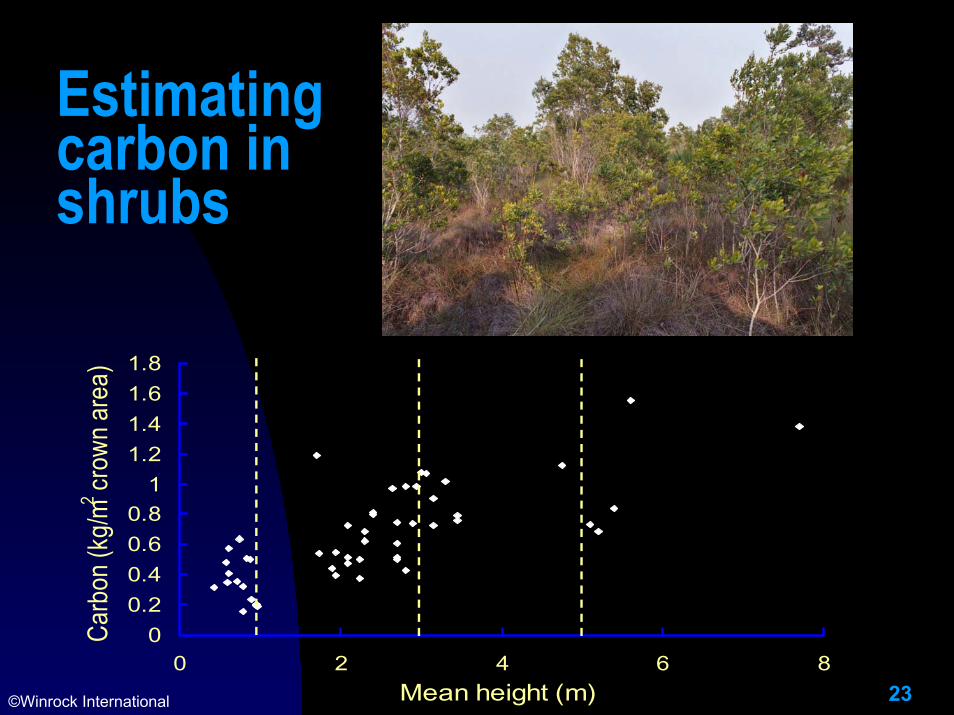
Estimating carbon in shrubs
00.20.40.60.8
11.21.41.61.8
0 2 4 6 8
Carb
on (k
g/m2 cr
own
area
)
Mean height (m)

24©Winrock International
Estimated carbon stocks based on 77 plots
Biomass Mg C ha-1 Trees Palmettos Shrubs Grass Total Mean 6.8 2.8 0.5 3.1 13.1 Standard deviation 8.0 4.5 1.6 1.0 9.5 95 % confidence interval 1.8 1.0 0.4 0.2 2.2 Coefficient of variation (%) 117 163 303 31 72 Maximum 40.9 23.2 12.6 4.5 46.3 Minimum 0.0 0.0 0.0 0.0 2.4
25©Winrock International
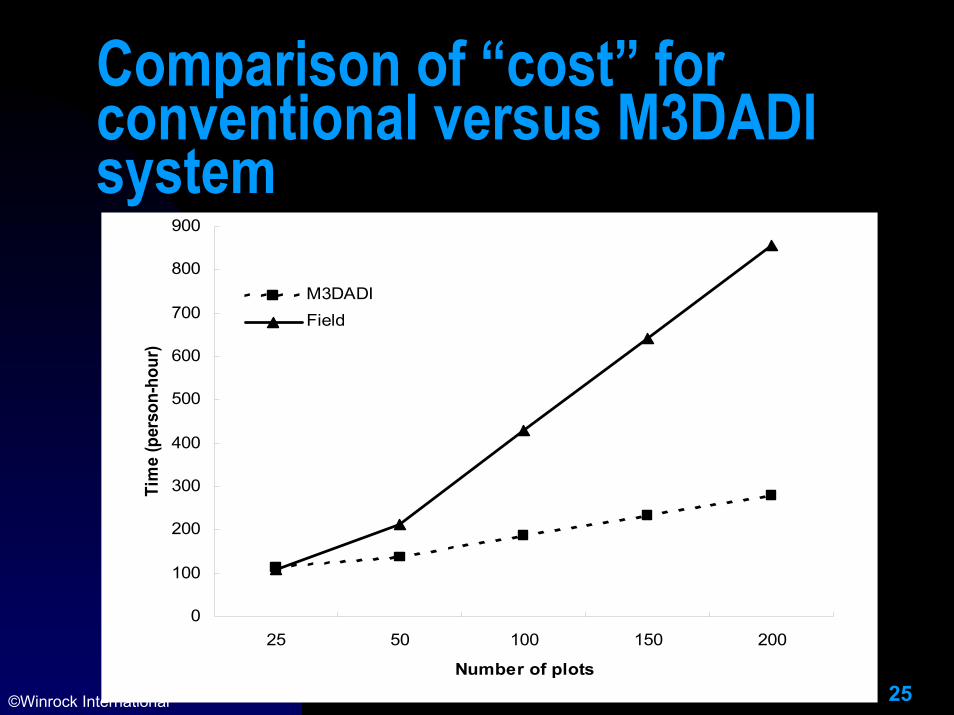
Comparison of “cost” for conventional versus M3DADI system
0
100
200
300
400
500
600
700
800
900
25 50 100 150 200
Number of plots
Tim
e (p
erso
n-ho
ur)
M3DADIField
26©Winrock International
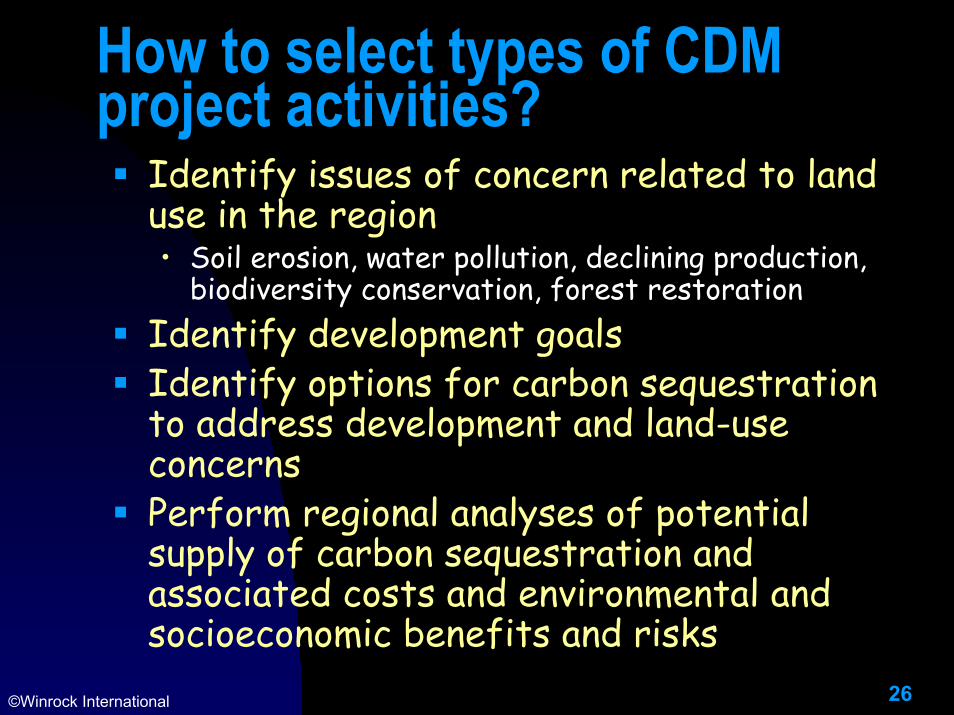
How to select types of CDM project activities?
Identify issues of concern related to land use in the region• Soil erosion, water pollution, declining production,
biodiversity conservation, forest restorationIdentify development goalsIdentify options for carbon sequestration to address development and land-use concernsPerform regional analyses of potential supply of carbon sequestration and associated costs and environmental and socioeconomic benefits and risks
27©Winrock International
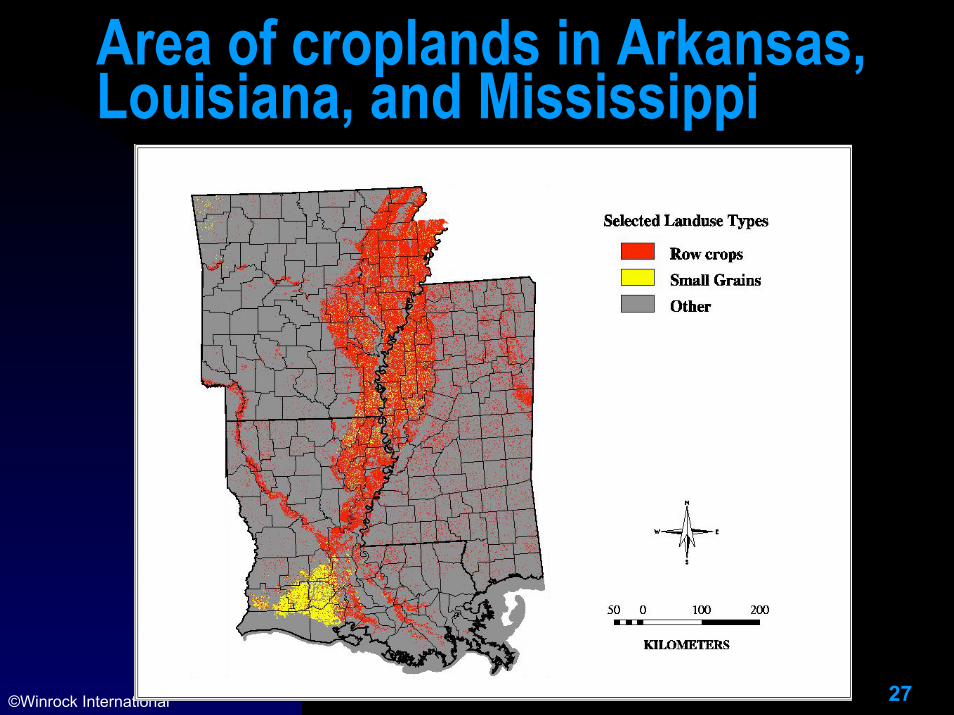
Area of croplands in Arkansas, Louisiana, and Mississippi
Carbon Supply Curves$ per ton @ 20 years
STATSGO
WoodlandDatabase
PredominantTree Species
Forest Type
Site Index
AvailableField Data
AllometricGrowth Equation
Carbon Yield
County AgData
Ag LandType
Marginal AgAnalysis
EconomistAnalysis
OpportunityCost
Forest Type
LandClassification
PlantingCosts
ConversionCost
Forest Type
TreatmentsType
Frequency ofTreatment
MaintenanceCost
ProjectDuration
Accuracy andPrecision
M & MCost
Economic Inputs
Carbon Supply Curves$ per ton @ 40 years
Carbon Supply Curves$ per ton @ 80 years
Afforestation
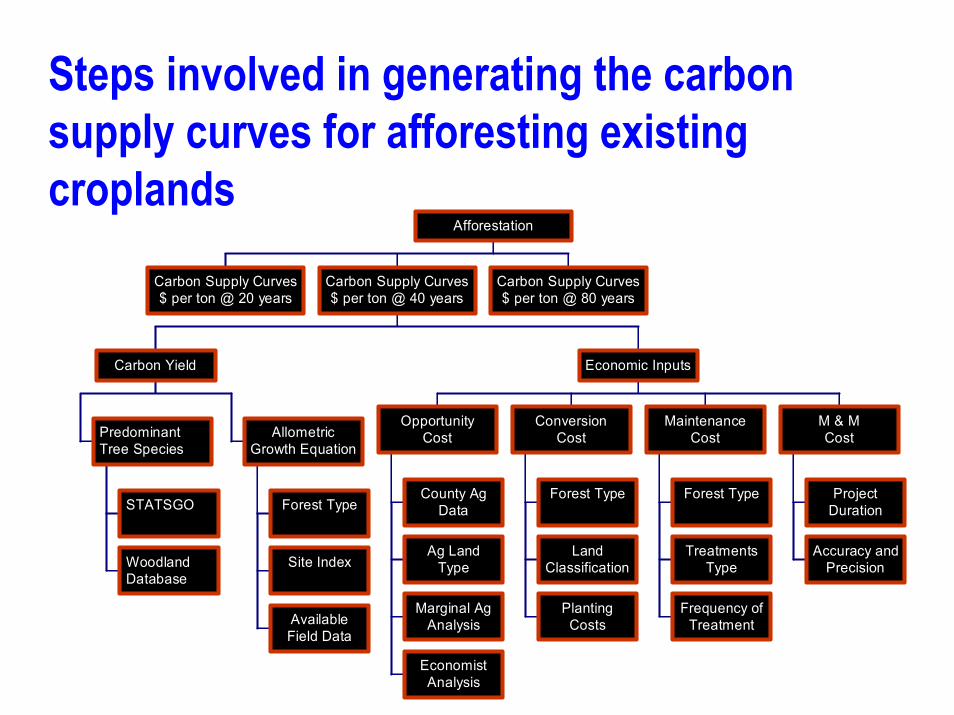
Steps involved in generating the carbon supply curves for afforesting existing croplands
29©Winrock International
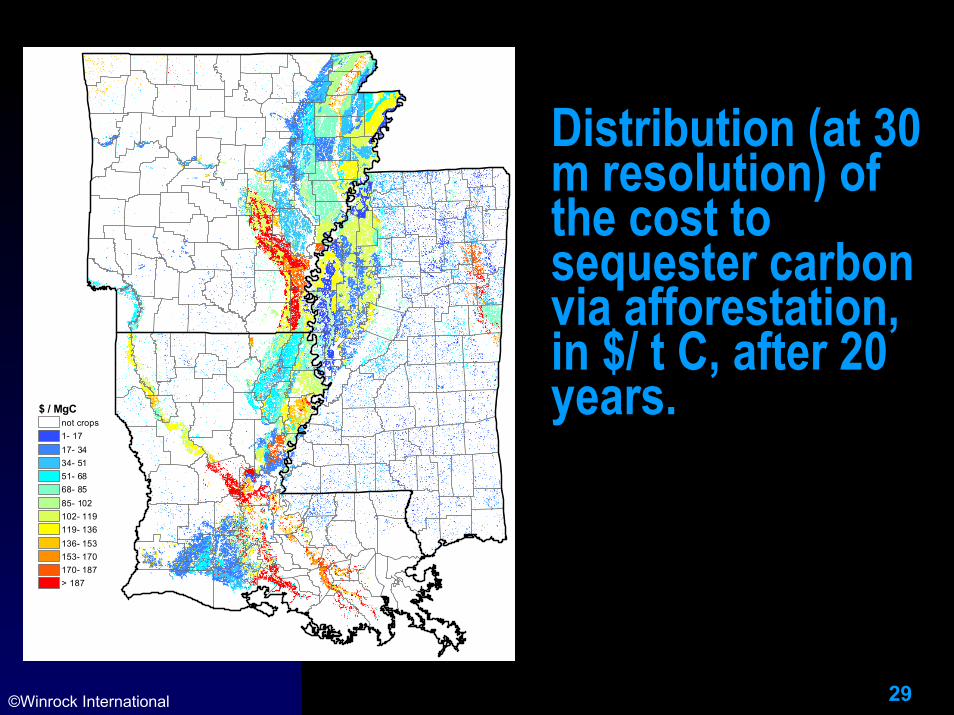
$ / MgCnot crops1- 1717- 3434- 5151- 6868- 8585- 102102- 119119- 136136- 153153- 170170- 187> 187
Distribution (at 30 m resolution) of the cost to sequester carbon via afforestation, in $/ t C, after 20 years.
Financing mechanisms
31©Winrock International
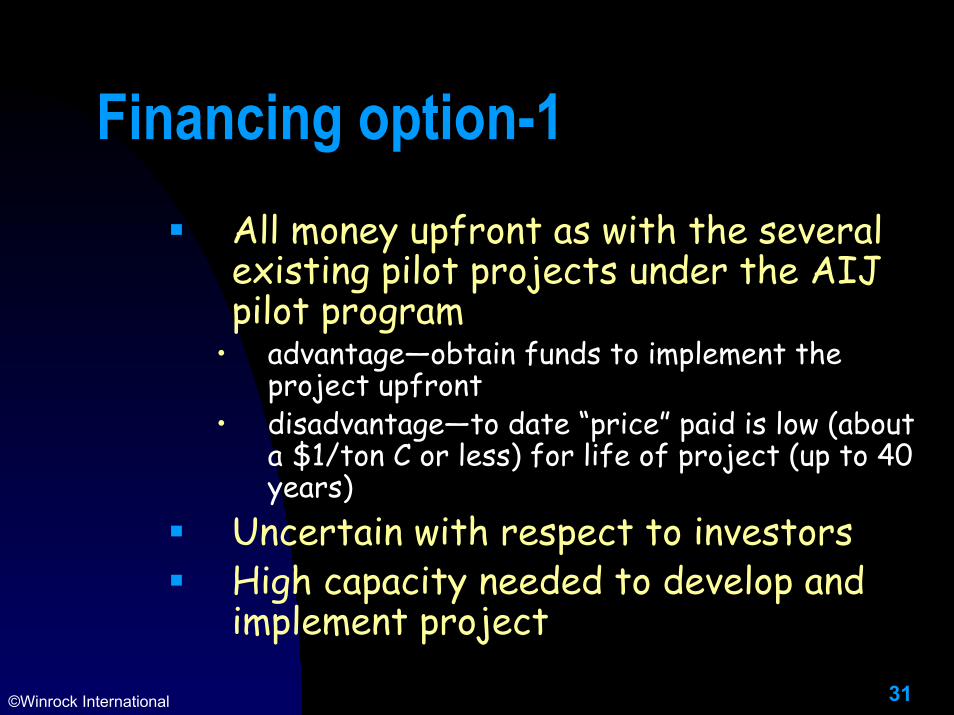
Financing option-1All money upfront as with the several existing pilot projects under the AIJ pilot program
• advantage—obtain funds to implement the project upfront
• disadvantage—to date “price” paid is low (about a $1/ton C or less) for life of project (up to 40 years)
Uncertain with respect to investorsHigh capacity needed to develop and implement project
32©Winrock International
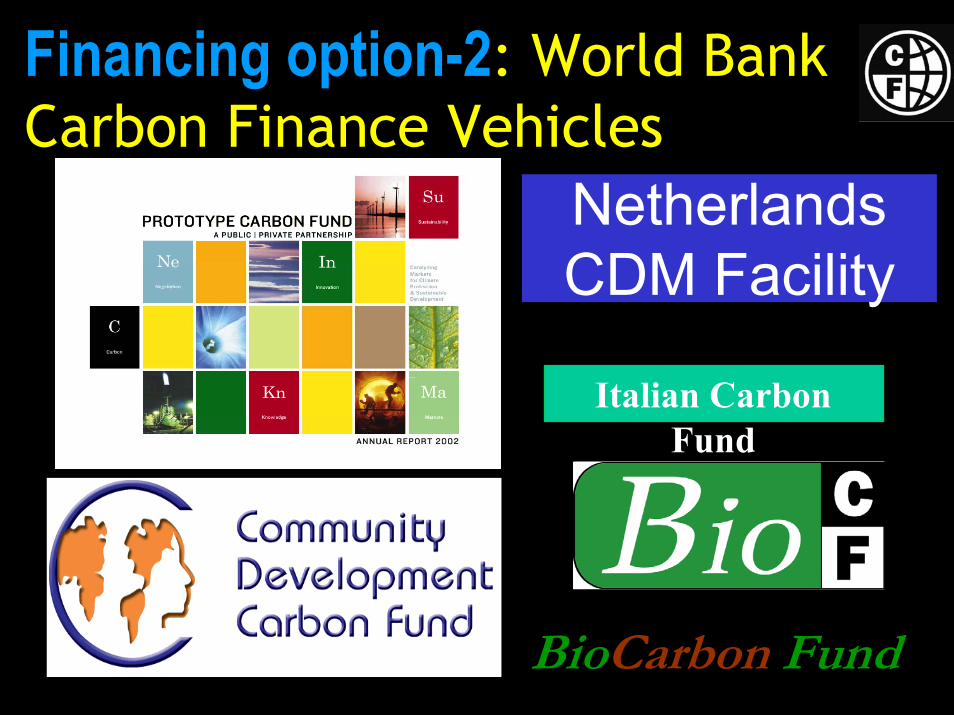
Financing option-2: World BankCarbon Finance Vehicles
BioCarbon Fund
Netherlands CDM Facility
Italian Carbon Fund
33©Winrock International
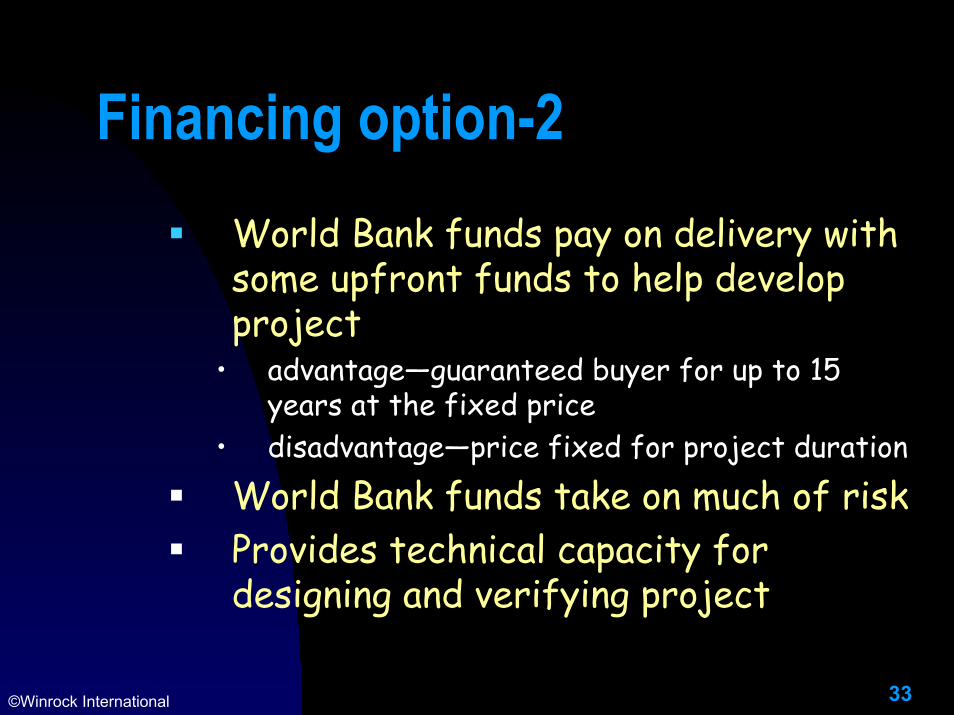
Financing option-2World Bank funds pay on delivery with some upfront funds to help develop project
• advantage—guaranteed buyer for up to 15 years at the fixed price
• disadvantage—price fixed for project durationWorld Bank funds take on much of riskProvides technical capacity for designing and verifying project
34©Winrock International
Financing options-3Independently funded for project development and implementation—develop business plan like any other venture to raise capital• advantage—if sell Certified Emissions Reduction
units for 5-year commitment periods, can sell at what market will bear
• disadvantage—need to provide all funding for implementation, market could be uncertain and risky
Needs high level of capacity to develop