Carbon Risks And Opportunities In The S&P 500 carbon costs that could be incurred by S&P 500...
40
trucost.com Carbon Risks And Opportunities In The S&P 500 Trucost analysis of the greenhouse gas emissions, carbon intensity, and exposure to carbon costs of the top 500 US companies Commissioned by Investor Responsibility Research Center Institute for Corporate Responsibility (IRRCi) irrcinstitute.org
Transcript of Carbon Risks And Opportunities In The S&P 500 carbon costs that could be incurred by S&P 500...
trucost.com
Carbon Risks And Opportunities In The S&P 500Trucost analysis of the greenhouse gas emissions, carbon intensity, and exposure to carbon costs of the top 500 US companies
Commissioned by Investor Responsibility Research Center Institute for Corporate Responsibility (IRRCi)
irrcinstitute.org
2
Carbon Risks and Opportunities in the S&P 500
Overview of Trucost analysis
The Investor Responsibility Research Center Institute (IRRCi) commissioned environmental data company Trucost to assess the global carbon exposure of companies listed in the S&P 500 Index. The IRRCi is a not-for-profit entity whose mission is to provide thought leadership at the intersection of corporate responsibility and the informational needs of investors.
Carbon Risks and Opportunities in the S&P 500 examines the greenhouse gases emitted by 497 companies in the Index in 2007, based on data as of 28 February 2009. Data was not available for the three remaining companies, which listed in the Index during 2008. Trucost analyzed direct greenhouse gas emissions from operations, as well as company supply chain emissions, including electric utilities.
The companies covered in this report are included in Trucost’s database – the world’s largest repository of corporate greenhouse gas emissions. This analysis incorporates information provided by companies where emissions and resource use are adequately disclosed. Greenhouse gas emissions data analyzed in this report are standardized by Trucost in line with the Greenhouse Gas Protocol, the internationally-recognized corporate accounting standard.
Companies and sectors are compared on both absolute emissions and carbon intensity, defined as emissions per million dollars (USD) of revenue. Carbon intensity allows for comparison of the relative carbon performance and exposure of companies of different sizes and sectors. Trucost also examined the potential carbon costs that could be incurred by S&P 500 companies if carbon pricing were applied to their emissions. The report examines the significance of projected carbon costs relative to revenue as well as earnings before interest, tax, depreciation and amortization (EBITDA).
Executive summary 3
Scope of Trucost analysis 5
Government policies to introducecarbon pricing 7
Carbon intensity indicates financial risk 9
Absolute greenhouse gas emissions in the S&P 500 10
Greenhouse gas emissions by sector 12
Absolute emissions at a company level 15
Carbon intensity of the S&P 500 Index 16
Carbon intensity by sector 17
Carbon intensity at a company level 18
Exposure to carbon costs 22
Carbon costs relative to revenue 24
Carbon costs relative to earnings 26
Carbon disclosure set to improve 28
Corporate greenhouse gas reporting requirements 28
Carbon disclosure by S&P 500 companies 29
Managing carbon exposure 32
Appendices 34
Appendix 1: Number of S&P 500 companies in each sector 34
Appendix 2: Trucost methodology 35
Appendix 3: Carbon intensity of indices in top five sectors 36
Appendix 4: List of S&P 500 companies analyzed 37
About IRRCi 39
About Trucost 39
Maximum
Minimum
Market cost of carbon/EBITDA
Car
bon
cost
s ($
28.2
4/tC
O2-
e) a
s %
EB
ITD
A
120%
100%
80%
60%
40%
20%
0%
Utilitie
s
Basic
Resou
rces
Food
& Bev
erag
e
Chem
icals
Oil & G
as
Contents
Report highlights
The Obama Administration plans to introduce a cap-and-trade program. A proposed carbon trading scheme would apply a cost to over 85% of greenhouse gas emissions in the US. Emissions are also set to be regulated by the US Environmental Protection Agency, which announced recently that greenhouse gases pose a threat to public health.
Highlights from Trucost’s analysis of the risks and opportunities from greenhouse gases emitted by S&P 500 companies include:
Utilities companies emit 59% of greenhouse gases released from operations owned or controlled by companies in the S&P 500. Almost 1.3 billion metric tons of greenhouse gases emitted by Utilities companies in the Index equate to more than half of all US emissions from power generation in 2007.
The Utilities sector in the S&P 500 emits the highest level of greenhouse gases relative to revenue in the Index. As the most carbon-intensive sector, Utilities could face the greatest exposure to carbon costs incurred under proposed climate change regulations in the US. If the 34 Utilities companies analyzed had to pay a price of $28.24 for each
•
•
3
Carbon Risks and Opportunities in the S&P 500
Executive summary
Policy framework
The US Government has recently announced plans to introduce a cap-and-trade scheme.2 From 2012, the program will aim to reduce greenhouse gas emissions across the economy – by 14% from 2005 levels by 2020, and by 83% by 2050.3 Emissions trading will create a cost for greenhouse gases emitted by companies in sectors covered by the program. A carbon price will be applied to greenhouse gases, measured as their carbon dioxide equivalent (CO
2-e) emissions. Levels of
greenhouse gas (GHG) emissions relative to revenues and earnings will influence which companies are most exposed to carbon costs.
Climate policy developments in the US reflect moves by industrialized countries worldwide to address greenhouse gas emissions, including measures to introduce or strengthen carbon pricing.
Key findings include:
Absolute greenhouse gas emissions
Total emissions, including direct emissions from operations and indirect emissions from suppliers, amount to 4,307 Mt of CO
2-e for companies in the S&P 500 Index.
34 companies in the Utilities sector account for the highest level of total emissions, followed by the Oil & Gas, Industrial Goods & Services, Food & Beverage and Basic Resources sectors.
Direct emissions: More than half of the total greenhouse gases emitted by companies in the S&P 500 result from fuel use and industrial processes at the 497 companies analyzed, known as direct “Scope 1” emissions under the Greenhouse Gas Protocol. The 2,173 million metric tons of carbon dioxide-equivalent (Mt CO
2-
e) emissions from the global operations of S&P 500 companies each year equate to over 30% of all US greenhouse gas emissions in 2007. This is more than total emissions from all road and air transport in the US during 2007.
Utilities, Oil & Gas, and Basic Resources companies account for 85% of direct emissions from S&P 500 companies. Companies in these sectors covered by cap-and-trade programs would incur carbon costs through their direct emissions.
Supply chain emissions: For over 80% of the companies analyzed, the majority of greenhouse gas emissions are from purchased electricity and other direct suppliers, rather than from operations that they control or own. They could therefore be most exposed to carbon costs passed on by suppliers in higher prices.
Emissions from electricity purchased by S&P 500 companies amount to almost 319 million tons of carbon dioxide-equivalent (Mt CO
2-e). All other emissions
associated with suppliers total almost 1,816 Mt CO2-e.
•
•
•
•
•
•
1 Trucost estimate of potential price per ton of CO
2-e emissions in 2012. See page 22 for methodology.
2 Issues, Energy and the Environment, www.whitehouse.gov
3 http://www.whitehouse.gov/omb/assets/fy2010_new_era/Environmental_Protection_Agency1.pdf
Maximum
Minimum
Market cost of carbon/EBITDA
Car
bon
cost
s ($
28.2
4/tC
O2-
e) a
s %
EB
ITD
A
120%
100%
80%
60%
40%
20%
0%
Utilitie
s
Basic
Resou
rces
Food
& Bev
erag
e
Chem
icals
Oil & G
as
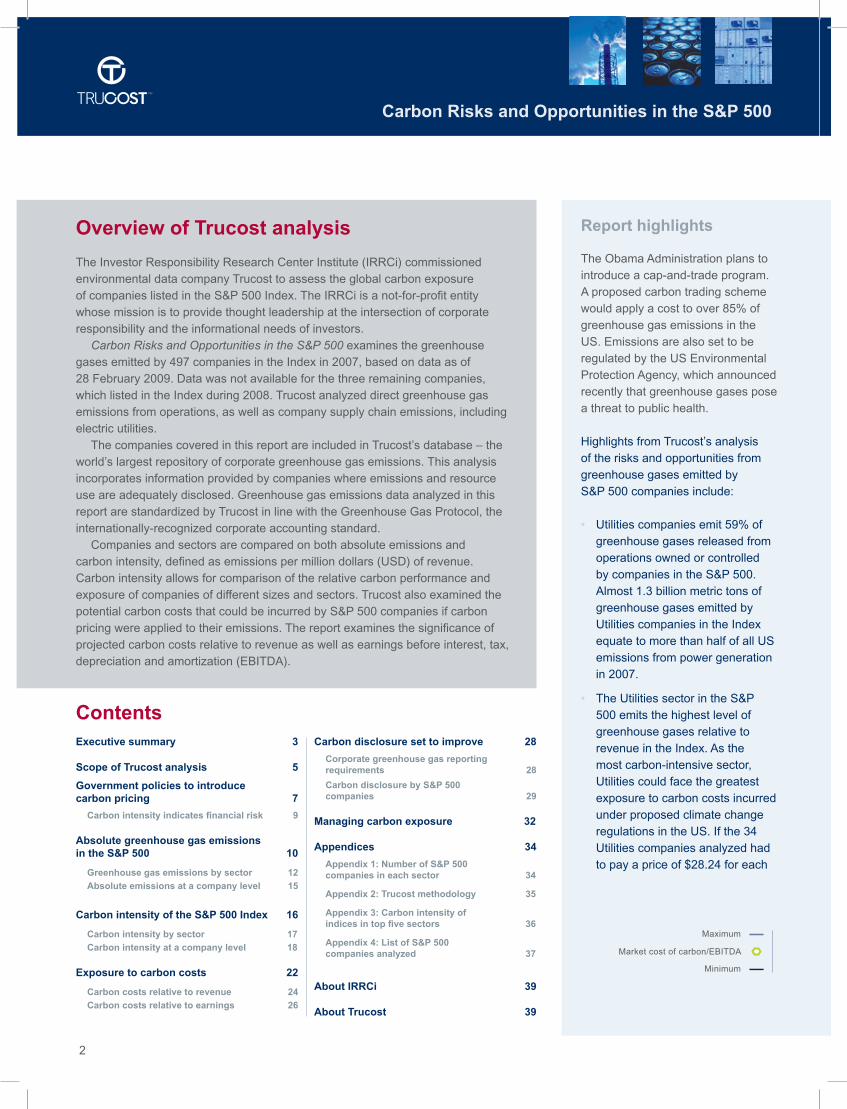
metric ton of emissions1, carbon costs could almost halve their combined earnings.
At a company level, the range in financial risk from carbon costs varies significantly. The greatest variation in carbon exposure is in the carbon-intensive Utilities, Basic Resources, Food & Beverage, Chemicals and Oil & Gas sectors, where earnings before interest, tax, depreciation and amortization (EBITDA) could fall by between approximately 1% and 117% if carbon costs were incurred (see Chart 1).
Investors will be expected to understand company exposure to carbon costs relative to sector peers in the Utilities and other sectors set to be regulated under cap-and-trade programs.
Chart 1: Percentage of EBITDA at risk from carbon costs by sector
•
•
4
Carbon Risks and Opportunities in the S&P 500
Carbon intensity
On average, S&P 500 companies emit 382 tons of CO2-e for every $1 million of revenue
generated. Normalizing direct and first-tier emissions by revenue indicates that the carbon intensity of the S&P 500 is lower than that of the MSCI Europe, MSCI All World and MSCI Asia ex-Japan indices, largely as a result of the difference in sector weights between the indices. This suggests that securities in the S&P 500 may be well positioned under global carbon pricing.
Within the S&P 500, the Utilities sector is most carbon-intensive, with an average carbon intensity nearly three times higher than that of the Basic Resources sector, ranked second. The next most carbon-intensive industry is Chemicals, followed by Oil & Gas and Food & Beverage. The high emissions relative to revenue in these sectors indicates potentially significant exposure to carbon costs.
Carbon intensity in the S&P 500 Index ranges from 4 tCO2-e/$ million for The Chubb
Corporation in the Insurance sector to 15,142 tCO2-e/$ million for the Utilities company
Allegheny Energy.
The carbon intensity of companies within sectors varies most significantly in the Oil & Gas and Utilities sectors. Ranges in carbon intensity indicate varied exposure to carbon costs, with companies that have higher carbon intensities than sector peers less likely to be able to pass on costs in higher prices without losing market share. Companies that are carbon-intensive for their sectors could face greater financial risk.
Exposure to carbon costs
If a market price of $28.241 were applied to each ton of CO2-e emitted by companies in
the S&P 500 and their first-tier suppliers, carbon costs would total over $92.8 billion. This equates to over 1% of revenue from the companies in 2007, and over 5.5% of combined
EBITDA.
At a carbon price of $28.24/tCO2-e, average carbon costs
would amount to between 1% and 12% of revenue in the Utilities, Basic Resources, Food & Beverage, Chemicals and Oil & Gas sectors.
Financial risk from carbon costs is greatest in the Utilities sector, where EBITDA at a company level could fall by 2% to 117%.
Exposure to carbon costs varies significantly across companies in the Index. Carbon costs would amount to less than 1% of EBITDA for 203 companies, while 71 companies could see earnings fall by 10% or more.
•
•
•
•
•
•
•
•
Carbon liabilities could equate to 2% to 117% of EBITDA for Utilities companies in the S&P 500
5
Carbon Risks and Opportunities in the S&P 500
Corporate disclosure on greenhouse gas emissions
66% of companies analyzed do not publish adequate data on direct emissions from operations, and could therefore be unprepared for mandatory reporting requirements. Data is considered adequate where it is disclosed in accordance with the Greenhouse Gas (GHG) Protocol. Some companies may provide information to the Carbon Disclosure Project, which recommends the GHG Protocol, however their submissions are not necessarily compliant with it.
34% of S&P 500 companies disclose direct greenhouse gas emissions in line with the GHG Protocol, or provide data on resource use that can be used to derive emissions. These companies account for 92% of the total direct emissions from the S&P 500 as calculated by Trucost.
The majority of companies in the carbon-intensive Utilities, Chemicals and Basic Resources sectors disclose direct operational emissions. Standardized data on corporate emissions enables financial analysis of carbon exposure, which is essential for companies and investors to manage carbon risks and opportunities.
Scope of Trucost analysis
Investor Responsibility Research Center Institute for Corporate Responsibility (IRRCi) has commissioned Trucost to examine the greenhouse gases emitted by large cap US companies listed in the S&P 500 Index. The analysis covers 497 constituents of the Index covered by Trucost using data as of 28 February 2009. Financial data was not available for the remaining three companies, which listed in the Index during 2008. Trucost assessed company greenhouse gas emissions in 19 sectors, using the Industry Classification Benchmark (ICB) system (see Appendix 1 on page 34).
Based on Trucost’s standardized, comprehensive data on the 497 companies, Carbon Risks
and Opportunities in the S&P 500 includes analysis of:
Absolute greenhouse gas emissions at a company and a sector level in 2007. This analysis includes emissions from global operations and not just those emitted within the US. Carbon exposure is therefore assessed on a global basis.
The carbon intensity of companies and sectors in the Index. Quantities of GHG emissions are normalized by revenue to compare the carbon performance of companies of different sizes and industries. Carbon intensity is expressed as each ton of carbon dioxide equivalent (CO
2-e) emissions per million US Dollars of revenue. Unless stated otherwise, the currency
used throughout this report is US Dollars ($).
The carbon intensity of the S&P 500 Index relative to MSCI World, MSCI Europe and MSCI Asia ex-Japan indices.
The exposure of S&P 500 companies to carbon costs under cap-and-trade programs.
•
•
•
•
•
•
•
6
Carbon Risks and Opportunities in the S&P 500
To identify the financial implications of a price being applied to greenhouse gas emissions, the carbon risk analysis:
Highlights how overall revenue and earnings in the S&P 500 could be exposed to carbon costs under different pricing scenarios.
Identifies the percentage of revenue that could be at risk from carbon costs at a company and sector level. Carbon costs are considered material where they equate to 1% or more of revenue.
Estimates potential carbon costs relative to earnings before interest, tax, depreciation and amortization (EBITDA). The use of EBITDA reveals the extent to which a company’s profitability could be at risk from internalizing carbon costs.
Trucost has also examined levels of corporate disclosure on greenhouse gas emissions in 2007. When this analysis was conducted during March 2009, many of the companies analyzed had not yet reported data for 2008.
Trucost calculation of emissions
Trucost monitors data on the environmental impacts of over 4,500 listed companies worldwide and holds the world’s largest repository of greenhouse gas or “carbon” emissions.
Absolute greenhouse gas emissions
Trucost analyzed the quantities of overall greenhouse gases emitted by each company. Greenhouse gases (GHGs) are measured as metric tons of their carbon dioxide-equivalent emissions.4 Where companies do not disclose data adequately, corporate emissions are standardized in line with the Greenhouse Gas Protocol international corporate accounting standard.5 The GHG Protocol categorizes emissions into Scopes 1, 2 and 3. Scope 1: Direct GHG emissions caused by a company’s fuel combustion or emitted through industrial processes owned or controlled by a company.Scope 2: Indirect GHG emissions from purchased electricity.Scope 3: Indirect emissions from other sources not owned or controlled by the company, such as suppliers and products in use.
Trucost’s analysis of absolute emissions includes direct emissions from operations (Scope 1), indirect emissions from purchased electricity (Scope 2) and other supply chain emissions (Scope 3). However, the focus in this analysis regarding supply chain emissions is on direct (first-tier) suppliers to each company unless stated otherwise. These first-tier supplier GHGs include emissions from electricity providers and business air travel.
The analysis excludes potentially significant greenhouse gases associated with products in use and investments by financial institutions.6 Where a company only disclosed resource use such as fuel consumption, Trucost used this data to derive emissions where possible. Where a company only provides data for part of its business activities or previous years, Trucost normalizes quantities in order to calculate emissions from entire operations. If this is not possible due to insufficient disclosure, Trucost uses its environmental profiling system to calculate the likely emissions (see Trucost methodology on page 35).
•
•
•
4 See “Trucost methodology on page 35”.
5 Developed by the World Resources Institute and World Business Council for Sustainable Development
6 Emissions linked to companies held in investment funds are the focus of a separate report by Trucost: “Carbon Counts USA: The Carbon
Footprints of Mutual Funds in the US”. Available for free at www.trucost.com
US greenhouse gas emission trends
Meeting the 83% greenhouse gas reduction target will mean reversing a trend of rising emissions. US greenhouse gas (GHG) emissions, measured as their carbon dioxide-equivalent (CO
2-e), rose by 17%
to 7.15 billion metric tons between 1990 and 2007 9. The increase is largely attributable to higher carbon dioxide emissions from fossil fuel combustion in the electricity generation and transportation sectors. Electricity generation was the largest source of carbon dioxide in the US in 2007, when fossil fuel combustion to generate power released one-third of total US greenhouse gas emissions. Emissions of the greenhouse gas hydrofluorocarbons (HFCs) more than tripled during the same period as they replaced ozone-depleting substances in air conditioning and refrigeration equipment. Meanwhile, emissions of methane (CH
4), nitrous oxide (N
2O), sulphur hexafluoride (SF
6) and
perfluorocarbons (PFCs) have fallen in the US. Switching to low-carbon energy sources and improving energy efficiency in all sectors will be essential to cutting emissions.

7
Carbon Risks and Opportunities in the S&P 500
Government policies to introduce carbon pricing
The Obama Administration has set out an agenda to tackle climate change alongside energy security. The US government plans to introduce an economy-wide program to reduce the greenhouse gas emissions that contribute to global warming by some 14% from 2005 levels by 2020, and by 83% by 2050. To achieve the targets, the federal government plans to introduce a cap-and-trade program that will limit greenhouse gas emissions and create a business cost for carbon beginning in 2012.7
Companies in sectors covered by the program will have to purchase a permit or allowance for each ton of greenhouse gases they emit. Companies that have more carbon permits than needed, or those reducing their GHG emissions, will be able to sell excess allowances to businesses facing a shortfall. Up to 100% of carbon allowances could be auctioned to avoid free allocations resulting in windfall profits for carbon-intensive companies and weak carbon prices, as happened during the trial first phase of the European Union’s Emission Trading Scheme from 2005-07. Certain industrial sectors with high levels of energy use or producers of commodities traded globally could be compensated for costs incurred under the program initially.
The House Energy and Commerce Committee proposed the latest in a series of cap-and-trade bills in March 2009.8 The draft American Clean Energy and Security Act of 2009 is in line with the 83% emission reduction target for 2050, but would set a stricter interim target to cut emissions by 20% below 2005 levels by 2020. It proposes a cap-and-trade scheme that would cover sources including electric utilities, oil companies and large industrial facilities responsible for 85% of US emissions. The US Environmental Protection Agency (EPA) said in April that the
7 A New Era of Responsibility, Renewing America’s Promise, Office of Management and Budget
8 http://energycommerce.house.gov/Press_111/20090331/acesa_summary.pdf
9 2009 U.S. Greenhouse Gas Inventory Report
US greenhouse gas emission trends
Meeting the 83% greenhouse gas reduction target will mean reversing a trend of rising emissions. US greenhouse gas (GHG) emissions, measured as their carbon dioxide-equivalent (CO
2-e), rose by 17%
to 7.15 billion metric tons between 1990 and 2007 9. The increase is largely attributable to higher carbon dioxide emissions from fossil fuel combustion in the electricity generation and transportation sectors. Electricity generation was the largest source of carbon dioxide in the US in 2007, when fossil fuel combustion to generate power released one-third of total US greenhouse gas emissions. Emissions of the greenhouse gas hydrofluorocarbons (HFCs) more than tripled during the same period as they replaced ozone-depleting substances in air conditioning and refrigeration equipment. Meanwhile, emissions of methane (CH
4), nitrous oxide (N
2O), sulphur hexafluoride (SF
6) and
perfluorocarbons (PFCs) have fallen in the US. Switching to low-carbon energy sources and improving energy efficiency in all sectors will be essential to cutting emissions.

8
Carbon Risks and Opportunities in the S&P 500
Act, which draws on legislation proposed by Congressmen Dingell and Boucher (see page 22), would fundamentally change energy supply and use. Emissions abatement would largely come from shifts to low-carbon electric power generation and improved efficiency.10
The move to introduce national emissions trading follows the development of three regional cap-and-trade schemes in the US – the Regional Greenhouse Gas Initiative, which caps carbon dioxide emitted by utilities from 2009; and the Western Climate Initiative and Midwestern Greenhouse Gas Reduction Accord, which are set to cap economy-wide greenhouse gas emissions from 2012. Twenty-four US states and three Canadian provinces are participating in at least one of these schemes to help meet GHG reduction targets.11
However, market-based policy measures may not be enough, and further regulatory controls could include performance standards. For instance, California plans to use both regulatory and market-based approaches to help cut emissions to 1990 levels, or around 15% from current levels, by 2020.12 Performance standards include limiting investment in power generation to facilities that are at least as carbon efficient as natural gas power plants. California has also proposed a requirement for a 10% cut in the carbon content of transport fuels, including emissions during fuel production, by 2020. Based on this, President Obama plans to introduce a Low Carbon Fuel Standard at a national level.13
A draft ruling by the Environmental Protection Agency that greenhouse gases contribute to air pollution that may endanger public health or welfare14 will clear the way for the EPA to regulate GHGs under the Clean Air Act.
International climate framework
The US cap-and-trade program is likely to require allowances for all six greenhouse gases included under the UN Kyoto Protocol international agreement on climate change. The Protocol, which requires 37 industrialized countries to cut GHG emissions by at least 5% from 1990 levels between 2008 and 2012, covers carbon dioxide (CO
2), methane (CH
4), nitrous oxide (N
2O),
sulphur hexafluoride (SF6), hydrofluorocarbons (HFCs), and perfluorocarbons (PFCs).
Scientists have called for far greater GHG reductions globally to have a chance of keeping average temperature rises below 2°C and avoiding the most dangerous impacts of climate change.15 The US is participating in international UN negotiations set to culminate in Denmark in December 2009 and designed to agree to deeper emission reduction targets from 2013 onwards. So far, the G8 nations – the US, UK, Japan, Canada, Germany, France, Italy, and Russia – have agreed to work towards a goal to at least halve emissions by 2050.
Carbon prices might need to reach $200-$500 per metric ton to spur investment in the low-carbon energy and technology revolution needed to halve emissions.16 Mitigation could cost roughly 1% of global GDP annually by 2050, although costs are growing the longer action is delayed.17 If governments and industry fail to cut greenhouse gas emissions adequately and natural feedbacks are triggered, such as methane release from soils and oceans, climate change could wipe 5% to 20% off annual world GDP in the long term. Most international policymakers now recognize that the relatively low cost of action to mitigate emissions is a price worth paying to avert the risk of severe climate change impacts with catastrophic economic and social consequences.
10 http://epa.gov/climatechange/economics/pdfs/WaxmanMarkeyExecutiveSummary.pdf
11 See Carbon Counts USA, April 2009, www.trucost.com/publishedresearch
12 The target was introduced under the Global Warming Solutions Act of 2006 (Assembly Bill 32)
13 http://my.barackobama.com/page/content/newenergy_more#emissions
14 EPA Finds Greenhouse Gases Pose Threat to Public Health, Welfare / Proposed Finding Comes in Response to 2007 Supreme Court Ruling,
17 April 200915
Intergovernmental Panel on Climate Change16
http://www.iea.org/Textbase/press/pressdetail.asp?PRESS_REL_ID=26317
The UK Government’s Stern Review on the Economics of Climate Change
9
Carbon Risks and Opportunities in the S&P 500
The European Union Emission Trading Scheme will set stricter caps on carbon dioxide emissions during its third phase from 2012-2020, and further emission trading programs are planned in the UK, New Zealand, South Korea, Canada and Australia. An International Carbon Action Partnership is working towards a global cap-and-trade market.
Carbon intensity indicates financial risk
The US 2010 budget predicts $79 billion in revenues from auctioning allowances under the trading scheme in its first year, rising to $646 billion by 2019.19 A large share of the “climate revenues” from auctioning emission allowances will be used to fund clean technology and renewable energy industries, also part of a wider plan to create jobs and greater energy independence. Companies offering leading low-carbon “solutions” could see opportunities soar as demand grows worldwide.
Some of the proceeds from the trading scheme will be used to help businesses shift to a low-carbon economy, as the program changes cost structures for industries. There will be winners and losers. The carbon intensity of companies will influence which face the greatest costs to comply with carbon constraints. Carbon costs could squeeze profit margins for companies with carbon-intensive energy sources and industrial processes that are directly
covered by the cap-and-trade program. Attempts to pass through carbon costs will add an
emissions cost to the price of goods and services. Nearly all companies will be affected by carbon costs passed on in energy prices. In Europe, the pass on of carbon costs by electric utilities has added to rising input costs for energy-intensive manufacturers in particular. Moreover, existing long-term contracts could limit the ability of carbon-intensive suppliers in the US to pass through carbon costs.
Companies that rely heavily on carbon-intensive operations and supply chains could be most exposed to carbon liabilities. For instance, Construction & Engineering companies may face rising costs for building products as cement makers and steel producers try to pass on carbon costs associated with their production processes.
High emitters which find it difficult to fully pass these liabilities on in higher prices could see profits fall, unless they profoundly change the goods they produce or how they produce them. Companies that are more carbon-efficient than sector peers, with limited exposure to direct
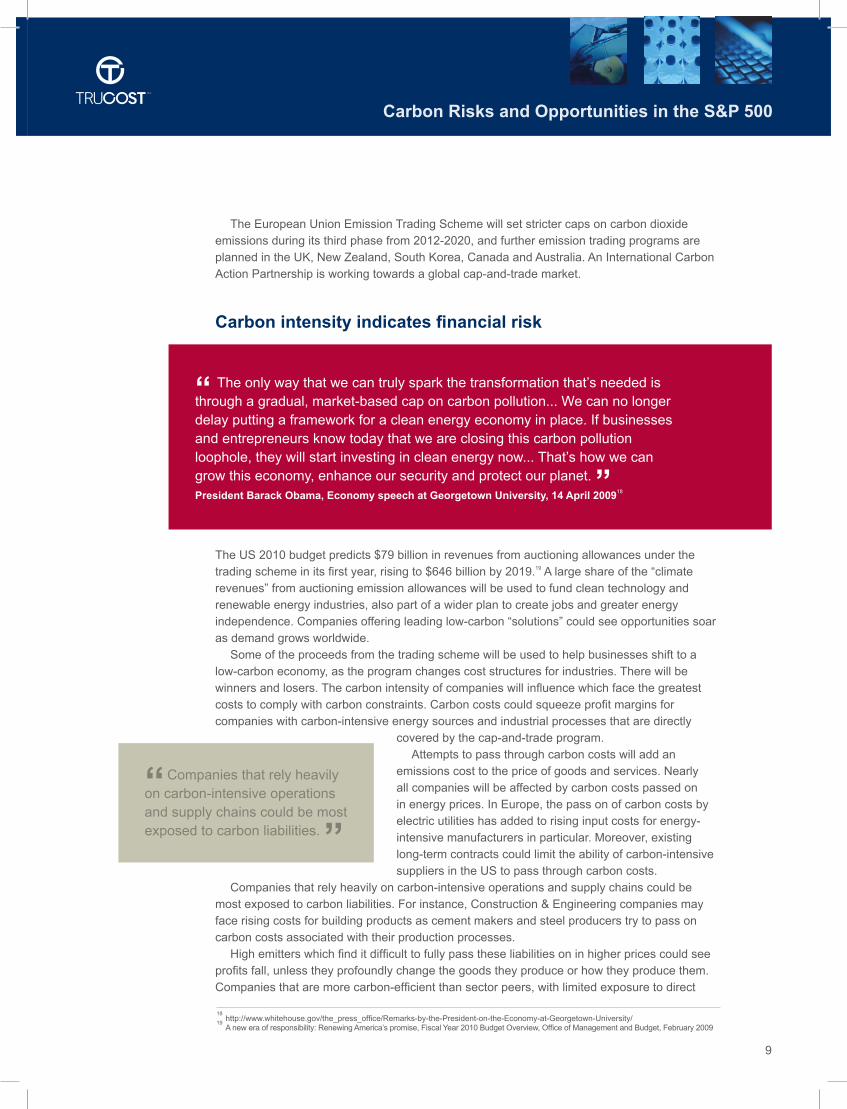
“ The only way that we can truly spark the transformation that’s needed is through a gradual, market-based cap on carbon pollution... We can no longer delay putting a framework for a clean energy economy in place. If businesses and entrepreneurs know today that we are closing this carbon pollution loophole, they will start investing in clean energy now... That’s how we can grow this economy, enhance our security and protect our planet. ”President Barack Obama, Economy speech at Georgetown University, 14 April 2009
18
“ Companies that rely heavily on carbon-intensive operations and supply chains could be most exposed to carbon liabilities. ”
18 http://www.whitehouse.gov/the_press_office/Remarks-by-the-President-on-the-Economy-at-Georgetown-University/
19 A new era of responsibility: Renewing America’s promise, Fiscal Year 2010 Budget Overview, Office of Management and Budget, February 2009

10
Carbon Risks and Opportunities in the S&P 500
carbon costs or indirect costs passed on in input prices, stand to gain competitive advantage. Carbon pricing could create opportunities for low-emission companies in carbon-intensive sectors.
While relatively low levels of emissions can be attributed to service-based companies, they could nonetheless be exposed to future carbon prices applied to other industries, as carbon-intensive suppliers seek to pass carbon costs on in the prices of goods and services.
The cost of capital therefore will likely be influenced by the ability of a company to reduce its carbon intensity and exposure to liabilities under future carbon constraints. Investment decisions in assets such as power stations, industrial plants, and buildings could drive exposure to carbon costs for decades to come.
Absolute greenhouse gas emissions in the S&P 500
Levels of absolute emissions are useful to understand a company’s overall contribution to the stock of greenhouse gases in the atmosphere. A carbon price can be applied to a company’s absolute emissions to model potential carbon costs under cap-and-trade programs.
Direct greenhouse gas emissions
Direct greenhouse gas (GHG) emissions are emitted through a company’s fuel combustion and industrial processes under its direct control – known as Scope 1 under the Greenhouse Gas Protocol. The level of direct greenhouse gases emitted by companies listed in the S&P 500 Index can indicate potential carbon costs if a price were applied to facilities owned or managed by a company.
The combined direct emissions of S&P 500 companies amount to 2,172.78 million metric tons of carbon dioxide-equivalents (Mt CO
2-e) in 2007. This includes gases emitted by global
operations of multinational companies, not just those released in the United States. The total direct emissions from the companies equate to 30% of all US greenhouse gas emissions in 2007, which amounted to 7.15 billion tons.20 The S&P 500 companies emit more than the total 1.89 billion metric tons of emissions from transportation activities in the US during 2007, including journeys by all automobiles, trucks and aircraft.21
Supply chain greenhouse gas emissions
The relative significance of direct emissions, indirect emissions from purchased electricity and wider supply chain emissions varies between companies. Direct emissions are likely to form a greater proportion of overall emissions at manufacturing companies than at service-based firms, where purchased electricity and other supply chain emissions are likely to be higher than direct emissions. Indirect emissions could result from suppliers of chemicals, packaging, transport and outsourced logistics.
For over 80% of the companies in the S&P 500, the majority of greenhouse gas emissions are from indirect sources associated with their business activities. Examples include companies such as clothing retailers which predominantly outsource the production of goods and services, and financial institutions. Many of the S&P 500 companies are service-based and the majority of their emissions result from electricity use in buildings, as well as business travel.
20 2009 US Greenhouse Gas Inventory Report
21 http://www.epa.gov/climatechange/emissions/downloads09/07ES.pdf

11
Carbon Risks and Opportunities in the S&P 500
Trucost analyzed greenhouse gas emissions resulting from suppliers, including electric utilities, to companies in the S&P 500. This approach to quantify indirect emissions for each company in the S&P 500 can help identify their overall carbon risk exposure, as suppliers attempt to pass through carbon costs in higher prices. The purchase of electricity and other goods and services by companies in the S&P 500 account for almost half of their total emissions (see Chart 1).
Chart 1: Breakdown of total greenhouse gas emissions in the S&P 500 by source
Other findings include:
Emissions from electricity purchased by companies in the S&P 500 amount to almost 319 Mt CO
2-e, and emissions from other direct suppliers (first tier) total over 795 Mt CO
2-e.
Corporate emissions associated with all other suppliers (excluding first tier) total 1,020.6 Mt CO
2-e.
The combined direct (2,172.8 Mt CO2-e), electricity (319 Mt CO
2-e), other (first-tier) supplier
(795 Mt CO2-e) and all other supply chain (1,020.6 Mt CO
2-e) emissions of companies in the
S&P 500 total 4,307.4 Mt of CO2-e.
More than half of the greenhouse gases emitted by companies in the S&P 500 are direct from operations.
•
•
•
•
Direct operational(Scope 1)50.44%
Electricity suppliers (Scope 2)7.41%
Other direct (first-tier) suppliers
(excluding electricity)18.46%
All other supply chain23.69%

12
Carbon Risks and Opportunities in the S&P 500
Greenhouse gas emissions by sector
Direct emissions
Trucost analyzed the amount of direct greenhouse gases emitted by companies in each of the 19 ICB Super Sectors. Companies in nine sectors emit 97% of direct emissions in the Index, or 2,118 Mt CO
2-e: Utilities, Oil & Gas, Basic Resources, Industrial Goods & services, Chemicals,
Food & Beverage, Travel & Leisure, Retail and Personal & Household Goods (see Chart 2).
Chart 2: Breakdown of direct greenhouse gas emissions by sector
Carbon dioxide-equivalent emissions are concentrated in three sectors – Utilities, Oil & Gas, and Basic Resources. These sectors emit 1,848.24 Mt CO
2-e, which equates to 85% of
direct emissions from companies in the S&P 500.
The 34 Utilities companies contribute 59% of the direct CO2-e emissions associated with
the S&P 500. Emissions in the Utilities sector are largely direct CO2 from the combustion of
fossil fuels such as coal and natural gas in power generation plants. Direct emissions from S&P 500 Utilities companies amount to 1,283,867,376 tons of CO
2-e. This equates to 54% of the carbon
dioxide released from all power generation in the US in 2007 – 2,397 million tons of CO
2.22
The Oil & Gas sector contributes nearly one-fifth of direct emissions in the Index (425.30 Mt CO
2-e). The main sources of direct
emissions are the extraction of oil and natural gas and the refining/manufacturing of petroleum products.
•
•
•
“ Carbon dioxide emitted by Utilities in the S&P 500 equate to more than half of all CO
2 emissions from power generation
in the US. ”
59.09%
19.57%
6.40%
4.27%
3.95%2.53%
Circa 1%
ICB Super Sector
Personal & Household Goods 0.63%
Retail 1.13%
Travel & Leisure 1.21%
Food & Beverage 1.21%
All Other Sectors 2.53%
Chemicals 3.95%
Industrial Goods & Services 4.27%
Basic Resources 6.40%
Oil & Gas 19.57%
Utilities 59.09%
22 http://www.epa.gov/climatechange/emissions/downloads09/ExecutiveSummary.pdf
13
Carbon Risks and Opportunities in the S&P 500
6% of direct greenhouse gases are released in the Basic Resources sector. Sources include fuel use as well as chemical processes to transform raw materials during iron and steel, ferroalloy and aluminum production. There are opportunities to reduce methane emissions from coal extraction.
The Industrial Goods & Services and Chemicals sectors each account for 4% of direct emissions.
39 Retail companies are responsible for just over 1% of the S&P 500’s direct emissions in the aggregate.
10 sectors are responsible for just 3% of total direct emissions: Automobiles & Parts, Banks, Construction & Materials, Financial Services, Healthcare, Insurance, Media, Real Estate, Technology and Telecommunications.
Direct and supply chain emissions by sector
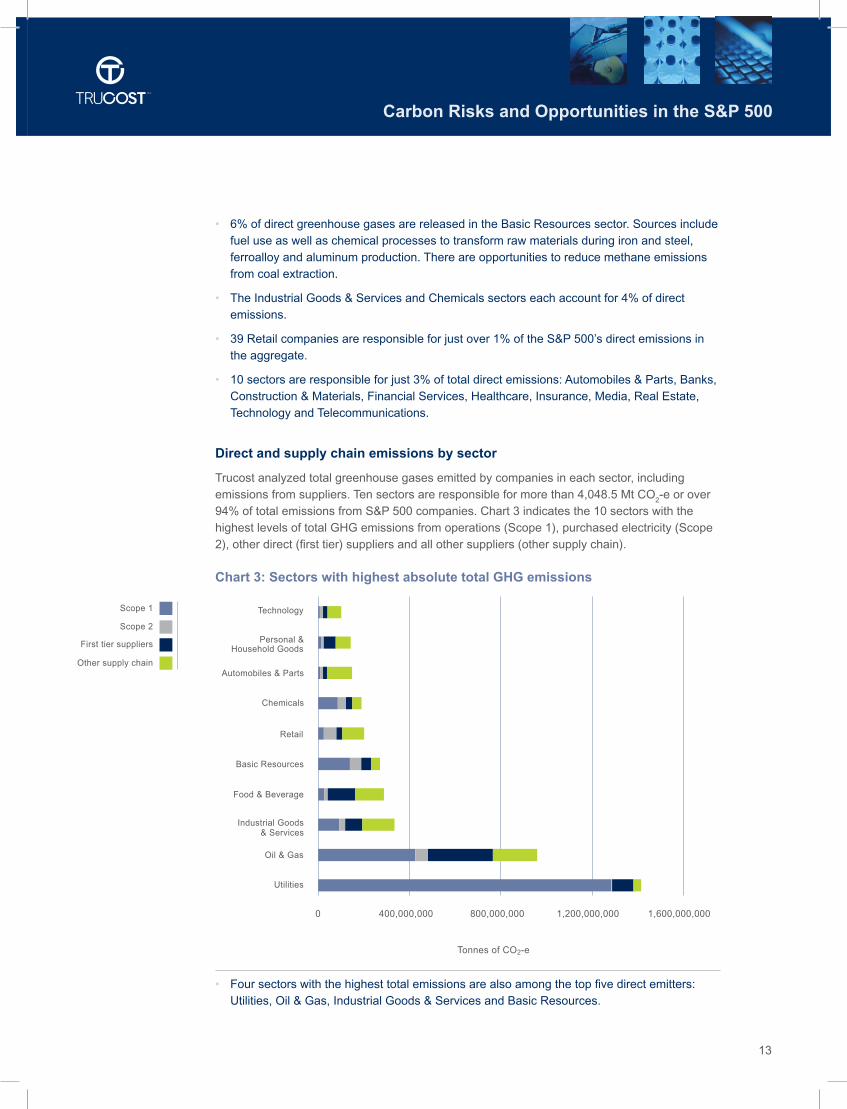
Trucost analyzed total greenhouse gases emitted by companies in each sector, including emissions from suppliers. Ten sectors are responsible for more than 4,048.5 Mt CO
2-e or over
94% of total emissions from S&P 500 companies. Chart 3 indicates the 10 sectors with the highest levels of total GHG emissions from operations (Scope 1), purchased electricity (Scope 2), other direct (first tier) suppliers and all other suppliers (other supply chain).
Chart 3: Sectors with highest absolute total GHG emissions
Four sectors with the highest total emissions are also among the top five direct emitters: Utilities, Oil & Gas, Industrial Goods & Services and Basic Resources.
•
•
•
•
•
Scope 1
First tier suppliers
Scope 2
Other supply chain
0 400,000,000 800,000,000 1,200,000,000 1,600,000,000
Utilities
Oil & Gas
Industrial Goods& Services
Food & Beverage
Basic Resources
Retail
Chemicals
Automobiles & Parts
Personal &Household Goods
Technology
Tonnes of CO2-e

14
Carbon Risks and Opportunities in the S&P 500
As shown in Chart 3 on page 13:
Utilities companies have the largest absolute total greenhouse gas emissions associated with their activities, with over 91% of their emissions coming from direct operations. Since power plants owned by Utilities companies in the S&P 500 are largely based in the US, they are likely to have to pay for the direct greenhouse gases they emit under the planned cap-and-trade scheme. The sector is therefore exposed to direct carbon costs applied to emissions from operations.
The Oil & Gas sector has the second-highest level of total GHG emissions within the S&P 500. While a large proportion of emissions from the sector are direct from operations, Oil & Gas
companies have the highest level of electricity use (Scope 2) and supply chain GHG emissions (including first-tier suppliers). The Scope 3 emissions included in this analysis are from outsourced activities such as shipping, well drilling and construction. The sector could therefore be exposed to direct carbon costs as well as those passed on in higher input prices. Many of the Oil & Gas companies analyzed, including Chevron Corporation and Marathon Corporation, operate in countries around the world and could therefore be more exposed to global climate policies than the US cap-and-trade
program. However, the planned National Low Carbon Fuel Standard (see page 8) is likely to limit the level of emissions from transportation fuels, including both upstream emissions during production and emissions from fuel combustion. Several Oil & Gas companies in the S&P 500, including ExxonMobil and ConocoPhillips, operate in the oil sands industry. Oil sands operators use processes some three times more carbon intensive than conventional production,23 and are likely to be more exposed to carbon emissions standards.
Total emissions from the 72 companies in the Industrial Goods & Services sector amount to 333,759,213 tCO
2-e. Some 28% of emissions in the sector are direct from operations. The
sector is mainly exposed to carbon costs passed on by suppliers.
Since around one-third of emissions in the Basic Resources sector result from purchases from electricity generators and other first-tier suppliers, the sector is exposed to direct as well as indirect carbon costs.
Food & Beverage is also among the five sectors with the highest levels of total emissions. Companies in the sector have the second-highest level of supply chain emissions (246.4 Mt CO
2-e). These are greater than the sector’s emissions from both operations and electricity
use combined (41.3 Mt CO2-e). Energy use during meat production and processing as well
as water abstraction, packaging manufacturing and transportation contribute to significant upstream emissions. Companies could face upward pressure on pricing through carbon costs passed on by suppliers in the future. There are opportunities to reduce high levels of methane emitted by dairy and beef cattle, as well nitrous oxide released from fertilizer use.
The Retail industry has the second-largest overall electricity (Scope 2) carbon emissions. The 55.5 Mt CO
2-e of electricity-based emissions are over double the amount of direct carbon
emissions (24.6 Mt CO2-e) in the sector.
More than half of the greenhouse gases emitted by the 13 Chemicals companies analyzed are from the purchase of electricity and other goods and services. The sector is likely to be included under economy-wide cap-and-trade programs and is exposed to direct carbon costs as well as those passed on by suppliers.
•
•
•
•
•
•
•
“ Most emissions from S&P 500 Utilities companies are direct from operations in the US, which are likely to be covered by carbon pricing. ”
23 Trucost Research Note Oil sands: Exposure to energy and carbon costs, July 2008

15
Carbon Risks and Opportunities in the S&P 500
Absolute emissions at a company level
Five companies account for 22% of the total emissions from the S&P 500 (Scopes 1, 2 and 3). Chart 4 shows the five companies with the largest total direct and supply chain emissions. Chart 4: Companies with largest total carbon emissions in the S&P 500
Oil & Gas companies Exxon Mobil, Chevron Corporation and ConocoPhillips, together with the Utilities American Electric Power and The Southern Company, account for more than 939 Mt CO
2-e.
Exxon Mobil, American Electric Power Company and The Southern Company, together with the Utilities Duke Energy and AES Corporation, account for over 30% of direct greenhouse gas emissions from operations in the S&P 500 Index (over 654.24 Mt CO
2-e).
ExxonMobil has the largest total greenhouse gas emissions of the S&P 500 companies, (305.9 Mt CO
2-e). Direct greenhouse gas emissions account for almost half of this amount.
Electricity generator American Electric Power Company has the third-highest total carbon emissions. The vast majority of the company’s emissions result from coal combustion to generate electricity.
Of the 20 companies with the largest direct GHG emissions in the S&P 500, 14 are conventional electricity generators, four are oil & gas producers, one is a steel manufacturer (United States Steel Corporation) and one is in the Chemicals sector (Dow Chemicals Company).
Forty-seven companies each emit more than 10 Mt CO2-e.
•
•
•
•
•
•
Scope 1 350,000,000
300,000,000
250,000,000
200,000,000
150,000,000
100,000,000
50,000,000
0
First tier suppliers
Scope 2
Other supply chain
Exxon Mobil
Met
ric
tons
of
tota
l gre
enho
use
gas
emis
sion
s
Chevron Corp. American ElectricPower Company
The SouthernCompany
ConocoPhillips
16
Carbon Risks and Opportunities in the S&P 500
Carbon intensity of the S&P 500 Index
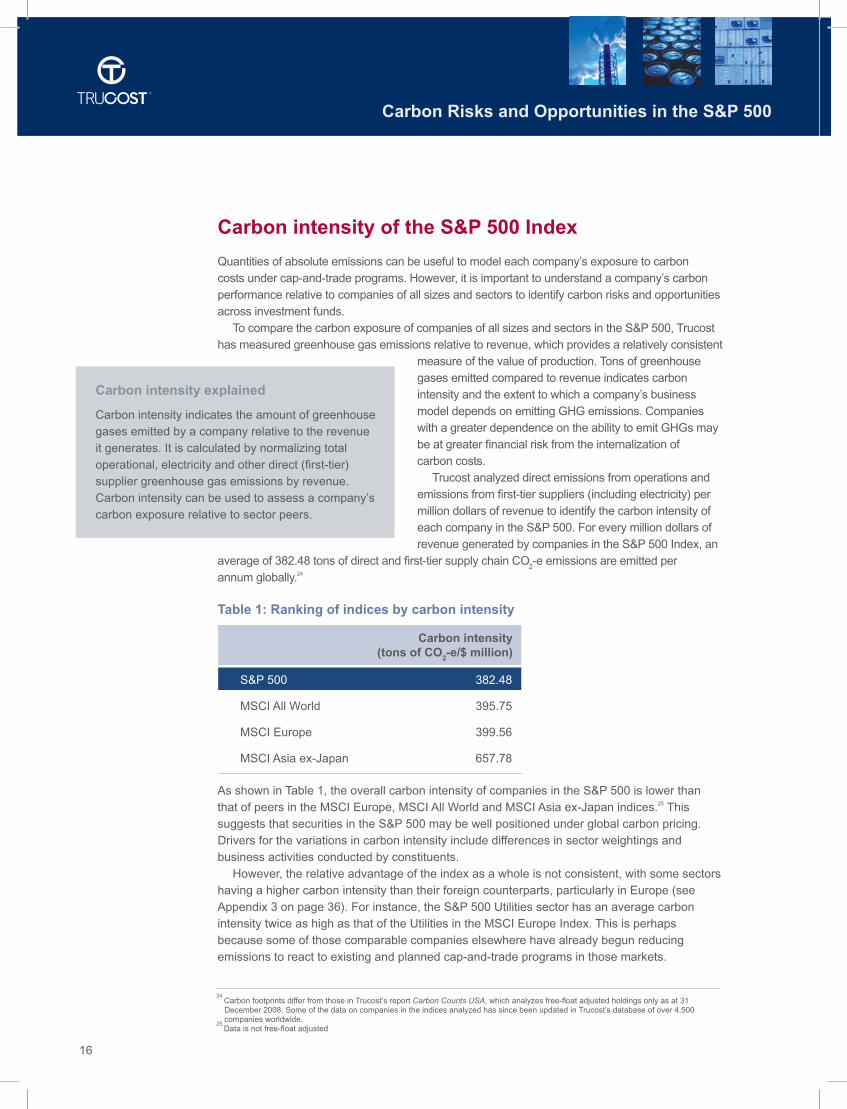
Quantities of absolute emissions can be useful to model each company’s exposure to carbon costs under cap-and-trade programs. However, it is important to understand a company’s carbon performance relative to companies of all sizes and sectors to identify carbon risks and opportunities across investment funds.
To compare the carbon exposure of companies of all sizes and sectors in the S&P 500, Trucost has measured greenhouse gas emissions relative to revenue, which provides a relatively consistent
measure of the value of production. Tons of greenhouse gases emitted compared to revenue indicates carbon intensity and the extent to which a company’s business model depends on emitting GHG emissions. Companies with a greater dependence on the ability to emit GHGs may be at greater financial risk from the internalization of carbon costs.
Trucost analyzed direct emissions from operations and emissions from first-tier suppliers (including electricity) per million dollars of revenue to identify the carbon intensity of each company in the S&P 500. For every million dollars of revenue generated by companies in the S&P 500 Index, an
average of 382.48 tons of direct and first-tier supply chain CO2-e emissions are emitted per
annum globally.24
Table 1: Ranking of indices by carbon intensity
S&P 500 382.48
MSCI All World 395.75
MSCI Europe 399.56
MSCI Asia ex-Japan 657.78 As shown in Table 1, the overall carbon intensity of companies in the S&P 500 is lower than that of peers in the MSCI Europe, MSCI All World and MSCI Asia ex-Japan indices.25 This suggests that securities in the S&P 500 may be well positioned under global carbon pricing. Drivers for the variations in carbon intensity include differences in sector weightings and business activities conducted by constituents.
However, the relative advantage of the index as a whole is not consistent, with some sectors having a higher carbon intensity than their foreign counterparts, particularly in Europe (see Appendix 3 on page 36). For instance, the S&P 500 Utilities sector has an average carbon intensity twice as high as that of the Utilities in the MSCI Europe Index. This is perhaps because some of those comparable companies elsewhere have already begun reducing emissions to react to existing and planned cap-and-trade programs in those markets.
24 Carbon footprints differ from those in Trucost’s report Carbon Counts USA, which analyzes free-float adjusted holdings only as at 31
December 2008. Some of the data on companies in the indices analyzed has since been updated in Trucost’s database of over 4,500 companies worldwide.25
Data is not free-float adjusted
Carbon intensity explained
Carbon intensity indicates the amount of greenhouse gases emitted by a company relative to the revenue it generates. It is calculated by normalizing total operational, electricity and other direct (first-tier) supplier greenhouse gas emissions by revenue. Carbon intensity can be used to assess a company’s carbon exposure relative to sector peers.
Carbon intensity (tons of CO
2-e/$ million)

17
Carbon Risks and Opportunities in the S&P 500
Carbon intensity by sector
The carbon intensity of ICB sectors in the S&P 500 varies significantly (see Chart 5). Five sectors are more carbon intensive than the average for the S&P 500: Food & Beverage, Oil & Gas, Chemicals, Basic Resources and Utilities. At a sector level, average carbon intensity ranges from 11 tons of CO
2-e/$ million for the Insurance industry, excluding emissions
associated with investments, to 4,183 tCO2-e/$ million for the Utilities sector. Companies that
have carbon-efficient operations and suppliers relative to sector peers will be less exposed to emissions costs and better positioned under carbon constraints.
Chart 5: Carbon intensity by sector
Four sectors that are more carbon intensive than the average for the S&P 500 are also among the sectors with the highest absolute total emissions: Food & Beverage, Oil & Gas, Basic Resources and Utilities. Although the Industrial Goods & Services sector is also among the top emitters on an absolute basis, emissions are moderate relative to revenue generated by companies in the sector, ranked 8th on average carbon intensity. On average, the 72 companies analyzed in this sector are therefore less exposed to carbon costs than those in the Travel & Leisure and Personal & Household Goods sectors, ranked 6th and 7th respectively.
•
S&P 500
Insurance
Banks
Media
Telecommunications
Technology
Healthcare
Real Estate
Retail
Automobiles & Parts
Construction & Materials
Financial Services
Industrial Goods & Services
Personal & Household Goods
Travel & Leisure
Food & Beverage
Oil & Gas
Chemicals
Basic Resources
Utilities
0 500 1,000 1,500 2,000 2,500 3,000 3,500 4,000 4,500
Carbon intensity (tCO2-e/$ million revenue)
18
Carbon Risks and Opportunities in the S&P 500
The Utilities sector is 11 times more carbon intensive than the average for the S&P 500. Since emissions are higher relative to revenue than in any other sector, Utilities companies are likely to face significant financial exposure to future carbon prices applied to emissions. The Utilities sector is nearly three times more carbon-intensive than Basic Resources.
Emissions in the Basic Resources sector are second-highest relative to revenue. Basic Resources companies are therefore more exposed to carbon costs than most other sectors analyzed. Since companies in the sector, such as steel and paper manufacturers, face competition from countries where carbon pricing is yet to be introduced, they could face greater difficulty in passing on carbon costs than Utilities.
The Oil & Gas industry ranks fourth on carbon intensity. Fluctuations in oil prices could affect the sector’s ability to absorb carbon costs or pass them on in higher fuel prices, without losing market share.
The 20 Food & Beverage companies analyzed have an average carbon intensity of 523 tCO
2-e/$ million. Given
their relatively high level of emissions compared with revenue, companies in this competitive sector may find
it difficult to absorb carbon costs. If costs are passed on in higher prices, consumers may shift to lower-carbon alternatives where possible.
The fifth sector that has a higher carbon intensity than the S&P 500 average is Chemicals. Although the Chemicals sector is ranked 7th on total absolute emissions (see Chart 3 on page 13), revenue generated in the sector is low relative to emissions. The Chemicals industry is third most carbon-intensive (950 tCO
2-e/$million) and relatively exposed to
carbon costs.
The Financial Services industry appears carbon intensive due to power generators owned by Goldman Sachs in 2007, the reporting period covered by this analysis.
Carbon intensity at a company level
The most carbon-intensive sector in the S&P 500 is the Utilities sector. Allegheny Energy is the most carbon-intensive utility and has the highest carbon intensity in the Index, at 15,142 tCO
2-e/$ million. This is over 3,500 times higher than the lowest carbon intensity of
4.23 tCO2-e/$ million in the Index, in the Insurance sector (The Chubb Corporation).
Within the 10 most carbon-intensive sectors (excluding Financial Services), there is a wide variation in the carbon intensity of companies (see Chart 6 on page 19). Understanding greenhouse gas emissions normalized by revenue at a stock level helps investors identify which companies in an investment fund present the greatest exposure to future carbon liabilities.
•
•
•
•
•
•
“Basic Resources companies that are covered by carbon pricing could find it difficult to pass on carbon costs. ”
19
Carbon Risks and Opportunities in the S&P 500
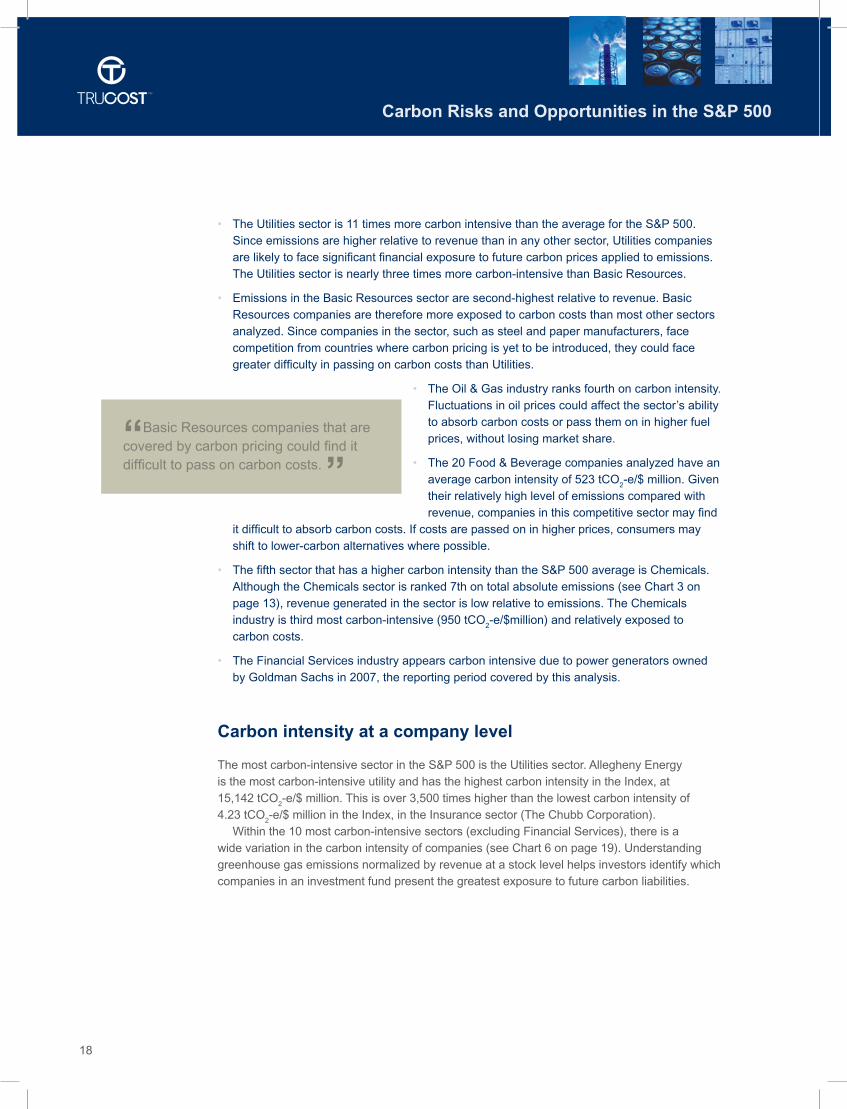
Chart 6: Range in carbon intensity in 10 carbon-intensive sectors
Of the 10 relatively high-carbon sectors, carbon efficiency at a company level varies most significantly in the Utilities and Oil & Gas sectors. Stock selections as well as sector allocations could therefore contribute significantly to carbon exposure in a fund.
Carbon intensity among the 34 Utilities companies analyzed ranges from 245 tCO2-e/$
million for PG&E Corporation, primarily involved in electricity and gas distribution, to 15,142 tCO
2-e/$ million for Allegheny Energy (see Chart 7 on page 20). Companies that
generate a growing proportion of electricity from low-carbon sources, such as Edison International’s subsidiary Southern California Edison, will be better positioned under carbon constraints than those which continue to rely on carbon-intensive fuels and remain exposed to rising carbon costs.
Of the 36 Oil & Gas companies analyzed, Nabors Industries Ltd, which offers contracting services such as well drilling and rig servicing, has the lowest carbon intensity at 144 tCO
2-e/$ million. This is over 98% smaller than the largest carbon intensity of
companies in the sector (see Chart 7 on page 20).
The third-greatest variation in carbon intensity is in the Basic Resources sector (478 tCO2-
e/$ million to 3,330 tCO2-e/$ million). Companies which are more carbon-efficient than
sector peers could face less upward pricing pressure and gain competitive advantage.
In the Industrial Goods & Services sector, 48 of the 72 companies analyzed have a carbon intensity lower than the sector average (177 tCO
2-e/$ million), and could therefore have lower
exposure to carbon costs than sector peers with carbon intensities higher than the average.
Several Utilities, Food & Beverage, Travel & Leisure, Industrial Goods & Services and Construction & Materials companies are at least two-thirds more carbon-intensive than the average for their sectors. These relatively high-carbon companies for their sectors could therefore face greater difficulty in passing on future carbon costs in higher prices without losing market share.
•
•
•
•
•
•
Maximum
Minimum
Average
16,000
14,000
12,000
10,000
8,000
6,000
4,000
2,000
0
Tons
of
CO
2-e/
$ m
illio
n re
venu
e
Utilitie
s
Basic
Resou
rces
Chem
icals
Oil & G
as
Food
& Bev
erag
e
Trave
l & L
eisur
e
Perso
nal &
Hou
seho
ld Goo
ds
Indu
strial
Goo
ds &
Ser
vices
Constr
uctio
n & M
ater
ials
Autom
obile
s & P
arts
20
Carbon Risks and Opportunities in the S&P 500
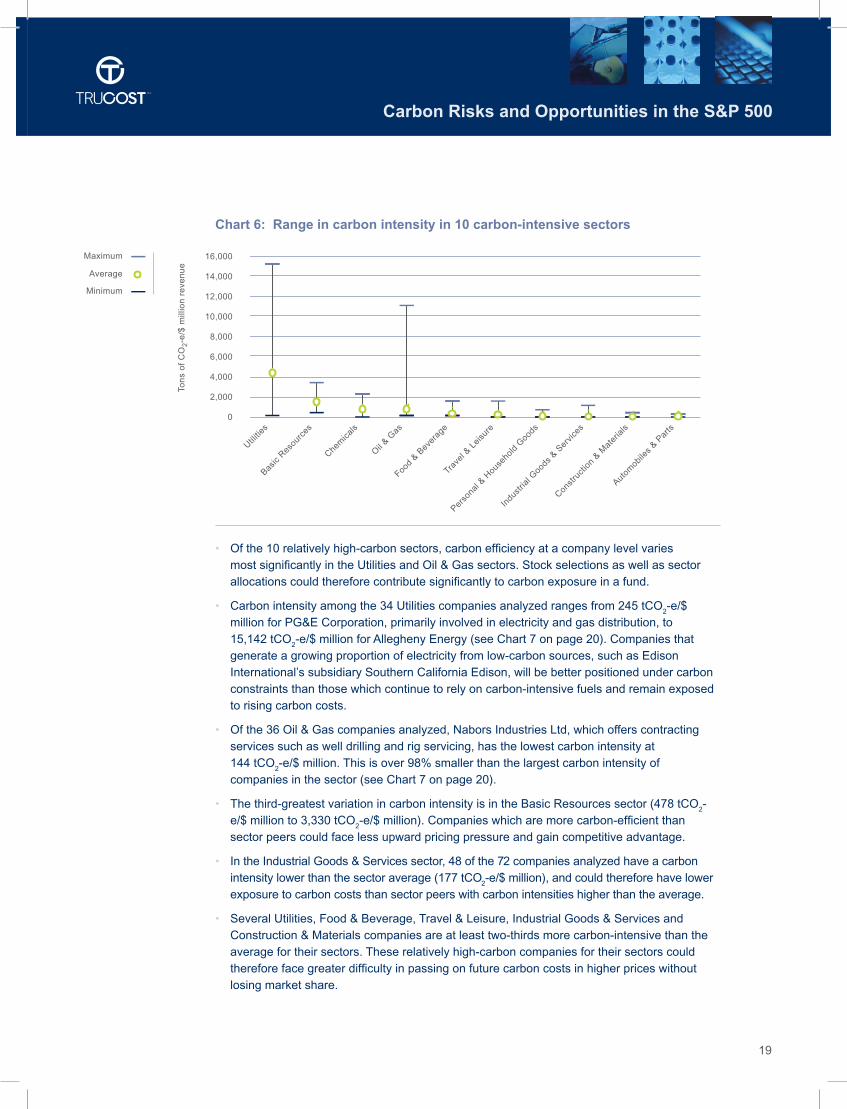
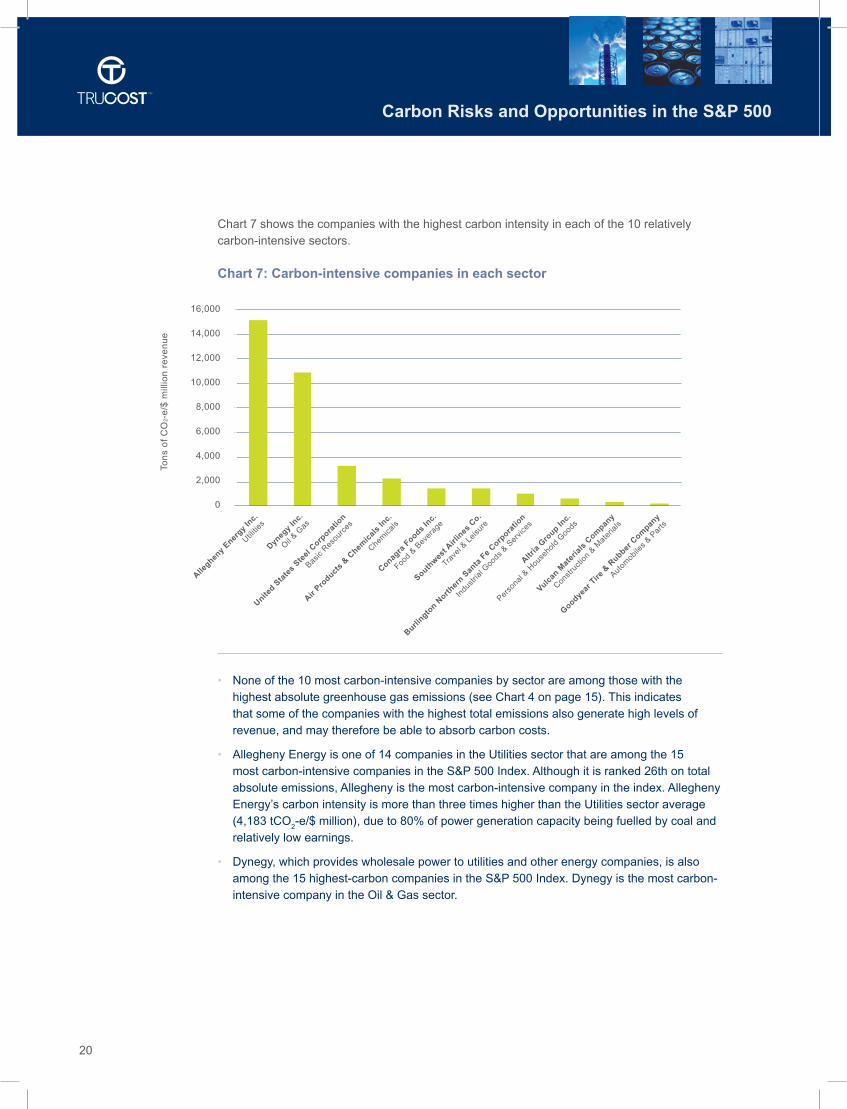
Chart 7 shows the companies with the highest carbon intensity in each of the 10 relatively carbon-intensive sectors.
Chart 7: Carbon-intensive companies in each sector
None of the 10 most carbon-intensive companies by sector are among those with the highest absolute greenhouse gas emissions (see Chart 4 on page 15). This indicates that some of the companies with the highest total emissions also generate high levels of revenue, and may therefore be able to absorb carbon costs.
Allegheny Energy is one of 14 companies in the Utilities sector that are among the 15 most carbon-intensive companies in the S&P 500 Index. Although it is ranked 26th on total absolute emissions, Allegheny is the most carbon-intensive company in the index. Allegheny Energy’s carbon intensity is more than three times higher than the Utilities sector average (4,183 tCO
2-e/$ million), due to 80% of power generation capacity being fuelled by coal and
relatively low earnings.
Dynegy, which provides wholesale power to utilities and other energy companies, is also among the 15 highest-carbon companies in the S&P 500 Index. Dynegy is the most carbon-intensive company in the Oil & Gas sector.
•
•
•
Tons
of
CO
2-e/
$ m
illio
n re
venu
e
16,000
14,000
12,000
10,000
8,000
6,000
4,000
2,000
0
Alleghen
y Ener
gy In
c.
Utilitie
s
Dyneg
y In
c.
Oil & G
as
Air Pro
ducts
& Chem
ical
s In
c.
Chem
icals
Southwes
t Airl
ines
Co.
Trave
l & L
eisur
e
Altria
Gro
up Inc.
Perso
nal &
Hou
seho
ld Goo
ds
Goodyear
Tire
& R
ubber C
ompan
y
Autom
obile
s & P
arts
United S
tate
s Ste
el C
orpora
tion
Basic
Resou
rces
Conagra
Foods
Inc.
Food
& Bev
erag
e
Burlingto
n North
ern S
anta
Fe
Corpora
tion
Indu
strial
Goo
ds &
Ser
vices
Vulcan
Mat
eria
ls C
ompan
y
Constr
uctio
n & M
ater
ials

21
Carbon Risks and Opportunities in the S&P 500
Both of the most carbon-intensive Basic Resources companies are in the steel industry: United States Steel Corporation and AK Steel Holdings. Both have a carbon intensity around one-third higher than that of Alcoa in the aluminum industry, which could therefore be less exposed to carbon costs.
Air Products and Chemicals emits the most greenhouse gases relative to revenue in the Chemicals sector. However, the company uses significant amounts of energy in air separation processes to produce gases including hydrogen, which can contribute to lower-carbon energy supplies in other industries.
Over 15 million tons of CO2-e are emitted by Conagra Foods Inc, which has a carbon
intensity of 1,523 tCO2-e/$ million.
Burlington Northern Santa Fe Corporation – the least carbon-efficient company in the Industrial Goods & Services sector – operates railway freight services powered by diesel fuel, which is generally more carbon intensive than petrol. However, railway freight transport stands to gain from a shift away from carbon-intensive road and air transport under carbon pricing.
Southwest Airlines Company has the highest carbon intensity in the S&P 500 Travel & Leisure sector. The company is the only airline analyzed in the S&P 500 index. The next most carbon-intensive Travel & Leisure companies offer passenger cruises, hotel accommodation and restaurant services.
Tobacco company Altria Group Inc, the parent company of Philip Morris USA, has the highest carbon intensity in the Personal & Household Goods sector. Coal is used in energy-intensive tobacco curing processes.
Vulcan Materials is the most carbon-intensive of five companies in the Construction & Materials sector. It supplies materials including concrete and cement, whose production emits significant greenhouse gas emissions.
The carbon intensity of Goodyear Tire and Rubber Company is over three times larger than those of carmakers General Motors and Ford Motor Company. Producing synthetic rubber uses significant amounts of fossil fuels.
392 of the 497 companies analyzed have a carbon intensity below the average of 382 tCO
2-e/$ million for the S&P 500 index.
•
•
•
•
•
•
•
•
•
22
Carbon Risks and Opportunities in the S&P 500
Exposure to carbon costs
The climate change impacts of greenhouse gas emissions and resultant damage to the environment, society and economy are externalized in existing financial metrics. Carbon pricing under the cap-and-trade program will internalize at least a portion of the social costs of carbon, moving some costs on to company balance sheets and thereby creating an incentive to invest in technologies, materials, processes and energy supplies with lower carbon impacts. Carbon reductions through more efficient use of resources such as energy can therefore lead to cost savings, and more efficient companies stand to gain as carbon prices increase input costs at all levels of production.
Companies more exposed to carbon liabilities could face material financial risk from carbon pricing during the transition to a low-carbon economy. Company exposure to carbon costs will vary depending on factors including the level of GHG emissions relative to financial performance, positioning under emission trading schemes, eligibility for financial incentives designed to help shift towards carbon efficiency and management of direct and supply chain carbon performance.
The carbon intensity of companies relative to sector averages, as well as to each other, indicates potential carbon risk. Trucost has measured carbon exposure by calculating potential carbon costs relative to revenue and earnings before interest, tax, depreciation and amortization (EBITDA). While the current policy gap adds to uncertainty about the level of future carbon prices, Trucost has calculated the potential impact of internalizing the cost of direct and first-tier indirect greenhouse gases emitted globally by S&P 500 companies using two scenarios – the potential market price of carbon allowances and the social cost of carbon.
1. Market price – the price of carbon allowances under the national cap-and-trade program will be driven by supply and demand. Although the regulatory framework and program design are yet to be decided, a potential starting price of carbon allowances can be estimated based on a proposed emission trading scheme under a draft Bill introduced by Congressmen Dingell and Boucher in 2008, which is expected to form the “nuts and bolts” of a new climate Bill.26 The scheme would cap emissions at 6% below 2005 levels in 2012 and at 80% below in 2050 – a long-term goal similar to the target outlined in the US budget. The draft Dingell-Boucher Bill would see a minimum reserve auction price of $20 to $30 for each short ton of CO
2-e in 2012.27
If the actual program sets a stricter greenhouse gas emissions cap for 2012 of 14% below 2005 levels, in line with the target outlined in the US budget, the higher price would be more likely. Adjusting the $30 price to metric tons and the 83% greenhouse gas reduction target for 2050, carbon costs in 2012 could start at $28.24 per metric ton of CO
2-e emissions. Actual
prices could vary depending on factors including the scope of sectors covered and levels of auctioning at the outset of the program, plus macroeconomic factors.
2. Social cost of carbon – Trucost has also calculated the potential effect of internalizing the global social cost of carbon outlined by the US Environmental Protection Agency. The social cost of carbon is the marginal cost of an additional unit of carbon emissions. This is estimated as the net present value of global climate change impacts over 100+ years of one additional ton of GHGs emitted to the atmosphere.28 The EPA estimates the social cost of carbon to be $105 per ton of CO
2-e in 2040.29 Using the social cost in this analysis provides a useful indictor
for the potential future effect of rising carbon costs on companies in the S&P 500.
26 House climate draft to draw from Dingell-Boucher, Point Carbon, 24 March 2009
27 Summary of the Dingell-Boucher Discussion Draft, Pew Center on Global Climate Change, December 2008
28 http://www.eenews.net/public/25/10084/features/documents/2009/03/11/document_gw_04.pdf
29 http://www.edf.org/documents/8733_CarbonCounts.pdf
23
Carbon Risks and Opportunities in the S&P 500
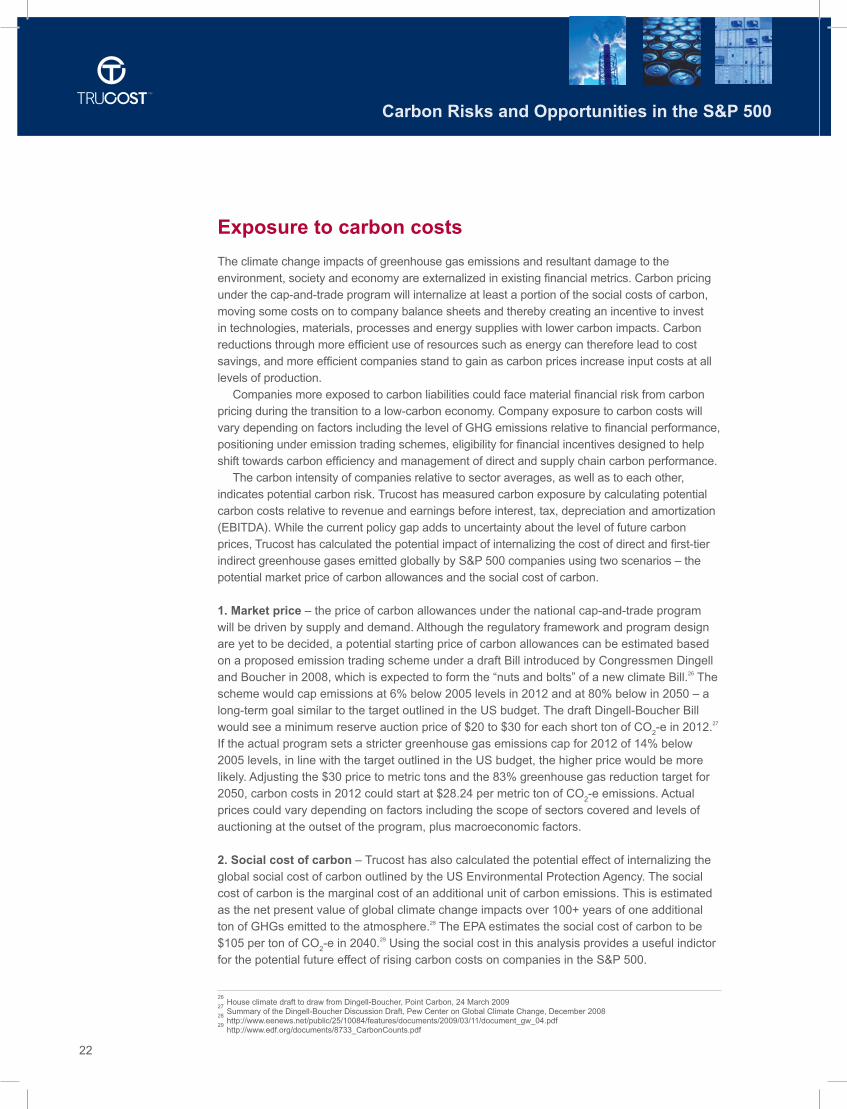
Chart 8 indicates the potential average effects of the market and social carbon prices on revenue and EBITDA in the S&P 500.
Chart 8: Average carbon exposure of the S&P 500 to carbon prices
A carbon price of $28.24/tCO2-e applied to global direct and first-tier supplier emissions
would amount to a total of $92,819 million in carbon costs. This equates to 1.08% of revenue from companies in the S&P 500.30
The average cost of internalizing CO2-e using the higher social cost of carbon ($105/ tCO
2-
e) equates to almost $345,116 million, or 4% of revenue.
Almost 5.5% of combined EBITDA in the S&P 500 would be at risk from the projected market cost of carbon, while an average of 20% of EBITDA would be exposed if the social cost of carbon were applied to emissions. This indicates potential exposure to escalating carbon costs in the future.
•
•
•
25%
20%
15%
10%
5%
0%
Carbon cost/$ mn revenue
Car
bon
cost
as
perc
enta
ge o
f fin
anci
al m
etri
cs
Carbon cost/$ mn EBITDA
US projected market cost ofcarbon ($28.24/tCO2-e)
EPA social cost ofcarbon ($105/tCO2-e)
30 Holdings data as at 28 February 2009

24
Carbon Risks and Opportunities in the S&P 500
Carbon costs relative to revenue
Trucost has calculated the significance of a $28.24/tCO2-e market price of carbon allowances
relative to the revenue of different sectors and companies in the S&P 500. Carbon costs are applied to both direct and indirect emissions from first-tier suppliers. Chart 9 shows the sectors with the greatest carbon costs as a percentage of revenue.
Chart 9: Potential carbon liability by sector
Carbon costs would average between 1% and 12% of revenue in five sectors: Utilities, Basic Resources, Chemicals, Oil & Gas and Food & Beverage. These sectors are also the five most carbon intensive (see Chart 5 on page 17).
Carbon costs would amount to less than 1% of revenue for the 14 other sectors analyzed.
The Utilities sector faces significantly greater exposure to carbon costs relative to revenue than any other sector. If the market price of $28.24/tCO
2-e were applied to direct and
first-tier emissions, combined carbon costs for the 34 Utilities companies would amount to $39,028 million, which equates to an average of 12% of revenue in the sector. Although there will be some potential to pass through carbon costs to electricity users, carbon-intensive power generators relative to sector peers will be most exposed to liabilities. Those with long-term supply contracts and limited ability to raise prices will be forced to absorb a proportion of carbon costs unless they reduce dependence on fossil fuels by 2012.
Basic Resources is the next most exposed sector, with carbon costs amounting to over $6,522 million for the 13 companies analyzed, or 4.4% of combined revenues. Many of the companies in the Basic Resources sector operate outside of the US and may therefore be exposed to carbon costs in other markets.
•
•
•
•
14%
12%
10%
8%
6%
4%
2%
0%Car
bon
cost
s ($
28.2
4/tC
O2-
e) a
s %
of
reve
nue
Utilitie
s
Basic
Resou
rces
Chem
icals
Oil & G
as
Food
& Bev
erag
e
Trave
l & L
eisur
e
Perso
nal &
Hou
seho
ld Goo
ds
Indu
strial
Goo
ds &
Ser
vices
Constr
uctio
n & M
ater
ials

25
Carbon Risks and Opportunities in the S&P 500
Chemicals sector industrial customers are potentially exposed to the pass through of $4,206 million in carbon costs. Chemicals companies supply industries including rubber and plastic producers, petroleum refiners, pulp and papermakers and primary metals producers.31
Company exposure to carbon liabilities
Carbon exposure varies at a company level. Carbon costs at $28.24 per ton of CO2-e would
equate to at least 1% of revenue for 109 companies. For 32 companies, carbon costs would equate to over 5% of revenue. Chart 10 indicates the 15 companies which face the greatest potential carbon exposure by revenue, based on direct and first-tier supplier emissions.
Chart 10: Potential carbon exposure by company
For the 15 companies with the greatest exposure, a carbon price of $28.24 applied to each ton of direct and first-tier indirect emissions would amount to carbon costs of more than $28.6 billion. This equates to between 12.8% (Edison International) and 42.8% of revenue (Allegheny Energy, the most carbon-intensive company in the index).
•
•
31 http://www.eia.doe.gov/emeu/mecs/iab/chemicals/
Allegh
eny E
nerg
y
45%
40%
35%
30%
25%
20%
15%
10%
5%
0%
Amer
ican
Electri
c Pow
er C
ompa
ny
Dyneg
y Inc
.
The S
outh
ern
Compa
ny
Amer
en C
orpo
ratio
n
Duke
Energ
y
AES Cor
pora
tion
Progr
ess E
nerg
y
Xcel E
nerg
y
DTE Ene
rgy
Pinnac
le W
est C
apita
l Cor
pora
tion
Wisc
onsin
Ene
rgy C
orpo
ratio
n
PPL Cor
pora
tion
Teco
Ene
rgy I
nc.
Edison
Inte
rnat
ional
Car
bon
cost
s ($
28.2
4/tC
O2-
e) a
s %
of
reve
nue

26
Carbon Risks and Opportunities in the S&P 500
12 other Utilities companies are among the 15 most exposed, and would face carbon costs amounting to 13%-35% of revenue: Teco Energy, PPL Corporation, Wisconsin Energy Corporation, Pinnacle West Capital Corporation, DTE Energy, Xcel Energy, Progress Energy, AES Corporation, Duke Energy, Ameren Corporation, The Southern Company and American Electric Power Company.
Carbon costs could represent 31% of revenue for the carbon-intensive Oil & Gas company Dynegy.
For 388 companies, carbon costs could represent less than 1% of revenue.
If a higher carbon price such as the social cost of carbon ($105/tCO2-e) were applied to
direct and indirect emissions, carbon liabilities would become more material for many of the companies in the S&P 500. The ability of companies to reduce carbon exposure or pass carbon costs on to customers will influence their capacity to retain market share and remain profitable relative to sector peers.
Carbon costs relative to earnings
To identify which sectors are most at risk from loss of earnings, Trucost has calculated the potential effect of projected carbon costs on EBITDA. The estimated market price of carbon allowances ($28.24) under a cap-and-trade scheme from 2012 is applied to global direct and first-tier supply chain emissions associated with companies in the S&P 500. Carbon costs are measured relative to EBITDA to indicate potential financial risk from carbon costs. Analysis of carbon cost impacts on EBITDA can be conducted across companies in an investment fund in order to identify potential risk to returns.
Chart 11 indicates the five sectors where an average of 9%-45% or more of EBITDA is exposed to carbon costs, as well as the range in EBITDA at risk in these sectors at a company level.
•
•
•

27
Carbon Risks and Opportunities in the S&P 500
Chart 11: Percentage of EBITDA at risk from carbon costs by sector
The range in company-level financial risk is greatest in the Utilities, Basic Resources, Food & Beverage, Chemicals and Oil & Gas sectors. These sectors could see overall EBITDA at risk of 9% or more.
For seven sectors, carbon costs could amount to less than 1% of EBITDA: Banks, Financial Services, Healthcare, Insurance, Media, Real Estate and Telecommunications.
On average, carbon costs would equate to 1% or more of EBITDA in the other 11 sectors analyzed.
The Utilities sector is most exposed to carbon costs, with almost half of EBITDA at risk across the sector, depending on the ability of companies to pass costs
through to customers or switch to low-carbon power generation. Within the sector, carbon costs as a percentage of EBITDA at a company level ranges from 2% for PG&E Corporation to 117% for American Electric Power.
294 companies analyzed would see more than 1% of EBITDA at risk from carbon costs. Of these, 71 could see earnings fall by 10% or more unless they are able to pass carbon costs on in higher prices.
For three companies, carbon costs could wipe out all earnings: Allegheny Energy, American Electric Power and Ameren Corporation. Eleven other companies had negative EBITDA even before carbon costs were internalized.
For 203 companies, carbon costs would equate to less than 1% of EBITDA.
•
•
•
•
•
•
•
Maximum
Minimum
Market cost of carbon/EBITDA
Car
bon
cost
s ($
28.2
4/tC
O2-
e) a
s %
EB
ITD
A
120%
100%
80%
60%
40%
20%
0%
Utilitie
s
Basic
Resou
rces
Food
& Bev
erag
e
Chem
icals
Oil & G
as
“ Potential EBITDA at risk from carbon costs varies most significantly among companies in the Utilities sector. ”
28
Carbon Risks and Opportunities in the S&P 500
Carbon disclosure set to improve
Corporate greenhouse gas reporting requirements
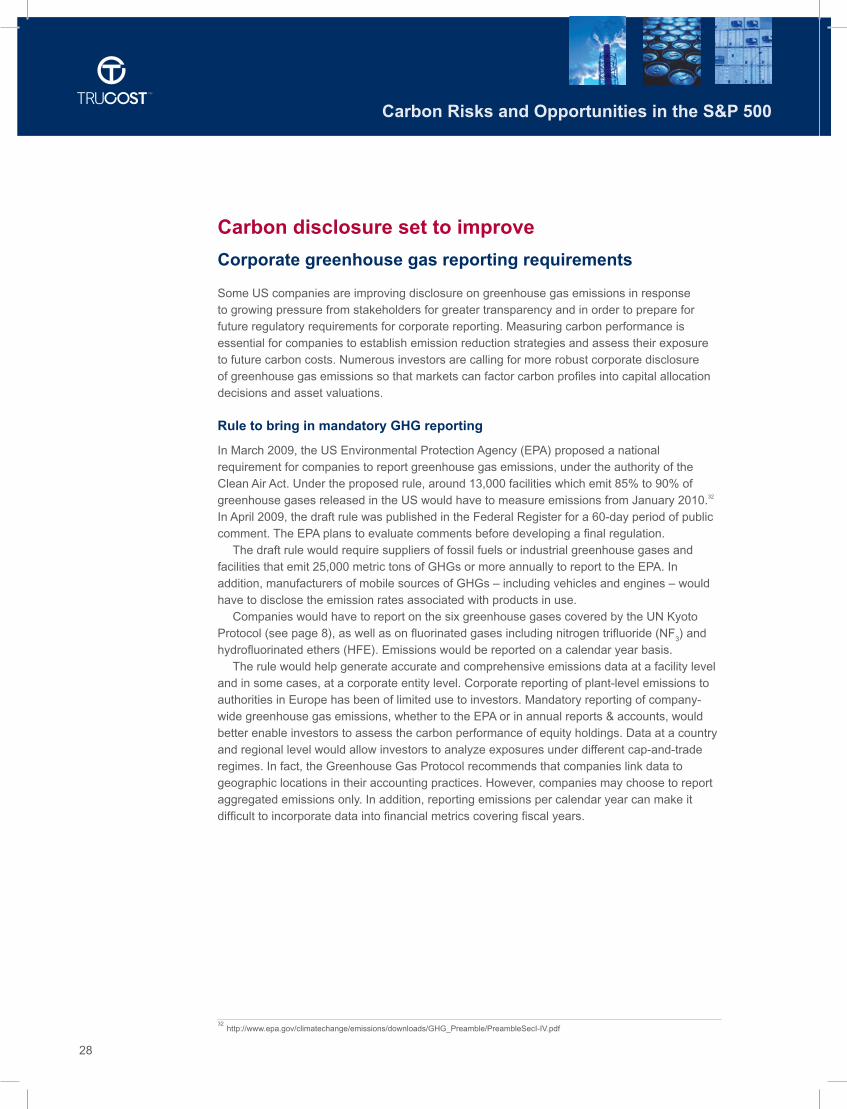
Some US companies are improving disclosure on greenhouse gas emissions in response to growing pressure from stakeholders for greater transparency and in order to prepare for future regulatory requirements for corporate reporting. Measuring carbon performance is essential for companies to establish emission reduction strategies and assess their exposure to future carbon costs. Numerous investors are calling for more robust corporate disclosure of greenhouse gas emissions so that markets can factor carbon profiles into capital allocation decisions and asset valuations.
Rule to bring in mandatory GHG reporting
In March 2009, the US Environmental Protection Agency (EPA) proposed a national requirement for companies to report greenhouse gas emissions, under the authority of the Clean Air Act. Under the proposed rule, around 13,000 facilities which emit 85% to 90% of greenhouse gases released in the US would have to measure emissions from January 2010.32 In April 2009, the draft rule was published in the Federal Register for a 60-day period of public comment. The EPA plans to evaluate comments before developing a final regulation.
The draft rule would require suppliers of fossil fuels or industrial greenhouse gases and facilities that emit 25,000 metric tons of GHGs or more annually to report to the EPA. In addition, manufacturers of mobile sources of GHGs – including vehicles and engines – would have to disclose the emission rates associated with products in use.
Companies would have to report on the six greenhouse gases covered by the UN Kyoto Protocol (see page 8), as well as on fluorinated gases including nitrogen trifluoride (NF
3) and
hydrofluorinated ethers (HFE). Emissions would be reported on a calendar year basis. The rule would help generate accurate and comprehensive emissions data at a facility level
and in some cases, at a corporate entity level. Corporate reporting of plant-level emissions to authorities in Europe has been of limited use to investors. Mandatory reporting of company-wide greenhouse gas emissions, whether to the EPA or in annual reports & accounts, would better enable investors to assess the carbon performance of equity holdings. Data at a country and regional level would allow investors to analyze exposures under different cap-and-trade regimes. In fact, the Greenhouse Gas Protocol recommends that companies link data to geographic locations in their accounting practices. However, companies may choose to report aggregated emissions only. In addition, reporting emissions per calendar year can make it difficult to incorporate data into financial metrics covering fiscal years.
32 http://www.epa.gov/climatechange/emissions/downloads/GHG_Preamble/PreambleSecI-IV.pdf

29
Carbon Risks and Opportunities in the S&P 500
Regional and state reporting requirements
Reporting requirements are being introduced under the regional cap-and-trade programs. Utilities in states participating in the Regional Greenhouse Gas Initiative (RGGI) must disclose GHG emissions from facilities where more than 25 Megawatts of electricity is generated. Disclosure requirements under the Midwestern Greenhouse Gas Reduction Accord and the Western Climate Initiative are still being developed, but many more companies will be expected to report emissions as both schemes will apply caps economy-wide.
Seventeen US States have already introduced, or are developing, mandatory GHG reporting requirements: California, Colorado, Connecticut, Delaware, Hawaii, Iowa, Maine, Maryland, Massachusetts, New Jersey, New Mexico, North Carolina, Oregon, Virginia, Washington, West Virginia, and Wisconsin. The specific reporting rules differ between States on which facilities must report and which GHGs must be reported.
Carbon disclosure by S&P 500 companies
Trucost assessed the quantity and quality of greenhouse gas emission disclosures by companies in the S&P 500 Index. By examining annual reports & accounts, environmental and other sustainability reports, as well as company websites, Trucost analyzed the number of companies that disclosed greenhouse gases emitted during 2007. Chart 12 indicates the proportion of companies that disclosed direct greenhouse gas emissions from operations.
Chart 12: Carbon disclosure by S&P 500 companies (Scope 1 – direct emissions)
15% of companies in the S&P 500 disclosed carbon data for 2007 either publicly or through personal communications with Trucost. Companies are considered to have disclosed where emissions data is adequate for all business operations according to the Greenhouse Gas Protocol. Although some 45% of S&P 500 companies provided some information to the Carbon Disclosure Project in 2008, this may not be comprehensive, quantified and standardized data that is publicly available and directly comparable to other companies. All 497 companies analyzed by Trucost were given the opportunity to review and verify their data. During the data verification process, some companies provided Trucost with additional information that was not publicly disclosed.
•
Not Disclosed
Disclosed
Derived
100%
80%
60%
40%
20%
0%
S&P 500
Per
cent
age
of c
ompa
nies
15%
19%
66%

30
Carbon Risks and Opportunities in the S&P 500
A further 19% disclosed data on resource use that Trucost was able to use to derive greenhouse gas emissions. For example, data on electricity consumption and fuel use can be converted using emissions factors. Emissions were also derived for 2007 from data disclosed for previous years.
66% of companies do not disclose adequate carbon data or resource use. For companies that do not disclose adequate information, Trucost uses its environmental profiling system to calculate the likely emissions (see Trucost methodology on page 35).
Chart 13 highlights the number of companies that disclose direct carbon emissions publicly or through communications to Trucost in each ICB Super Sector.
Chart 13: Disclosure of direct GHG emissions by sector
Nearly 90% of companies in the carbon-intensive Utilities sector disclose carbon data for operations.
Around two-thirds of Chemicals and Basic Resources companies disclose GHG emissions data from industrial processes and fuel use.
•
•
•
•
Percentage of companies that disclose emissions
0% 10% 20% 30% 40% 50% 60% 70% 80% 90% 100%
Real Estate
Financial Services
Telecommunications
Media
Retail
Insurance
Travel & Leisure
Personal & Household Goods
Industrial Goods & Services
Banks
Construction & Materials
Technology
Food & Beverage
Healthcare
Oil & Gas
Automobile & Parts
Basic Resources
Chemicals
Utilities
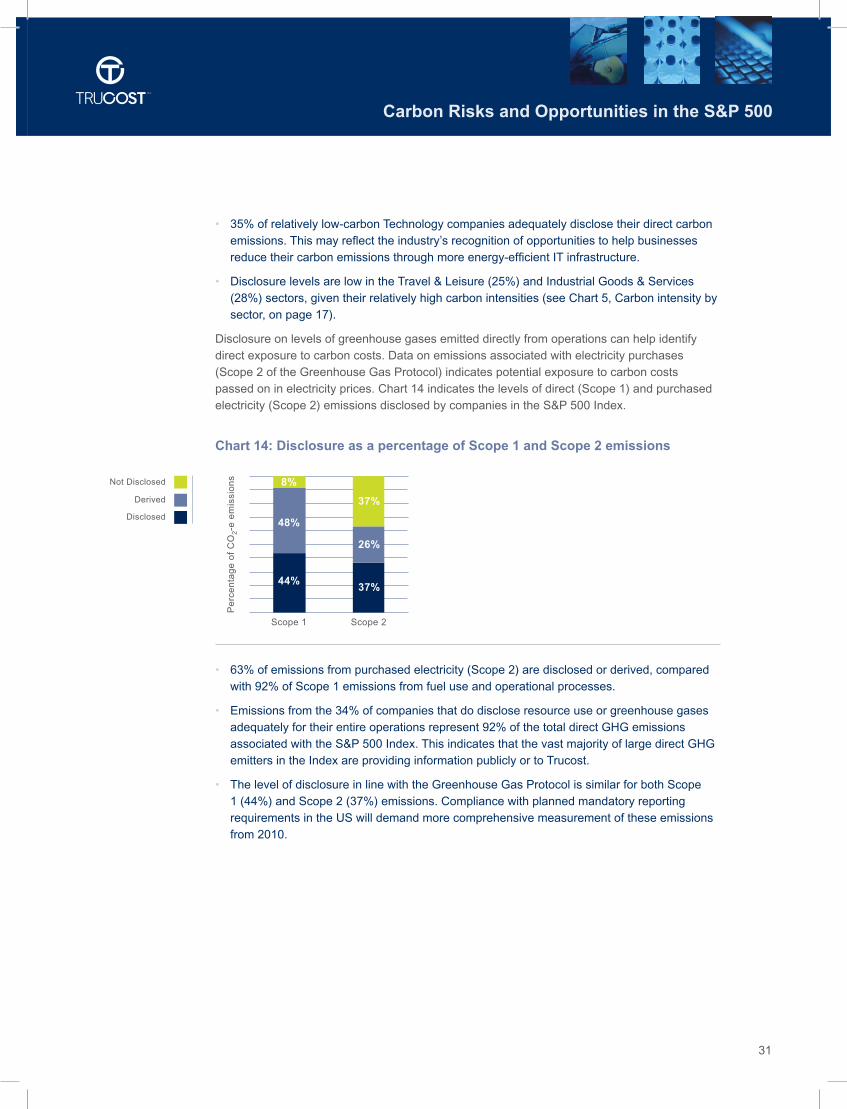
31
Carbon Risks and Opportunities in the S&P 500
35% of relatively low-carbon Technology companies adequately disclose their direct carbon emissions. This may reflect the industry’s recognition of opportunities to help businesses reduce their carbon emissions through more energy-efficient IT infrastructure.
Disclosure levels are low in the Travel & Leisure (25%) and Industrial Goods & Services (28%) sectors, given their relatively high carbon intensities (see Chart 5, Carbon intensity by sector, on page 17).
Disclosure on levels of greenhouse gases emitted directly from operations can help identify direct exposure to carbon costs. Data on emissions associated with electricity purchases (Scope 2 of the Greenhouse Gas Protocol) indicates potential exposure to carbon costs passed on in electricity prices. Chart 14 indicates the levels of direct (Scope 1) and purchased electricity (Scope 2) emissions disclosed by companies in the S&P 500 Index.
Chart 14: Disclosure as a percentage of Scope 1 and Scope 2 emissions
63% of emissions from purchased electricity (Scope 2) are disclosed or derived, compared with 92% of Scope 1 emissions from fuel use and operational processes.
Emissions from the 34% of companies that do disclose resource use or greenhouse gases adequately for their entire operations represent 92% of the total direct GHG emissions associated with the S&P 500 Index. This indicates that the vast majority of large direct GHG emitters in the Index are providing information publicly or to Trucost.
The level of disclosure in line with the Greenhouse Gas Protocol is similar for both Scope 1 (44%) and Scope 2 (37%) emissions. Compliance with planned mandatory reporting requirements in the US will demand more comprehensive measurement of these emissions from 2010.
•
•
•
•
•
Not Disclosed
Disclosed
Derived
Scope 1
Per
cent
age
of C
O2-
e em
issi
ons
Scope 2
37%
26%
37%
44%
48%
8%

32
Carbon Risks and Opportunities in the S&P 500
Managing carbon exposure
Measuring carbon performance is a vital starting point for companies and investors seeking to manage carbon risks and opportunities under carbon pricing programs. Carbon profiles help assess which companies are most exposed to carbon liabilities, and which stand to gain in a
carbon-constrained economy. More comprehensive and standardised disclosure on
greenhouse gas emissions under mandatory reporting requirements should help to identify potential carbon costs under cap-and-trade schemes. Companies in high-impact sectors such as Utilities and Basic Resources will be expected to report emissions at a facility level as well as company-wide and to be accountable for these emissions.
Financial analysis of carbon exposure requires data on corporate emissions at a company level, disclosed
in annual reports & accounts, environmental or sustainability reports, or on their websites. Transparency on global company-wide emissions and the quantities and geographic locations of emissions covered by cap-and-trade programs would help ensure carbon performance can be considered alongside other investor-relevant liabilities and opportunities.
Companies could also examine significant sources of emissions in their supply chains to identify and manage exposure to the risk of carbon costs being passed on by suppliers through higher prices.
Companies seeking to provide appropriate information to investors under the proposed cap-and-trade plan could consider the following actions:
Measure and report Scope 1 and Scope 2 greenhouse gas emissions for entire operations in line with the Greenhouse Gas Protocol.
Disclose the geographic location of emissions.
Identify significant carbon emissions from supply chains separately.
Assess exposure to carbon costs under emissions trading schemes.
Develop a strategy to manage carbon exposure and adaptation to climate change impacts.
•
•
•
•
•
“ Robust data on corporate carbon performance is vital for companies and investors to manage carbon risks and opportunities. ”
33
Carbon Risks and Opportunities in the S&P 500
One recent development within the institutional investing arena is that some asset owners and managers have begun to invest in companies that are on a clear path to reducing their emissions, or that provide “solutions” such as energy efficiency and clean technologies and renewable energy supplies. For instance, the Norwegian Government Pension Fund – Global announced plans in April 2009 to allocate approximately $2.8 billion to an environmental programme, including investments in “climate-friendly energy” and improving energy efficiency.33
Carbon-efficient investment funds are set to be well positioned during the shift to a low-carbon economy. Given the potential exposure to carbon costs which have previously been external to a company’s financial reports, investors could consider the following actions:
Develop an investment position on climate change.
Assess material climate risks to fund returns.
Incorporate criteria on carbon disclosure and performance into active ownership practices.
Develop capacity to evaluate carbon exposure in stock selections.
•
•
•
•
33 http://www.regjeringen.no/en/dep/fin/press-center/Press-releases/2009/government-pension-fund-climate-on-the-a.html?id=554070
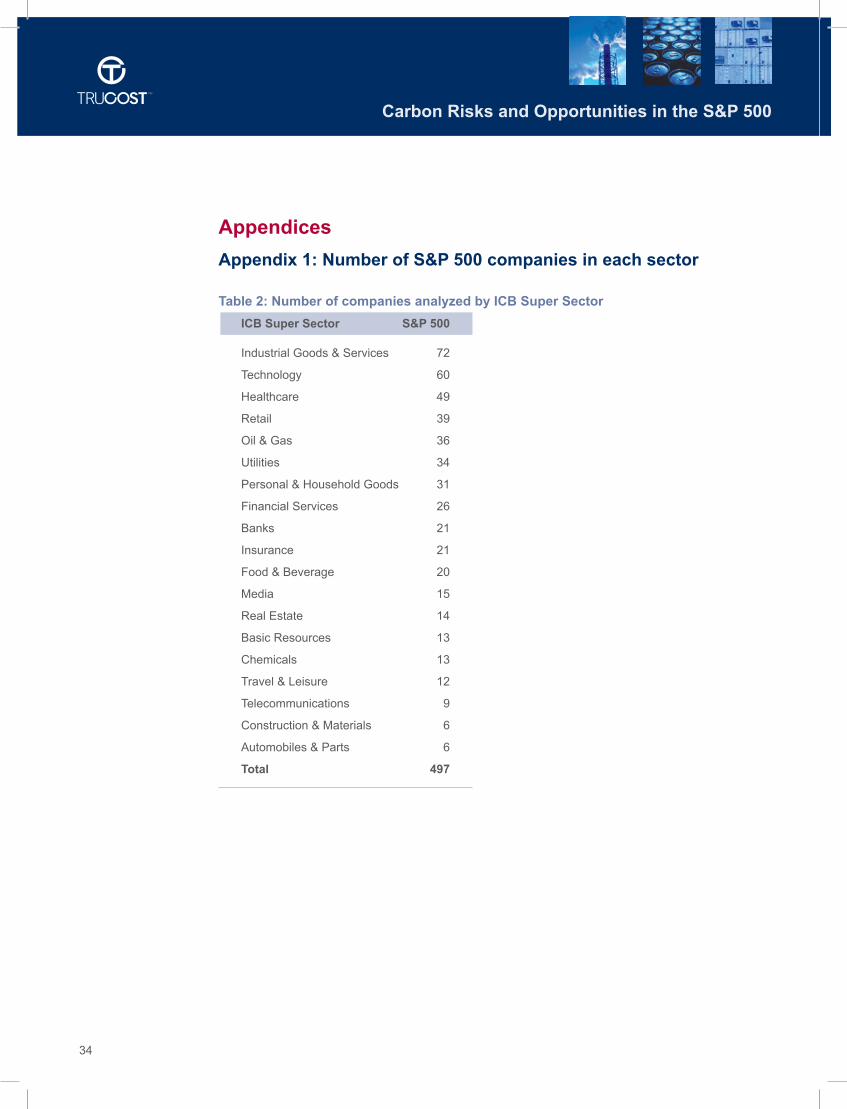
34
Carbon Risks and Opportunities in the S&P 500
Appendices
Appendix 1: Number of S&P 500 companies in each sector
Table 2: Number of companies analyzed by ICB Super Sector
ICB Super Sector S&P 500
Industrial Goods & Services 72
Technology 60
Healthcare 49
Retail 39
Oil & Gas 36
Utilities 34
Personal & Household Goods 31
Financial Services 26
Banks 21
Insurance 21
Food & Beverage 20
Media 15
Real Estate 14
Basic Resources 13
Chemicals 13
Travel & Leisure 12
Telecommunications 9
Construction & Materials 6
Automobiles & Parts 6
Total 497

35
Carbon Risks and Opportunities in the S&P 500
Appendix 2: Trucost methodology
Trucost’s database of the environmental impacts of over 4,500 companies globally incorporates data where available in company annual reports & accounts, environmental/sustainability reports, corporate websites and other public disclosures.
However, many companies do not disclose carbon impacts. Where there is no public disclosure, Trucost employs its environmental profiling system. A proprietary input-output model calculates emissions by analyzing companies on a segmental basis. Standard emission profiles are applied to over 464 business activities or processes to calculate levels of environmental resource use and non-product output resulting from the activities of any company in a given sub-sector.
Emission profiles have been developed using data from sources including national pollution and emission registries and environmental accounts. The model, overseen by an academic advisory panel, analyzes the quantities and environmental damage costs of over 720 different types of environmental impacts. Trucost’s comprehensive data allowed this analysis to cover all companies in the S&P 500 Index, not just those that disclose environmental information.
Nine greenhouse gas emissions are covered in Trucost’s database, including six defined by the Kyoto Protocol (see page 8). The other three are: Methyl Chloroform, Bromotrifluoromethane and Tetrachloromethane. Different GHG emissions are converted to carbon dioxide-equivalent (CO
2-e) emissions based on Global Warming Potential factors
published by the Intergovernmental Panel on Climate Change. Although carbon dioxide is the least potent of all the GHGs, it is the most prevalent in terms of its contribution to climate change.
Trucost uses its global input-output model to calculate supply chain emissions. Most companies are not major emitters of direct greenhouse gases. In a number of sectors indirect greenhouse gas emissions are greater than direct emissions. Each company’s emissions are then aggregated to form a total for the S&P 500.
Because the indirect emissions for one company could also be the direct emissions for another, the analysis of the index contains some element of double-counting. Nevertheless, this does not affect the comparison between the indices and companies, since the same approach is used to calculate their emissions. Adopting this method prevents accountability for emissions from effectively being outsourced to sources outside of a company or an index and helps identify indirect exposure to carbon costs. To limit any issues associated with double-counting of greenhouse gas emissions associated with each company analyzed, Trucost includes the direct and first-tier indirect emissions only in carbon intensity and carbon exposure calculations unless stated otherwise.
Trucost’s quantitative approach enables the comparison of the carbon performance of businesses of different sizes within different industries. The lower the carbon intensity, the lower the exposure to the rising costs of emitting carbon.
Dual-listed companies – those listed both on the S&P 500 and on a stock market elsewhere – are treated as single entities.
S&P 500 data analyzed in this report is not free-float adjusted, unlike in Carbon Counts
USA: The Carbon Footprints of Mutual Funds in the US. In that report, Trucost assesses the carbon footprints of 91 mutual funds with a combined value of $1,155,067 million. Carbon
Counts USA, produced in partnership with Lipper, can be downloaded at www.trucost.com/publishedresearch.
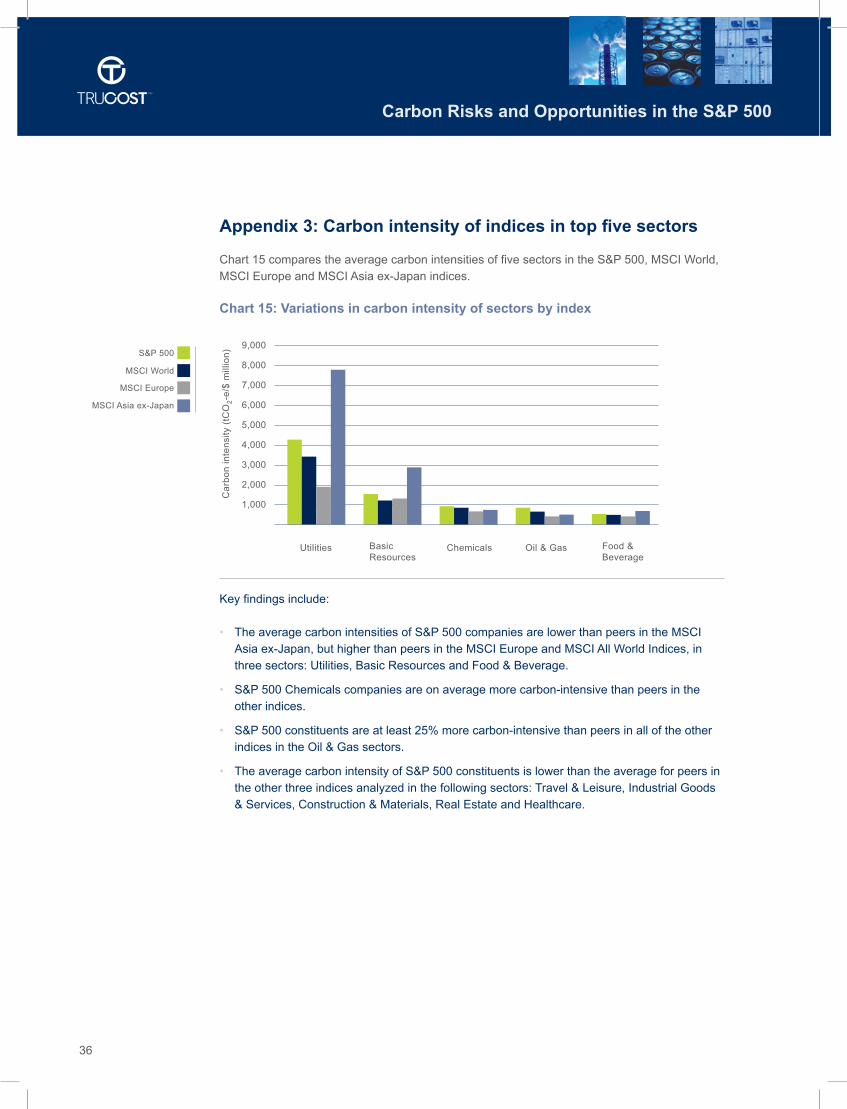
36
Carbon Risks and Opportunities in the S&P 500
Appendix 3: Carbon intensity of indices in top five sectors
Chart 15 compares the average carbon intensities of five sectors in the S&P 500, MSCI World, MSCI Europe and MSCI Asia ex-Japan indices.
Chart 15: Variations in carbon intensity of sectors by index
Key findings include:
The average carbon intensities of S&P 500 companies are lower than peers in the MSCI Asia ex-Japan, but higher than peers in the MSCI Europe and MSCI All World Indices, in three sectors: Utilities, Basic Resources and Food & Beverage.
S&P 500 Chemicals companies are on average more carbon-intensive than peers in the other indices.
S&P 500 constituents are at least 25% more carbon-intensive than peers in all of the other indices in the Oil & Gas sectors.
The average carbon intensity of S&P 500 constituents is lower than the average for peers in the other three indices analyzed in the following sectors: Travel & Leisure, Industrial Goods & Services, Construction & Materials, Real Estate and Healthcare.
•
•
•
•
1,000
Utilities
Car
bon
inte
nsity
(tC
O2-
e/$
mill
ion)
Basic Resources
Chemicals Oil & Gas Food &Beverage
2,000
3,000
4,000
5,000
6,000
7,000
8,000
9,000S&P 500
MSCI Europe
MSCI World
MSCI Asia ex-Japan
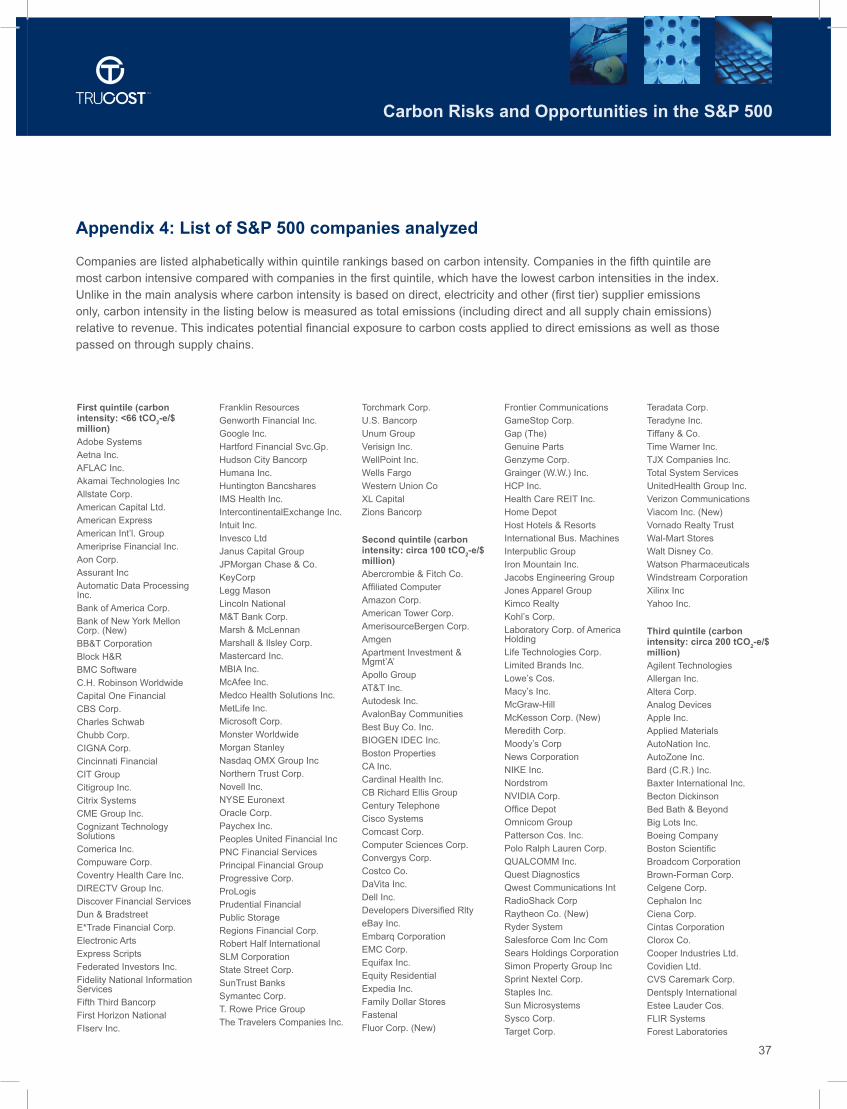
37
Carbon Risks and Opportunities in the S&P 500
Appendix 4: List of S&P 500 companies analyzed
Companies are listed alphabetically within quintile rankings based on carbon intensity. Companies in the fifth quintile are most carbon intensive compared with companies in the first quintile, which have the lowest carbon intensities in the index. Unlike in the main analysis where carbon intensity is based on direct, electricity and other (first tier) supplier emissions only, carbon intensity in the listing below is measured as total emissions (including direct and all supply chain emissions) relative to revenue. This indicates potential financial exposure to carbon costs applied to direct emissions as well as those passed on through supply chains.
First quintile (carbon intensity: <66 tCO
2-e/$
million)
Adobe Systems
Aetna Inc.
AFLAC Inc.
Akamai Technologies Inc
Allstate Corp.
American Capital Ltd.
American Express
American Int’l. Group
Ameriprise Financial Inc.
Aon Corp.
Assurant Inc
Automatic Data Processing Inc.
Bank of America Corp.
Bank of New York Mellon Corp. (New)
BB&T Corporation
Block H&R
BMC Software
C.H. Robinson Worldwide
Capital One Financial
CBS Corp.
Charles Schwab
Chubb Corp.
CIGNA Corp.
Cincinnati Financial
CIT Group
Citigroup Inc.
Citrix Systems
CME Group Inc.
Cognizant Technology Solutions
Comerica Inc.
Compuware Corp.
Coventry Health Care Inc.
DIRECTV Group Inc.
Discover Financial Services
Dun & Bradstreet
E*Trade Financial Corp.
Electronic Arts
Express Scripts
Federated Investors Inc.
Fidelity National Information Services
Fifth Third Bancorp
First Horizon National
FIserv Inc.
Franklin Resources
Genworth Financial Inc.
Google Inc.
Hartford Financial Svc.Gp.
Hudson City Bancorp
Humana Inc.
Huntington Bancshares
IMS Health Inc.
IntercontinentalExchange Inc.
Intuit Inc.
Invesco Ltd
Janus Capital Group
JPMorgan Chase & Co.
KeyCorp
Legg Mason
Lincoln National
M&T Bank Corp.
Marsh & McLennan
Marshall & Ilsley Corp.
Mastercard Inc.
MBIA Inc.
McAfee Inc.
Medco Health Solutions Inc.
MetLife Inc.
Microsoft Corp.
Monster Worldwide
Morgan Stanley
Nasdaq OMX Group Inc
Northern Trust Corp.
Novell Inc.
NYSE Euronext
Oracle Corp.
Paychex Inc.
Peoples United Financial Inc
PNC Financial Services
Principal Financial Group
Progressive Corp.
ProLogis
Prudential Financial
Public Storage
Regions Financial Corp.
Robert Half International
SLM Corporation
State Street Corp.
SunTrust Banks
Symantec Corp.
T. Rowe Price Group
The Travelers Companies Inc.
Torchmark Corp.
U.S. Bancorp
Unum Group
Verisign Inc.
WellPoint Inc.
Wells Fargo
Western Union Co
XL Capital
Zions Bancorp
Second quintile (carbon intensity: circa 100 tCO
2-e/$
million)
Abercrombie & Fitch Co.
Affiliated Computer
Amazon Corp.
American Tower Corp.
AmerisourceBergen Corp.
Amgen
Apartment Investment & Mgmt’A’
Apollo Group
AT&T Inc.
Autodesk Inc.
AvalonBay Communities
Best Buy Co. Inc.
BIOGEN IDEC Inc.
Boston Properties
CA Inc.
Cardinal Health Inc.
CB Richard Ellis Group
Century Telephone
Cisco Systems
Comcast Corp.
Computer Sciences Corp.
Convergys Corp.
Costco Co.
DaVita Inc.
Dell Inc.
Developers Diversified Rlty
eBay Inc.
Embarq Corporation
EMC Corp.
Equifax Inc.
Equity Residential
Expedia Inc.
Family Dollar Stores
Fastenal
Fluor Corp. (New)
Frontier Communications
GameStop Corp.
Gap (The)
Genuine Parts
Genzyme Corp.
Grainger (W.W.) Inc.
HCP Inc.
Health Care REIT Inc.
Home Depot
Host Hotels & Resorts
International Bus. Machines
Interpublic Group
Iron Mountain Inc.
Jacobs Engineering Group
Jones Apparel Group
Kimco Realty
Kohl’s Corp.
Laboratory Corp. of America Holding
Life Technologies Corp.
Limited Brands Inc.
Lowe’s Cos.
Macy’s Inc.
McGraw-Hill
McKesson Corp. (New)
Meredith Corp.
Moody’s Corp
News Corporation
NIKE Inc.
Nordstrom
NVIDIA Corp.
Office Depot
Omnicom Group
Patterson Cos. Inc.
Polo Ralph Lauren Corp.
QUALCOMM Inc.
Quest Diagnostics
Qwest Communications Int
RadioShack Corp
Raytheon Co. (New)
Ryder System
Salesforce Com Inc Com
Sears Holdings Corporation
Simon Property Group Inc
Sprint Nextel Corp.
Staples Inc.
Sun Microsystems
Sysco Corp.
Target Corp.
Teradata Corp.
Teradyne Inc.
Tiffany & Co.
Time Warner Inc.
TJX Companies Inc.
Total System Services
UnitedHealth Group Inc.
Verizon Communications
Viacom Inc. (New)
Vornado Realty Trust
Wal-Mart Stores
Walt Disney Co.
Watson Pharmaceuticals
Windstream Corporation
Xilinx Inc
Yahoo Inc.
Third quintile (carbon intensity: circa 200 tCO
2-e/$
million)
Agilent Technologies
Allergan Inc.
Altera Corp.
Analog Devices
Apple Inc.
Applied Materials
AutoNation Inc.
AutoZone Inc.
Bard (C.R.) Inc.
Baxter International Inc.
Becton Dickinson
Bed Bath & Beyond
Big Lots Inc.
Boeing Company
Boston Scientific
Broadcom Corporation
Brown-Forman Corp.
Celgene Corp.
Cephalon Inc
Ciena Corp.
Cintas Corporation
Clorox Co.
Cooper Industries Ltd.
Covidien Ltd.
CVS Caremark Corp.
Dentsply International
Estee Lauder Cos.
FLIR Systems
Forest Laboratories

38
Carbon Risks and Opportunities in the S&P 500
Gannett Co.
General Electric
Gilead Sciences
Goodrich Corporation
Harman Int’l Industries
Harris Corp.
Hewlett-Packard
Hospira Inc.
International Game Technology
Intuitive Surgical Inc.
Jabil Circuit
JDS Uniphase Corp.
Johnson & Johnson
Juniper Networks
King Pharmaceuticals
KLA-Tencor Corp.
Kroger Co.
L-3 Communications Holdings
Leucadia National Corp.
Lexmark Int’l Inc
Linear Technology Corp.
Lockheed Martin Corp.
Loews Corp.
LSI Corporation
Marriott Int’l.
McDonald’s Corp.
Medtronic Inc.
MEMC Electronic Materials
Merck & Co.
Microchip Technology
Micron Technology
Millipore Corp.
Molex Inc.
Motorola Inc.
Mylan Inc.
Nabors Industries Ltd.
NetApp Inc.
New York Times Cl. A
Northrop Grumman Corp.
Penney (J.C.)
PerkinElmer
Pfizer Inc.
Pitney-Bowes
Plum Creek Timber Co.
QLogic Corp.
Rockwell Collins
Safeway Inc.
SanDisk Corporation
Schering-Plough
Sherwin-Williams
Sigma-Aldrich
St Jude Medical
Starbucks Corp.
Starwood Hotels & Resorts
Stryker Corp.
Supervalu Inc.
Tellabs Inc.
Tenet Healthcare Corp.
Thermo Fisher Scientific
Tyco International (New)
United Parcel Service
Varian Medical Systems
Walgreen Co.
Washington Post
Waters Corporation
Whole Foods Market
Wyeth
Wyndham Worldwide
Wynn Resorts Ltd.
Zimmer Holdings
Fourth quintile (carbon intensity: circa 300-500 tCO
2-e/$ million)
Abbott Labs
Advanced Micro Devices
Amphenol Corp.
Apache Corp.
Avon Products
Baker Hughes
BJ Services
Black & Decker Corp.
Bristol-Myers Squibb
Cabot Oil & Gas
Cameron International Corp.
Caterpillar Inc.
CenterPoint Energy
Centex Corp.
Chesapeake Energy
Coach Inc.
Coca Cola Co.
Coca-Cola Enterprises
Colgate-Palmolive
Constellation Brands
Corning Inc.
Cummins Inc.
D.R. Horton
Danaher Corp.
Darden Restaurants
Deere & Co.
Devon Energy Corp.
Diamond Offshore Drilling
Donnelley (R.R.) & Sons
Dover Corp.
Eastman Kodak
Eaton Corp.
Ecolab Inc.
Emerson Electric
EOG Resources
EQT Corporation
FedEx Corporation
Flowserve Corporation
Ford Motor
Fortune Brands Inc.
General Dynamics
General Motors
Goldman Sachs Group
Goodyear Tire & Rubber
Halliburton Co.
Harley-Davidson
Hasbro Inc.
Honeywell Int’l Inc.
Illinois Tool Works
Ingersoll-Rand Co. Ltd.
Intel Corp.
International Flav/Frag
ITT Corporation
Johnson Controls
KB Home
Leggett & Platt
Lennar Corp.
Lilly (Eli) & Co.
Lorillard Inc.
Manitowoc Co.
Masco Corp.
Mattel Inc.
National Oilwell Varco Inc.
National Semiconductor
Newell Rubbermaid Co.
Noble Energy Inc
Novellus Systems
PACCAR Inc.
Pactiv Corp.
Pall Corp.
Parker-Hannifin
Pepsi Bottling Group
PG&E Corp.
Pioneer Natural Resources
Procter & Gamble
Pulte Homes Inc.
Range Resources Corp.
Republic Services
Reynolds American Inc.
Rockwell Automation Inc.
Rowan Cos.
Schlumberger Ltd.
Sealed Air Corp.(New)
Smith International
Snap-On Inc.
Southwestern Energy
Stanley Works
Stericycle Inc.
Texas Instruments
Textron Inc.
The Hershey Company
Tyco Electronics Ltd.
United Technologies
V.F. Corp.
Vulcan Materials
Waste Management Inc.
Whirlpool Corp.
Williams Cos.
Xerox Corp.
Yum! Brands Inc
Fifth quintile (carbon intensity: >570 tCO
2-e/$
million)
3M Company
AES Corp.
Air Products & Chemicals
AK Steel Holding Corp.
Alcoa Inc
Allegheny Energy
Allegheny Technologies Inc
Altria Group Inc.
Ameren Corporation
American Electric Power
Anadarko Petroleum
Archer-Daniels-Midland
Avery Dennison Corp.
Ball Corp.
Bemis Company
Burlington Northern Santa Fe C
Campbell Soup
Carnival Corp.
CF Industries Holdings Inc
Chevron Corp.
CMS Energy
ConAgra Foods Inc.
ConocoPhillips
CONSOL Energy Inc.
Consolidated Edison
Constellation Energy Group
CSX Corp.
Dean Foods
Dominion Resources
Dow Chemical
DTE Energy Co.
Du Pont (E.I.)
Duke Energy
Dynegy Inc.
Eastman Chemical
Edison Int’l
El Paso Corp.
ENSCO Int’l
Entergy Corp.
Exelon Corp.
Expeditors Int’l
Exxon Mobil Corp.
FirstEnergy Corp.
FPL Group
Freeport-McMoran Cp & Gld
General Mills
Heinz (H.J.)
Hess Corporation
Integrys Energy Group Inc.
International Paper
Kellogg Co.
Kimberly-Clark
Kraft Foods Inc-A
Marathon Oil Corp.
Massey Energy Company
McCormick & Co.
MeadWestvaco Corporation
Molson Coors Brewing Company
Monsanto Co.
Murphy Oil
Newmont Mining Corp. (Hldg. Co.)
NICOR Inc.
NiSource Inc.
Noble Corporation
Norfolk Southern Corp.
Nucor Corp.
Occidental Petroleum
Owens-Illinois
Peabody Energy
Pepco Holdings Inc.
PepsiCo Inc.
Pinnacle West Capital
PPG Industries
PPL Corp.
Praxair Inc.
Precision Castparts
Progress Energy Inc.
Public Serv. Enterprise Inc.
Questar Corp.
Rohm & Haas
Sara Lee Corp.
SCANA Corp .
Sempra Energy
Smucker (J.M.) (New)
Southern Co.
Southwest Airlines
Spectra Energy Corp.
Sunoco Inc.
TECO Energy
Tesoro Petroleum Co.
Titanium Metals Corp
Tyson Foods
Union Pacific
United States Steel Corp.
Valero Energy
Weyerhaeuser Corp.
Wisconsin Energy
Xcel Energy Inc
XTO Energy Inc.
Full year of data unavailable
Dr Pepper Snapple Group Inc
Philip Morris Intl.
Scripps Network Interactive Inc.

39
Carbon Risks and Opportunities in the S&P 500
About IRRCiThe Investor Responsibility Research Center Institute’s mission is to provide thought leadership at the intersection of corporate responsibility and the informational needs of investors. The Institute sponsors and promotes objective research, primarily in four areas: capital market structure and environmental, social and corporate governance issues as they relate to businesses. To maintain its objectivity, the institute does not take advocacy positions, but makes its research available to all.
The information used to compile this report has been collected from a number of sources in the public domain and from Trucost’s licensors. Whilst every care has been taken by Trucost in compiling this report, neither Trucost nor the IRRC Institute accept any liability whatsoever for any loss (including without limitation direct or indirect loss and any loss of profit, data, or economic loss) occasioned to any person nor for any damage, cost, claim or expense arising from any reliance on this report or any of its content (save only to the extent that the same may not be in law excluded). The information in this report does not constitute or form part of any offer, invitation to sell, offer to subscribe for or to purchase any shares or other securities and must not be relied upon in connection with any contract relating to any such matter. ‘Trucost’ is the trading name of Trucost Plc a public limited company registered in England, company number 3929223 whose registered office is at 1 London Wall, London EC2Y 5AB, United Kingdom.
Services for companies
Trucost helps companies measure and manage the carbon and environmental impacts of their business activities using readily available information.
Companies work with Trucost to:
Measure carbon and environmental impacts of their operations and supply chains.
Identify the most efficient strategies to reduce environmental impacts.
Cut costs and increase efficiency.
Meet existing and forthcoming reporting requirements.
Manage financial risk from future regulation and energy price increases.
Benchmark environmental performance against selected peers and sectors.
Demonstrate environmental credentials to customers, staff and other stakeholders.
•
•
•
•
•
•
•
Services for investors
With the largest and most comprehensive database of corporate environmental impacts covering most of the world’s major indices, Trucost enables investors to understand how environmental issues could affect companies’ future earnings.
Institutional investors and fund managers use Trucost’s company and fund data to:
Measure the carbon or environmental footprints of investments and funds.
Understand the financial risk to investments from potential environmental costs.
Engage with companies to improve their environmental performance.
Optimize investment strategies by rebalancing holdings to favor companies with greater carbon or environmental efficiency relative to sector peers, while maintaining financial returns and diversification.
Create new products – Trucost’s data underpins funds including the S&P U.S. Carbon Efficient Index, Deutsche Bank’s CROCI Carbon 100 and Carbon Alpha, GLG Partners’ GLG Environment Fund, Virgin Money’s Virgin Climate Change Fund, Merrill Lynch’s Carbon Leaders Europe Index, UBS’s Europe Carbon Optimized Index and NYSE Euronext’s Low Carbon 100 Europe Index.
•
•
•
•
•
•
Trucost Plc helps organizations measure and reduce the carbon and environmental impacts of their operations, supply chains, investments, products and services.
About Trucost

Carbon Risks and Opportunities in the S&P 500 is produced by Trucost Plc.
60 State Street, Suite 700, Boston MA 02109, USA
Research Analyst: Dr. James Salo Research Editor: Liesel van Ast
For further information contact Trucost at:
NORTH AMERICA Cary Krosinsky + 1 203 671 1342Dr. James Salo + 1 508 769 5053
UK & INTERNATIONAL Neil McIndoe + 44 (0)20 7160 9813
[email protected] www.trucost.com
Design: Pad Creative Ltd www.padcreative.co.uk
Print: Plus Five Print Solutions Ltdwww.plus5print.com
Printed on Revive 50:50 SilkRevive 50:50 – Certified as an FSC mixed sources grade containing 50% recycled waste and 50% virgin fibre.
© Copyright Trucost 2009
Commissioned by the IRRCi
1 Chase Manhattan Pl, 44th Floor New York, NY 10005, USA
Phone: + 1 646 778 4193Fax: + 1 646 778 4192
www.irrcinstitute.org
June 2009