Carbon Performance Assessment of aluminium producers: note ...
21
Carbon Performance Assessment of aluminium producers: note on methodology February 2019 Simon Dietz, Valentin Jahn and Jolien Noels
Transcript of Carbon Performance Assessment of aluminium producers: note ...

Carbon Performance Assessment of
aluminium producers:
note on methodology
February 2019
Simon Dietz, Valentin Jahn
and Jolien Noels

2
CONTENTS
1. Introduction ................................................................................................. 3
2. The basis for TPI’s carbon performance assessment: the Sectoral Decarbonization Approach .................................................................................. 4
3. How TPI is applying the SDA .......................................................................... 6
3.1. Deriving the benchmark paths ................................................................................. 6
3.2. Calculating company emissions intensities ................................................................ 9
3.3. Emissions reporting boundaries ............................................................................... 10
3.4. Data sources and validation ................................................................................... 10
3.5. Responding to companies ...................................................................................... 11
3.6. Presentation of assessment on TPI website .............................................................. 11
4. Specific considerations in the assessment of aluminium producers ................ 12
4.1. Measure of emissions intensity ................................................................................ 12
4.2. Coverage of aluminium-making facilities ................................................................. 13
4.3. Coverage of target ................................................................................................ 13
4.3. Worked examples .................................................................................................. 14
5. Discussion ................................................................................................... 17
5.1. General issues ........................................................................................................ 17
5.2. Issues specific to aluminium producers .................................................................... 17
6. Disclaimer .................................................................................................. 19
7. Bibliography ............................................................................................... 20
3
1. INTRODUCTION
The Transition Pathway Initiative (TPI) is a global initiative led by asset owners and supported by asset managers. Established in January 2017, TPI investors now collectively represent more than 40 supporters with over £10.3/$13.3 trillion of assets under management.1
On an annual basis, TPI assesses how companies are preparing for the transition to a low-carbon economy in terms of their:
Management Quality – all companies are assessed on the quality of their governance/management of greenhouse gas emissions and of risks and opportunities related to the low-carbon transition;
Carbon Performance – in selected sectors, TPI quantitatively benchmarks companies’ carbon emissions against international climate targets made as part of the 2015 UN Paris Agreement.
TPI publishes the results of its analysis through an open access online tool hosted by the Grantham Research Institute on Climate Change and the Environment at the London School of Economics (LSE): www.transitionpathwayinitiative.org.
Investors are encouraged to use the data, indicators and online tool to inform their investment research, decision making, engagement with companies, proxy voting and dialogue with fund managers and policy makers, bearing in mind the Disclaimer that can be found in section 6. Further details of how investors can use TPI assessments can be found on our website at www.lse.ac.uk/GranthamInstitute/tpi/about/how-investors-can-use-tpi/.
The purpose of this note is to provide an overview of the methodology being followed by TPI in its assessment of the Carbon Performance of aluminium producers.
1 As of 12th November 2018.

4
2. THE BASIS FOR TPI’S CARBON PERFORMANCE ASSESSMENT: THE
SECTORAL DECARBONIZATION APPROACH
TPI’s Carbon Performance assessment is based on the Sectoral Decarbonization Approach (SDA).[1] The SDA translates greenhouse gas emissions targets made at the international level (e.g. under the Paris Agreement to the UN Framework Convention on Climate Change) into appropriate benchmarks, against which the performance of individual companies can be compared.2
The SDA is built on the principle of recognising that different sectors of the economy (e.g. oil and gas production, electricity generation and automobile manufacturing) face different challenges arising from the low-carbon transition, including where emissions are concentrated in the value chain, and how costly it is to reduce emissions. Other approaches to translating international emissions targets into company benchmarks have applied the same decarbonization pathway to all sectors, regardless of these differences.[2]
Therefore the SDA takes a sector-by-sector approach, comparing companies within each sector against each other and against sector-specific benchmarks, which establish the performance of an average company that is aligned with international emissions targets.
Applying the SDA can be broken down into the following steps:
A global carbon budget is established, which is consistent with international emissions targets, for example keeping global warming below 2°C. To do this rigorously, some input from a climate model is required.
The global carbon budget is allocated across time and to different regions and industrial sectors. This typically requires an integrated economy-energy model, and these models usually allocate emissions reductions by region and by sector according to where it is cheapest to reduce emissions and when (i.e. the allocation is cost-effective). Cost-effectiveness is, however, subject to some constraints, such as political and public preferences, and the availability of capital. This step is therefore driven primarily by economic and engineering considerations, but with some awareness of political and social factors.
In order to compare companies of different sizes, sectoral emissions are normalised by a relevant measure of sectoral activity (e.g. physical production, economic activity). This results in a benchmark pathway for emissions intensity in each sector:
Emissions intensity =Emissions
Activity
Assumptions about sectoral activity need to be consistent with the emissions modelled and therefore should be taken from the same economy-energy modelling, where possible.
2 Another initiative that is also using the SDA is the Science Based Targets Initiative (http://sciencebasedtargets.org/).
5
Companies’ recent and current emissions intensity is calculated and their future emissions intensity can be estimated based on emissions targets they have set (i.e. this assumes companies exactly meet their targets).3 Together these establish emissions intensity pathways for companies.
Companies’ emissions intensity pathways are compared with each other and with the relevant sectoral benchmark pathway.
3 Alternatively, future emissions intensity could be calculated based on other data provided by companies on their business strategy and capital expenditure plans.

6
3. HOW TPI IS APPLYING THE SDA
3.1. Deriving the benchmark paths
The key inputs to calculating the benchmark paths are:
A time path for carbon emissions, which is consistent with the delivery of a particular climate target (e.g. limiting global warming to 2°C). Consistency requires that cumulative carbon emissions are within the associated carbon budget.
A breakdown of this economy-wide emissions path into emissions from key sectors (the numerator of sectoral emissions intensity).
Consistent estimates of the time path of physical production from, or economic activity in, these key sectors (the denominator of sectoral emissions intensity).
For the aluminium sector, TPI obtains all three of these inputs from the International Energy Agency (IEA), via its biennial Energy Technology Perspectives report.[3] The IEA has established expertise in modelling the cost of achieving international emissions targets. It also provides unprecedented access to the modelling inputs and outputs in a form suitable for applying the SDA.
The IEA’s economy-energy model simulates the supply of energy and the path of emissions in different sectors burning fossil fuels, or consuming energy generated by burning fossil fuels, given assumptions about key inputs, such as economic and population growth.
In low-carbon scenarios, the IEA model minimises the cost of adhering to a carbon budget by always allocating emissions reductions to sectors where they can be made most cheaply, subject to some constraints as mentioned above. These scenarios are therefore cost-effective, within some limits of economic, political, social and technological feasibility.
The IEA’s work can be used to derive three benchmark emissions paths, against which companies are evaluated by TPI:
1. A Below 2 Degrees scenario, which is consistent with the overall aim of the Paris Agreement to hold “the increase in the global average temperature to well below 2°C above pre-industrial levels and to pursue efforts to limit the temperature increase to 1.5°C above pre-industrial levels”.[4]
2. A 2 Degrees scenario, which is also consistent with the overall aim of the Paris Agreement to limit warming, albeit at the low end of the range of ambition.
3. A Paris Pledges scenario, which is consistent with the global aggregate of emissions reductions pledged by countries as part of the Paris Agreement in the form of Nationally Determined Contributions or NDCs. Several studies have documented that this aggregate is currently insufficient to put the world on a path to limit warming to 2°C, even if it will constitute a departure from a business-as-usual trend.[5]–[7]

7
For each scenario, IEA modelling output provides sector-specific emissions paths. It also provides associated estimates of production in each sector. Alternatively input assumptions on overall economic growth can be used as a measure of sectoral activity (under the assumption that the sector grows at the same rate as the overall economy). Emissions are then divided by activity to derive sectoral pathways for emissions intensity.
Figure 1 Benchmark global carbon intensity paths for the aluminium sector
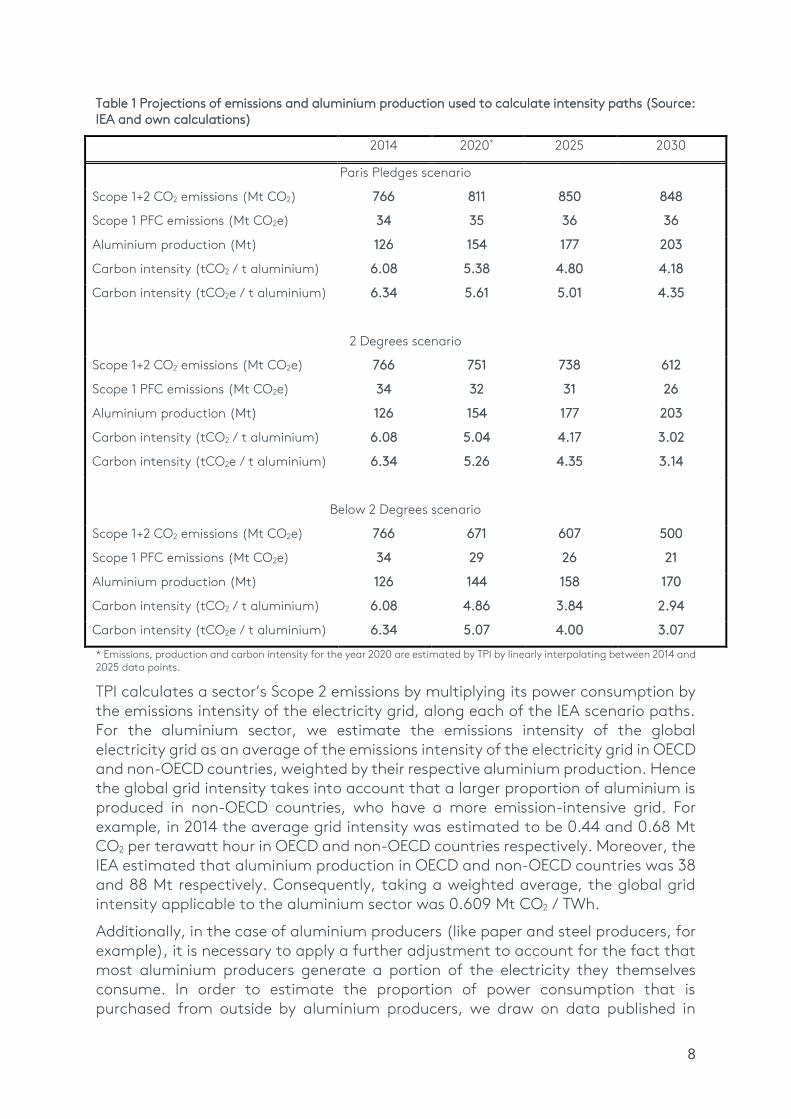
Figure 1 shows the benchmark emissions intensity paths for the aluminium sector, while Table 1 provides the underlying data on emissions and aluminium production. For example, under the Paris Pledges scenario in 2025, global Scope 1 and 2 emissions from the aluminium sector are projected to be 850 million metric tonnes or megatonnes of CO2. Under the same scenario, total aluminium production is projected to be 177 Mt in 2025. Therefore, the average carbon intensity of an aluminium producer aligned with the Paris Pledges path is 850 / 177 = 4.80 tonnes of CO2 per tonne of aluminium produced.
The IEA emissions intensity paths for the aluminium sector only include CO2. Additionally, non-CO2 greenhouse gases in the form of perfluorocarbons (PFCs) are emitted when alumina is smelted to produce primary aluminium. According to the International Aluminium Institute (IAI), global PFC emissions in 2014 were equivalent to 34 million metric tonnes of CO2 [8]. Consequently, the average carbon intensity, including PFC emissions, of an aluminium producer aligned with the Paris Pledges in 2014 is (766 + 34) / 126 = 6.34 tonnes of CO2e per tonne of aluminium produced. This is 4.27% higher than the CO2-only benchmark. We apply this upward adjustment of 4.27% to all future years, so that PFC emissions from aluminium are assumed to fall in proportion to CO2 emissions.
-
1.00
2.00
3.00
4.00
5.00
6.00
7.00
2014 2015 2016 2017 2018 2019 2020 2021 2022 2023 2024 2025 2026 2027 2028 2029 2030
Ca
rbo
n in
ten
sity
(m
etr
ic t
on
nes
CO
2e /
metr
ic t
on
ne o
f a
lum
iniu
m)
Paris Pledges
2 Degrees
Below 2 Degrees
8
Table 1 Projections of emissions and aluminium production used to calculate intensity paths (Source: IEA and own calculations)
2014 2020* 2025 2030
Paris Pledges scenario
Scope 1+2 CO2 emissions (Mt CO2)
Scope 1 PFC emissions (Mt CO2e)
766
34
811
35
850
36
848
36
Aluminium production (Mt)
Carbon intensity (tCO2 / t aluminium)
126
6.08
154
5.38
177
4.80
203
4.18
Carbon intensity (tCO2e / t aluminium) 6.34 5.61 5.01 4.35
2 Degrees scenario
Scope 1+2 CO2 emissions (Mt CO2e)
Scope 1 PFC emissions (Mt CO2e)
766
34
751
32
738
31
612
26
Aluminium production (Mt)
Carbon intensity (tCO2 / t aluminium)
126
6.08
154
5.04
177
4.17
203
3.02
Carbon intensity (tCO2e / t aluminium) 6.34 5.26 4.35 3.14
Below 2 Degrees scenario
Scope 1+2 CO2 emissions (Mt CO2e)
Scope 1 PFC emissions (Mt CO2e)
766
34
671
29
607
26
500
21
Aluminium production (Mt)
Carbon intensity (tCO2 / t aluminium)
126
6.08
144
4.86
158
3.84
170
2.94
Carbon intensity (tCO2e / t aluminium) 6.34 5.07 4.00 3.07
* Emissions, production and carbon intensity for the year 2020 are estimated by TPI by linearly interpolating between 2014 and 2025 data points.
TPI calculates a sector’s Scope 2 emissions by multiplying its power consumption by the emissions intensity of the electricity grid, along each of the IEA scenario paths. For the aluminium sector, we estimate the emissions intensity of the global electricity grid as an average of the emissions intensity of the electricity grid in OECD and non-OECD countries, weighted by their respective aluminium production. Hence the global grid intensity takes into account that a larger proportion of aluminium is produced in non-OECD countries, who have a more emission-intensive grid. For example, in 2014 the average grid intensity was estimated to be 0.44 and 0.68 Mt CO2 per terawatt hour in OECD and non-OECD countries respectively. Moreover, the IEA estimated that aluminium production in OECD and non-OECD countries was 38 and 88 Mt respectively. Consequently, taking a weighted average, the global grid intensity applicable to the aluminium sector was 0.609 Mt CO2 / TWh.
Additionally, in the case of aluminium producers (like paper and steel producers, for example), it is necessary to apply a further adjustment to account for the fact that most aluminium producers generate a portion of the electricity they themselves consume. In order to estimate the proportion of power consumption that is purchased from outside by aluminium producers, we draw on data published in

9
aluminium companies’ responses to the CDP Climate Change questionnaire. Question CC11.5, introduced in the 2016 and 2017 questionnaires, specifically asks respondents to list their power consumption and production/purchases; it is therefore possible to calculate, for each respondent, the ratio of electricity purchased to total electricity consumed. The average ratio in 2016 and 2017 for aluminium producers responding to CDP was 89.67%.
TPI thus calculates Scope 2 emissions for the sector as:
Scope 2 emissions = 89.67% x Power consumption x Grid intensity
For example, in 2014 the power consumption of the aluminium sector was 927 TWh and the global grid intensity was 0.609 Mt CO2 / TWh (both IEA estimates), so the aluminium sector’s Scope 2 emissions are estimated to be 89.67% x 927 x 0.609 = 506 Mt CO2 in 2014.
3.2. Calculating company emissions intensities
TPI is based on public disclosures by companies. In any given sector, disclosures that are useful to TPI’s carbon performance assessment tend to come in one of three forms:
1. Some companies disclose their recent and current emissions intensity and some companies have also set future emissions targets in intensity terms. Provided these are measured in a way that can be compared with the benchmark scenarios and with other companies (e.g. in terms of scope of emissions covered and measure of activity chosen), these disclosures can be used directly. In some cases, adjustments need to be made to obtain estimates of emissions intensity on a consistent basis. The necessary adjustments will generally involve sector-specific issues (see below).
2. Some companies disclose their recent and current emissions on an absolute (i.e. un-normalised) basis. Provided emissions are appropriately measured, and an accompanying disclosure of the company’s activity can be found that is also in the appropriate metric, recent and current emissions intensity can be calculated by TPI.
3. Some companies set future emissions targets in terms of absolute emissions. This raises the particular question of what to assume about those companies’ future activity levels. The approach taken in the TPI is to assume company activity increases at the same rate as the sector as a whole (i.e. this amounts to an assumption of constant market share), using sectoral growth rates from the IEA in order to be consistent with the benchmark paths. While companies’ market shares are unlikely to remain constant, there is no obvious alternative assumption that can be made, which treats all companies consistently. Sectoral growth rates from the Paris Pledges (IEA RTS) scenario are used. These lie in the middle of the range from the IEA’s three scenarios, close to the average of them.
The length of companies’ emissions intensity paths will vary depending on how much information companies provide on their emissions since 2013, as well as the time horizon for their emissions targets.
10
3.3. Emissions reporting boundaries
Company emissions disclosures vary in terms of the organisation boundary that a company sets. There are two high-level approaches: the equity share approach and the control approach, and within the control approach there is a choice of financial or operational control. Companies are free to choose which organisation boundary to set in their voluntary disclosures and there is variation between companies assessed by TPI.
TPI accepts emissions reported using any of the above approaches to setting organisation boundaries, as long as:
1. The boundary that has been set appears to allow a representative assessment of the company’s emissions intensity;
2. The same boundary is used for reporting company emissions and activity, so that a consistent estimate of emissions intensity is obtained.
At this point in time, limiting the assessment to one particular type of organisation boundary would severely restrict the breadth of companies TPI can assess.
When companies report historical emissions or emission intensity under both the equity share and control approaches, as is sometimes the case, TPI chooses the reporting boundary that seems most appropriate, based on the criteria of consistency with the reporting of activity, consistency with the target, and the length of the available time series of disclosures.
3.4. Data sources and validation
All company data in TPI come from companies’ own disclosures. The sources for the carbon performance assessment include responses to the annual CDP questionnaire, as well as companies’ own reports, e.g. sustainability reports.
Given that TPI’s carbon performance assessment is both comparative and quantitative, it is essential to understand exactly what the data in company disclosures refer to. Company reporting varies not only in terms of what is reported, but also in terms of the level of detail and explanation provided. The following cases can be distinguished:
Some companies provide data in a suitable form and they provide enough detail on those data for analysts to be confident appropriate measures can be calculated or used.
Some companies also provide enough detail, but from the detail it is clear that their disclosures are not in a suitable form for TPI’s carbon performance assessment (e.g. they do not report the measure of company activity needed). These companies cannot be included in the assessment.
Some companies do not provide enough detail on the data disclosed and these companies are also excluded from the assessment (e.g. the company reports an emissions intensity estimate, but does not explain precisely what it refers to).
Some companies do not disclose their carbon emissions and/or activity.

11
Once a company’s preliminary performance assessment has been made based on the principles and procedures described above, it is subject to the following quality assurance:
Internal findings review: the preliminary assessment is reviewed by analysts who were not originally involved in making it.
Company review: once the initial findings review is complete, TPI writes to companies with their assessment and requests companies to review it and confirm the accuracy of the company disclosures being used. The company review includes all companies, i.e. it also includes those who provide unsuitable or insufficiently detailed disclosures.
Final assessment: company assessments are reviewed and, if it is considered appropriate, revised.
3.5. Responding to companies
Allowing companies the opportunity to review and, if necessary, correct their assessments is an integral part of TPI’s quality assurance process. We send each company its draft TPI assessment and the data that underpin the assessment, offering them the opportunity to review and comment on the data and assessment. We also allow companies to contact us at any point to discuss their assessment.
If a company seeks to challenge its result/representation, our process is as follows:
TPI reviews the information provided by the company. At this point, additional information may be requested.
If it is concluded that the company’s challenge has merit, the assessment is updated and the company is informed.
If it is concluded that there are insufficient grounds to change the assessment, this decision is explained to the company.
If a company chooses to further contest the assessment and reverts to legal means to do so, the company’s assessment is withheld from the TPI website and the company is identified as having challenged its assessment.
3.6. Presentation of assessment on TPI website
The results of the carbon performance assessment will be posted on the TPI website, within the TPI tool (http://www.lse.ac.uk/GranthamInstitute/tpi/the-toolkit/). On each company page, its emissions intensity path will be plotted on the same chart as the benchmark paths for the relevant sector. Different companies can also be compared on the toolkit main page, with the user free to choose which companies to include in the comparison.
12
4. SPECIFIC CONSIDERATIONS IN THE ASSESSMENT OF
ALUMINIUM PRODUCERS
4.1. Measure of emissions intensity
In the aluminium sector, the specific measure of emissions intensity used by TPI is:
Scope 1 and 2 greenhouse gas emissions from aluminium production, per unit of (primary and secondary) aluminium produced, in units of (metric) tonnes of CO2 equivalent per tonne of aluminium.
Unlike some other sectors, whose carbon performance is being assessed by TPI (e.g. cement, and electricity utilities), Scope 2 emissions from purchases of power are sufficiently important in the aluminium sector that they should be included in the measure of company emissions, alongside direct or Scope 1 emissions. According to the IEA modelling used to derive the benchmark paths (and adjusting for both aluminium producers’ own electricity generation using CDP data and PFC emissions), global Scope 2 emissions from aluminium production were 63% of total Scope 1 and 2 emissions in 2014, for example.
The objective is to only measure emissions from aluminium production, so that emissions arising from any other activities that companies are engaged in are excluded, otherwise companies’ emissions intensity may be mis-estimated. More specifically, TPI measures the emissions from alumina refining, aluminium smelting and aluminium recycling, per unit of primary and secondary aluminium production. However, some aluminium companies assessed by TPI label their disclosed emissions as being operations-wide, rather than being specific to aluminium production. When this is the case, further assessment is required of whether the company in question has included significant sources of emissions other than aluminium production, or whether operations-wide and aluminium-production-specific emissions are equivalent, or at least approximately so.
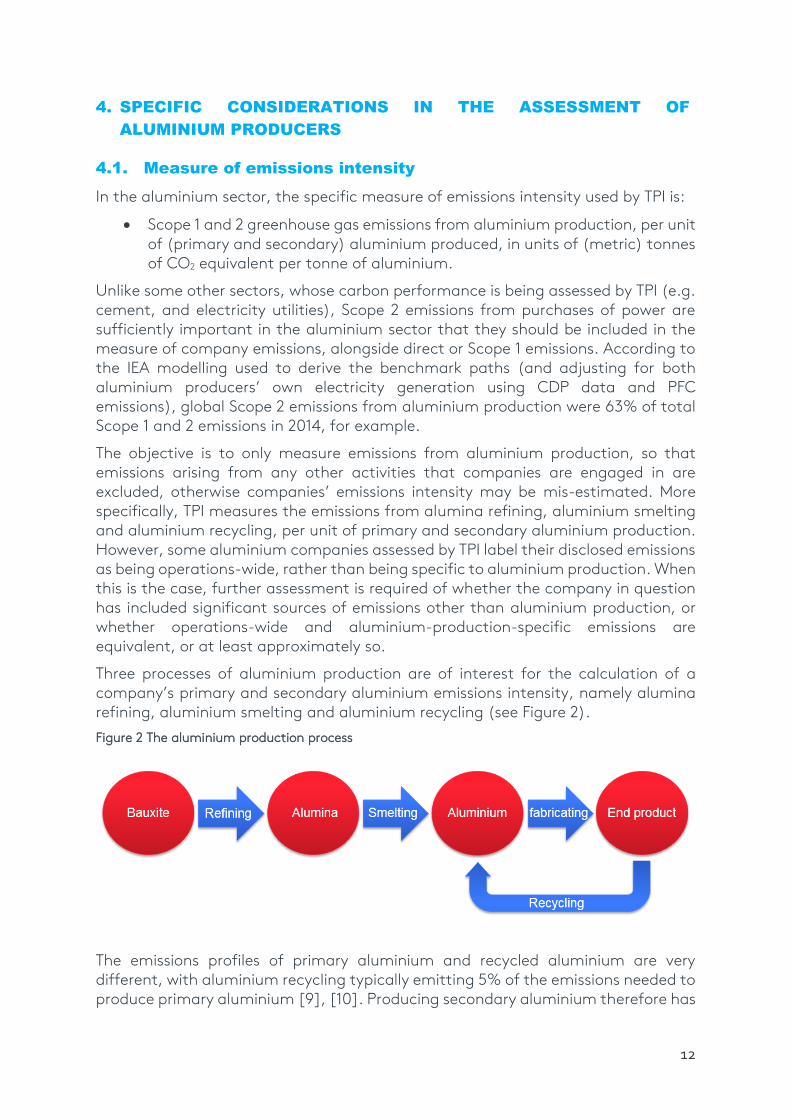
Three processes of aluminium production are of interest for the calculation of a company’s primary and secondary aluminium emissions intensity, namely alumina refining, aluminium smelting and aluminium recycling (see Figure 2).
Figure 2 The aluminium production process
The emissions profiles of primary aluminium and recycled aluminium are very different, with aluminium recycling typically emitting 5% of the emissions needed to produce primary aluminium [9], [10]. Producing secondary aluminium therefore has

13
a large impact on a company’s overall emissions intensity. In cases where a company discloses secondary aluminium production numbers but not the corresponding emissions, TPI will assume that the emissions intensity of secondary aluminium is equal to 5% of its primary aluminium emissions intensity.
Once the bauxite is refined into alumina, companies can decide to either smelt it into aluminium or sell it. When a company decides to sell some of its alumina, their final primary aluminium production no longer represents the amount of primary aluminium created from their alumina. Hence, dividing their emissions from the refining process by their reported primary aluminium production would result in an overestimation of their emissions intensity. Consequently, the alumina production volume needs to be converted to a primary aluminium production volume that the company would have produced had it not sold any of its alumina. We use the companies own reported rate to calculate the primary aluminium equivalent of their alumina. This conversion rate is on average 2 metric tons of alumina to 1 metric ton of aluminium.
Companies have flexibility to disclose aggregate emissions data from different stages of the aluminium production process. This can lead them to include activities that are outside the scope of TPI’s assessment. For example, a company involved in bauxite mining and alumina refining can disclose the sum of emissions from these activities. In this case, TPI needs to separate out the emissions from the activities relevant to our assessment. We use sectoral averages reported by the International Aluminium Institute [11] to make the proper adjustment.
Often, aluminium companies report their emissions in terms of CO2e, capturing both CO2 and non-CO2 greenhouse gas emissions.4 In cases where companies disclose only CO2 emissions, we have adjusted the reported emissions by +4.27% to CO2e emissions (see discussion in section 3.1).
4.2. Coverage of aluminium-making facilities
While some aluminium producers disclose emissions from all their facilities, others explicitly do not, or it is unclear from their disclosures. When it is explicitly incomplete or unclear, further assessment is required of whether coverage is incomplete, to what extent it is incomplete and whether the omission of some facilities is likely to bias the estimate of a company’s emissions intensity. Ultimately TPI makes a judgement on whether its estimate of a company’s emissions intensity is likely to be biased, and sufficiently so for the company to be excluded from the carbon performance assessment, in line with the principles set out in Section 3.3 above.
4.3. Coverage of target
There are often differences in the scope of companies’ emissions targets:
In the aluminium sector, some companies have set specific targets to reduce Scope 1 and 2 emissions from alumina refining and aluminium smelting, while others have set targets covering company-wide Scope 1 and 2 emissions (i.e. covering more than just alumina refining and aluminium smelting). In the
4 PFCs represent nearly all non-CO2 greenhouse gases emissions in the aluminium sector.
14
case of a pure-play aluminium producer, where a target covers more than just Scope 1 and 2 emissions from refining and smelting, it is assumed – in the absence of any other specific information – that the percentage reduction in emissions is uniform across activities (and scopes), so the target percentage (e.g. a 20% cut) can be directly applied to Scope 1 and 2 emissions from refining and smelting.
By contrast, in the case of a diversified company involved in more sectors than just aluminium, it may be inappropriate to apply a company-wide target. In such cases, we look at how much emissions from the company’s aluminium business have been reduced since the target base year, compared with how much company-wide emissions have been reduced over the same period. When emissions from a company’s aluminium activities have declined less than the company-wide target, we conclude that it is appropriate to apply the emissions target uniformly. When emissions from a company’s aluminium activities have declined more than the company-wide target, we conclude that the target cannot be applied to the company’s aluminium business.
Some companies set targets that only apply to Scope 1 emissions, as opposed to Scope 1 and 2 emissions from aluminium production. Relevant emissions that are not covered by the target are assumed to be unchanged from the base year to the target year.
Companies often express targets relative to emissions in a base year (e.g. 2007), but they do not always report Scope 1 and 2 emissions from aluminium production in the base year, rather they sometimes report base-year emissions in a different scope (e.g. they include upstream Scope 3 emissions in 2007). If a company does not report Scope 1 and 2 emissions from aluminium production in the base year, these are estimated using the ratio of Scope 1 and 2 emissions from aluminium production to emissions in the company’s chosen scope over the last three years (cumulatively).5
Some companies have set a target to be carbon neutral in their Scope 1-3 lifecycle emissions. Companies could offset their emissions by, for example, restoring forests (which can serve as carbon sinks), or employing carbon capture and storage technologies. TPI can accept such targets in principle, subject to the use of offsetting being consistent with the benchmarks. However, the concept of “avoided emissions” through the use of aluminium, instead of more carbon-intensive metals such as steel, is not accepted, because it is inconsistent with the benchmarks.
4.3. Worked examples6
Company A: a simple case
Company A reports its historical emissions intensity and it does so in the required metric, i.e. Scope 1 and 2 emissions from aluminium production per tonne of primary
5 Due to the occasional practice of companies re-basing their emissions, this adjustment is preferred to using disclosures of base-year Scope 1 and 2 emissions from steel-making from past years’ reporting. 6 In the following examples various numbers are rounded for ease of presentation.

15
and secondary aluminium combined. For example, in 2015 it was 6.8 tCO2e / t aluminium. After independently verifying the estimates using separate disclosures of emissions and aluminium production, these figures are used directly without adjustment.
Company A has also set a target to reduce the intensity of its Scope 1 and 2 emissions by 25% below the 2008 level by 2020. This target is stated to cover 100% of the company’s Scope 1 and 2 emissions.
In 2008, the company’s emissions intensity was 7.88 tCO2e / t aluminium. Therefore in 2020 the target is to reduce its emissions intensity (total Scope 1+2 emissions) to (1-0.25) x 7.88 = 6.3 tCO2e / t aluminium.
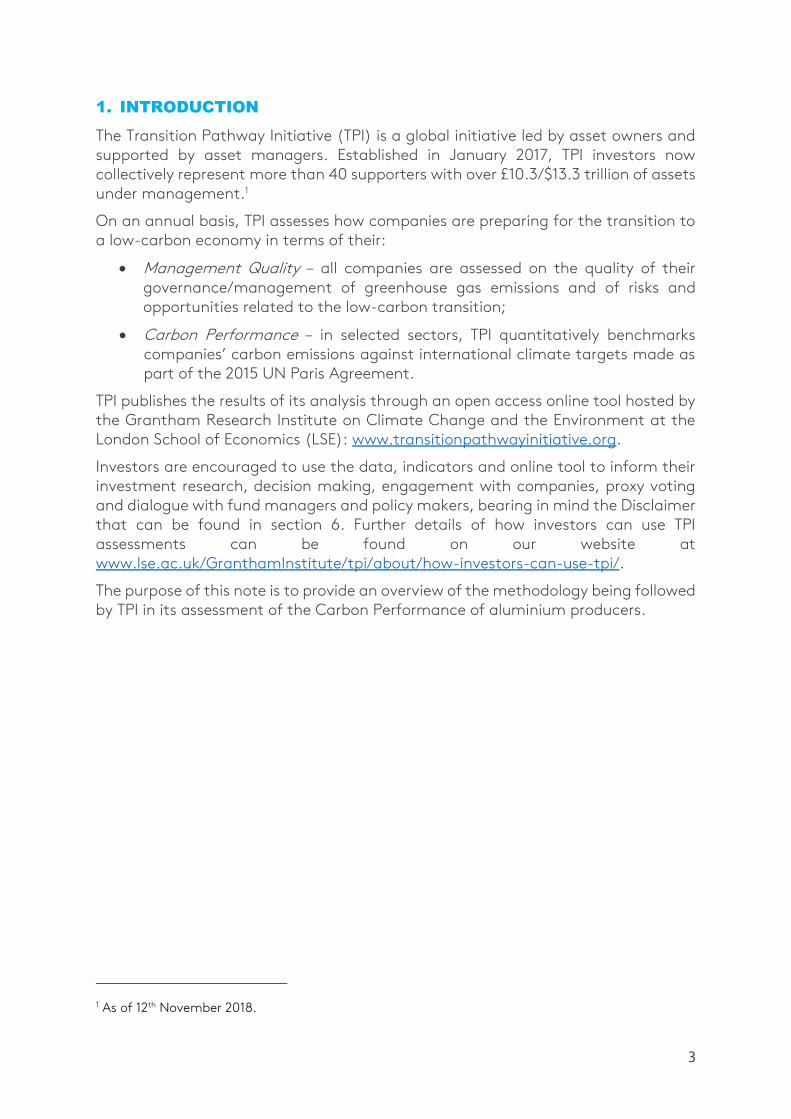
Company B: an absolute emissions target
Company B reports an operations-wide emissions intensity of aluminium production per tonne of primary and secondary aluminium for the last five years (2013-2017). For example, in 2015 they report their intensity per tonne of ‘production volume’. Further investigation indicates that there are no significant sources of company emissions other than aluminium production, so operations-wide emissions are taken to be equivalent to aluminium-production-specific emissions. In 2015, the company’s Scope 1 and 2 emissions intensity was 4.5 tCO2e / t aluminium.
Company B has a target to reduce the absolute quantity of its Scope 1 and 2 emissions by 5% below the 2015 level by 2020. This target is said to cover 100% of the company’s Scope 1 and 2 emissions from refining alumina and smelting aluminium.
In order to translate this information into an estimate of emissions intensity in 2020, the following steps are taken:
0
1
2
3
4
5
6
7
8
2013 2014 2015 2016 2017 2018 2019 2020 2021 2022 2023 2024 2025 2026 2027 2028 2029 2030
Carb
on
in
ten
sit
y (
metr
ic t
on
nes
CO
2 /
me
tric
to
nn
e a
lum
iniu
m)
Company A
Paris Pledges
2 Degrees
Below 2 Degrees
16
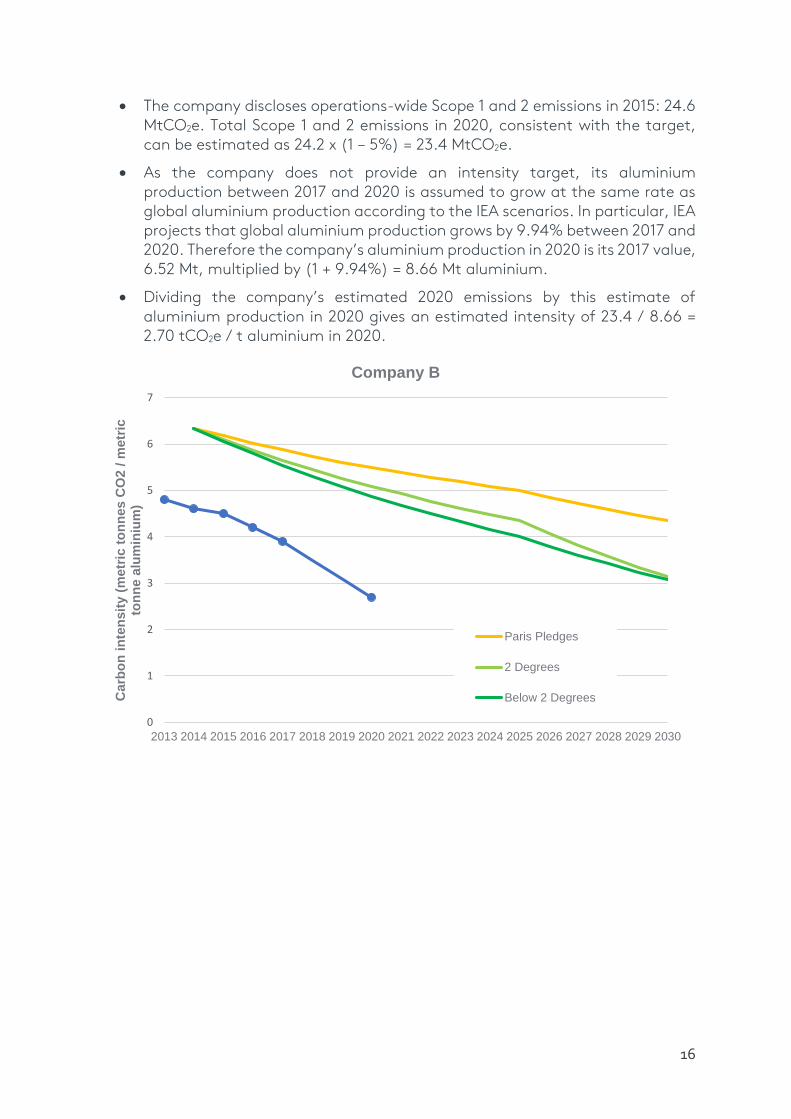
The company discloses operations-wide Scope 1 and 2 emissions in 2015: 24.6 MtCO2e. Total Scope 1 and 2 emissions in 2020, consistent with the target, can be estimated as 24.2 x (1 – 5%) = 23.4 MtCO2e.
As the company does not provide an intensity target, its aluminium production between 2017 and 2020 is assumed to grow at the same rate as global aluminium production according to the IEA scenarios. In particular, IEA projects that global aluminium production grows by 9.94% between 2017 and 2020. Therefore the company’s aluminium production in 2020 is its 2017 value, 6.52 Mt, multiplied by (1 + 9.94%) = 8.66 Mt aluminium.
Dividing the company’s estimated 2020 emissions by this estimate of aluminium production in 2020 gives an estimated intensity of 23.4 / 8.66 = 2.70 tCO2e / t aluminium in 2020.
0
1
2
3
4
5
6
7
2013 2014 2015 2016 2017 2018 2019 2020 2021 2022 2023 2024 2025 2026 2027 2028 2029 2030
Carb
on
in
ten
sit
y (
metr
ic t
on
nes C
O2 /
metr
ic
ton
ne a
lum
iniu
m)
Company B
Paris Pledges
2 Degrees
Below 2 Degrees
17
5. DISCUSSION
This note has described the methodology followed by TPI in carrying out carbon performance assessment of companies, with a particular focus on aluminium producers.
TPI’s carbon performance assessment is designed to be easy to understand and use, while robust. There are inevitably many nuances surrounding each company’s individual performance, how it relates to the benchmarks and why. Investors may wish to dig deeper to understand these.
5.1. General issues
The assessment follows the Sectoral Decarbonization Approach (SDA), which involves comparing companies’ emissions intensity with sector-specific benchmark emissions intensities that are consistent with international targets (i.e. limiting global warming to well below 2°C, no more than 2°C, and the sum of the Paris Pledges).
TPI uses the modelling of the International Energy Agency (IEA) to calculate the benchmark paths. The IEA modelling has a number of advantages, but it is also subject to limitations, like all other economy-energy modelling. In particular, model projections often turn out to be wrong. The comparison between companies and the benchmark paths might then be inaccurate. However, there is no way to escape the need to make a projection of the future in forward-looking exercises like this. IEA updates its modelling every two years with the aim of improving the accuracy of its projections and TPI plans to update its benchmark paths accordingly.
TPI uses companies’ self-reported emissions and activity data to derive emissions intensity paths. Therefore companies’ paths are only as accurate as the underlying disclosures.
Estimating the recent, current and especially the future emissions intensity of companies involves a number of assumptions. Therefore it is important to bear in mind that, in some cases, the emissions path drawn for each company is an estimate made by TPI, based on information disclosed by companies, rather than the companies’ own estimate or target. In other cases, the information disclosed by companies is sufficient on its own to completely characterise the emissions intensity path.
5.2. Issues specific to aluminium producers
The principal challenge in the aluminium sector, relative to other sectors whose carbon performance TPI is assessing, is differences between companies’ organisational boundaries. Some companies are more horizontally integrated (e.g. companies that also mine bauxite, or fabricate or extrude aluminium), others more vertically integrated (e.g. general miners). Consequently, more detailed disclosure is required to distinguish the Scope 1 and 2 emissions from alumina refining, aluminium smelting, and recycling from other company activities.
Additionally, when companies sell some of their alumina, their final aluminium production volume is only a portion of the company’s alumina that was smelted to

18
aluminium. Indeed, in this case, the amount of primary aluminium that was smelted from the company’s original alumina production is larger than the amount of primary aluminium that the company itself has produced. Hence, dividing by the company’s primary aluminium production would overestimate the emissions intensity from alumina refining. Again, more detailed disclosure is needed to divide emissions from alumina refining by the amount of primary aluminium that would have been produced by the company had it not sold any of its alumina.

19
6. DISCLAIMER
1. All information contained in this report and on the TPI website is derived from publicly available sources and is for general information use only. Information can change without notice and The Transition Pathway Initiative does not guarantee the accuracy of information in this report or on the TPI website, including information provided by third parties, at any particular time.
2. Neither this report nor the TPI website provides investment advice and nothing in the report or on the site should be construed as being personalised investment advice for your particular circumstances. Neither this report nor the TPI website takes account of individual investment objectives or the financial position or specific needs of individual users. You must not rely on this report or the TPI website to make a financial or investment decision. Before making any financial or investment decisions, we recommend you consult a financial planner to take into account your personal investment objectives, financial situation and individual needs.
3. This report and the TPI website contain information derived from publicly available third party websites. It is the responsibility of these respective third parties to ensure this information is reliable and accurate. The Transition Pathway Initiative does not warrant or represent that the data or other information provided in this report or on the TPI website is accurate, complete or up-to-date, and make no warranties and representations as to the quality or availability of this data or other information.
4. The Transition Pathway Initiative is not obliged to update or keep up-to-date the information that is made available in this report or on its website.
5. If you are a company referenced in this report or on the TPI website and would like further information about the methodology used in our publications, or have any concerns about published information, then please contact us. An overview of the methodology used is available on our website.
6. Please read the Terms and Conditions which apply to use of the website.

20
7. BIBLIOGRAPHY
[1] O. Krabbe et al., “Aligning corporate greenhouse-gas emissions targets with climate goals,” Nat. Clim. Chang., vol. 5, pp. 1057–1060, 2015.
[2] J. Randers, “Greenhouse gas emissions per unit of value added (‘GEVA’): a corporate guide to voluntary climate action,” Energy Policy, vol. 48, pp. 46–55, 2012.
[3] International Energy Agency, Energy Technology Perspectives 2017. International Energy Agency, 2017.
[4] UNFCCC, “Paris Agreement,” 2015. [5] UNEP, “The Emissions Gap Report 2015: A UNEP Synthesis Report,” Nairobi,
2015. [6] R. Boyd, J. Cranston Turner, and B. Ward, “Intended nationally determined
contributions: what are the implications for greenhouse gas emissions in 2030?,” London, 2015.
[7] United Nations, “Adoption of the Paris Agreement,” 2015. [8] International Aluminium Institute, “[Dataset] perfluorocarbon-pfc-
emissions.csv.” 2018. [9] International Aluminium Institute, “Global Aluminium Recycling: A
Cornerstone of Sustainable Development,” London, 2009. [10] European Aluminium, “Aluminium beverage can recycling at 73%!,” no.
70307. 2018. [11] International Aluminium Institute, “Aluminium for Future Generations,”
London, 2009.

21
The Transition Pathway Initiative (TPI)
c/o UNPRI PRI Association
5th Floor, 25 Camperdown St
London, E1 8DZ, UK
T +44 (0)20 3714 3141
transitionpathwayinitiative.org
@tp_initiative