CARBON NANOTUBES-BASED LATERAL FLOW BIOSENSOR FOR … › 3266 › c79cba26d9988fa93b9c797… ·...
42
CARBON NANOTUBES-BASED LATERAL FLOW BIOSENSOR FOR SENSITIVE AND RAPID DETECTION OF DNA SEQUENCE A Thesis Submitted to the Graduate Faculty of the North Dakota State University of Agriculture and Applied Science By Xiaoguang Zhang In Partial Fulfillment of the Requirements for the Degree of MASTER OF SCIENCE Major Department: Chemistry and Biochemistry February 2017 Fargo, North Dakota
Transcript of CARBON NANOTUBES-BASED LATERAL FLOW BIOSENSOR FOR … › 3266 › c79cba26d9988fa93b9c797… ·...

CARBON NANOTUBES-BASED LATERAL FLOW BIOSENSOR FOR SENSITIVE AND
RAPID DETECTION OF DNA SEQUENCE
A Thesis
Submitted to the Graduate Faculty
of the
North Dakota State University
of Agriculture and Applied Science
By
Xiaoguang Zhang
In Partial Fulfillment of the Requirements
for the Degree of
MASTER OF SCIENCE
Major Department:
Chemistry and Biochemistry
February 2017
Fargo, North Dakota

North Dakota State University
Graduate School
Title
CARBON NANOTUBES-BASED LATERAL FLOW BIOSENSOR FOR
SENSITIVE AND RAPID DETECTION OF DNA SEQUENCE
By
Xiaoguang Zhang
The Supervisory Committee certifies that this disquisition complies with North Dakota State
University’s regulations and meets the accepted standards for the degree of
MASTER OF SCIENCE
SUPERVISORY COMMITTEE:
Guodong Liu
Chair
D.K. Srivastava
Wenfang Sun
Xiwen Cai
Approved:
04-13-2017 Gregory Cook
Date Department Chair

iii
ABSTRACT
Sensitive detection for DNA has drawn great attention in plenty of different areas such as
genetics therapy and basic discovery research. Recently, nucleic acid lateral flow biosensor
(NALFB) has gained considerable attention for DNA analysis. Compared with the traditional
immunoassays, NALFB has these advantages: short assay time and a low cost. In this thesis, we
report a carbon nanotubes (CNTs)-based NALFB for rapid and sensitive detection of DNA.
Amine-modified DNA detection probe was covalently immobilized on the CNTs via
diimide-activated amidation between the carboxyl groups on the CNTs surface and amine groups
on the detection DNA probes. Sandwich-type DNA hybridization reactions were performed and
the captured MWCNTs on test zone and control zone produced the characteristic black bands.
Based on the catalytic property of CNTs to enhance the Chemiluminescence intensity of the
reaction between hydrogen peroxide and Lumigen APS-5, a rapid detection of DNA sequence
with high sensitivity is achieved.
iv
ACKNOWLEDGMENTS
I would like to show my gratitude to my advisor, Dr. Guodong Liu, who always helped
me in my research area during these three years and encouraged me when I was frustrated. His
excellent talent for research teaches and inspires me how to be a qualified researcher.
I want to appreciate my committee members, Dr. D.K. Srivastava, Dr. Wenfang Sun and
Dr. Xiwen Cai, for their suggestions, comments, guides and supports during my graduate study. I
also want to give my sincere thanks to Gregory Oswald, Amy Kain, Dionna Martel and Christina
Exner and Cole Larsen, who always ready to offer help when I need. I want to thank all other
staffs and faculty members in the department of Chemistry and Biochemistry for their help.
I want to give my thanks to my lab members: Sunitha Takalkar, Kwaku Baryeh and
Michelle Lund; visiting scholars and students: Qiaobin Li and Yan Huang with their suggestions
and help in my research. I also want to thank for friends, Andrew Carlson, Poyraz Kayabas for their
support and encouragement.
I would like to appreciate my parents, aunt and uncle and my wife, Yu Sun. I cannot
reach this step without your encouragement and concern.
Finally I want to give my thanks to the Department of Chemistry and Biochemistry and
North Dakota State University.

v
TABLE OF CONTENTS
ABSTRACT ................................................................................................................................... iii
ACKNOWLEDGMENTS ............................................................................................................. iv
LIST OF FIGURES ...................................................................................................................... vii
LIST OF ABBREVIATIONS ...................................................................................................... viii
1. INTRODUCTION .................................................................................................................... 1
1.1. Methods of DNA detection ................................................................................................ 1
1.2. Nucleic acid lateral flow biosensor (NALFB) ................................................................... 2
1.3. Principle of NALFB ........................................................................................................... 3
1.4. Labels used in lateral flow assay ....................................................................................... 4
1.4.1. Carbon nanotubes (CNTs) ...................................................................................... 4
1.4.2. Gold nanoparticles (GNPs) ..................................................................................... 5
1.5. Colorimetric analysis ......................................................................................................... 5
1.6. Chemiluminescence analysis ............................................................................................. 6
1.7. Objective ............................................................................................................................ 7
2. CARBON NANOTUBES-BASED LATERAL FLOW BIOSENSOR FOR
SENSITIVE AND RAPID DETECTION OF DNA SEQUENCE........................................... 8
2.1. Introduction ........................................................................................................................ 8
2.2. Experimental section .......................................................................................................... 9
2.2.1. Apparatus ................................................................................................................ 9
2.2.2. Reagents and materials ........................................................................................... 9
2.2.3. Preparation of streptavidin-biotinylated DNA conjugates .................................... 10
2.2.4. Preparation of shortened multi-walled carbon nanotubes ..................................... 10
2.2.5. Preparation of carbon nanotubes-DNA conjugates............................................... 10
2.2.6. Sample assay procedure ........................................................................................ 11

vi
2.2.7. Colorimetric detection method ............................................................................. 11
2.2.8. Chemiluminescence detection method ................................................................. 12
2.3. Results and discussions .................................................................................................... 13
2.3.1. Principle of Chemiluminescence lateral flow strip biosensor ............................... 13
2.3.2. Optimization of experimental parameters ............................................................. 15
2.3.3. Analytical performance of colorimetric detection method of lateral flow
strip biosensor ....................................................................................................... 23
2.3.4. Analytical performance of Chemiluminescence detection method of lateral
flow strip biosensor ............................................................................................... 25
2.3.5. Reproducibility ..................................................................................................... 27
2.4. Conclusion ....................................................................................................................... 27
3. SUMMARY ............................................................................................................................ 28
4. REFERENCES ...................................................................................................................... .29

vii
LIST OF FIGURES
Figure Page
1.1. Analyzer DT 1030 is used to read color intensity of the black band on the Lateral
Flow Strip Biosensor........................................................................................................... 6
1.2. Chemiluminescence reaction between APS-5 and H2O2 .................................................. 7
2.1. Lateral flow strips placed into cuvettes and the color intensity reader: Analyzer
DT 1030 ............................................................................................................................ 12
2.2. The principal of Chemiluminescence detection method ................................................... 13
2.3. Schematic illustration of the principle of DNA measurement on MWCNTs-DNA
conjugate based lateral flow biosensor ........................................................................... 15
2.4. S/N of different buffers ................................................................................................... 16
2.5. S/N of different SSC% in running buffers ........................................................................ 17
2.6. S/N of different concentration of detection DNA probe ................................................... 18
2.7. S/N of different dispensing times of test line.................................................................... 19
2.8. S/N of different loading amount of MWCNTs-DNA conjugate ...................................... 20
2.9. S/N of volume ratio between Lumigen APS-5 and H2O2 ................................................. 21
2.10. S/N of dilution percentage of H2O2 .................................................................................. 21
2.11. S/N of loading amount of Lumigen APS-5 and H2O2 mixture ......................................... 22
2.12. S/N of different buffers in Chemiluminescence detection ................................................ 23
2.13. Typical photo images (up) of the NALFB in the presence of different DNA
concentrations and the resulting colorimetric calibration curve (middle: from left
to right: Blank, 0.1nM, 0.2nM, 0.5nM, 1nM, 2nM, 5nM, 10nM, 20nM) and the
resulting calibration curve (down). ................................................................................... 24
2.14. Typical photo images (up) of the NALFB in the presence of different DNA
concentrations and the resulting Chemiluminescence calibration curve (middle:
from left to right: Blank, 0.1nM, 0.2nM, 0.5nM, 1nM, 2nM, 5nM, 10nM, 20nM)
and the resulting calibration curve (down). ...................................................................... 26

viii
LIST OF ABBREVIATIONS
Ab .......................................................Antibody
APS-5 .................................................Chemiluminescence substrate
BSA ....................................................Bovine serum albumin
CL ......................................................Chemiluminescence
CNTs ..................................................Carbon nanotubes
DNA ...................................................Deoxyribonucleic acid
EDC....................................................1-Ethyl-3-(3-dimethylaminopropyl)carbodiimide
ELISA ................................................Enzyme-linked immunosorbent assay
GNPs ..................................................Gold nanoparticles
LFA ....................................................Lateral flow assay
LFB ....................................................Lateral flow biosensor
LFSB ..................................................Lateral flow strip biosensor
MES ...................................................2-(N-morpholino)ethanesulfonic acid
MWCNTs ...........................................Multi-walled carbon nanotubes
NALFB ..............................................Nucleic acid lateral flow biosensor
NHS-sulfo ..........................................N-Hydroxysuccinimide
ODN ...................................................Oligodeoxynucleotides
PBS ....................................................Phosphate buffer saline
PBST ..................................................PBS with 0.05% Tween 20
PCR ....................................................Polymerase chain reaction
POCT .................................................Point-of-care testing
Qdot....................................................Quantum dot

ix
SiNRs .................................................Silica nanorods
SSC ....................................................Sodium Saline Citrate
SWCNTs ............................................Single-walled carbon nanotubes
Tris-HCl .............................................Tris(hydroxymethyl)aminomethane hydrochloride

1
1. INTRODUCTION
Nowadays, nucleic acid detection has attracted more and more attention for the diagnosis
and treatment of genetic diseases,1 infectious agents,2 bio-warfare agents,3 and drug discovery.4
The most famous method for DNA detection is called the polymerase chain reaction (PCR) due
to its exponential amplification capability.5-6 Yet, even a small amount of the contamination can
result in huge false positive. Moreover, the PCR-based detection strategy takes long period of
time and requires a relatively clean environment, sophisticate and expensive instruments, which
make it not suitable for rapid on-site test. Therefore, great efforts have been made to explore
DNA biosensors over the past decade. The Point of care diagnostics which can provide near
patient testing in a clinic, doctor’s office, or home can prove advantageous when rapid response
is required or when suitable facilities are unavailable. Compared to equivalent methods used in
laboratories, point of care testing is more affordable, as it eliminates the need for expensive
instrumentation and skilled labor. One option involves the use of lateral flow assays.
Pre-fabricated strips of dry reagents activated upon fluid application are already used in
diagnostics, such as to ascertain pregnancy. Nucleic acid based detection assays on lateral flow
offer several advantages over traditional microbiological detection.
1.1. Methods of DNA detection
There are numerous DNA detection methods besides the PCR. Another popular method
is called: DNA Microarrays.7 The size of microarrays is similar to a microscope slide, or even
smaller. Each spot on a microarray contains several identical DNA strands. The DNA sequence
on each spot is unique. Each spot represents one gene. Thousands of spots are arrayed in orderly
rows and columns on a solid surface (usually glass). The precise location and sequence of each
spot is recorded in a computer database.
2
Colorimetric DNA detection method is one method which can provide visual detection.
One literature reported a free, red-colored ssDNA-functionalized gold nanoparicles(GNPs) freely
move across the semi-permeable cellulose acetate membrane.8 Another ssDNA-functionalized
White-colored latex microparticles, on the other hand, are too large to pass through that barrier.
Half of the ssDNA target is complementary to the ssDNA mobilized on GNPs and the rest
ssDNA target sequence is complementary to the ssDNA bound to latex microparticles. In the
presence of an ssDNA-target, target will hybridize simultaneously with two DNA on GNPs and
latex microparticles therefore GNPs will bind latex particles, generating large-size, red-colored
conjugates, which become retained by the membrane.
Molecular beacons can be used to detect DNA by fluorescence.9 MBs are single-stranded
ODN probes that possess a stem-and-loop structure. The loop portion is complementary to the
target. A fluorophore and a quencher are linked to the two ends of the stem. In its native state,
the probe is a hairpin, and the two ends of the MB are in close proximity. Consequently, the
fluorescence of the fluorophore is quenched by energy transfer. The hairpin stem is less stable
than the binding between the loop and the target. In the presence of the target, the MB undergoes
a conformational reorganization because the loop hybridizes with the target. The structure is
opened, separating the fluorophore and the quencher. In this case, the MB emits an intensive
fluorescent signal.
1.2. Nucleic acid lateral flow biosensor (NALFB)
Lateral flow biosensor (LFB) is a technique that is used to detect proteins, small
molecules and viral antigens.10 This technique enables the rapid POC (point of care) diagnosis of
infections and diseases like malaria, dengue fever and HIV. The lateral flow biosensor technique
also detects cardiac markers, cancer etc. The lateral flow format uses a sandwich-like structure
3
such as that used in immunoassay: it has two antibodies that are bound to perform
sandwich-style analysis. One antibody, mAb, is bound, initially non-covalently, in a horizontal
stripe on a narrow strip of nitrocellulose. The nitrocellulose is void of protein to avoid vague
observance of analyte and other proteins. The analyte and a second labeled antibody (classically,
it is labeled with colloidal gold) are permitted to stream up nitrocellulose.
Carter and Cary (2007) have identified a method to detect DNA using LFAs.11 Lateral
flow detection of RNA or DNA amplification reaction products offers a method of simplifying
detection of nucleic acids. Dineva et al. (2005) has mentioned that lateral flow devices have been
fabricated predominantly using more than one capture line, permitting more than one analyte.12
As a step toward improving information detection of lateral flow nucleic acids, the researchers
have developed nitrocellulose patterning methods that allow microarray characteristic densities
to be met on compatible substrates of lateral flow. Thus, the lateral flow microarray method
develops sequence-specific detection, opening the door to increasingly multiplexed
implementations for a vast number of assays, well-suited for point of care and other field
applications.
1.3. Principle of NALFB
NALFB is processed on a lateral flow strip biosensor (LFSB), which is composed of
porous membranes, recognition elements, and a signal-generating system (commonly colored
particles as the labels). The LFSB is composed of four components: sample pad, conjugate pad,
nitrocellulose membrane and absorption pad. The movement of liquid along the strip is essential
in the LFSB, thus each part overlaps onto one another to ensure the migration. One end of the
strip is located a sample pad which is usually made of cellulose for loading sample solution (e.g.
target DNA). The conjugate pad, made from glass fiber, is attached with the sample pad; colored

4
particles labeled with recognition elements are dispensed/pipetted (e.g. CNTs-DNA conjugate),
and dried on the conjugate pad. The nitrocellulose membrane acts as detection zone with sprayed
at least two lines: a test line and a control line; the test line is use to recognize the sample analyte
and capture the colored particles to generate the detectable signal, while the control line is used
to validate the proper performance of the strip. The attached absorption pad at the other end of
the strip is to maintain the flow of the liquid since the capillary force of the strip material is the
driving force for the movement of the liquid.
1.4. Labels used in lateral flow assay
Labels used in LFA are essential in the development of LFA which can improve its
sensitivities. The intensity of test line depends on the amount of captured labels in the test zone
or its catalytic effects. The ideal label for LFA would obtain several advantages such as good
stability, wide detection dynamic range and high sensitivity, easy conjugation and low cost.
Various labels including nanotubes (Carbon nanotubes), nanoparticles, nanowires, dye-doped
microbeads and hybrid nanocomposites have been utilized in LFA.
1.4.1. Carbon nanotubes (CNTs)
Carbon nanotubes (CNTs), as a typical one-dimension nanomaterial, have been
successfully demonstrated as sensitive electrochemical biosensors as a result of their unique
physical, chemical, and electrical properties.13-17 Aptamer-modified CNTs field-effect transistors
were fabricated for the detection of thrombin and immunoglobulin E.18 Regarding
electrochemical aptasensors, amperometric aptasensors based on CNT-based nanocomposites
have received the most attention. A simple and efficient post labeling strategy, based on
dye-induced peeling of the aptamer molecules from single-walled CNTs (SWCNTs), was used to
develop an aptasensor for thrombin detection.19 CNTs or their composites show the capacity to

5
function as a signal amplifier by facilitating aptamer probe immobilization and improving the
electrochemical properties of the transducer as a result of their tremendous surface-to-bulk ratios
and excellent electrocatalytic performance. The mainly difference between MWCNTs and
SWCNTs is that MWCNTs contains larger surface area that would potentially immobilize more
DNA probe or protein therefore offer higher DNA probe density on the CNTs surface and higher
hybridization efficiency during the test. Thus MWCNTs is chosen as the DNA carrier rather than
SWCNTs.
1.4.2. Gold nanoparticles (GNPs)
As one of the most popular label in LFA, gold nanoparticles(GNPs) had several
advantages such as its easy preparation and conjugation, bright color for visualization, good
stability and cheaper cost. Large number of tests have been done based on GNPs labels for
detecting infectiousagents,20-21 metabolic disorders,22
toxic compounds.23-25 The qualitative or
semiquantitative detection of analytes would be realized by the visualization with the analysis of
color intensity. However, the detection limit and sensitivity of GNPs-based LFA remains to be
improved, particularly for the detection of trace amount of analytes. Another issue from the
GNPs-based LFB is the aggregation of GNPs–DNA conjugates during the preparation and assay
test.
1.5. Colorimetric analysis
Colorimetric detection is an assay developed for the detection of a target molecule,
indicating the presence of the target with a color change phenomenon. The target molecule can
be anything ranging from a protein, DNA, cell to even metal ions.26 For quantitative
measurements, the optical intensities of both test and control lines on the biosensor were
recorded simultaneously by using a strip reader combined with the ‘GoldBio strip reader’

6
software. The numeric values of recorded data were obtained from pixel images of test and
control lines. The principle of colorimetric analysis here is trying to use Analyzer DT 1030 to
read color intensity of the black band of CNTs on the Lateral Flow Biosensor.
Fig. 1.1. Analyzer DT 1030 is used to read color intensity of the black band on the Lateral Flow
Strip Biosensor
1.6. Chemiluminescence analysis
Chemiluminescence is the generation of electromagnetic radiation as light by the release
of energy from a chemical reaction. Chemical reactions using synthetic compounds and usually
involving a highly oxidized species such as peroxide are commonly termed Chemiluminescence
reactions. The Chemiluminescence used in this study is a reaction between a Chemiluminescence

7
substrate called APS-5 and hydrogen peroxide, without a strong oxidant Chemiluminescence
intensity of APS-5 is very low, Chemiluminescence intensity will dramatically enhance if an
oxidant such as H2O2 presents. Figure. 1.2. shows the reaction between APS-5 and H2O2, first of
all the H2O2 will oxidized the double bond of APS-5 to form an intermediate which is under
excited status and not stable, it will release energy in terms of light and form a ketone structure
finally that is stable.
Fig. 1.2. Chemiluminescence reaction between Lumigen APS-5 and H2O2
1.7. Objective
My research project tries to use MWCNTs as DNA carrier as well as its visual detection
to show the black band on later flow biosensor to check if there’s target DNA presents. The
catalytic property from MWCNTs is used to significantly enhance the Chemiluminescence
reaction between APS-5 and H2O2. Based on this principle, with more target DNA presents,
more MWCNTs will be successfully immobilized onto the test line, a higher Chemiluminescence
intensity could be obtained.
Intermediate((((excited))))

8
2. CARBON NANOTUBES-BASED LATERAL FLOW BIOSENSOR FOR SENSITIVE
AND RAPID DETECTION OF DNA SEQUENCE
2.1. Introduction
Different transducers have been applied in connection with DNA biosensors
(electrochemical, optical, acoustic, piezoelectric, etc.,) have been reported in the literatures.27-29
ecently the application of nanomaterials (nanoparticles, nanowire and nanotubes) for sensitive
detection of DNA becomes more and more popular and draws more and more attention.30-33
Even copies of DNA or RNA can be detected without PCR amplification.34-38 Yet, the
applications of DNA biosensors have been limited because of expensive cost, complex
operations and requirement of trained personnel.39 Recently, nucleic acid lateral flow biosensor
(NALFB) has attracted considerable attention due to its rapid, portable and low-cost
characteristics.40-41 NALFB have gained an increasing attention for performing fast and low-cost
analysis of samples at the place where the samples are collected. Compared to traditional
laboratory analysis platforms, such a lateral flow assay or biosensor has some advantages for
point-of-care or in-field testing: short assay time, small volume of sample, user-friendly and low
cost. The NALFB have been used for clinical diagnosis or screening of diseases, testing drugs of
abuse, monitoring the safety of water and food. While conventional NALFB is based on colloidal
gold and latex or polystyrene beads for visual detection through the color formation, thus this
approach only allows qualitative or semi-quantitative analysis. The application of NALFB is
challenged for detection of trace amount analytes. Therefore, it is highly desirable to develop an
ultrasensitive NALFB for detection of DNA. Chemiluminescence is a sensitive measurement
tool and has been applied in life sciences, clinical diagnosis, environmental and food analysis.
Such high sensitivity is due to the signal amplification from catalytic reaction in the presence of

9
carbon nanotubes to enhance the Chemiluminescence reaction between APS-5 and hydrogen
peroxide. In addition to the wide dynamic range of the Chemiluminescence detection ensures the
analysis of samples with a broad range of concentrations. In addition, Chemiluminescence
detection due to the absence of an excitation source enhances the detectability compared to
fluorescence measurement. Recently Chemiluminescence detection has been used for LFB with
improved detection sensitivity with respect to colloid gold or latex beads based LFB.
2.2. Experimental section
2.2.1. Apparatus
Airjet AJQ 3000 dispenser, Biojet BJQ 3000 dispenser, Clamshell Laminator and the
Guillotine cutting module CM 4000 were from Biodot LTD (Irvine, CA). A portable strip reader
DT1030 was purchased from Shanghai Goldbio Tech. Co., LTD (Shanghai, China). QuantiReader™
Benchtop Luminometer was bought from DiaCarta (Hayward, CA) for Chemiluminescence
detection.
2.2.2. Reagent and materials
Carboxylated multi-walled carbon nanotubes (MWCNTs,purity > 95%), streptavidin,
bovine serum albumin (BSA), N-(3- Dimethyl amino propyl)-N′ ethyl carbodiimide
hydrochloride (EDC), N-hydroxysulfosuccinimide (sulfo-NHS), 2-(4-Morpholino)ethanesulfonic
acid (MES), sucrose, Tween20, phosphate-buffered saline (0.01M PBS, pH7.4), hydrogen
peroxide (H2O2) and sodium chloride-sodium citrate(SSC) buffer 20 concentrate (pH 7.0) were
purchased from Sigma-Aldrich (St.Louis, MO). Lumigen APS-5 was purchase from Lumigen
(Southfield, Michigan). Glass fibers (GFCP000800), cellulose fiber sample pads (CFSP001700),
laminated cards (HF000MC100) and nitrocellulose membranes (HFB24004) were provided from
Millipore (Bedford, MA). All other chemicals were of analytical reagent grade. All buffer
solutions were prepared using ultrapure (>18 MΩ cm) water from a Millipore Milli-Q water

10
purification system (Billerica, MA). All the DNA oligonucleotides used in this study were
purchased from Integrated DNA Technologies, Inc. (Coralville,IA) and had the following
sequence:
Target DNA: 5′-ATGACCTATGAATTGACAGAC-3′.
Amine-modified detection DNA probe: 5′-Amino-GTCTGT CAA-3′.
Biotinylated capture DNA probe: 5′-ATAGGTCAT/Biotin-3′.
Biotinylated control DNA probe: 5′-Biotin/MC6-D/TTGACA GAC-3′.
2.2.3. Preparation of streptavidin-biotinylated DNA conjugates
Two hundred microliter of 2.5 mg/mL of streptavidin was mixed with 50 nmol
biotinylated capture or control DNA probes. Then this mixture was incubated on shaker for 1h.
After that adding 500 μL PBS into the mixture, the solution was centrifuged with centrifugal
filter for 20 min at 6000 rpm at 4 °C. Repeat this step three times. The remaining solution in
filter was diluted to 600 μL by using PBS.
2.2.4. Preparation of shortened multi-walled carbon nanotubes
The carboxylated MWCNTs were firstly treated with mixed concentrated acids
(H2SO4:HNO3.1:3) under ultrasonication for 3 hours, and washed with water for three times.
2.2.5. Preparation of carbon nanotubes-DNA conjugates
Conjugates are prepared based on the following procedures. The MWCNTs (0.5mg) was
treated with 9.6mg-Ethyl-3-(3-dimethylaminopropyl) carbodiimide (EDC) and 5.43mg
N-Hydroxysuccinimide (sulfo-NHS) in 1.0 mL MES buffer (0.1M, pH = 4.7). After shaking at
room temperature for 15min, the mixture was washed by centrifuging at 12,000 rpm for 5min.
Discard the supernatant and resuspend the pellet in PBS buffer. Repeat the above
operations/treatments three times to remove the excess reagents. The amine-modified DNA

11
detection probe was then added to the activated MWCNTs solution with a final concentration at
0.3OD mL-1 and the solution was incubated over night at room temperature. After overnight
incubation, this mixture was centrifuged at 10000 rpm for 20min. The supernatant was discarded
and the pellet was resuspended in PBST. After repeating the above step 3 times, the pellet was
resuspended in 1 mL eluent buffer containing 20mM Na3PO4_12H2O, 5% BSA, 10% sucrose,
and 0.25% Tween-20. The CNTs–DNA conjugate solution was stored at 4°C before further use.
2.2.6. Sample assay procedure
One hundred microliter of sample solution containing different concentration of target
DNA in running buffer (1/4 SSC, 2% BSA) was added onto the sample pad, then the solution
migrated toward absorption pad. The test and control zones could be evaluated visually within
30min. For quantitative measurements, the Chemiluminescence intensities between and APS-5
and H2O2 is evaluated by DiaCarta (Hayward, CA) Chemiluminescence reader, as a result of the
presence of MWCNTs, the reactions between APS-5 and H2O2 could be significantly catalyzed,
based on this principal, with more target DNA presents, more CNTs will be immobilized onto
the test line, therefore the catalytical effect of CNTs to enhance the Chemiluminescence
intensities will be much larger. The digital images of the NALFB were obtained with Nikon
COOLPIXS 4200 camera (Nikon, Japan) and then transferred to a computer.
2.2.7. Colorimetric detection method
The principal of colorimetric detection method is to measure the black color intensity on
the test line, with more target DNA presents, more CNTs could be accumulated onto the test line,
variation amount of target DNA will immobilize different amount of CNTs to the test line
therefore the colorimetric intensity will be different. Figure 2.1. shows the cuvette which
contains lateral flow strips and it can make both test line and control line visible, after strips

12
settle into cuvette, this cuvette will be place into Analyzer DT 1030 to read those color
intensities.
Figure 2.1. Lateral flow strips placed into cuvettes and the color intensity reader: Analyzer DT
1030.
2.2.8. Chemiluminescence detection method
The principal to use Chemiluminescence method to detect the concentration of DNA is based
on the catalytic property of CNTs to significantly enhance the Chemiluminescence intensity of a
reaction between APS-5 and H2O2, if more target DNA presents more CNTs will be immobilized
onto the test line, therefore the catalytic effects from CNTs will become larger. Based on this
principal, after the sample assay procedures, the test lines are obtains. Figure 2.2. shows the
procedures to obtain the Chemiluminescence intensity. Scissors is used to cut the test line part of the
lateral flow strip hence the CNTs is obtained. Then place this test line into one clean cell of 64 well
plate, add the mixture of H2O2 and Lumigen APS-5 then place this 64 well plate into DiaCarta
(Hayward, CA) Chemiluminescence instrumentation, finally use the software on the computer to
read corresponding cell’s Chemiluminescence intensity.

13
Figure 2.2. The principal of Chemiluminescence detection method
2.3. Results and discussions
2.3.1. Principle of Chemiluminescence lateral flow strip biosensor
Fig. 2.1. illustrates the principle of DNA measurement on the MWCNTs based NALFB.
Conjugate DNA probe is complementary with the control line DNA probe. Half of the target
DNA is complementary with the conjugate DNA probe and the rest half of the target DNA is
complementary with the test line DNA probe. Typically, the sample solution containing target
DNA was applied to the sample pad. Subsequently, the solution migrated by capillary action,
then the hybridization reactions between target DNA and the detection DNA probe (conjugate
DNA probe) of MWCNTs–DNA conjugates occurred, and the formed complexes
(MWCNTs–DNA–target DNA) continued to migrate along the strip. After reaching the test
zone, the complexes were captured by the biotinylated capture DNA probe immobilized on the
test zone via the second hybridization reaction. A characteristic black band could be observed
because of the accumulation of MWCNTs on the test zone. Once the solution passed through the
control zone, the excess MWCNTs-DNA conjugates which didn’t successfully bind to the target
DNA probe were captured by the biotinylated control line DNA probe, thus a second black band

14
appeared. In the absence of target DNA, only the black band in the control zone will appear.
Based on the characteristic property of CNTs which can significantly catalyze
Chemiluminescence reaction between Lumigen APS-5 and H2O2, quantitative analysis is
realized by analysis the intensities of Chemilumincence which applied only the test line part of
the strip to enhance the intensity of the reaction between Lumigen APS-5 and H2O2, with more
target DNA presents, more MWCNTs–DNA conjugates can be immobilized onto the test zone
and more carbon nanotubes will present, therefore the Chemiluminescence can be significantly
enhanced based on the principle of CNTs can catalyze the Chemiluminescence of the mixture of
Lumigen APS-5 and H2O2.

15
Fig. 2.3. Schematic illustration of the principle of DNA measurement on MWCNTs-DNA
conjugate based lateral flow biosensor.
2.3.2. Optimization of experimental parameters
To obtain the best performance of MWCNTs-based NALFB, analytical parameters,
including running buffers, the percentage of SSC, the concentration of the amine-modified
detection DNA probe for preparing MWCNTs–DNA conjugates, the number of capture DNA
probes on the test zone, and the volume of the MWCNTs–DNA on the conjugate pad, dilution
percentage of H2O2, dilution times of the mixture of Lumigen APS-5 and hydrogen peroxide,
loading amount of Lumigen APS-5 and H2O2 mixture were optimized. First, we studied the

16
effect of running buffers on the S/N ratio of NALFB. Sample solutions were prepared by diluting
the target DNA stocking solution with different buffers. Fig. 2.4. shows the histogram for the
S/N ratios of NALFB via the buffers. It can be seen the highest S/N ratio was obtained with 1/4
SSC + 2% BSA, which was then used as running buffer in the following NALFB.
Fig. 2.4. S/N of different buffers
Secondly, the percentage of SSC inside the SSC + BSA buffer is optimized as well
because different amounts of salt may affect the binding efficiency of DNA strands. In order to
check the DNA hybridizing efficiency, several different portions of SSC were chosen to test. Fig.
2.5. presents the histogram for the S/N ratios of NALFB via the different percentage SSC
buffers. From the figure it can be observed the highest S/N ratio was obtained with 12.5% SSC,
which was then used as SSC% in the future detection. This percentage of SSC will give the best
hybridizing efficiency of DNA strands.

17
1.407
5.17
1.668
1.17
0
1
2
3
4
5
6
25% 12.50% 6.25% 3.13%
SSC%
S/N
Fig. 2.5. S/N of different SSC% in running buffers
The amount of detection DNA probe bond to the MWCNTs can affect the hybridization
efficiency between the target DNA and detection DNA probe on MWCNTs, and thus affect the
response of NALFB. We optimized the concentration of the amine-modified detection DNA
probe when preparing MWCNTs–DNA conjugates. As seen from Fig. 2.6. the S/N ratio first
increased until 0.3 ODmL-1; a further increase in DNA’s concentration caused a decrease in the
S/N ratio. The S/N ratio loss at a high concentration may be caused by stereo hindrance from the
high density of detection DNA probe on the CNTs surface.
18
1.44
5.15
2.78
0
1
2
3
4
5
6
0.1 OD/mL 0.3 OD/mL 0.5 OD/mL
Concentration of conjugate DNA probe
OD/mLS
/N
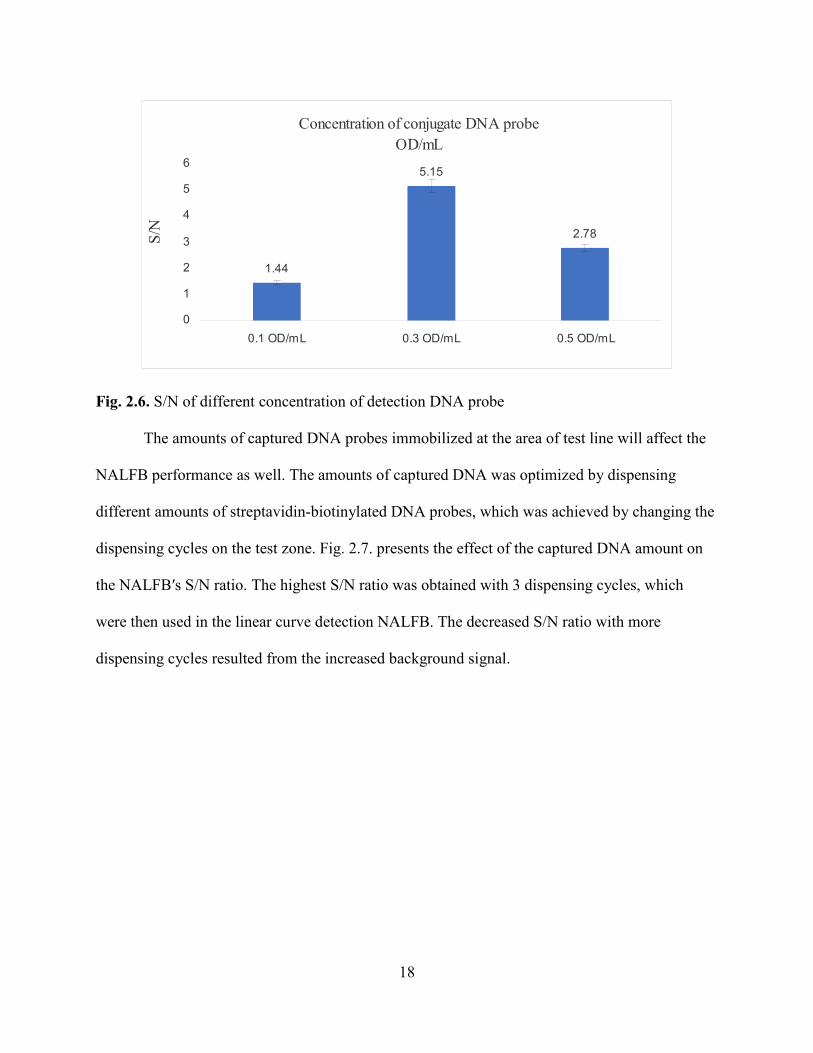
Fig. 2.6. S/N of different concentration of detection DNA probe
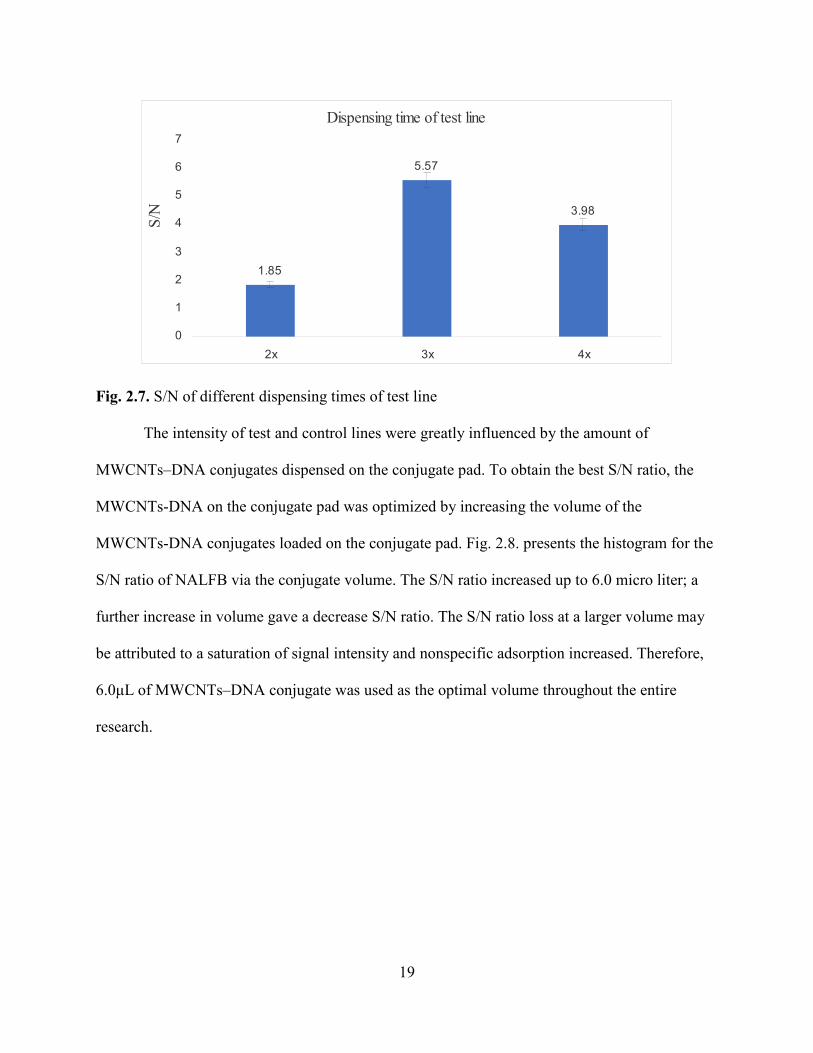
The amounts of captured DNA probes immobilized at the area of test line will affect the
NALFB performance as well. The amounts of captured DNA was optimized by dispensing
different amounts of streptavidin-biotinylated DNA probes, which was achieved by changing the
dispensing cycles on the test zone. Fig. 2.7. presents the effect of the captured DNA amount on
the NALFB′s S/N ratio. The highest S/N ratio was obtained with 3 dispensing cycles, which
were then used in the linear curve detection NALFB. The decreased S/N ratio with more
dispensing cycles resulted from the increased background signal.
19
Dispensing time of test line
1.85
5.57
3.98
0
1
2
3
4
5
6
7
2x 3x 4x
S/N
Fig. 2.7. S/N of different dispensing times of test line
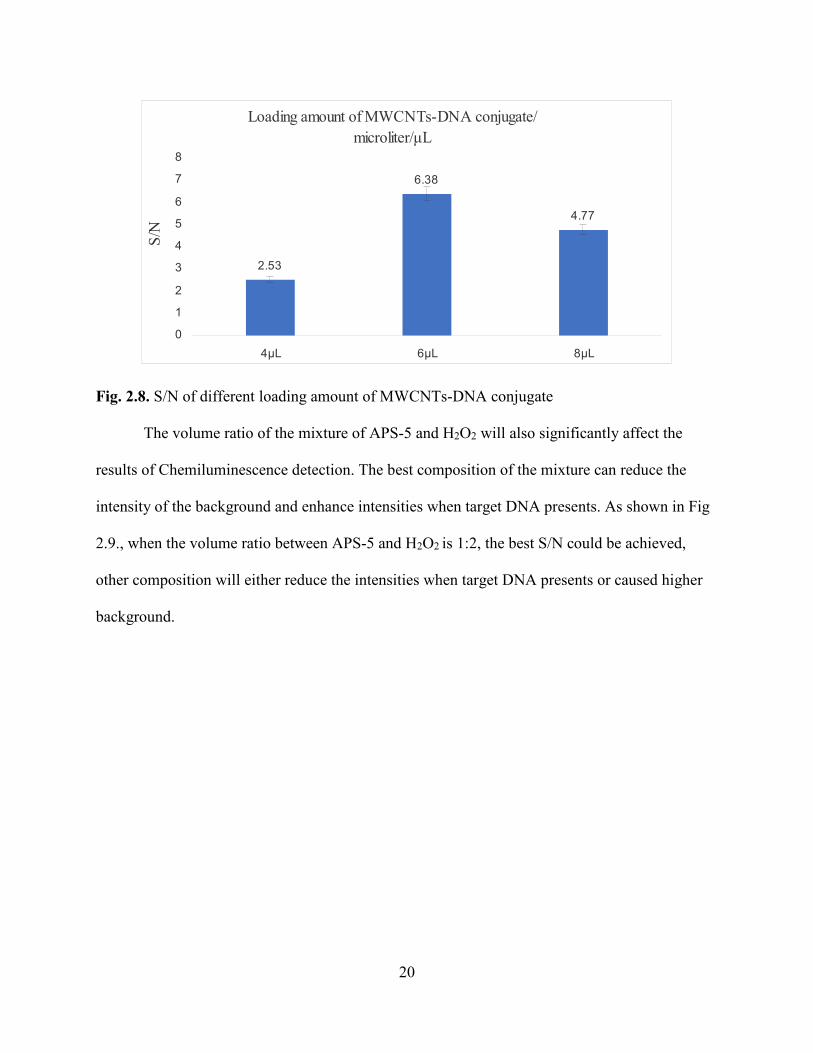
The intensity of test and control lines were greatly influenced by the amount of
MWCNTs–DNA conjugates dispensed on the conjugate pad. To obtain the best S/N ratio, the
MWCNTs-DNA on the conjugate pad was optimized by increasing the volume of the
MWCNTs-DNA conjugates loaded on the conjugate pad. Fig. 2.8. presents the histogram for the
S/N ratio of NALFB via the conjugate volume. The S/N ratio increased up to 6.0 micro liter; a
further increase in volume gave a decrease S/N ratio. The S/N ratio loss at a larger volume may
be attributed to a saturation of signal intensity and nonspecific adsorption increased. Therefore,
6.0μL of MWCNTs–DNA conjugate was used as the optimal volume throughout the entire
research.
20
Loading amount of MWCNTs-DNA conjugate/
microliter/μL
2.53
6.38
4.77
0
1
2
3
4
5
6
7
8
4μL 6μL 8μL
S/N
Fig. 2.8. S/N of different loading amount of MWCNTs-DNA conjugate
The volume ratio of the mixture of APS-5 and H2O2 will also significantly affect the
results of Chemiluminescence detection. The best composition of the mixture can reduce the
intensity of the background and enhance intensities when target DNA presents. As shown in Fig
2.9., when the volume ratio between APS-5 and H2O2 is 1:2, the best S/N could be achieved,
other composition will either reduce the intensities when target DNA presents or caused higher
background.

21
Volume ratio between Lumigen APS-5 and H2O2
2.57
6.33
12.68
8.77
0
2
4
6
8
10
12
14
2:1 1:1 1:2 1:3
S/N
Fig. 2.9. S/N of volume ratio between Lumigen APS-5 and H2O2
The dilution percentage H2O2 is another essential factor of the Chemiluminescence
detection. A good dilution percentage of hydrogen peroxide can reduce the intensity of the
background and enhance intensities when target DNA presents. As shown in Fig 2.10., when the
initial H2O2 (30% H2O2) is diluted 100 times, the best S/N could be reached, other composition
will either caused higher background or reduce the intensities when target DNA presents.
Dilution percentage of H2O2
8.14
12.53
7.15
2.24
0
2
4
6
8
10
12
14
0.60% 0.30% 0.15% 0.01%
S/N
Fig. 2.10. S/N of dilution percentage of H2O2

22
The loading amount of the mixture of H2O2 and APS-5 is another important factor of the
Chemiluminescence detection. To get the best volume of the mixture which can reduce the
intensity of the background and enhance intensities when target DNA presents, several different
amounts are tested. As shown in Fig 2.11., when the volume of the mixture is 50 micro liter the
best S/N could be obtained, other composition will either caused higher background or reduce
the intensities when target DNA presents.
Loading amount of Lumigen APS-5 and H2O2 mixture/μL
6.37
13.68
5.44
3.87
0
2
4
6
8
10
12
14
16
25μL 50μL 100μL 200μL
S/N
Fig. 2.11. S/N of loading amount of Lumigen APS-5 and H2O2 mixture
Because some buffers may have negative effects to the Chemiluminescence reaction
between APS-5 and hydrogen peroxide. Therefore, several different kinds of buffers are tested
again through the Chemiluminescence reaction. As shown in Fig 2.12., SSC + 2% BSA is still
the best buffer which can give the highest S/N, there for 1/8 SSC + 2% BSA will continue be
used as the running buffer of this project.

23
Different buffers in Chemiluminescence detection
8.99
4.474.85
3.76
0
1
2
3
4
5
6
7
8
9
10
SSC + 2%BSA Tris-HCl + 2%BSA PBS PBST
S/N
Fig. 2.12. S/N of different buffers in Chemiluminescence detection
2.3.3. Analytical performance of colorimetric detection method of lateral flow strip
biosensor
After these parameters were optimized, we tested the performance of the
MWCNTs-based NALFB in the presence of different concentrations of target DNA. Each
sample was detected 3 times and the average value of three measurements was used to plot the
calibration curve. Fig. 2.13. presents the typical photo images of MWCNTs-based NALFB after
testing the different concentration of target DNA. No black band was observed in the blank test,
indicating negligible non-specific adsorption under the optimized experimental conditions. The
test line was quite visible when the target DNA concentration is 0.5nM, which can be used as a
threshold for the visual detection of DNA. The resulting calibration curve shows that the
colorimetric intensities versus the concentration of target DNA over the 0.1–20nM range, a good
linear relationship with a detection limit of 1.04nM.

24
Fig. 2.13. Typical photo images (up) of the NALFB in the presence of different DNA
concentrations and the resulting colorimetric calibration curve (middle: from left to right: Blank,
0.1nM, 0.2nM, 0.5nM, 1nM, 2nM, 5nM, 10nM, 20nM) and the resulting calibration curve
(down).

25
2.3.4. Analytical performance of Chemiluminescence detection method of lateral flow strip
biosensor
Under optimal experimental conditions, we examined the performance of the
MWCNTs-based NALFB in the presence of different concentrations of target DNA. Each
sample was also detected 3 times and the average value of three measurements was used to draw
the calibration curve. Fig. 2.14. presents the typical photo images of MWCNTs-based LFB after
testing the different concentration of target DNA. There was no band observed in the control test,
indicating that we can ignore the non-specific adsorption under the optimized experimental
conditions. The intensity of Chemiluminescence of the test line increased with the increase of
target DNA concentration up to 20nM. The black band was quite visible, even in the presence of
0.1nM target DNA, which can be used as a threshold for the visual detection of DNA. The
resulting calibration curve shows that a good linear relationship between the target DNA
concentration and Chemiluminescence intensities within the range between 0.1 to 20nM, with a
detection limit of 0.095nM.

26
Fig. 2.14. Typical photo images (up) of the NALFB in the presence of different DNA
concentrations and the resulting Chemiluminescence calibration curve (middle: from left to right:
Blank, 0.1nM, 0.2nM, 0.5nM, 1nM, 2nM, 5nM, 10nM, 20nM) and the resulting calibration curve
(down).
27
2.3.5. Reproducibility
Except its high sensitivity, the MWCNTs-based NALFB also gave high reproducibility.
The reproducibility of the NALFB was assessed by testing the NALFBs in the absence and
presence of 5.0nM and 50nM target DNA. Samples at the same concentration levels were tested
6 times, the similar responses were obtained at the same concentration levels. The relative
standard deviations (RSD) of the signal for control, 5nM and 50nM were 5.3%, 4.4%, and 9.6%,
which indicates a good reproducibility of the measurements. The stability of the
MWCNTs-based NALFB was also checked by storing the tested NALFB strips at room
temperature for several months. It was found that their responses did not change dramatically.
The RSD of the NALFB for 5nM of target DNA was less than 5% compared with that obtained
with the newly prepared NALFB, indicating the MWCNTs-based NALFB has a good stability.
2.4. Conclusion
I have successfully developed MWCNTs-based NALFB for sensitive and rapid detection
of DNA sequence. The sensitivity of the MWCNTs-based NALFB using Chemiluminescence
detection method was enhanced 10 times compared to the colorimetric detection method. After
systematic optimization, the MWCNTs-based NALFB was capable of detecting 0.095nM DNA.
Moreover, the use of MWCNTs labels avoided the aggregation of conjugates, which was often
met in the traditional gold nanoparticle-based NALFB. The MWCNTs-based NALFB thus open
a new door to prepare a new generation of NALFB, and shows great promise for in-field and
point-of-care diagnosis of genetic diseases and for the detection of infectious agents. The concept
should be extended to visually detect protein biomarkers using the MWCNTs-based NALFB.
Further work will aim to amplify the signal using enzyme-loaded MWCNTs and detect miRNA
in cell-lysate and biological fluids.
28
3. SUMMARY
The research work described in this thesis demonstrated the improved sensitivity of
NALFB based on using MWCNTs as the label and two different measurement strategies. The
amplified response signals were obtained from NALFB combing with MWCNTs,
Chemiluminescence detection methods. Those ultrasensitive biosensors broadened the
application field of NALFB for detection of DNA at trace level which could not be analyzed
using conventional LFSB method. The improved NALFB showed promising applications in
early diagnosis of DNA-related cancer and detection of infectious disease.
The signal amplifications were investigated by these two strategies:
1. A colorimetric detection method using NALFB based on the colorimetric intensity of black
bands of CNTs on the test line.
2. A Chemiluminescence detection method using NALFB based on the catalytic property of
CNTs to enhance the intensity of the Chemiluminescence reaction between APS-5 and H2O2.
Even with highly enhanced sensitivity, the NALFB are still faced with numbers of
challenges for point-of-care diagnosis or on-field application. The analytes tested within complex
biological samples, such as human blood or saliva, is a greatly important future application.
Moreover, to achieve an excellent specificity in validation of DNA for cancer development and
progression, simultaneous analysis of multiplexed DNA strands with biosensor becomes
particularly important in laboratory research and clinical diagnosis. Extensive experiments will
be necessary to be carried out with analysis of patient samples for configuration of reliable
detection platform. More works will also be focused on the multiplex detection on a single LFSB
for diagnostics of the specific cancer-related disease.

29
4. REFERENCES
1. Cheng, X.; Chen, G.; Rodriguez, W.R. Micro- and nanotechnology for viral detection.
Analytical and Bioanalytical Chemistry., 2009, 393, 487–501.
2. Franca, L.T.C.; Carrilho, E.; Kist, T.B.L. A review of DNA sequencing techniques.
Q.Rev.Biophys., 2002, 35 (2), 169–200.
3. Klepárník, K.; Bocek, P. DNA diagnostics by capillary electrophoresis. Chem.Rev. 2007,
107 (11), 5279–5317.
4. Riccardi, C.D.S.; Kranz, C.; Kowalik, J.; Yamanaka, H.; Mizaikoff, B.; Josowicz, M.
Responsive hydrogels for label-free signal transduction within biosensors. Anal. Chem. 2007,
80 (1), 237–245.
5. Joshi, M.; Deshpande, J.D. Polymerase chain reaction: methods, principles and application.
Int.J.Biomed.Res. 2011, 2 (1), 81–97.
6. Mullis, K.B.; Faloona, F.A. Specific synthesis of DNA in vitro via a polymerase-catalyzed
chain reaction. Methods Enzymol, 1987, 155, 335–350.
7. Genetic Science Learning Center. DNA Microarray.
Http://learn.genetics.utah.edu/content/labs/microarray/ (accessed Nov 24, 2016).
8. F.R.R. Teles, L.P. Fonseca. Trends in DNA biosensors. Talanta 2008, 77, 606–623.
9. Blum et al. DNA Biosensors and Microarrays. Chem. Rev. 2008, 108, 109-139.
10. Henderson, K.; Stewart, J. A dipstick immunoassay to rapidly measure serum oestrone
sulfate concentrations in horses. Reprod Fertil Dev, 2000, 12, 183–189.
11. Carter, D. J.; Cary, B. Lateral flow microarrays: a novel platform for rapid nucleic acid
detection based on miniaturized lateral flow chromatography. Nucleic Acid Research., 2007,
35(74).

30
12. Dineva, M. A.; Candotti, D.; Fletcher-Brown, F.; Allain, J. P.; Lee, H. Simultaneous Visual
Detection of Multiple Viral Amplicons by Dipstick Assay. J. Clin. Microbiol., 2005, 43,
4015-4021.
13. Baughman, R. H.; Zakhidov, A. A.; de Heer,W. A. Carbon Nanotubes--the Route Toward
Applications. Science., 2002, 297, 787–792.
14. Kadam, V. Carbon Nanotubes and its Applications: A Review Asian J. Pharm. Clin. Res.
2009, 2 (4), 17–27.
15. Park, S.; Vosguerichian, M.; Bao, Z. A review of fabrication and applications of carbon
nanotube film-based flexible electronics. Nanoscale., 2013, 5, 1727–1752.
16. Qu, L.T.; Dai, L.M.; Stone, M.; Xia, Z.H.; Wang, Z.L. Carbon Nanotube Arrays with Strong
Shear Binding-On and Easy Normal Lifting-Off. Science., 2008, 322, 238–242.
17. Terrones, M. Science and Technology of the Twenty-First Century: Synthesis, Properties,
and Applications of Carbon Nanotubes. Ann. Rev. Mater. Res., 2003, 33, 419–501.
18. Maehashi, K.; Katsura, T.; Kerman, K.; Takamura, Y.; Matsumoto, K.; Tamiya, E.
Label-Free Protein Biosensor Based on Aptamer-Modified Carbon Nanotube Field-Effect
Transistors. Anal. Chem., 2007, 79 (2), 782–787.
19. Park, K.; Kwon, S. J.; Kwak, J. A Label-Free Electrochemical Aptasensor for Thrombin
Using a Single-Wall Carbon Nanotube (SWCNT) Casted Glassy Carbon Electrode (GCE).
Electroanalysis., 2014, 26: 513–520.
20. Salomone, A. Mongelli, M.; Roggero, P.; Boscia, D. Reliability of detection of citrus tristeza
virus by an immunochromatographic lateral flow assay in comparison with ELISA. J. Plant
Pathol., 2004, 86 (1), 43-48.
21. Zhang, G. P.; Guo, J. Q.; Wang, X. N.; Yang, J. X.; Yang, Y. Y.; Li, Q. M.; Li, X. W.; Deng,

31
R. G.; Xiao, Z. J.; Yang, J. F.; Xing, G. X.; Zhao, D. Development and evaluation of an
immunochromatographic strip for trichinellosis detection. Vet. Parasitol., 2006, 137 (3-4),
286-293.
22. Leung, W.; Chan, C. P.; Leung, M.; Lehmann, K.; Renneberg, I.; Lehmann, M.; Hempel, A.;
Glatz, J. F. C.; Renneberg, R. Novel "digital-style" rapid test simultaneously detecting heart
attack and predicting cardiovascular disease risk. Anal. Lett., 2005, 38 (3), 423-439.
23. Klewitz, T. G., F.; Beer, H.; Pflanz, K.; Scheper, T. Immunochromatographic assay for
determination of botulinum neurotoxin type D. Sens. Actuators, B., 2006, 113 (2), 582-589.
24. He, J. Z. et al. Development of a lateral flow dipstick immunoassay for the rapid detection of
glycyrrhizic acid. Food Agric. Immunol. 2006, 17 (3-4), 173-181.
25. Huo, T.; Peng, C.; Xu, C.; Liu, L. Development of colloidal gold-based
immunochromatographic assay for the rapid detection of medroxyprogesterone acetate
residues. Food Agric. Immunol. 2006, 17 (3-4), 183-190.
26. Carter, D. J.; Cary, R. B. Lateral flow microarrays: a novel platform for rapid nucleic acid
detection based on miniaturized lateral flow chromatography. Nucleic Acids Res. 2007, 35
(10), e74.
27. Baeumner, A.J.; Pretz, J.; Fang, S. A universal nucleic acid sequence biosensor with
nanomolar detection limits. Anal.Chem. 2004, 76, 888–894.
28. Mao, X.; Ma,Y.; Zhang,A.; Zhang, L.; Zeng, L.; Liu,G. Disposable Nucleic Acid Biosensors
Based on Gold Nanoparticle Probes and Lateral Flow Strip. Anal. Chem. 2009, 81 (4),
1660–1668.
29. Sassolas, A.; Leca-Bouvier, B.D.; Blum, L.J. DNA Biosensors and Microarrays. Chem. Rev.,
2008, 108 (1), 109–139.

32
30. Mao, X.; Liu, G. Nanomaterial Based Electrochemical DNA Biosensors and Bioassays. J.
Biomed. Nanotechnol. 2008, 4 (4), 419–431.
31. Liu, J.; Liu, J.; Yang, L.; Chen, X.; Zhang, M.; Meng, F.; Luo, T.; Li, M.
Nanomaterial-Assisted Signal Enhancement of Hybridization for DNA Biosensors: A
Review. Sensors, 2009, 9, 7343–7364.
32. Pumeraa, M.; Sanchez, S.; Ichinosec, I.; Tang, J. Electrochemical nanobiosensors. Sens.
Actuators B, 2007, 123, 1195–1205.
33. Xu, K.; Huang, J.; Ye, Z.; Ying, Y.; Li, Y. Recent Development of Nano-Materials Used in
DNA Biosensors. Sensors, 2009, 9 (7), 5534–5557.
34. Cannon, B.; Campos, A.R.; Lewitz, Z.; Willets, K.A.; Russell, R. Zeptomole detection of
DNA nanoparticles by single-molecule fluorescence with magnetic field-directed
localization. Anal. Biochem, 2012, 431 (1), 40–47.
35. Liu, Y.; Zhang, M.; Yin, B.; Ye, B. Attomolar Ultrasensitive MicroRNA Detection by
DNA-Scaffolded Silver-Nanocluster Probe Based on Isothermal Amplification. Anal.Chem,
2012, 84 (12), 5165–5169.
36. Nam, J.; Stoeva, S.I.; Mirkin, C.A. Bio-Bar-Code-Based DNA Detection with PCR-like
Sensitivity. J.Am.Chem.Soc, 2004, 126, 5932–5933.
37. Zhang, Y.; Pothukuchy, A.; Shin, W.; Kim, Y.; Heller, A. Detection of ∼103 Copies of DNA
by an Electrochemical Enzyme-Amplified Sandwich Assay with Ambient O2 as the
Substrate. Anal.Chem, 2004, 76, 4093–4097
38. Zhao, X.; Tapec-Dytioco, R.; Tan, W. Ultrasensitive DNA Detection Using Highly
Fluorescent Bioconjugated Nanoparticles. J.Am.Chem.Soc, 2003, 125, 11474–11475.
39. He, Y.; Zhang, S.; Zhang, X.; Baloda, M.; Gurung, A.S.; Xu, H.; Zhang, X.; Liu, G.

33
Ultrasensitive nucleic acid biosensor based on enzyme–gold nanoparticle dual label and
lateral flow strip biosensor. Biosens. Bioelectron, 2011, 26 (5), 2018–2024.
40. Roskos, K.; Hickerson, A.I.; Lu, H.W.; Ferguson, T.M.; Shinde, D.N.; Klaue, Y.; Niemz,
A. Simple System for Isothermal DNA Amplification Coupled to Lateral Flow Detection.
PLoS One, 2013, 8 (7), e69355.
41. Terao, Y.; Yonekita, T.; Morishita, N.; Fujimura, T.; Matsumoto, T.; Morimatsu, F. Potential
Rapid and Simple Lateral Flow Assay for Escherichia coli O111. J. Food Prot, 2013, 76 (5),
755–761.


![Protein- and Peptide-Based Biosensors in Artificial Olfaction · A human OR (hOR)-based biosensor for VOC sensing has been coupled to carboxylated polypyrrole nanotubes [36]. Conductivity](https://static.fdocuments.in/doc/165x107/5bf5505209d3f2006b8b501b/protein-and-peptide-based-biosensors-in-artificial-olfaction-a-human-or-hor-based.jpg)