Carbon Nanotubes based Electrode Architectures for ... · Internal Resistance 𝑅 = 𝜌𝑡 𝐴...
37
Carbon Nanotubes based Electrode Architectures for Enhanced Lithium Ion Battery Performance Ahmed Busnaina, W. L. Smith Professor and Director, Northeastern Univ. NSF Nanoscale Science and Engineering center for High-rate Nanomanufacturing www.nanomanufacturing.us
Transcript of Carbon Nanotubes based Electrode Architectures for ... · Internal Resistance 𝑅 = 𝜌𝑡 𝐴...

Carbon Nanotubes based Electrode
Architectures for Enhanced Lithium Ion
Battery Performance
Ahmed Busnaina,
W. L. Smith Professor and Director, Northeastern Univ.
NSF Nanoscale Science and Engineering center for High-rate
Nanomanufacturing
www.nanomanufacturing.us

Introduction
1. Introduction
2. Background
3. Layer-by-Layer Electrode
Architecture
4. Conclusions

Next generation battery –Requirements
Charge rate of 1C or greater; i.e. 1 hour or less.
Energy density of > 300 Wh/kg.
Cycle life of > 20,000 cycles.
Thermal cycle survivability of -40oC to +75oC.
Storage life of 5 years.
Significant reduction or elimination of thermal runaway.

What is the State of the Art
Limited
improvement
has been
achieved over 2
centuries
40-60% of a typical battery’s weight is its enclosures and protective
covers. (Dead weight)
To have high power output several cells need to work in tandem
(connected parallel).
For high power applications dead
weight has to be reduce to achieve goals.

Current Li-ion Drawback- Cannot be used for high
power / high energy applications
Current State of the Art Li-
ion Technology
Cycle Life typically 300
deep discharge cycles
(1 Year)
Mostly small (5W)
Safety Issues with
Large Packs
In typical lithium ion battery Anode and cathodes are sheets -- If prepared by
conventional methods their performance degrades with increase in thickness. i.e.
long charging times and low power output.
Faster charging can lead to thermal runaway Batteries bursting
Performance degrades after ~1000 cycles
High power requirements IMPEDES high energy.

Battery Performance
Capacity
Cycle Life
Power Density
Energy Density
Figure Source: Padbury and Zhang, Journal
of Power Sources, 2011
Factors influencing commercial
viability of batteries
Performance
Cost
Size/Weight
Safety
Sustainability

Working Principle

Governing Equations
Power Output
of a Battery:
𝑃 =𝑉2
𝑅𝑖
Ohm’s Law To maximize
power, minimize
internal
resistance

Internal Resistance
𝑅𝑖 = 𝑅𝑒 + 𝑅𝑠𝑜𝑙 + 𝑅𝑖𝑜𝑛 + 𝑅𝑐𝑡
Re: Electrical
resistance of bulk
material
Rsol: Resistance in
electrolyte
Rion: Ionic resistance
of active material
Rct: Charge transfer
resistance
Figure Source: Ogihara et
al. J. Electrochem. Soc.,
2012

Internal Resistance
𝑅𝑒 = 𝜌𝑡
𝐴
𝑅𝑠𝑜𝑙 = 𝐿
𝜅𝐴
𝑅𝑖𝑜𝑛 = 𝑡
𝜅𝑒𝑓𝑓𝐴
𝑅𝑐𝑡 =𝑅𝑇
𝑛𝐹𝑖0
Internal resistance depends
on both material used and
geometry of the battery
ρ: resistivity
t: thickness
A: area
L: distance between electrodes
κ: ionic conductivity of electrolyte
κeff: effective ionic conductivity of electrode
R: gas constant
T: temperature
n: number of electrons
F: Faraday constant
i0: exchange current

Cathode Materials
Typically transition metal oxides
Lithium metal oxide crystal structures:
Figure source: Thackeray, Nature Materials, 2002
Increasing rate
capability and safety
Increasing
energy density

Anode Materials
Graphitic carbon
Silicon
Figure source: Bianco, ed.
2011
One of a number of high-capacity
anode materials, silicon has the
highest known theoretical capacity.

Nanomaterials
Nano
Micro
Figure sources: (nanowires) Bourzac, MIT Tech. Rev., 2009, (hollow
nanospheres) Ding et al. J. Mat. Chem., 2011, (graph) Chen et al. J. of
Power Sources, 2011

Nanomaterials
Advantages:
• Shorter ion diffusion lengths lead
to faster ion insertion and
extraction
• Novel lithium ion storage
mechanisms
• More ion storage sites accessible
within charging time due to
decreased diffusion length
• High surface area increases
electrolyte wetting, making more
surface storage sites accessible
• Structural integrity
Disadvantages:
• Low packing density
• High surface area increases
unwanted reactions with
electrolyte
• Consumption of lithium ions
• Complicated and/or costly
synthesis
• Nanomaterials often
hazardous
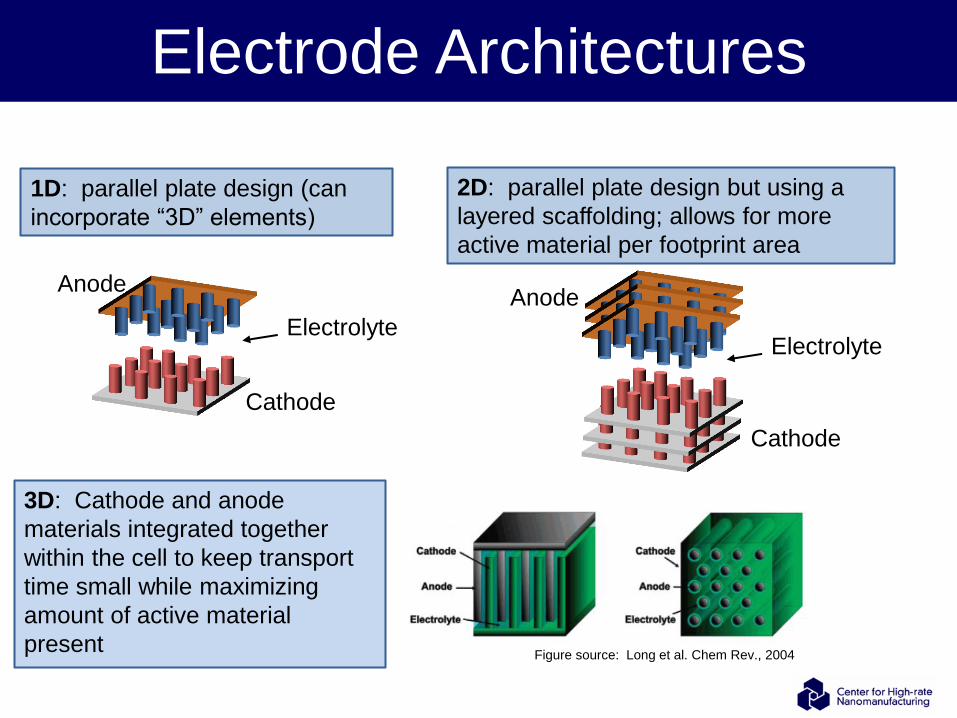
Electrode Architectures
1D: parallel plate design (can
incorporate “3D” elements)
2D: parallel plate design but using a
layered scaffolding; allows for more
active material per footprint area
3D: Cathode and anode
materials integrated together
within the cell to keep transport
time small while maximizing
amount of active material
present Figure source: Long et al. Chem Rev., 2004
Anode
Cathode
Electrolyte
Anode
Cathode
Electrolyte

Our Approach
Faster Charging Time
Hig
her
En
erg
y
Existing
Our Goal:
NPS
CNT based scaffolding
electrode architecture.
Enhanced electronic &
ion transport.
Reduced footprint &
battery dead weight.
Reduced thermal
runaway.
Unique manufacturing
process.
Breakthrough Technology

Specific Project Tasks
Layer-by-Layer
CNT/nanoparticle
architecture for
lithium ion battery
performance
enhancement using a
high-rate scalable
fabrication procedure
1. Develop the layered architecture in order to enhance the ionic
and electronic conductivities of the electrode.
2. Compare the electrodes with those made using standard
fabrication methods.
3. Investigate the effects of electrode thickness and composition,
number of layers, and fabrication methods on cell
performance.
4. Examine physical properties of electrodes before and after
cycling to enhance understanding of internal changes within
the cell due to cycling and assess durability of electrode
architecture.
5. Explore various fabrication techniques and develop a process
which is low-cost, high-rate, and scalable.

Fabrication Procedure

CNT Paper
Advantages:
• CNT paper is very strong and
flexible—can be used to make
flexible or even foldable batteries
• No substrate needed—reduces
weight and thickness of battery
• Can be used to make any shape
Disadvantages:
• CNT layers are thicker than
sprayed CNT layers—increased
amount of inactive material
• Not compatible with spraying
method
• Possible problems with doctor
blade approach

Half-Cell Approach
T-cell Coin cell
Lithium foil counter electrode
Polypropylene separator
LiPF6 in ethylene carbonate/dimethyl carbonate
electrolyte

Our CNT scaffolding Architecture
• At 1C, LMO exhibits 5.4%
capacity fade after 100 cycles
0 20 40 60 80 100 1200
20
40
60
80
100
120
9.1 mg/cm2
Linear Fit of DDis
ch
arg
e C
ap
acit
y (
mA
h/g
)
Cycle Number
Equation y = a +
Adj. R-Sq 0.9729
Value Standard
D Interce 107.96 0.06188
D Slope -0.058 9.02561E
0 5 10 15 20 250
20
40
60
80
100
120
Standard 3.0mg/cm2
Linear Fit of BDis
ch
arg
e C
ap
acit
y (
mA
h/g
)
Cycle Number
Equation y = a
Adj. R-S 0.981
Value Standard
B Interc 108.5 0.23756
B Slope -0.60 0.01809
• At C/10, LMO exhibits 11%
capacity fade after 20 cycles
Standard architecture
Layered architecture improve the Arial power density, energy density.
At full charge in 5 min (10C), it shows 25 times more capacity compared to
standard battery.
Longer life (less fading) and 40% lighter
Low manufacturing cost, compatible with any Li-ion Battery chemistry.
Dead weight of the battery is reduced by 40%.
Preliminary Results: CNT Li-ion Battery

25µm 45 µm
Our electrodes: 9.1mg/cm2
Density: 3.64mg/cm3
Standard: 5.6 mg/cm2
Density: 1.27mg/cm3
Our technology exhibits higher volumetric energy density
Optimization can further improve
the volumetric energy density
Increased Volumetric Energy Density

Our electrode electrode = 1.0m Ah/cm2; Standard electrode is 0.328Ah/cm2
At 10C our electrode exhibits 25x more capacity per unit area than the
standard electrode
At 2C and 4C they exhibit 4X increment
0 10 20 30 40 500
20
40
60
80
100
120 One, 2.4 mg/cm
2
Four, 8.93 mg/cm2
Std, 2.76 mg/cm2
Dis
ch
arg
e C
ap
ac
ity
(m
Ah
/g)
C-Rate
1 2 3 40
2
4
6
8
10
Number of Active Material Layers
Acti
ve M
ate
rial L
oad
ing
(m
g/c
m2)
0.2
0.4
0.6
0.8
1.0Discharge Capacity
Active Material Loading Dis
ch
arg
e C
ap
acity
(mA
h/c
m2)
Increased Power density

Capacity increases linearly with loading: upper limit on
loading has not been reached
LMO Cathode: Increased Loading
0
0.5
1
1.5
2
2.5
3
3.5
4
4.5
0 5 10 15 20 25 30 35 40
Init
ial D
isch
arge
Cap
acit
y (m
Ah
)
Loading (mg)
Previously
explored area
Commercially
viable loading

LMO Cathode High-Power Applications:
Cycling Performance
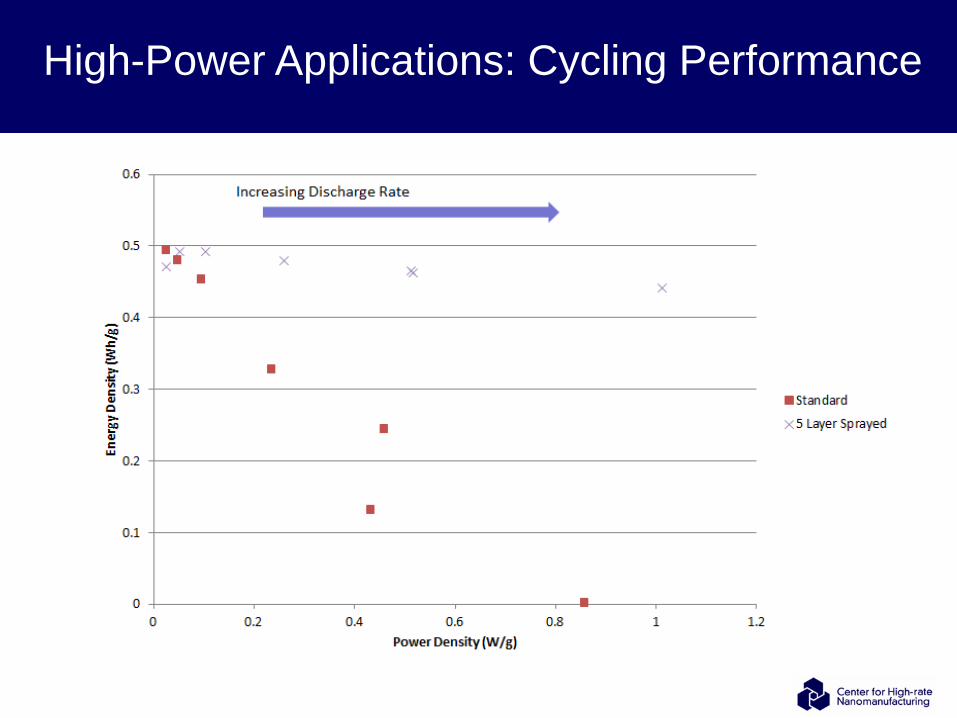
High-Power Applications: Cycling Performance

CNT Paper Cathodes: Comparison to
Deposited CNT
Extremely similar cycling
performance

Minimizing Thermal Runaway
High Temperatures Cycling at 1C Rate
Battery architecture at 500C has similar performance as
that of standard electrode at 250C.
LMO

1. Specific
energy
(mWh/cm2)
2. Specific
power
(mW/cm2)
3. Inactive
Components
(%)
4. Cycle Life
(Fading)
5. Volumetric
energy density
(mWh/cm3)
6.
Fabrication
Cost
1. J. Electrochem.
Soc. 2000. 1.92 28.8 22
No long term
study High Low
2. Nano Letters
.2010. 0.432 8.64 25
78 mAh/g for
100 cycles Low Very high
3. J. Mater. Chem.
2011. 1.92 4.8 30
4.8% loss after
80 cycles Low Moderate
4. J. Power
Sources. 2011. 1.44* 40.8* 20
No long term
study Low Low
5. J. Mater. Chem.
2013 2.02 14.3 20
8% loss after
100 cycles High High
6. J. Mater. Chem.
2011. 0.96* 80* 44
4% loss after
100 cycles Low Moderate
7. Our
Work 4.32 21.6 13-23
5% loss after
100 cycles Very high Low
* Low energy density and high power density (similar to a capacitor)
Yellow highlights indicate necessary values for commercialization
Comparison with Our Layered CNT Battery
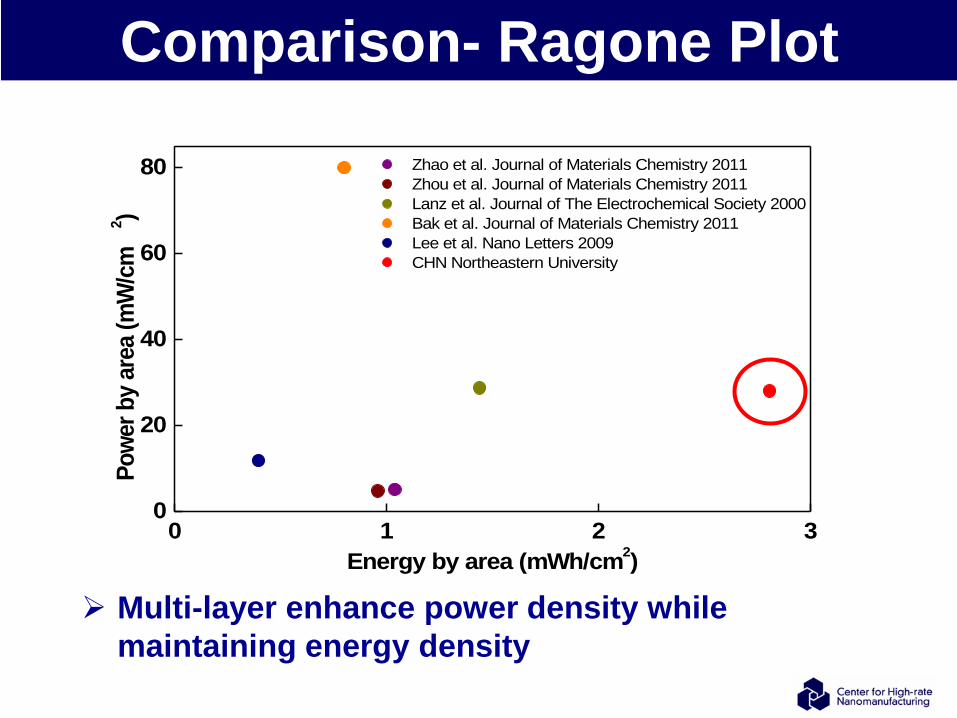
Comparison- Ragone Plot
0 1 2 30
20
40
60
80 Zhao et al. Journal of Materials Chemistry 2011
Zhou et al. Journal of Materials Chemistry 2011
Lanz et al. Journal of The Electrochemical Society 2000
Bak et al. Journal of Materials Chemistry 2011
Lee et al. Nano Letters 2009
CHN Northeastern University
P
ow
er
by a
rea (
mW
/cm
2)
Energy by area (mWh/cm2)
Multi-layer enhance power density while
maintaining energy density
0
10
20
30
40
50
60
70
0 2 4 6 8 10 12
Dis
char
ge C
apac
ity
(mA
h/g
)
Cycle Number
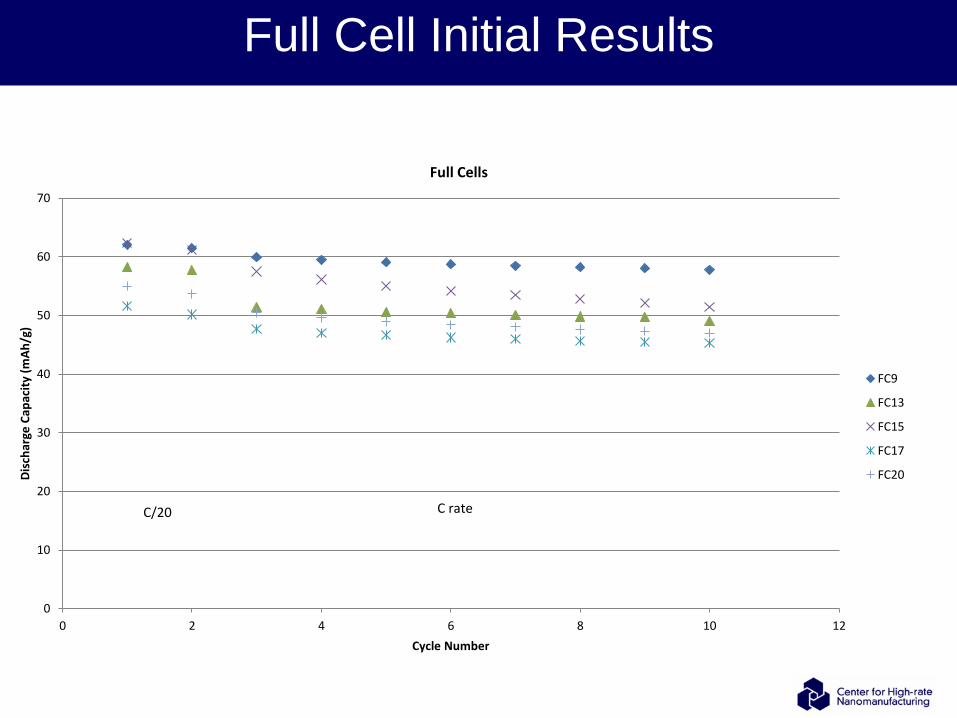
Full Cells
FC9
FC13
FC15
FC17
FC20
C/20 C rate
Full Cell Initial Results

0
10
20
30
40
50
60
70
80
90
2.40 2.50 2.60 2.70 2.80 2.90 3.00 3.10 3.20
Init
ial D
isch
arge
Cap
acit
y (m
Ah
/g)
Cathode : Anode Mass Ratio
Ideal ratio between
2.75 and 3.00
Full Cells: Determination of Matching Ratio

Conclusions and Future Directions
LMO cathodes with high loading successfully fabricated
Compared to standard fabrication cathodes of similar loading,
multi-layer cathodes show much higher rates
Established good connectivity between layers
Density of CNT layers investigated; little impact on performance
When charged at a lower rate than discharged, a multi-layer
cathode of higher loading shows much higher rates compared to a
standard fabrication cathode.
Alternative to sprayed CNT layers investigated; showed that nearly
identical performance can be achieved
Future work may include flexible or very large, thin batteries.

Determined ideal matching ratio to be between 2.75 and 3.00
Capacity retention for full cells still needs improvements.
Reasons may include:
• Uncertainty in the mass of hand-made electrodes
• Ratio is based on first cycle data; ideal ratio may shift as
cycling continues
• Side reactions consuming lithium ions that are currently
unaccounted for
Future work will need to address capacity fade
Conclusions and Future Directions

Acknowledgements
Battery Project Collaborators:
Sharon Kotz, Ankita Faulkner, Siva Somu, Nurullah Ates,
Gizem Yilmaz, Ahmed Busnaina,
Young Joon Jung, Sanjeev Mukerjee, K.M. Abraham

감사합니다
Prof. Ahmed Busnaina
Northeastern University
www.nano.neu.edu
www.nanomanufacturing.us

![Fiat-Shamir: from Practice to Theory · ∀PPT 𝐴, Pr ℎ←𝐻 𝑥←𝐴(ℎ) T,ℎ T∈ = H ... Need enc. with KDM security for bounded functions. Known [BHHI10,BGK11,A11]](https://static.fdocuments.in/doc/165x107/5d46da6d88c9936a5f8ba23b/fiat-shamir-from-practice-to-theory-ppt-pr-.jpg)