Carbon isotopic fractionation of CH and CO during canister
13
Carbon isotopic fractionation of CH 4 and CO 2 during canister desorption of coal Dariusz Stra ˛ poc ´ a, * , Arndt Schimmelmann a , Maria Mastalerz b a Department of Geological Sciences, Indiana University, 1001 E. Tenth Street, Bloomington, IN 47405-1405, USA b Indiana Geological Survey, Indiana University, 611 N. Walnut Grove, Bloomington, IN 47405-2208, USA Received 20 June 2005; accepted 4 October 2005 (returned to author for revision 27 September 2005) Available online 7 December 2005 Abstract Canister desorption of coal gas from freshly sampled coal is commonly used for exploratory assessment of the coalbed methane (CBM) potential of a basin or prospect, as well as for the sampling of gas for isotopic determination of the gas origin. Compositional and d 13 C isotopic time-series of desorbing CBM and carbon dioxide (CO 2 ) over 3–4 months dem- onstrate considerable compositional and isotopic shifts over time. Non-stationary chemical and isotopic characteristics are due to differences in diffusivity and adsorbance behavior of gas molecules and must be taken into account when attempting to reproducibly sample coal gases. Off-line gas processing on a vacuum line and on-line GC/MS analyses were performed on coal gas samples from the Springfield and Seelyville Coal Members of the Pennsylvanian age that were cored in the SE Illinois Basin in SW Indiana, USA. The coals cover a narrow range of maturity from 0.54% to 0.64% vitrinite reflectance. Methane initially desorbed faster than CO 2 , resulting in a 50% increase of the CO 2 content in bulk desorbing gas on the 50th day relative to the first day of desorption. After 50 days of desorption, about 90% of all coal gas was desorbed. Over the same time period, d 13 C values of incrementally sampled coal gas increased by 2& and 9&, for CH 4 and CO 2 , respectively, testifying to the greater retention of 13 CH 4 and 13 CO 2 relative to 12 CH 4 and 12 CO 2 . An isotopic mass balance of the individual, sequentially des- orbed and sampled gas amounts yielded weighted mean d 13 C CH 4 and d 13 C CO 2 values for characterizing the cumulatively desorbed gas. The overall mean d 13 C values were equivalent to d 13 C values of gases that desorbed at a time when half of the potentially available gas had been desorbed from coal, corresponding in this study to a time between day 5 and day 12 of canister desorption at 15–18 °C. The total expected gas volume and the 50% midpoint can thus be approxi- mated for a desorbing coal gas sample, based on a dynamic prediction after the first five days of canister desorption. Ó 2005 Elsevier Ltd. All rights reserved. 1. Introduction The use of stable isotope ratios in coalbed meth- ane (CBM) exploration requires a practical and rea- sonably fast method for desorbing and sampling of gas. Coal from freshly drilled cores is typically placed in desorption canisters (Gas Research Insti- tute, 1995) from which desorbed gas is subsequently sampled for isotopic analysis. Desorption from coal proceeds over weeks and months, with gas yields decreasing exponentially over time and desorbed 0146-6380/$ - see front matter Ó 2005 Elsevier Ltd. All rights reserved. doi:10.1016/j.orggeochem.2005.10.002 * Corresponding author. E-mail address: [email protected] (D. Stra ˛ poc ´). Organic Geochemistry 37 (2006) 152–164 www.elsevier.com/locate/orggeochem Organic Geochemistry
Transcript of Carbon isotopic fractionation of CH and CO during canister

Organic Geochemistry 37 (2006) 152–164
www.elsevier.com/locate/orggeochem
OrganicGeochemistry
Carbon isotopic fractionation of CH4 and CO2 duringcanister desorption of coal
Dariusz Strapoc a,*, Arndt Schimmelmann a, Maria Mastalerz b
a Department of Geological Sciences, Indiana University, 1001 E. Tenth Street, Bloomington, IN 47405-1405, USAb Indiana Geological Survey, Indiana University, 611 N. Walnut Grove, Bloomington, IN 47405-2208, USA
Received 20 June 2005; accepted 4 October 2005(returned to author for revision 27 September 2005)
Available online 7 December 2005
Abstract
Canister desorption of coal gas from freshly sampled coal is commonly used for exploratory assessment of the coalbedmethane (CBM) potential of a basin or prospect, as well as for the sampling of gas for isotopic determination of the gasorigin. Compositional and d13C isotopic time-series of desorbing CBM and carbon dioxide (CO2) over 3–4 months dem-onstrate considerable compositional and isotopic shifts over time. Non-stationary chemical and isotopic characteristics aredue to differences in diffusivity and adsorbance behavior of gas molecules and must be taken into account when attemptingto reproducibly sample coal gases.
Off-line gas processing on a vacuum line and on-line GC/MS analyses were performed on coal gas samples from theSpringfield and Seelyville Coal Members of the Pennsylvanian age that were cored in the SE Illinois Basin in SW Indiana,USA. The coals cover a narrow range of maturity from 0.54% to 0.64% vitrinite reflectance. Methane initially desorbedfaster than CO2, resulting in a 50% increase of the CO2 content in bulk desorbing gas on the 50th day relative to the firstday of desorption. After 50 days of desorption, about 90% of all coal gas was desorbed. Over the same time period, d13Cvalues of incrementally sampled coal gas increased by 2& and 9&, for CH4 and CO2, respectively, testifying to the greaterretention of 13CH4 and
13CO2 relative to 12CH4 and12CO2. An isotopic mass balance of the individual, sequentially des-
orbed and sampled gas amounts yielded weighted mean d13CCH4and d13CCO2
values for characterizing the cumulativelydesorbed gas. The overall mean d13C values were equivalent to d13C values of gases that desorbed at a time when halfof the potentially available gas had been desorbed from coal, corresponding in this study to a time between day 5 andday 12 of canister desorption at 15–18 �C. The total expected gas volume and the �50% midpoint can thus be approxi-mated for a desorbing coal gas sample, based on a dynamic prediction after the first five days of canister desorption.� 2005 Elsevier Ltd. All rights reserved.
1. Introduction
The use of stable isotope ratios in coalbed meth-ane (CBM) exploration requires a practical and rea-
0146-6380/$ - see front matter � 2005 Elsevier Ltd. All rights reserved
doi:10.1016/j.orggeochem.2005.10.002
* Corresponding author.E-mail address: [email protected] (D. Strapoc).
sonably fast method for desorbing and sampling ofgas. Coal from freshly drilled cores is typicallyplaced in desorption canisters (Gas Research Insti-tute, 1995) from which desorbed gas is subsequentlysampled for isotopic analysis. Desorption from coalproceeds over weeks and months, with gas yieldsdecreasing exponentially over time and desorbed
.

D. Strapoc et al. / Organic Geochemistry 37 (2006) 152–164 153
gases expressing isotope fractionation. In this study,we quantify gas speciation and isotopic fraction-ation during sequential desorption of CH4 andCO2 from high-volatile, bituminous coal expressinga narrow range of maturity from 0.54% to 0.64%vitrinite reflectance (Ro). Our method for rapid par-tial canister desorption and gas sampling arrives at13C/12C ratios (expressed as d13C values) that arerepresentative of the total gas desorbed from thecoal.
Stable isotope ratios of natural gases are rou-tinely used to distinguish between geochemicalsources of coal gases, for example, to discriminatebetween thermogenic and biogenic (i.e., microbiallygenerated) gases (Schoell, 1983; Scott et al., 1994;Smith and Pallasser, 1996; Katz et al., 2002; Mar-tini et al., 2003). Typical d13CCH4
values of thermo-genic methane range from �20& to �50&,whereas biogenic methane from microbial acetatefermentation ranges ��45& to �65&, and meth-ane from microbial CO2-reduction is even moredepleted at ��60& to �110& (Scott et al., 1994;Jedrysek, 1995; Whiticar, 1996). Methane generatedmicrobially via CO2-reduction is typically accompa-nied by residual 13C-enriched CO2 withd13CCO2
� zero to 20&, whereas thermogenic meth-ane is typically associated with CO2 rangingbetween �10& and �30& (Scott et al., 1994).Because thermogenic and biogenic gas mixturesexpress distinct carbon isotopic characteristics intheir CH4 and CO2 components, the differencesDd13C(CH4–CO2) range from 60& to 80& for bio-genic, and from 20& to 40& for thermogenic gases(Smith et al., 1992). The diagnostic value of isotopicparameters of desorbed gases from coal can becompromised by isotope fractionation during par-tial gas desorption. Earlier observations notedincreases in d13C of gases desorbing from SydneyBasin coal (Gould et al., 1987): (i) CH4 and CO2
Table 1Coal samples analyzed for coal gas desorption in this study
Coal seam County Depth (m) Ro (%) No. of gas s
Seelyville Sullivan 128 0.62 10Seelyville Sullivan 170 0.64 3Springfield Sullivan 114 0.59 3Seelyville Gibson 137 0.64 3Seelyville Gibson 138 0.54 6Seelyville Gibson 139 0.57 4
Gases from coal sample V-3/1 were analyzed both off-line and on-lineexcess gases were vented on a daily basis, except for coal sample II-3/5 wventing between measuring and sampling, each step representing 5–30designations given in the field.
emanating from 20-l drums filled with 2–10-cm-diameter coal lumps increased their d13C valuesover five months by 5.0–10.0& and by 2.5&,respectively; (ii) methane from a pillar boreholebecame enriched in 13C by 4.0&, and (iii) from avirgin coal borehole by 1&. Carbon isotopic shiftsof individual gas species (Dd13C) were suggested tobe diffusion-controlled and decrease with increasingsize of the desorbing body of coal. A canister-desorption study of Sydney Basin CBM found 1–2& 13C-enrichment in CH4 over two weeks forcoals ranging in vitrinite reflectance Ro from 0.7%to 1.5% (Faiz et al., 2002). CBM desorbing overone month from higher-rank (Ro 2.6–3.7%), vitri-nite-rich coal from the Qinshui Basin expressed aneven larger Dd13CCH4
of 3–15& (Hu et al., personalcommunication). A recent study by Niemann et al.(2005) reports 13C-enrichment of CBM desorbingform coals across a wide range of maturities.
2. Materials and methods
Whole cores were obtained from Springfield andSeelyville Coal Members in Sullivan and Gibsoncounties, Indiana, in the southeastern part of theIllinois Basin, from depths between 114 and 170 m(374–560 ft) (Table 1). These high-volatile bitumi-nous coals of Pennsylvanian age with Ro from0.54% to 0.64% are potential CBM targets in Indi-ana (Drobniak et al., 2004; Mastalerz et al., 2004).Immediately, after recovery of a whole core in thefield, one or more coal core segments with a diame-ter of �7.6 cm (3 in.) and a length of �30 cm (1 ft)were quickly sealed in a nitrogen-purged desorptioncanister with a 2.7-l internal volume. Desorptiontook place at ambient pressure and temperature of�15–18 �C, similar to reservoir temperatures forIndiana coals, first in the field and subsequently inthe laboratory.
amples for d13C analyses during desorption Coal core name
V-3/1IV-3/4III-5II-3/2II-3/5II-3/7
for comparison. Desorbed gases from all coals were sampled andhere desorbed gas volumes were sampled in six steps without any% of the total gas volume. V-3/1, IV-3/4, etc. represent sample
154 D. Strapoc et al. / Organic Geochemistry 37 (2006) 152–164
Desorbed gas was measured using a volume dis-placement apparatus (Fig. 1), following the stan-dard canister desorption protocol (Gas ResearchInstitute, 1995) until desorption completely ceasedand the total desorbed gas volume and coal gas con-tent were obtained. At selected time intervals,mostly on a daily basis, the desorbed gas was volu-metrically measured and either vented or selectedsamples were taken for compositional and isotopicanalyses. The frequency of volumetric measurementof desorbing gas and venting was highest in the first24 h, followed by increasingly longer intervalsbetween measurements to ensure that sufficient gaswas available for individual analyses. Most dataare thus time-series with unequal spacing. The rapidseries of initial gas desorption measurements withinminutes to hours after coring allows back-extrapo-late of the rate of desorption to the ‘‘time zero’’ ofcoal coring, and thus, to estimate the volume ofgas lost during the time (usually about 30 min)between coring and sealing of the fresh coal indesorption cylinders in the field (Diamond andLevine, 1981).
Desorbed gas volumes from coal sample II-3/5were sampled and vented in only six steps withoutventing in between steps. Five of the six gas samplesrepresented 5–37% of the total gas volume. This
1
4
23
D
F
E
A
C
B
Fig. 1. Apparatus for volumetric measurements and sampling ofdesorbed coal gas. (A) Desorption canister; (B) volume displace-ment apparatus; (C) pressurized N2 container; (D) deionizedwater with benzalkonium chloride; (E) inverted sample bottle; (F)flexible tubing; 1, 2, 3, 4 – valves. Procedure: purging of tubing (2,4 closed; 1, 3 opened; tip of F outside of E; then 4 opened torelease overpressure of N2), volume measurement (1, 3, 4 closed;2 opened), sampling (1 opened), venting (4 opened).
approach permitted a complete isotopic mass-bal-ance calculation for sample II-3/5, thus characteriz-ing the entire gas volume compositionally andisotopically. This sample represents the same coalbed (Seelyville) as most of the samples analyzed inthis paper.
Gas from desorption canisters flowed throughflexible tubing and was bubbled into inverted,water-filled 50 ml glass bottles held under deionizedwater (Fig. 1). Prior to sampling, a microbicide (ben-zalkonium chloride, 2 g/l) had been added to thewater to prevent microbial loss or generation ofgas components during storage, and all dead vol-umes, including the gas sampling tubing, had beenpurged with nitrogen. Each partially gas-filled glasssample bottle was closed with a rubber septum,crimp-sealed, and stored in inverted position withan internal water level �1 cm above the rubber sep-tum, thus limiting the diffusion and loss of hydro-phobic hydrocarbon gases during storage. Thevolume of water in bottles was limited (1–2 ml) tominimize any isotopic fractionation owing to partialdissolution of gases in water. For example, a �3%vol:vol solubility of methane in water at atmosphericpressure and room temperature could fractionate thegaseous methane relative to the dissolved methaneby about �0.3& (Fuex, 1980) to �0.6& (Bacsiket al., 2002) for carbon. At the same time, an isotopefractionation factor a13C(bicarbonate-CO2) of 1.008 inthe CO2–HCO�
3 system (Szaran, 1997) can lead to�1.3& 13C-depletion of gaseous CO2 relative toDIC, assuming a CO2 partial pressure of 2 kPa(0.02 bar) and 16% CO2-solubility in water, basedon Henry�s Law.
For off-line isotopic analyses, methane aliquotswere collected on a vacuum line with a Toeplerpump and sealed in 9 mm o.d. quartz ampoulestogether with copper (II) oxide. Following combus-tion of methane in the sealed quartz ampoules at800 �C, the oxidation products H2O and CO2 werecryogenically separated on a vacuum line and CO2
samples were sealed in 6 mm o.d. Pyrex� tubes. Val-ues of d13CCO2
were determined in manual dual-inletmode using a Finnigan MAT 252 stable isotopemass-spectrometer.
Some coal gases that were analyzed off-line alsowere analyzed on-line for gas composition and com-pound-specific d13C values using a Finnigan 252irm-GC/MS system. A customized GASIS injectionsystem (Henning, 2002) with injection loops of0.06 ll for methane and 0.5 ll for CO2 was usedto inject gas aliquots onto a PoraBOND Q gas chro-

D. Strapoc et al. / Organic Geochemistry 37 (2006) 152–164 155
matographic column for compound separation.Following on-line combustion, integrated CO2 peakareas were used to quantify relative abundances ofgas components. All d13C values presented in thispaper are calibrated against NBS-19 having a d13Cvalue of exactly +1.95& on the VPDB scale. Ana-lytical errors for d13C are: for methane determinedoff-line ± 0.18& (standard deviation for five repli-cate determinations), for methane on-line ± 0.22&(two sets of three replicates), and for CO2 on-line ± 0.89& (two sets of duplicates and one set ofthree replicates).
3. Results
3.1. Methane
The data in d13CCH4time-series show similar pat-
terns for off-line and on-line data reflecting 10desorbing CBM gas samples from coal sample V-3/1 (Fig. 2). The �2& increase in d13CCH4
over 3months of desorption appears to be linearly relatedto the desorbed methane as a fraction of total coalgas desorbed (Fig. 2(a)). A systematic �0.3& offsetbetween on-line and off-line data is likely due to dif-ferent preparations and inlet modes of calibrationgases, but is not relevant for the purpose of thisstudy. A logarithmic relationship between d13CCH4
and the duration of desorption (Fig. 2(b)) is similarto the relationship between cumulative desorbed gasvolume and time (Fig. 3).
Weighted mean values of d13CCH4for cumulative
CBM from each coal sample were calculated viamass balances derived from volumetric measure-
a b
Fig. 2. Carbon isotopic changes of methane during coalbed gas desorpdesorbed; (b) scaled to the duration of desorption.
ments of desorbing gas over time (Table 2, Figs. 3and 4). At a late stage of desorption, when �95%of gas already was desorbed, sampling of gaseswas not possible on a daily basis because incremen-tal daily volumes were insufficient. Fig. 4 plotsDd13CCH4
deviations of individual gas samples fromthe weighted d13CCH4
mean as they relate to thefraction of desorbed CH4 from six canisters (Table1). The Dd13CCH4
pattern over the fraction of des-orbed CBM from five canisters matches the patternobserved for coal sample V-3/1 (Fig. 2(a)). Theoverall weighted mean d13CCH4
�midpoint� value isbest approximated by CBM samples that were takenwhen 33–66% of total CBM had been desorbed(Fig. 4).
CBM desorbing from coal sample II-3/5 wasvented only six times coincident with six samplingsteps that were at least 7 days apart from each other.Interestingly, the six individual d13CCH4
values forsample II-3/5 did not increase over the duration ofdesorption and stayed within the confidence intervalof the weighted mean d13CCH4
(Fig. 5).
3.2. Carbon dioxide
Our limited matrix of four d13C values fordesorbing CO2 from coal core V-3/1 suggests thatthe carbon isotope fractionation is about 5 timeslarger for CO2 (Fig. 6) than for CBM duringdesorption (Fig. 2). There is a 9& differencebetween the first sample of desorbed CO2 (firstday of desorption with 10% of CO2 desorbed) andthe last sample (50 day, 95% of CO2 desorbed). Thisisotopic shift is accompanied by a gradual increase
tion from coal sample V-3/1: (a) scaled to percentage of methane
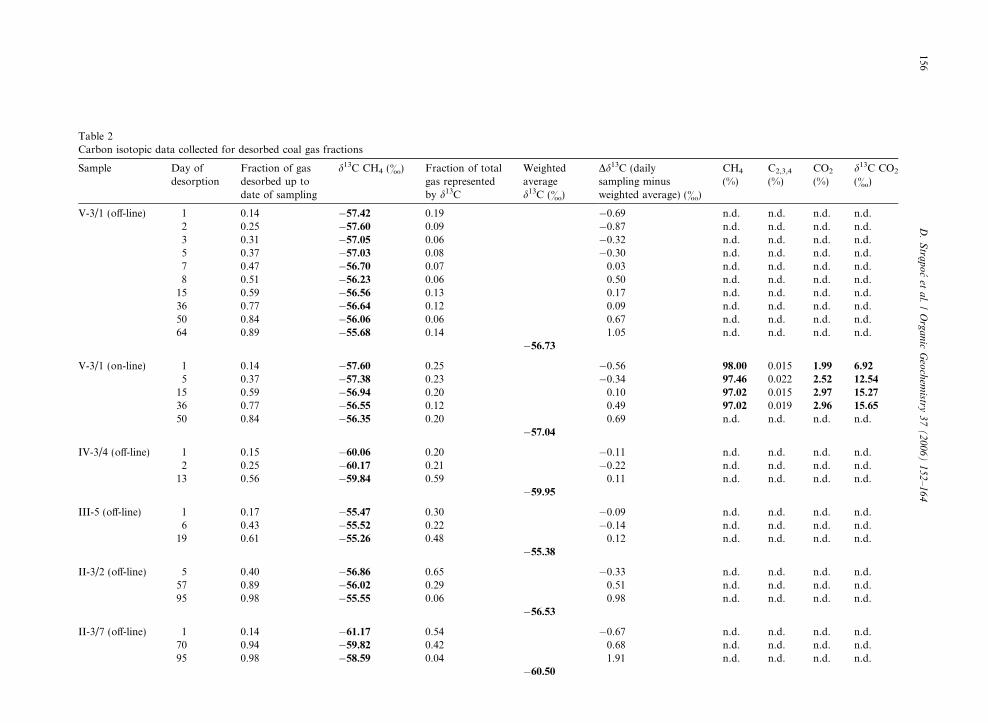
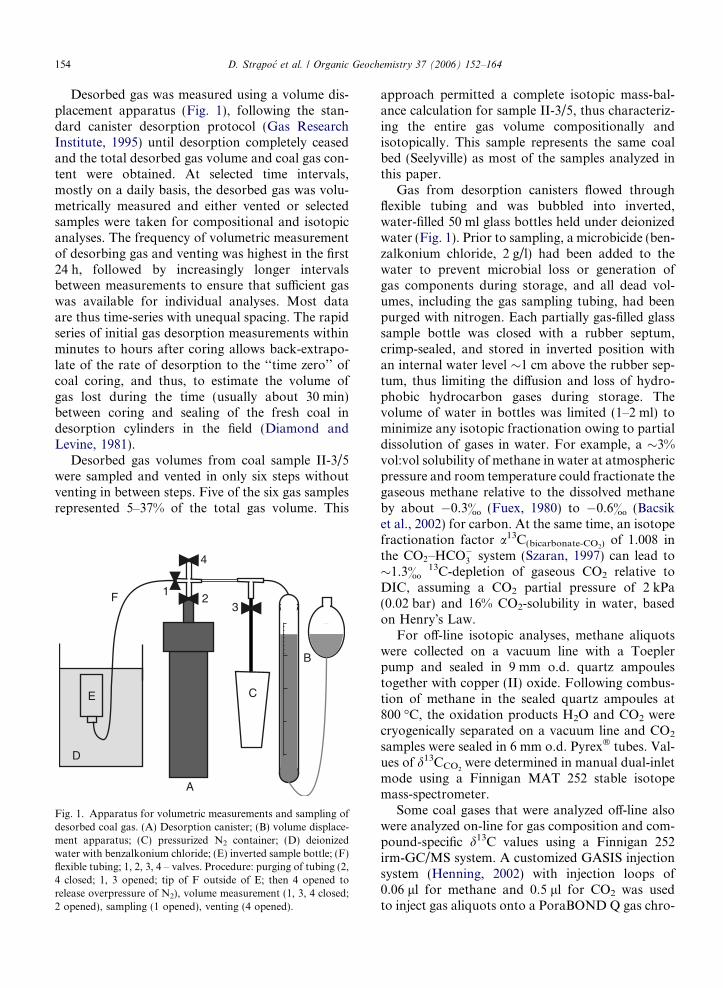
Table 2Carbon isotopic data collected for desorbed coal gas fractions
Sample Day ofdesorption
Fraction of gasdesorbed up todate of sampling
d13C CH4 (&) Fraction of totalgas representedby d13C
Weightedaveraged13C (&)
Dd13C (dailysampling minusweighted average) (&)
CH4
(%)C2,3,4
(%)CO2
(%)d13C CO2
(&)
V-3/1 (off-line) 1 0.14 �57.42 0.19 �0.69 n.d. n.d. n.d. n.d.2 0.25 �57.60 0.09 �0.87 n.d. n.d. n.d. n.d.3 0.31 �57.05 0.06 �0.32 n.d. n.d. n.d. n.d.5 0.37 �57.03 0.08 �0.30 n.d. n.d. n.d. n.d.7 0.47 �56.70 0.07 0.03 n.d. n.d. n.d. n.d.8 0.51 �56.23 0.06 0.50 n.d. n.d. n.d. n.d.15 0.59 �56.56 0.13 0.17 n.d. n.d. n.d. n.d.36 0.77 �56.64 0.12 0.09 n.d. n.d. n.d. n.d.50 0.84 �56.06 0.06 0.67 n.d. n.d. n.d. n.d.64 0.89 �55.68 0.14 1.05 n.d. n.d. n.d. n.d.
�56.73
V-3/1 (on-line) 1 0.14 �57.60 0.25 �0.56 98.00 0.015 1.99 6.92
5 0.37 �57.38 0.23 �0.34 97.46 0.022 2.52 12.54
15 0.59 �56.94 0.20 0.10 97.02 0.015 2.97 15.27
36 0.77 �56.55 0.12 0.49 97.02 0.019 2.96 15.65
50 0.84 �56.35 0.20 0.69 n.d. n.d. n.d. n.d.�57.04
IV-3/4 (off-line) 1 0.15 �60.06 0.20 �0.11 n.d. n.d. n.d. n.d.2 0.25 �60.17 0.21 �0.22 n.d. n.d. n.d. n.d.13 0.56 �59.84 0.59 0.11 n.d. n.d. n.d. n.d.
�59.95
III-5 (off-line) 1 0.17 �55.47 0.30 �0.09 n.d. n.d. n.d. n.d.6 0.43 �55.52 0.22 �0.14 n.d. n.d. n.d. n.d.19 0.61 �55.26 0.48 0.12 n.d. n.d. n.d. n.d.
�55.38
II-3/2 (off-line) 5 0.40 �56.86 0.65 �0.33 n.d. n.d. n.d. n.d.57 0.89 �56.02 0.29 0.51 n.d. n.d. n.d. n.d.95 0.98 �55.55 0.06 0.98 n.d. n.d. n.d. n.d.
�56.53
II-3/7 (off-line) 1 0.14 �61.17 0.54 �0.67 n.d. n.d. n.d. n.d.70 0.94 �59.82 0.42 0.68 n.d. n.d. n.d. n.d.95 0.98 �58.59 0.04 1.91 n.d. n.d. n.d. n.d.
�60.50
Line missing
156D.Stra
pocet
al./Organic
Geochem
istry37(2006)152–164
II-3/5
(off-line)
20.25
�59.60
0.38
0.71
n.d.
n.d.
n.d.
n.d.
100.52
�60.55
0.24
�0.24
n.d.
n.d.
n.d.
n.d.
300.72
�60.97
0.20
�0.66
n.d.
n.d.
n.d.
n.d.
840.92
�60.97
0.13
�0.66
n.d.
n.d.
n.d.
n.d.
950.98
�60.03
0.04
0.28
n.d.
n.d.
n.d.
n.d.
127
0.99
�60.75
0.01
�0.44
n.d.
n.d.
n.d.
n.d.
�60.31
Weigh
tedav
erag
eva
lues
arecalculatedviamassbalan
cesderived
from
volumetricmeasurements
ofga
sdesorbed
overtime.
n.d.–notdetermined.
Fig. 3. Cumulative desorption curve of gas from coal sample V-3/1.
D. Strapoc et al. / Organic Geochemistry 37 (2006) 152–164 157
in the CO2 content of the desorbing gas mixture(Fig. 6(a)). The percentage of desorbed CO2 for aparticular day was calculated by extrapolating gaschromatographic data (peak areas) onto the volu-metric measurements of desorbing total coal gas.
4. Discussion
4.1. Carbon isotopic changes and representative
sampling of coal gas
Canister desorption is primarily used for coal gascontent estimation by volumetric measurements ofdesorbing coal gases on a daily basis. The daily sam-pling of gas for geochemical analyses is typically fol-lowed by venting of excess gas. Alternatively,accumulation of gas can proceed over many dayswithout intermittent measurements and venting(e.g., coal sample II-3/5 in this study). Although thelatter approach seems to offer isotopically representa-tive coal gas samples (see below), it also has disadvan-tages. First, it does not allow back-extrapolation forestimating the gas that is lost between coal core retrie-val and the sealing of coal in desorption canisters.Also, less frequent venting of excess gas causes largerintermittent pressure buildup in the headspace of thecanister and distorts the pattern of desorption thatwould otherwise be observed at consistently lowambient pressures.Given the fact that dynamic canis-ter desorption with daily volume measurement andsubsequent venting of gas is the generally preferredtechnique, a feasible method for collecting isotopi-cally representative gas samples is needed.
Representative and reproducible sampling ofdesorbing coal gas mandates that the sampling

Fig. 4. Carbon isotopic differences between individual methane measurements and the weighted mean value for each canister (based onoff-line data from six desorption canisters from which gas was vented on a daily basis). The weighted mean is represented by the horizontalzero line. Thick horizontal lines represent average values for three desorption intervals. The average d13C value for the 33–66% desorptioninterval (grey rectangle) most closely approximates the overall weighted mean value (zero line).
Fig. 5. d13CCH4values for coal sample II-3/5. Desorbed gas
volumes were measured, sampled, and vented only six times,allowing at least seven days of equilibration between consecutivemeasurements. Dotted line represents weighted mean d13C valueof the entire methane volume.
158 D. Strapoc et al. / Organic Geochemistry 37 (2006) 152–164
strategy accounts or compensates for carbon isoto-pic changes of methane and CO2 during desorption.The timing of sampling is especially important whena gas sample needs to be representative of the theo-retical entire gas volume. In Fig. 4, the horizontal
‘‘zero-line’’ (representing the mass balance-basedaverage d13CCH4
value for each of the canisters) isclose to the average d13CCH4
value for CBM samplestaken when 33–66% of the entire gas volumes hadbeen already desorbed. For coal sample V-3/1,mass-balance calculations based on daily desorptionmeasurements indicate that isotopically representa-tive ‘‘average gas’’ desorbs when 48% (accordingto off-line data) or 52% (on-line data) of the totalgas has been already desorbed and removed. Thus,a � 50% desorption midpoint is suggested for tak-ing representative gas samples for carbon isotopicCBM analysis. This opportune time window forgas sampling occurred in our coals between the5th and the 12th day of desorption (Fig. 7(a)).
The absence of a large isotopic variance overtime in coal gas desorbed from coal sample II-3/5(Fig. 5) may be due to the considerable length oftime (>7 days) allowed between each of the six sam-pling events. Longer re-equilibration between des-orbed and sorbed gas may have reduced anykinetic isotope fractionation associated with initialrapid desorption following the venting of earlierdesorbed CBM. A slightly lower vapor pressure(or slightly higher boiling point) of isotopically hea-

a b
Fig. 6. Changes of d13CCO2versus changes in CO2 content (a) and versus d13CCH4
(b) during coal gas desorption from coal sample V-3/1.Numbers in brackets indicate the percent of total CO2 desorbed at the time of sampling. Dashed lines guide the eye along paths ofdesorption.
a b
Fig. 7. (a) Histogram depicting the timing of midpoint gas desorption from 31 canisters using Illinois Basin Pennsylvanian coals.(b) Dependence of timing of desorption mid-point on the total desorbed gas (final volume, obtained when desorption ceases, usually afterthree months) for 19 canisters using Seelyville coal. The solid line is a 2nd order polynomial regression.
D. Strapoc et al. / Organic Geochemistry 37 (2006) 152–164 159
vier molecules can probably influence the isotopicseparation between sorbed and desorbed phases ifequilibrium was reached after >7 days, but our datasuggest this fractionation effect to be minor. In con-trast, the dynamically desorbing samples with dailyvolumetric measurement and venting of freshly des-orbed CBM from other coal samples (i.e., non-equi-librium conditions) fostered the expression of akinetic isotope effect (Figs. 2, 4, 6), whereby 13CH4
and 13CO2 molecules diffused slower out of coalthan 12CH4 (Gould et al., 1987; Faiz et al., 2002;Hu et al., personal communication) and 12CO2
(Gould et al., 1987) (Fig. 6(b)).The timing of the �50% desorption midpoint can
be predicted from closely spaced early desorptionmeasurements. We compared the timing of mid-points with the total desorbed gas volumes in order
to better constrain the midpoints within their esti-mated 5- to 12-day window of occurrence. Theoret-ical total gas volumes could be predicted byextrapolating volumetric data from the first fivedays of desorption (Fig. 8). An example of the cor-respondence between total desorbed gas and thetiming of midpoint desorption is shown inFig. 7(b) for Seelyville coals. The scatter of datamay result from the coals� variability in maceralcomposition, moisture and ash content, and pore-size distribution influencing gas desorption.
4.2. Diffusion-controlled carbon isotopic variability of
desorbing coal gases
The initial release of molecules from an adsorp-tion site could fractionate gas isotopically according

Fig. 8. Relationships between measured cumulative gas volumesafter 5 or 10 days of desorption and total desorbed gas. Theserelationships can be used to predict total gas volume viaextrapolation of shorter-term initial desorption measurements.The data are based on over 30 canister samples from IllinoisBasin Pennsylvanian coals.
Fig. 9. Changes in d13C of CH4 over the first two weeks of coalgas desorption from coals of various maturities. Rectangularfields represent ranges of data (Ro and Dd13C) provided in theliterature.
160 D. Strapoc et al. / Organic Geochemistry 37 (2006) 152–164
to Langmuir desorption, but the small differencesbetween physical properties (i.e., boiling point) ofisotopically lighter and heavier molecular speciessuggest limited associated fractionation. This is cor-roborated by our observation that 13CO2/
12CO2 isabout four times more fractionated than13CH4/
12CH4, although the relative molecular massdifference for 13CH4 and 12CH4 (1/16) is much lar-ger than for 13CO2 and
12CO2 (1/44). Furthermore,no isotopic fractionation of CH4 was observed insample II-3/5, where a longer time was allowed forequilibration between adsorbed and free gas.
Although negligible fractionation seems to occurduring the initial release of gas molecules fromadsorption sites, much stronger isotopic fraction-ation results from the subsequent diffusion trans-port of gas through microporous coal. Isotopicfractionation via diffusion through microporesintensifies with increasing coal maturity (Fig. 9),because the relative abundance of microporesincreases (Clarkson et al., 1993). We hypothesizethat under non-equilibrium conditions of frequentventing of gas and dynamic desorption of new gasthe differences in diffusivity between 13C- and 12C-containing CH4 and CO2 molecules are likely con-trolling kinetic isotope effects during coal gasdesorption. Kinetic isotope effects imply that 12C-containing molecules diffuse faster in microporouscoal than 13C-containing molecules of the samechemical species (Fig. 6(b)). Similar diffusion-related carbon isotopic fractionation of methane
migrating through shale cores was observed in lab-oratory experiments by Zhang and Krooss (2001).Fractionation of gaseous hydrocarbons via diffusivetransport into gas reservoirs was proposed by Prinz-hofer and Pernaton (1997) for some natural gasaccumulations.
Gas transport in coal occurs in different modesdepending on pore size. In micropores (B < 2 nm;according to Harpalani and Chen, 1997), desorptionand diffusion of gases are strongly affected by: (i)gas adsorption affinities in slit-shaped pores typicalfor coals, (ii) by diffusion via molecule–pore wallcollisions (Knudsen diffusion), and (iii) by surfacediffusion (hopping of adsorbed gas molecules fromone adsorption site to another) (Gudmundsson,2003; Cui et al., 2004). Transport of gases in mac-ropores (B > 50 nm) is dominated by viscous flowor continuum diffusion (molecule–molecule colli-sions) (Cui et al., 2004; Faiz, 2004). In the lattermode of transport, the flow of gas is only slightlyrestricted and the isotopic effect during diffusionout of macropores and cleats may be limited. Incontrast, isotopic fractionation can be expectedfrom the more restricted flow of gas out of athree-dimensional network of micropores (Radovicet al., 1997) when gas molecules are strongly inter-acting with micropore walls.
Gas flow constriction is enhanced in more maturecoals with Ro > 1.5% because: (i) micropores consti-tute a larger portion of the overall porosity (Clark-son et al., 1993; Bustin, 2000) and (ii) additionalmicropore-dominated secondary porosity is gener-ated via cracking of higher hydrocarbons and the

D. Strapoc et al. / Organic Geochemistry 37 (2006) 152–164 161
loss of volatiles (Rodrigues and Lemos de Sousa,2002). Limited data (Fig. 9) support the hypothesisthat more mature coal with increasingly importantmicroporosity leads to more efficient ‘‘molecularsieving’’ and larger isotope effects during coal gasdesorption. Late desorbed methane can differ isoto-pically from early desorbed methane by 2–16&.
Additional factors influencing the isotopic frac-tionation of desorbing coal gases may include mac-eral composition, the presence of competing fluidssuch as moisture and higher molecular-weighthydrocarbons, in situ stress, overpressure, and coalshrinkage or swelling. All these factors affect the dif-fusion coefficient. Large isotopic fractionation dur-ing diffusion suggests a small diffusion coefficient,which implies possible high coal gas content (e.g.,in the greater Green River Basin; Scott andAmbrose, 1992).
4.3. Gas compositional variability
Coal gases are mainly adsorbed on the micropo-rous structure of the organic coal matrix (Bustinand Clarkson, 1996; Faiz et al., 2002) due to physi-cal (not chemical) attraction including van derWaals and electrostatic forces (Yee et al., 1993).Spontaneous desorption of adsorbed gases is initi-ated by changes in pressure and temperature fromreservoir to canister conditions (canister tempera-tures approximated reservoir temperatures in ourexperiments). Some gas species are more stronglyadsorbed on coal than other gases (i.e., CH4 willdesorb preferentially and faster than CO2), depend-ing on adsorption affinities and geometries of gasmolecules and pores in coal. The linear structure,small molecular size, and electric properties of theCO2 molecule (O@C@O) translate into a highadsorption affinity for most pore sizes in coal (Cuiet al., 2004), whereas the tetrahedral and more volu-minous molecular structure of CH4 limits itsadsorption affinity.
Sorption capacity increases with increasingmolecular weight of a sorbed gas species followingLangmuir�s theory. The theory compares adsorp-tion/desorption to evaporation/condensation pro-cesses, in which heavier gas tends to have a higherboiling point and therefore is more strongly sorbedto a solid phase. The ratio of sorption capacities ofCO2 and methane in coal is typically 2:1 or higher.Their sorption ratio in Indiana coals averages�4:1 (Mastalerz et al., 2004), including coals usedin this study. As a consequence, we observe a rela-
tively small CO2 concentration in bulk gas at thebeginning of desorption, followed by increasingCO2 concentrations with ongoing depletion ofadsorbed gases in coal.
This compositional fractionation of desorbingcoal gas could be alternatively explained by decreas-ing pressure (e.g., during prolonged gas production)causing an increase in relative sorption capacitiesfor CO2 over CH4 on coal (Arri et al., 1992). How-ever, all our desorption experiments, except one,took place at ambient pressure with daily ventingof desorbed gas. Therefore, we can exclude pressuredecrease as a major factor controlling gas composi-tional variability during our canister desorptionexperiments.
4.4. Implications
4.4.1. Coal gas origins
The observed �2& isotopic fractionation ind13CCH4
during desorption of CBM from high-vola-tile bituminous coal far exceeds the experimentaluncertainty of d13C determination. If improper par-tial sampling of coal gas fails to account for frac-tionation, an error in d13CCH4
of up to �2& (ormore in higher rank coals), together with a respec-tive error in d13CCO2
of up to �9&, can lead toimproper classification of coal gases, or at least toambiguity much larger than typical analytical error.For example, the distinction between thermogenic,mixed and microbial gas origins can be blurred(Fig. 10), especially for detailed studies where bio-genic and thermogenic end-members can be moreprecisely constrained than the general fields suggestin Fig. 10. End-member gases can be obtained bypyrolysis and culturing experiments for a particularcoal.
Imprecise d13CCH4results also may lead to
improper estimation of biogenic gas participationin bulk coal gas (Chung et al., 1988) where ±2&error can lead to about ±10% difference. This isimportant for basins with mixed origin of gaseswhere admixing of secondary biogenic gases mightbe significant. For example, in regions with lowmaturity coals (i.e., basin margins), the biogeniccontribution can be the deciding factor for theCBM potential, for example in the eastern IllinoisBasin, where low maturity coals with low thermo-genic gas potential feature 50% or more secondarybiogenic methane contribution (Strapoc et al.,2005). Some basins with high coal rank may beexpected to contain purely thermogenic gases, but

Fig. 10. Genetic classification of coalbed gases with threedistinguishable fields, according to Smith and Pallasser (1996).The filled diamond (�) indicates the average for Seelyville coalgas. Symbol size relates to the typical analytical error. Therectangle around the symbol relates to the expected desorption-related isotopic variance in d13C of CH4 and CO2.
162 D. Strapoc et al. / Organic Geochemistry 37 (2006) 152–164
post-coalification microbial gas may have beenadded following uplift and introduction of meteoricwater and bacteria into permeable coal (e.g., Zong-dulak Basin; Hos�gormez et al., 2002).
4.5. CBM production
In addition to an isotopic bias caused by inap-propriate gas sampling from canisters affecting theassessment of coal gas origin, any bias in the molec-ular composition (e.g., the CH4/CO2 ratio, impor-tant when CO2 content >5%) of desorbing coalgases will propagate an error in the evaluation ofthe methane abundance in a coal sample, a field,or on a basin scale. The overall trend of increasingCO2 concentrations in bulk desorbing gas over timefrom canisters may be mirrored on a reservoir scaleby the observation of increasing CO2 concentrationsfrom older CBM production wells as coal gasesbecome depleted (Arri et al., 1992).
On the other hand, decreasing reservoir gas pres-sure and increasing relative CO2 content during gasproduction may cause shrinkage of the coal matrix(Mavor and Vaughn, 1998). If shrinkage modifiespore-size distribution (e.g., increasing relativemicropore volume), it might as well modify the iso-topic fractionation of diffusion. Nevertheless, if iso-topic fractionation patterns of methane produced inthe field and from desorption canisters (Fig. 2(b))
are similar, then d13C values could be used to mon-itor production of CBM and depletion of a reser-voir. Our ongoing research comparing laboratoryand production trends will test this hypothesis.
5. Conclusions
1. Kinetic isotope effects cause 13C-depletion of freemethane and CO2 relative to adsorbed gas speciesduring desorption of coal gases in canisters.Observed fractionations are likely caused by fas-ter diffusion of 12C-containing gas species relativeto 13CH4 and 13CO2. Amplitudes of d13C shiftsover the duration of desorption are probablylinked to the pore structure of coal, which is con-trolled by maceral composition, maturity, in situstress, etc.
2. A linear relationship exists between d13CCH4and
the volume of desorbed CH4 as a fraction of totalCBM. Thus, isotopically representative samplingof desorbed CBM for carbon-isotopic analysisshould be performed for a gas sample that is col-lected after about half of all gas has been des-orbed and vented/removed (i.e., gas from the�50 vol% midpoint of gas desorption). Ourcoals� desorption midpoints occurred betweenthe 5th and 12th days of desorption. The timingof a midpoint can be predicted by extrapolatingnarrowly spaced measurements from the firstfew days of desorption.
3. The chemical composition of desorbing coal gaschanges over the duration of desorption becausedifferent coal gas species express different adsorp-tion affinities in microporous coal. CO2 has ahigher adsorption affinity than methane, causingearly desorbed gas to be relatively enriched inmethane, whereas late desorbed gas is relativelyenriched in CO2.
4. Awareness and avoidance of pitfalls of composi-tional and isotopic analyses of coal gases fromcanister desorption can minimize the analyticalbias of geochemical assessment, for example inthe evaluation of gas origins.
Acknowledgements
This work was supported by US Department ofEnergy Basic Energy Research Grant No.DEFG02-00ER15032 to Drs. Schimmelmann andMastalerz. We gratefully acknowledge the assis-tance of Grzegorz Lis, Wilfrido Solano, and Dr. Ag-

D. Strapoc et al. / Organic Geochemistry 37 (2006) 152–164 163
nieszka Drobniak, and also the generosity of theBlack Beauty Coal Company (BBCC) for allowingus to sample freshly drilled coal cores. The authorsgratefully acknowledge thoughtful reviews by Drs.Andrew R. Scott and Tongwei Zhang and editorialcomments by Dr. Clifford C. Walters.
Associate Editor—Cliff Walters
References
Arri, L.E., Yee, D., Morgan, W.D., Jeansonne, M.W., 1992.Modeling coalbed methane production with binary gassorption. In: SPE Rocky Mountain Regional Meeting,Casper, Wyoming, May 18–21, 1992, SPE 24363.
Bacsik, Z., Canongia Lopes, J.N., Costa Gomes, M.F., Jancso,G., Mink, J., Padua, A.A.H., 2002. Solubility isotope effectsin aqueous solutions of methane. Journal of Chemical Physics116, 10816–10824.
Bustin, R.M., 2000. Variation in pore size distribution with coalrank and composition; potential for substantial resources offree gas in matrix porosity in low rank. American Associationof Petroleum Geologists Bulletin 84, 1409.
Bustin, R.M., Clarkson, C., 1996. Importance of fabric andcomposition on permeability, gas capacity and gas desorptionof coals from the Sydney Basin, Australia. In: GSA, 28thAnnual Meeting. Abstracts 28(7), 41.
Chung, H.M., Gormly, J.R., Squires, R.M., 1988. Origin ofgaseous hydrocarbons in subsurface environments: theoreticalconsiderations of carbon isotope distribution. ChemicalGeology 71, 97–103.
Clarkson, C., Lamberson, M., Bustin, R.M., 1993. Variation insurface area and micropore size distribution with compositionof medium volatile bituminous coal of the Gates Formation,northeastern British Columbia; implications for coalbedmethane potential. In: Current Research; Part E. GeologicalSurvey of Canada, pp. 97–104.
Cui, X., Bustin, R.M., Dipple, G., 2004. Selective transport ofCO2, CH4, and N2 in coals: insights from modeling ofexperimental gas adsorption data. Fuel 83, 293–303.
Diamond, W.P., Levine, J.R., 1981. Direct method determinationof the gas content of coal: procedures and results. US Bureauof Mines R.I. 8515, 36p.
Drobniak, A., Mastalerz, M., Rupp, J., 2004. Evaluation ofcoalbed gas potential of the Seelyville Coal Member, Indiana,USA. International Journal of Coal Geology 57, 265–282.
Faiz, M.M., Barclay, S., Saghafi, A., Stalker, L., Wold, M.,Esterle, J., Sherwood, N., 2002. Coal bed methane reservoircharacterization – KP-1 and WG-1, PEL-2, Southern SydneyBasin. Report Prepared for Sydney Gas Company, CSIROPetroleum Confidential Report No. 02-055, July 2002, 220p.unpublished.
Faiz, M., 2004. Microbial influences on coal seam gas reservoirs –a review. In: Bac-Min Conference, Bendigo, Victoria, Aus-tralia, 8–10 November, Program and Abstracts, pp. 133–142(Abstract).
Fuex, A.N., 1980. Experimental evidence against an appreciableisotopic fractionation of methane during migration. In:Douglas, A.G., Maxwell, J.R. (Eds.), Advances in OrganicGeochemistry, 1979, pp. 725–732.
Gas Research Institute, 1995. A Guide to Determining CoalbedGas Content. Gas Research Institute, GRI-94/0396.
Gould, K.W., Hargraves, A.J., Smith, W.J., 1987. Variation inthe composition of seam gases issuing from the coal.Australasian Institute of Mining and Metallurgy Bulletin292, 69–73.
Gudmundsson, K., 2003. An approach to determining the watertransport properties of building materials. Nordic Journal ofBuilding Physics 3, 1–10.
Harpalani, S., Chen, G., 1997. Influence of gas productioninduced volumetric strain on permiability of coal. Geotech-nology of Geological Engineering 15, 303–325.
Henning, M.J., 2002. Development and assessment of inletsystem for stable carbon isotopic analysis of individualcompounds in gas mixtures. M.Sc. thesis, Department ofGeological Sciences, Indiana University, Bloomington,December 2002, 40p.
Hos�gormez, H., Yalcin, M.N., Cramer, B., Gerling, P., Faber, E.,Schaefer, R.G., Mann, U., 2002. Isotopic and molecularcomposition of coal-bed gas in the Amasra region (Zonguldakbasin—Western Black Sea). Organic Geochemistry 33, 1429–1439.
Jedrysek, M.O., 1995. Carbon isotope evidence for diurnalvariations in methanogenesis in freshwater lake sediments.Geochimica et Cosmochimica Acta 59, 557–561.
Katz, B.J., Narimanov, A., Huseinzadeh, R., 2002. Significanceof microbial processes in gases of the South Caspian basin.Marine and Petroleum Geology 19, 783–796.
Martini, A.M., Walter, L.M., Ku, T.C.W., Budai, J.M., McIn-tosh, J.C., Schoell, M., 2003. Microbial production andmodification of gases in sedimentary basins: a geochemicalcase study from a Devonian shale gas play, Michigan basin.American Association of Petroleum Geologists Bulletin 87,1355–1375.
Mastalerz, M., Gluskoter, H., Rupp, J., 2004. Carbon dioxideand methane adsorption in high volatile bituminous coalsfrom Indiana. International Journal of Coal Geology 60, 43–55.
Mavor, M.J., Vaughn, J.E., 1998. Increasing coal natural fracturepermeability in the San Juan Basin Fruitland Formation. In:AAPG Annual Convention Abstracts, Salt Lake City, Utah,May 17–28, 1998 (Abstract).
Niemann, M., Whiticar, M.J., Ryan, B.D., 2005. Stable isotopesystematics of coalbed methane. In: Goldschmidt Conference,Moscow, Idaho, USA, 20–25 May, 2005; section 52, A502(Abstract).
Prinzhofer, A., Pernaton, E., 1997. Isotopically light methane innatural gas: bacterial imprint or diffusive fractionation?Chemical Geology 142, 193–200.
Radovic, L.R., Menon, V.C., Leon, C.A., Kyotani, T., Danner,R.P., Anderson, S., Hatcher, P.G., 1997. On the porousstructure of coals: evidence for an interconnected butconstricted micropore system and implications for coalbedmethane recovery. Adsorption 3, 221–232.
Rodrigues, C.F., Lemos de Sousa, M.J., 2002. The measurementof coal porosity with different gases. International Journal ofCoal Geology 48, 245–251.
Schoell, M., 1983. Genetic characterization of natural gases.American Association of Petroleum Geologists Bulletin 67,2225–2238.
Scott, A.R., Ambrose, W.A., 1992. Thermal maturity andcoalbed methane potential of the Greater Green River,

164 D. Strapoc et al. / Organic Geochemistry 37 (2006) 152–164
Piceance, Powder River and Raton basins. AAPG, 1992Annual Convention Official Program, p. 116.
Scott, A.R., Kaiser, W.R., Ayers Jr., W.D., 1994. Thermogenicand secondary biogenic gases, San Juan Basin, Colorado andNew Mexico – implications for coalbed gas production.American Association of Petroleum Geologists Bulletin 78,1186–1209.
Smith, J.W., Pallasser, R.J., 1996. Microbial origin of Australiancoalbed methane. American Association of Petroleum Geol-ogists Bulletin 80, 891–897.
Smith, J.W., Pallasser, R., Rigby, D., 1992. Mechanisms forcoalbed methane formation. In: Coalbed Methane Sympo-sium, Townsville, November 1992, pp. 63–73.
Strapoc, D., Mastalerz, M., Schimmelmann, A., Eble, C., 2005.Biogenic and thermogenic coalbed gas in the Illinois Basin:insight from compound-specific carbon isotopic ratios. In:Proceedings of the 22nd International Meeting on Organic
Geochemistry, Seville, Spain, September 12–16, 2005, vol. 1,pp. 113–114 (Abstract).
Szaran, J., 1997. Achievement of carbon isotope equilibriumHCO3
� (solution)–CO2 (gas). Chemical Geology 142, 79–86.
Whiticar, M.J., 1996. Stable isotope geochemistry of coals, humickerogens and related natural gases. International Journal ofCoal Geology 32, 191–215.
Yee, D., Seidle, J.P., Hanson, W.B., 1993. Gas sorption on coaland measurement of gas content. In: Law, B.E., Rice, D.D.(Eds.), Hydrocarbons from Coal. AAPG Studies in Geology,vol. 38, pp. 203–218.
Zhang, T., Krooss, B.M., 2001. Experimental investigation of thecarbon isotope fractionation of methane during gas migrationby diffusion through sedimentary rocks at elevated tempera-ture and pressure. Geochimica et Cosmochimica Acta 65 (16),2723–2742.