Carbon Intensity and its Determinants in Japanese Steel ... · PDF fileCarbon Intensity and...
20
Carbon Intensity and its Determinants in Japanese Steel Industry The 5th IAEE Asian Conference, Perth, Australia Feb 14-17, 2016 Junichiro Oda*, Keigo Akimoto, Takashi Homma *Contact us: [email protected] Systems analysis group Research Institute of Innovative Technology for the Earth (RITE) Kyoto, Japan - Engineering approach, rather than economic approach -
Transcript of Carbon Intensity and its Determinants in Japanese Steel ... · PDF fileCarbon Intensity and...

Carbon Intensity and its Determinants in
Japanese Steel Industry
The 5th IAEE Asian Conference, Perth, Australia
Feb 14-17, 2016
Junichiro Oda*, Keigo Akimoto, Takashi Homma
*Contact us: [email protected]
Systems analysis group
Research Institute of Innovative Technology for the Earth (RITE) Kyoto, Japan
- Engineering approach, rather than economic approach -

Contents 2
1. Introduction
2. Analysis results: quick view
3. Methodology, and results
4. Summary

1.1 Overview of steelmaking process in Japan 3
Iron ore, etc
Coal Coke oven
Blast furnace
(BF)
Sintering
furnace
Hot meal
(Pig iron)
Steel scrap
Oxygen
Basic oxygen furnace (BOF)
Electric arc
furnace (EAF)
Continuous casting Crude steel Heating furnace Rolling mill Steel products
Liquid steel
Ref) RITE
Carbon intensity, e.g., 196 MtCO2 / 113 Mt crude steel = 1.743 (tCO2/t crude steel)
Hot metal ratio, e.g., 83 Mt pig iron / 113 Mt crude steel = 0.74
Upstream Downstream

Appendix: Energy and climate policies of Japanese industry 4
Regulations
The Energy conservation Act
Voluntary Actions (VAs)
[From 1997 to 2012 ]
Voluntary Action Plan on the
Environment
[From 2012]
Commitment to a Low Carbon
Society
RD&D financial and technical supports
Taxes
Energy taxes
Duties on imported energy
Carbon taxes
Tax credits
Investment in RD&D
Investment in energy saving
facilities
Green energy, e.g., PV, wind
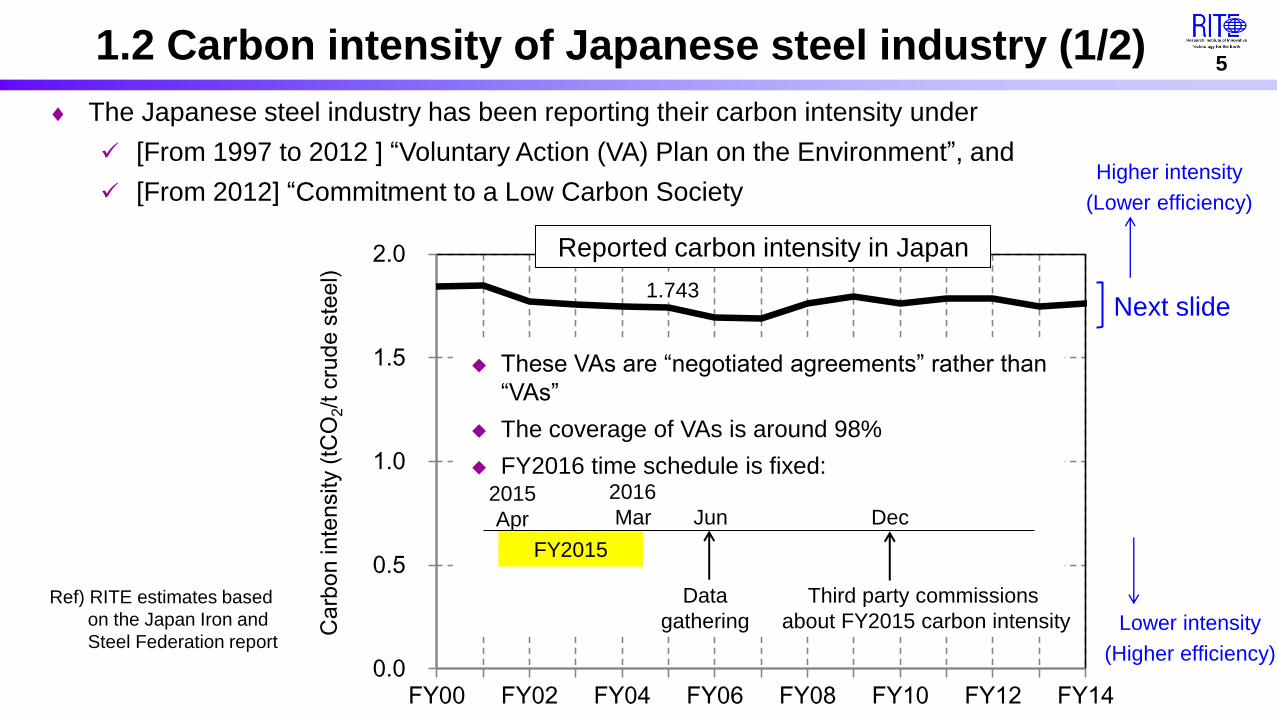
1.2 Carbon intensity of Japanese steel industry (1/2) 5
The Japanese steel industry has been reporting their carbon intensity under
[From 1997 to 2012 ] “Voluntary Action (VA) Plan on the Environment”, and
[From 2012] “Commitment to a Low Carbon Society
0.0
0.5
1.0
1.5
2.0
FY00 FY02 FY04 FY06 FY08 FY10 FY12 FY14
Ca
rbo
n in
ten
sity (
tCO
2/t c
rud
e s
tee
l)
Ref) RITE estimates based
on the Japan Iron and
Steel Federation report
1.743
Reported carbon intensity in Japan
These VAs are “negotiated agreements” rather than
“VAs”
The coverage of VAs is around 98%
FY2016 time schedule is fixed:
Next slide
Higher intensity
(Lower efficiency)
Lower intensity
(Higher efficiency)
FY2015
2015
Apr
2016
Mar Jun Dec
Data
gathering
Third party commissions
about FY2015 carbon intensity

1.2 Carbon intensity of Japanese steel industry (2/2) 6
1.65
1.70
1.75
1.80
1.85
FY00 FY02 FY04 FY06 FY08 FY10 FY12 FY14
Ca
rbo
n in
ten
sity (
tCO
2/t c
rud
e s
tee
l)
Including EAFs
Fixed emission
factor for grid
electricity, i.e.,
0.42 kgCO2/kWh
1.743
The 2008
financial crisis
The 2011 East
Japan Earthquake
Carbon intensity (tCO2/t crude steel) was improving until the 2008 financial crisis
After that, apparently, there was no clear time trend of carbon intensity
Ref) RITE estimates based
on the Japan Iron and
Steel Federation report
Higher intensity
(Lower efficiency)
Lower intensity
(Higher efficiency)
Reported carbon intensity in Japan

1.3 Objectives 7
Question 1
What is the determinant of carbon intensity (tCO2/t crude steel)?
Short-term (yearly) fluctuation of carbon intensity
Long-term (FY2000-FY2014) trend of carbon intensity
Question 2
Can we observe a long-term trend of carbon intensity improvement?
Did VAs (negotiated agreements) have an effect on carbon intensity improvement?
To answer these two questions:

2.1 Analysis results: FY2007 vs FY2008 8
FY2007 FY2008
1.691
1.763
+0.072
+4.3% point
Reported carbon
intensity
The effect of the 2008 financial crisis (effect of CF decrease) was significant
⊿x2 (downstream): -0.004
⊿x2 (upstream): +0.030
[Hot metal ratio 0.723 0.744]
⊿x1 (capacity factor): +0.063
[CF 104.8 91.2 (FY2005=100)]
⊿x3 (time trend variable): -0.005
⊿Residual error: -0.012

2.2 Analysis results: FY2000 vs FY2014 9
FY2000
1.761
1.846
-0.085
-4.6% point
Reported carbon
intensity
The time trend variable implies diffusion of
energy saving from FY2000 to FY2014
⊿x2 (downstream): -0.019,
⊿x2 (upstream): +0.013
[Hot metal ratio 0.755 0.764]
⊿x1 (capacity factor): +0.010
[CF 93.9 91.7 (FY2005=100)]
[Effect of steel product mix]
⊿x3 (time trend variable): -0.071
⊿Residual error: -0.018
FY2014

3.1 Methodology 10
x1. Capacity factor index
x2. Production process index
Upstream: Hot metal ratio
Downstream: Steel product mix
x3. Time trend variable
Improvement factor: Diffusion of energy saving tech. (?)
Worsening factor: Aging facilities (?)
Parametric regression
Effects on carbon intensity = β1×(x1,t – x1,2005)
Unknown parameters
solved by ordinary least
squares (OLS) regression Effects on carbon
intensity are
exogenously given
Effects on carbon intensity = β2×(t –2005)

3.2 Capacity factor 11
94
91
96
99 101 100
103
105
91
82
93
89 89
91 92
70
80
90
100
110
00 02 04 06 08 10 12 14
Cap
acit
y fa
cto
r in
dex
(FY
20
05
= 1
00
)
FY
Blast furnaces (BFs)
Electric arc furnaces (EAFs)
Industrial Production Index
Weighted average
Capacity factor index (x1) Production process index (x2): Upstream, Downstream
Note) We referred to monthly
capacity factors (reported
by METI) and convert
them into annual data
Capacity factor index
Weight
3%-5%
62%-65%
32%-33%

3.3 Upstream production process 12
y = 1.42x + 0.70
1.72
1.74
1.76
1.78
1.80
0.72 0.74 0.76 0.78U
pstr
eam
index (
FY
2005
=1.7
43)
Hot metal ratio (t pig iron/t crude steel)
FY05
FY01
FY12 FY14
FY06
FY07
FY02
FY08
FY00 FY11
FY09 FY13
FY10FY08 FY03
FY05
Relationship between hot metal ratio
and upstream index
0.755
0.774
0.743
0.746
0.734
0.736
0.721
0.723
0.744
0.752
0.748
0.754
0.764
0.751
0.764
0.72
0.74
0.76
0.78
2000 02 04 06 08 10 12 14
Ho
t m
etal
rat
io (
t p
ig ir
on
/t c
rud
e st
eel)
FY
Iron ore dominant
Scrap dominant Note) We referred to METI statistics Iron ore dominant
0.70
2.12
0.0
2.5
0 1
Up
str
ea
m in
de
x
Hot metal ratio
Capacity factor index (x1) Production process index (x2): Upstream, Downstream
Hot metal ratio

177
237
367
323
273
2644
82 69 59
0
100
200
300
400
00 02 04 06 08 10 12 14
Exp
ort
pri
ce (
no
min
al U
S$/t
ste
el)
FY
Steel bar
Stainless steelexcept seamless pipe
3.4 Downstream production process (1/2) 13
Examples of steel products
Steel bar Wide flange & H beams
Ref) http://sumitomothailand.co.th/
Seamless pipe Stainless steel sheet
Export price from Japan
Note) RITE estimates based on Trade Statistics of Japan
“Steel product share” דintensity”
Capacity factor index (x1) Production process index (x2): Upstream, Downstream
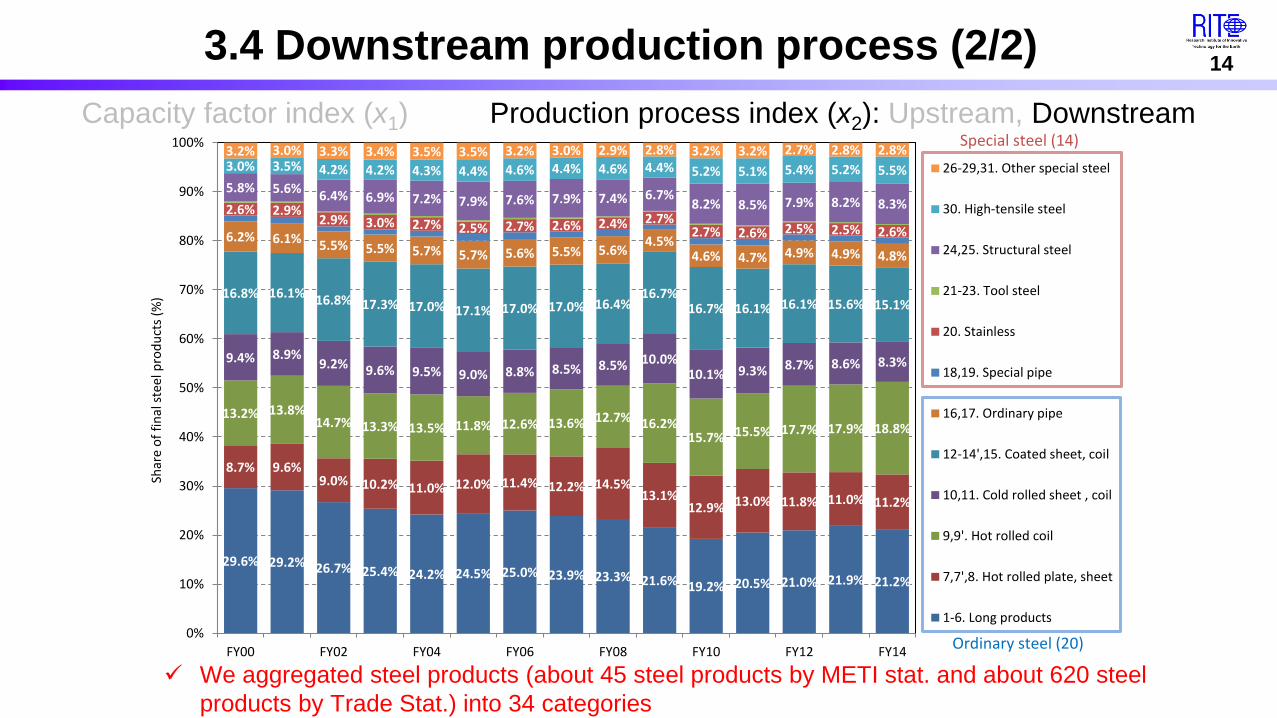
29.6% 29.2% 26.7% 25.4% 24.2% 24.5% 25.0% 23.9% 23.3% 21.6% 19.2% 20.5% 21.0% 21.9% 21.2%
8.7% 9.6%9.0% 10.2% 11.0% 12.0% 11.4% 12.2% 14.5%
13.1%12.9% 13.0% 11.8% 11.0% 11.2%
13.2% 13.8%14.7% 13.3% 13.5% 11.8% 12.6% 13.6% 12.7% 16.2%
15.7% 15.5% 17.7% 17.9% 18.8%
9.4% 8.9%9.2% 9.6% 9.5% 9.0% 8.8% 8.5% 8.5% 10.0%
10.1% 9.3% 8.7% 8.6% 8.3%
16.8% 16.1% 16.8% 17.3% 17.0% 17.1% 17.0% 17.0% 16.4%16.7%
16.7% 16.1% 16.1% 15.6% 15.1%
6.2% 6.1% 5.5% 5.5% 5.7% 5.7% 5.6% 5.5% 5.6%4.5%
4.6% 4.7% 4.9% 4.9% 4.8%
2.6% 2.9%2.9% 3.0% 2.7% 2.5% 2.7% 2.6% 2.4% 2.7%
2.7% 2.6% 2.5% 2.5% 2.6%
5.8% 5.6%6.4% 6.9% 7.2% 7.9% 7.6% 7.9% 7.4% 6.7%
8.2% 8.5% 7.9% 8.2% 8.3%
3.0% 3.5% 4.2% 4.2% 4.3% 4.4% 4.6% 4.4% 4.6% 4.4% 5.2% 5.1% 5.4% 5.2% 5.5%
3.2% 3.0% 3.3% 3.4% 3.5% 3.5% 3.2% 3.0% 2.9% 2.8% 3.2% 3.2% 2.7% 2.8% 2.8%
0%
10%
20%
30%
40%
50%
60%
70%
80%
90%
100%
FY00 FY02 FY04 FY06 FY08 FY10 FY12 FY14
Shar
e o
f fi
nal
ste
el p
rod
uct
s (%
)26-29,31. Other special steel
30. High-tensile steel
24,25. Structural steel
21-23. Tool steel
20. Stainless
18,19. Special pipe
16,17. Ordinary pipe
12-14',15. Coated sheet, coil
10,11. Cold rolled sheet , coil
9,9'. Hot rolled coil
7,7',8. Hot rolled plate, sheet
1-6. Long products
Ordinary steel (20)
Special steel (14)
3.4 Downstream production process (2/2) 14
We aggregated steel products (about 45 steel products by METI stat. and about 620 steel
products by Trade Stat.) into 34 categories
Capacity factor index (x1) Production process index (x2): Upstream, Downstream
94.7
97.5
100.4
103.3
106.1
1.65
1.70
1.75
1.80
1.85
FY00 FY02 FY04 FY06 FY08 FY10 FY12 FY14
Re
lative
ca
rbo
n in
ten
sity (
FY
05
=1
00
)
Ca
rbo
n in
ten
sity (
tCO
2/t c
rud
e s
tee
l)
Reported carbon intensity Estimates: 1.743+⊿x1+⊿x2+⊿x3
Capacity factor index: x1 Production process index: x2
Time trend variable: x3
⊿x2
⊿x1
⊿x3
Coefficient of capacity factor index (x1):
-0.26% per 1% point [t-stat: -13.6]
Time trend variable (x3): -0.005 tCO2/t/y [t-stat: -8.7]
This is equivalent to a 0.3%/y of improvement rate.
100
3.5 Results from FY2000 to FY2014 15
The estimates well explain the reported carbon intensity trajectory
Determinant of annual fluctuation: capacity factor
Determinant of long-term trend: time trend variable

3.6 Discussion about long-term trend of carbon intensity improvement 16
We can still observe the long-term trend of carbon intensity improvement
This means that “improvement factors” have been overcoming “worsening factors”
(a) Improvement factor (?) (b) Worsening factor (?)
Diffusion (retrofitting) of technologies such as
(a1) regenerative burner, and
(a2) use of waste plastics in coke oven and
BF
Replacement/aggregation of facilities such as
(a3) BF,
(a4) EAF, and
(a5) combined cycle power plant firing by-
product gases
Fuel substitution such as
(a6) from heavy oil to natural gas
Aging effects of facilities such as
(b1) aging of silica bricks in coke oven, and
(b2) accident partly being caused by the
aging
Implementation of environmental measures
such as
(b3) air pollution abatement measures, and
(b4) dust recycling system
>

4. Summary (1/2) 17
We empirically examined determinants affecting the carbon intensity (tCO2/t crude
steel) trajectory in the Japanese steel industry.
Question 1
What is the determinant of carbon intensity (tCO2/t of crude steel)?
Short-term (yearly) fluctuation of carbon intensity
Answer: Capacity factor
Long-term (FY2000-FY2014) trend of carbon intensity
Answer: It is combination of
Improvement factor
Diffusion of energy saving tech.
Worsening factor
Aging effect of facilities

4. Summary (2/2) 18
Question 2
Can we observe a long-term trend of carbon intensity improvement?
Answer: Yes
We observe a 0.3%/y of carbon intensity improvement during the
period from FY2000 to FY2014
Did VAs (negotiated agreements) have an effect on carbon intensity improvement?
Answer: The results (indirectly) suggest “Yes”

Appendix: Nonparametric regression 19
Key message
The result show that the residue has been decreasing with time
We reconfirm the long-term trend of carbon intensity improvement
The effects of x1, and x2 are
exogenously given here.
Capacity factor (x1)
Production process (x2)
Time trend variable (x3)
We conduct one-variable
regression, i.e., smoothing spline.

Appendix: What is the “Industrial Production Index”? 20
Industrial Production Index represents activity levels of industry
Hybrid indicator (economic + physical)
The structure of Japanese Industrial Production Index
Manufacturing (9989)
Industry (10000)
Mining (21)
Iron and steel (391)
Machinery and automotive (5125)
…
Hot-rolled steel products (110)
Machinery (1273)
Electronics (1940)
Transport machinery (1912)
Passenger cars (764)
…
…
Production tons
Production number
The weight is based on the value-added