Carbon Footprinting of ADB’s Transport...
18
Narendra Singru Carbon Footprinting of ADB’s Transport Projects
Transcript of Carbon Footprinting of ADB’s Transport...
Narendra Singru
Carbon Footprinting of ADB’s Transport Projects

2
Introduction
Rationale for Measuring Carbon Emissions:
• ADB’s Strategy 2020
• ADB’s Safeguards Policy Statement requires quantification of emissions linked to development and operations of its projects
• Need to develop a mechanism to monitor carbon emissions at project, portfolio, and corporate levels
Development of Tools - Independent Evaluation Department’s ongoing study on “Reducing Carbon Emissions from Transport Projects”
Consultant Team – Institute for Transportation & Development Policy; Clean Air Initiative for Asian Cities
Draft models available on ADB portal –
http://www.adb.org/evaluation/reports/ekb-carbon-emissions-transport.asp
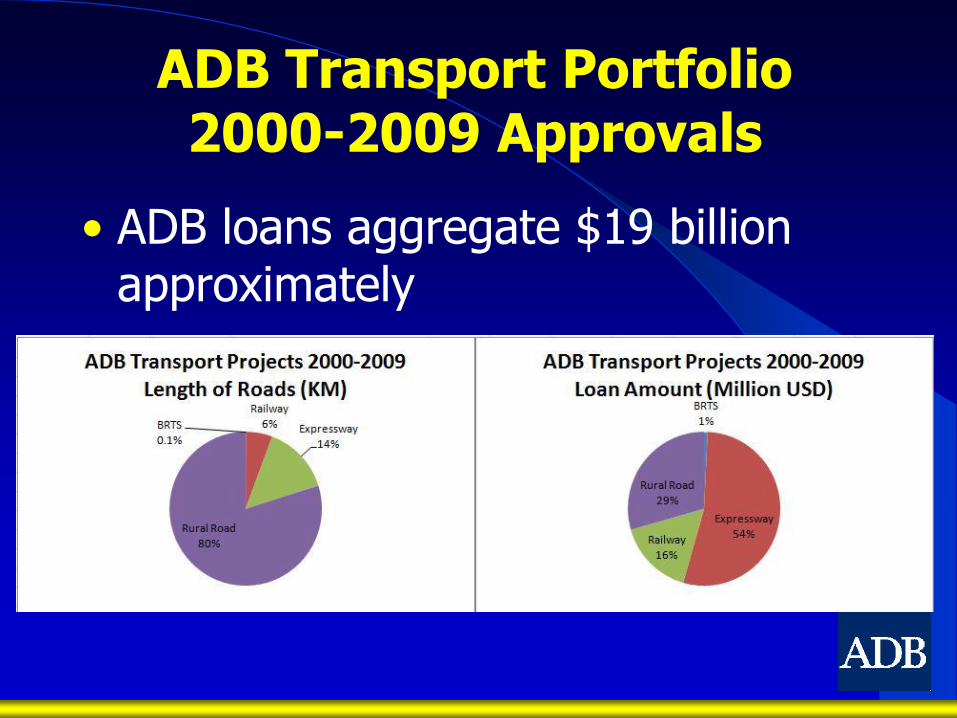
ADB Transport Portfolio 2000-2009 Approvals
• ADB loans aggregate $19 billion approximately
4
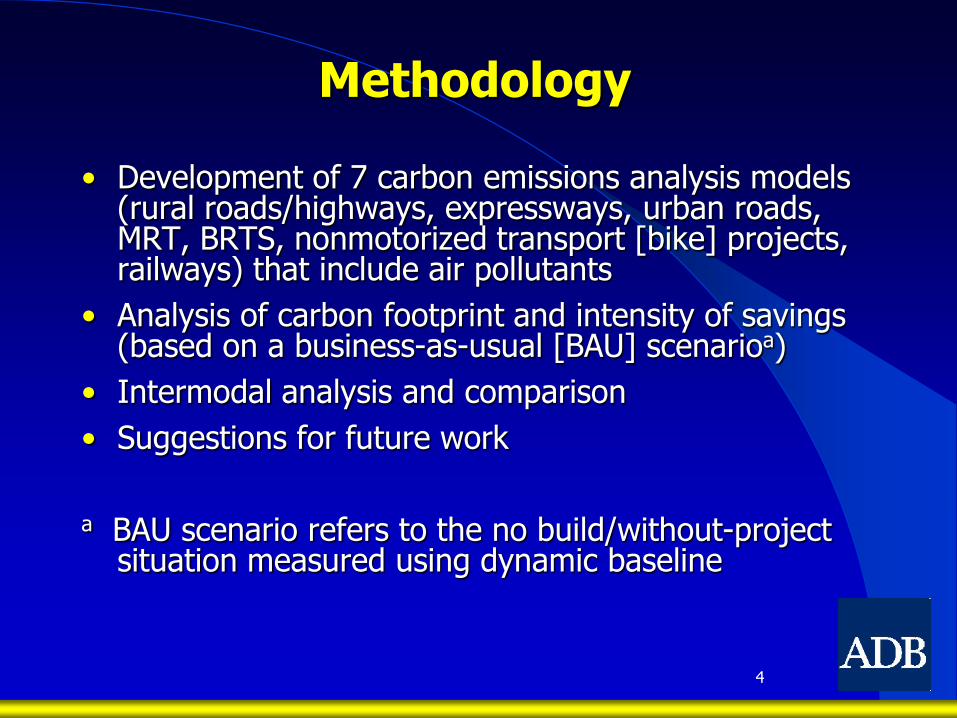
Methodology
• Development of 7 carbon emissions analysis models (rural roads/highways, expressways, urban roads, MRT, BRTS, nonmotorized transport [bike] projects, railways) that include air pollutants
• Analysis of carbon footprint and intensity of savings (based on a business-as-usual [BAU] scenarioa)
• Intermodal analysis and comparison
• Suggestions for future work
a BAU scenario refers to the no build/without-project situation measured using dynamic baseline
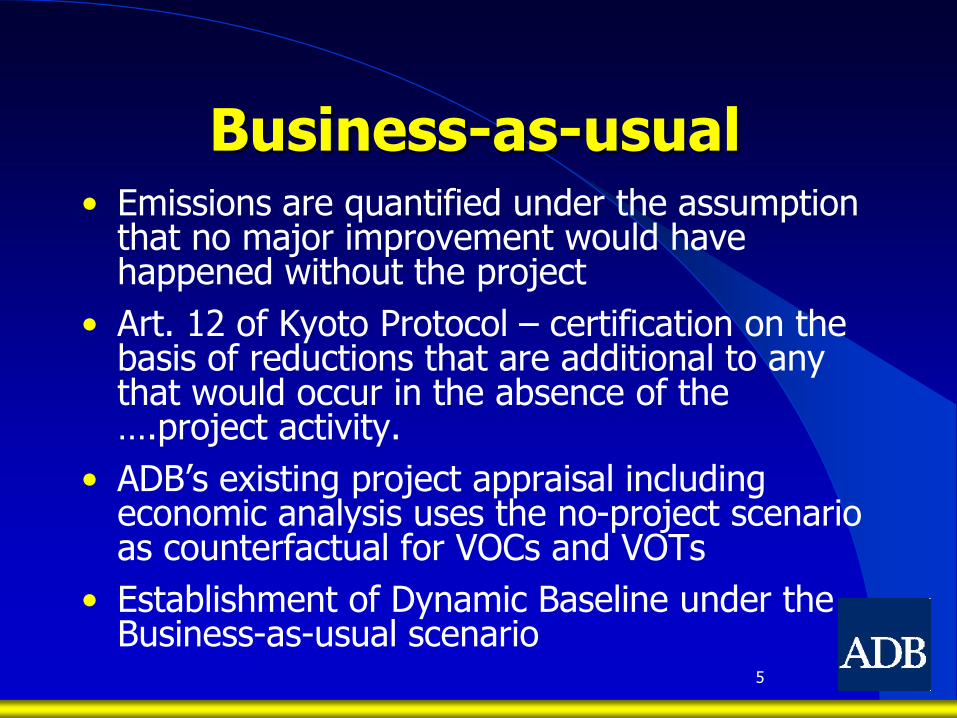
Business-as-usual• Emissions are quantified under the assumption
that no major improvement would have happened without the project
• Art. 12 of Kyoto Protocol – certification on the basis of reductions that are additional to any that would occur in the absence of the ….project activity.
• ADB’s existing project appraisal including economic analysis uses the no-project scenario as counterfactual for VOCs and VOTs
• Establishment of Dynamic Baseline under the Business-as-usual scenario
5

Dynamic Baseline• Main variables – traffic and vehicle speed
• Static baseline compares conditions at some fixed time
• Dynamic baseline reflects the changes over time and compares projected conditions at future points in time
• Subvariables include motor vehicle ownership and use, changes in public transport, transport modes, and sometimes changes in the attributes of motor fuels
6

Carbon Emissions of ADB’s Transport Portfolio
• Analysis of ADB’s transport portfolio of loans and grants approved during 2000–2009
• Analysis of project emissions over a 20-year life
• Gross carbon emissions from construction and operations of ADB-funded transport projects were estimated at 792 million tons
• Average of 39.6 million tons annually, which is in the range of the current land transport emissions between the Philippines and Thailand

Carbon FootprintCumulative CO2 Construction and Operations Emissions (Million Tons) of
ADB-Funded Transport Projects during 2000–2009
0 100 200 300 400 500 600
Expressways
Rural Roads
Rehabilitated Roads
Bus Rapid Transit
Railways

Key FindingsConstruction Emissions
• The size of the construction emissions varies between 1.2% and 24% of total (construction and operations) emissions
• MRT construction was found to emit about 20% of the total emissions
Expressways
• Expressways account for over 60% of ADB’s transport projects-related emissions
• The high emissions contribution of expressway projects is attributed to effects on induced travel that overwhelm the short-term benefits of curbing low-efficiency congested traffic
• Induced traffic effects boost CO2 emissions from added road capacity typically by one-fifth to one-half or more

Impact of Induced TrafficImpact on the CO2 Emissions of a Road Rehabilitation Project
(Case - Almaty–Bishkek Regional Road Rehabilitation Project)
0.0
0.5
1.0
1.5
2.0
2.52
00
5
20
06
20
07
20
08
20
09
20
10
20
11
20
12
20
13
20
14
20
15
20
16
20
17
20
18
20
19
20
20
20
21
20
22
20
23
20
24
Kilo
ton
s o
f C
O2
/K
m
Impact of Induced traffic
BAU e=0 e=0.25
e=0.5 e=0.8 e=1
BAU = business-as-usual, CO2 = carbon dioxide, km = kilometer, e = elasticity of traffic with regard to road capacity.
Key Findings (cont’d)• Rural roads and road rehabilitation projects were found to have
a neutral or marginally reducing impact on emissions
• Road rehabilitation projects form 80% of the total km of transport facilities financed for construction or reconstruction by ADB during the past 9 years; but they made up less than 4% of the CO2 footprint of ADB’s transport portfolio
• Public transport investments and railway improvements, while generating new CO2 of their own, more than offset those emissions when they divert passenger and freight movements from higher carbon modes and improve the efficiency of traffic flows
• Bikeways produce modest reductions in emissions by diverting some trips from more carbon intense modes

Savings in the Intensity of CO2
Emissions CO2 Tons Saved per Kilometer per Lane per Year
CO2 Savings Indicator (ton/lane-km/year)
-1,000 0 1,000 2,000 3,000 4,000 5,000
Expressway
Bikeway
Rural Road Capacity
Rural Road
Rehabilitation
Metro
BRTS
Railway
Indicators for Monitoring Carbon Emissions
• Output Indicator - CO2 intensity per km of infrastructure constructed
• Mobility Indicators - CO2 intensity per ton-km (freight) and per passenger-km
• Investment Indicator - CO2 intensity per$ million spent on transport projects

Impact of CO2 Emissions on EIRR
CO2 = carbon dioxide, EIRR = economic internal rate of return, VOC = vehicle operating cost, VOT = value of time.

Data Requirements for Measuring Carbon Emissions
from Road Projects• Basic project data
For Construction Emissions
• Construction materials used - cement, steel, and bitumen
For Operations Emissions
• Traffic data – baseline traffic volumes, trip lengths, traffic composition, occupancy, induced traffic elasticity, fuel split of vehicles
• CO2 emission intensity factor in kilogram per liter for different modes depending on gasoline and diesel fuel split
• Volume to capacity (V/C) saturation limit on the project road
• Upstream emission factor to account for fuel manufacture
Measurement of Air Pollution
• Input emission factors for Particulate Matter (g/km) and NOx (g/km)

Recommendations for Controlling Future Carbon
Emissions• Shift investment and design to favor low carbon
sustainable transport – public and nonmotorized transport, railways and intermodal connections, system management
• Encourage integrated transport supply and demand management
• Include smart traffic management to cut carbon emissions by up to 20%
• Foster efficient supply chains and logistics management to cut emissions from freight

Issues for Discussion• Use of carbon emissions in project appraisal –
economic and environment assessments
• Constraints on data availability
• Fine tuning of the models
Draft models available on ADB portal –http://www.adb.org/evaluation/reports/ekb-carbon-emissions-transport.asp
• How can the BAU scenario be improved?
• Country capacities to collect data and monitor emissions

For feedback or more information
contact:
Narendra Singru
Independent Evaluation Department, ADB