C.j. Stryver Michael Glidewell, Megan Yasuda, Emily Swanson.
Upload
truonglienCategory
view
229download
0
Carbon Disclosure ProjectReport 2007GermanyOn behalf of 315 investors with assets of 41 trillion US Dollar
CARBON DISCLOSURE PROJECT
271334_CDP_Rep_2007_engl_f:CDP_Bericht_2007 22.10.2007 10:33 Uhr Seite U1

Report written by:Professor Dr. Alexander Bassen, University of HamburgOctober 2007
The information included herein this report is based on that provided in respondent submissions, which the authors and publishers believe tobe reliable, but the authors and publishers do not guarantee its accuracy or completeness. The authors and publishers make no assurance,representation or warranty express or implied, concerning the fairness, accuracy, or completeness of the information and opinions containedherein. All opinions expressed herein are based on the authors and publishers judgment at the time of publishing this report and are subject tochange without notice due to economic, political, industry and firm-specific factors. The report makes all attempts to adhere to the disclosurepermission requests of the individual company respondents. Comprehensive and unedited information from the original submissions is avail-able at www.cdproject.net. The authors and publishers and their affiliated companies, or their respective shareholders, directors, officersand/or employees, may have a position in the securities discussed herein. The securities mentioned in this document may not be eligible forsale in some states or countries nor suitable for all types of investors; their value and the income they produce may fluctuate and/or beadversely affected by exchange rates. The contents of this report may be used by anyone providing acknowledgment is given.
271334_CDP_Rep_2007_engl_f:CDP_Bericht_2007 22.10.2007 10:33 Uhr Seite U2

CDP5 Signatories 2007
Carbon Disclosure Project 2007 3
Hermes Investment Management United Kingdom
HSBC Holdings plc United Kingdom
KLP Insurance Norway
London Pensions Fund Authority United Kingdom
Merrill Lynch USA
Morgan Stanley USA
Morley Fund Management United Kingdom
Neuberger Berman USA
Newton Investment Management LimitedUnited Kingdom
Pictet Asset Management Switzerland
Rabobank Netherlands
Robeco Netherlands
SAM Group Switzerland
Schroders United Kingdom
Signet Capital Management Ltd United Kingdom
Sompo Japan Insurance Inc. Japan
Swiss Reinsurance Company Switzerland
The Ethical Funds Company Canada
The RBS Group United Kingdom
Zurich Cantonal Bank Switzerland
Carbon DisclosureProject Members 2007This report is based on the submissionsfrom German corporations in response to the information request sent by theCarbon Disclosure Project (CDP5) on 1st February 2007.
The report and all responses from corpo-rations are available without charge fromwww.cdproject.net.
In 2007, CDP launched a Membershipoption for signatories. CDP Membershipallows signatories to have a leading role inthe development of CDP and to performimproved comparative analysis of compa-ny responses through the new onlinedatabase.
The following investors are CDP Membersin 2007:
ABN AMRO Bank N.V. Netherlands
ABP Investments Netherlands
AIG Investments USA
ASN Bank Netherlands
AXA Group France
BlackRock USA
BNP Paribas Asset Management (BNP PAM) France
BP Investment Management LimitedUnited Kingdom
Caisse de Dépôts et Placements duQuébec Canada
Caisse des Dépôts France
California Public Employees RetirementSystem USA
California State Teachers RetirementSystem USA
Calvert Group USA
Canada Pension Plan Investment BoardCanada
Catholic Super Australia
Ethos Foundation Switzerland
Folksam Sweden
Generation Investment Management United Kingdom
CDP Signatories 2007315 investors (including the 35 germanbased corporations as shown below inred) are signatories to the CDP5 informa-tion request dated 1st February 2007including:
Aachener GrundvermögenKapitalanlagegesellschaft mbH Germany
Aberdeen Asset Managers United Kingdom
ABN AMRO Bank N.V. Netherlands
ABP Investments Netherlands
ABRAPP – Associação Brasileira dasEntidades Fechadas de PrevidênciaComplementar Brazil
Acuity Investment Management Inc.Canada
Aegon N.V. Netherlands
Aeneas Capital Advisors USA
AIG Investments USA
Alcyone Finance France
Allianz Group Germany
AMP Capital Investors Australia
AmpegaGerling Investment GmbHGermany
ANBID – National Association of BrazilianInvestment Banks Brazil
ASN Bank Netherlands
Astra Investimentos Ltda Brazil
Australia and New Zealand Banking GroupLimited Australia
Australian Ethical Investment LimitedAustralia
Australian Reward Investment Alliance(ARIA) Australia
Aviva plc United Kingdom
AXA Group France
Baillie Gifford & Co. United Kingdom
Banco Bradesco S.A. Brazil
Banco do Brazil Brazil
Banco Fonder Sweden
Banco Pine S.A. Brazil
Bank Sarasin & Co, Ltd Switzerland
Barclays Global Investors (Deutschland) AGGermany
Barclays Group United Kingdom
BayernInvest KapitalanlagegesellschaftmbH Germany
BBC Pension Trust Ltd United Kingdom
Beutel Goodman and Co. Ltd Canada
271334_CDP_Rep_2007_engl_f:CDP_Bericht_2007 22.10.2007 10:33 Uhr Seite 3

CDP5 Signatories 2007
Carbon Disclosure Project 20074
Close Brothers Group plc United Kingdom
Comité syndical national de retraiteBâtirente Canada
Commerzbank AG Germany
Connecticut Retirement Plans and TrustFunds USA
Co-operative Insurance Society United Kingdom
Credit Agricole Asset ManagementFrance
Credit Suisse Switzerland
Daegu Bank South Korea
Daiwa Securities Group Inc. Japan
Deka FundMaster InvestmentgesellschaftmbH Germany
Deka Investment GmbH Germany
DekaBank Deutsche GirozentraleGermany
Delta Lloyd Investment Managers GmbHGermany
Deutsche Bank Germany
Deutsche Postbank Privat InvestmentKapitalanlagegesellschaft mbH Germany
Development Bank of Japan Japan
Development Bank of the Philippines(DBP) Philippines
Dexia Asset Management France
DnB NOR Norway
Domini Social Investments LLC USA
DPG Deutsche Performancemessungs-Gesellschaft für Wertpapierportfolio mbHGermany
DWS Investment GmbH Germany
Environment Agency Active Pension FundUnited Kingdom
Epworth Investment Management United Kingdom
Erste Bank der OesterreichischenSparkassen AG Austria
Ethos Foundation Switzerland
Eureko B.V. Netherlands
Eurizon Capital SGR Italy
Evli Asset Management Finland
F&C Asset Management United Kingdom
FAELCE – Fundação Coelce deSeguridade Social Brazil
FAPES – Fundação de Assistencia ePrevidencia Social do BNDES Brazil
Fédéris Gestion d’Actifs France
BlackRock USA
BMO Financial Group Canada
BNP Paribas Asset Management (BNPPAM) France
Boston Common Asset Management, LLCUSA
BP Investment Management LimitedUnited Kingdom
Brasilprev Seguros e Previdência S.A.Brazil
British Coal Staff Superannuation SchemeUnited Kingdom
British Columbia Investment ManagementCorporation (bcIMC) Canada
BT Financial Group Australia
BVI Bundesverband Investment und AssetManagement e.V. Germany
CAAT Pension Plan Canada
Caisse de Dépôts et Placements duQuébec Canada
Caisse des Dépôts France
Caixa Econômica Federal Brazil
California Public Employees RetirementSystem USA
California State Teachers RetirementSystem USA
California State Treasurer USA
Calvert Group USA
Canada Pension Plan Investment BoardCanada
Canadian Friends Service CommitteeCanada
Carlson Investment Management Sweden
Carmignac Gestion France
Catholic Superannuation Fund (CSF)Australia
CCLA Investment Management LtdUnited Kingdom
Central Finance Board of the MethodistChurch United Kingdom
Ceres USA
CERES-Fundação de Seguridade SocialBrazil
Cheyne Capital Management (UK) LLPUnited Kingdom
Christian Super Australia
CI Mutual Funds Signature Funds GroupCanada
CIBC Canada
Citizens Advisers Inc. USA
ClearBridge Advisers Social AwarenessInvestment USA
FIPECq – Fundação de PrevidênciaComplementar dos Empregados eServidores Brazil
First Affirmative Financial Network, LLCUSA
First Swedish National Pension Fund(AP1) Sweden
FirstRand Ltd South Africa
Five Oceans Asset Management PtyLimited Australia
Folksam Sweden
Fondaction Canada
Fonds de Réserve pour les Retraites –FRR France
Fortis Investments Belgium
Fourth Swedish National Pension Fund,AP4 Sweden
Frankfurt Trust Investment-GesellschaftmbH Germany
Frankfurter Service Kapitalanlage-Gesellschaft mbH Germany
Franklin Templeton Investment ServicesGmbH Germany
Frater Asset Management South Africa
FUNCEF Brazil
Fundação Assistencial e Previdenciária daExtensão Rural no Rio Grande do Sul-FAPERS Brazil
Fundação Atlântico de Seguridade SocialBrazil
Fundação Banrisul de Seguridade SocialBrazil
Fundação CESP Brazil
Fundação Codesc de Seguridade SocialBrazil
Fundação Copel de Previdência eAssistência Social Brazil
Fundação Corsan – dos Funcionários daCompanhia Riograndense de SaneamentoBrazil
Fundação Real Grandeza Brazil
Fundação Rede Ferroviaria de SeguridadeSocial – Refer Brazil
Fundação São Francisco de SeguridadeSocial Brazil
Fundação Vale do Rio Doce deSeguridade Social – VALIA Brazil
Gartmore Investment Management plcUnited Kingdom
Generation Investment ManagementUnited Kingdom
Genus Capital Management Canada
Gjensidige Forsikring Norway
271334_CDP_Rep_2007_engl_f:CDP_Bericht_2007 22.10.2007 10:33 Uhr Seite 4

CDP5 Signatories 2007
Carbon Disclosure Project 2007 5
Local Authority Pension Fund ForumUnited Kingdom
Local Government SuperannuationScheme Australia
Lombard Odier Darier Hentsch & CieSwitzerland
London Pensions Fund Authority United Kingdom
Macif Gestion France
Maine State Treasurer USA
Man Group plc United Kingdom
Maryland State Treasurer USA
Meag Munich ErgoKapitalanlagegesellschaft mbH Germany
Meeschaert Asset Management France
Meiji Yasuda Life Insurance CompanyJapan
Meritas Mutual Funds Canada
Merrill Lynch USA
Metzler Investment GmbH Germany
Midas International Asset ManagementSouth Korea South Korea
Mitsubishi UFJ Financial Group (MUFG)Japan
Mitsui Sumitomo Insurance Co Ltd Japan
Mizuho Financial Group, Inc. Japan
Monte Paschi Asset ManagementS.G.R. – S.p.A Italy
Morgan Stanley Investment ManagementUSA
Morley Fund Management United Kingdom
Münchner Kapitalanlage AG Germany
Munich Re Group Germany
National Australia Bank Limited Australia
National Bank of Kuwait Kuwait
National Pensions Reserve Fund of IrelandIreland
Natixis France
Nedbank Group South Africa
Needmor Fund USA
Neuberger Berman USA
New York City Employees RetirementSystem USA
New York City Teachers RetirementSystem USA
New York State Common Retirement FundUSA
Newton Investment Management LimitedUnited Kingdom
NFU Mutual Insurance Society United Kingdom
Goldman Sachs & Co. USA
Green Century Capital Management USA
Green Kay Asset Management United Kingdom
Groupe Investissement Responsable Inc.Canada
Guardians of New ZealandSuperannuation New Zealand
Hastings Funds Management LimitedAustralia
Helaba Invest KapitalanlageggesellschaftmbH Germany
Henderson Global Investors United Kingdom
Hermes Investment Management United Kingdom
HESTA Super Australia
Hospitals of Ontario Pension Plan(HOOPP) Canada
HSBC Holdings plc United Kingdom
I.DE.A.M – Integral Dévelopment AssetManagement France
Ilmarinen Mutual Pension InsuranceCompany Finland
Industry Funds Management Australia
ING Investment Management EuropeNetherlands
Inhance Investment Management Inc.Canada
Insight Investment Management (Global)Ltd United Kingdom
Instituto Infraero de Seguridade Social –INFRAPREV Brazil
Instituto Sebrae De Seguridade Social –SEBRAEPREV Brazil
Interfaith Center on CorporateResponsibility USA
Internationale KapitalanlagegesellschaftmbH Germany
Jarislowsky Fraser Limited Canada
Jupiter Asset Management United Kingdom
KBC Asset Management NV Belgium
KLP Insurance Norway
KPA AB Sweden
La Banque Postale AM France
LBBW – Landesbank Baden-WürttembergGermany
Legal & General Group plc United Kingdom
Libra Fund USA
Light Green Advisors, LLC USA
Nikko Asset Management Co., Ltd Japan
Norinchukin Zenkyouren AssetManagement Co., Ltd Japan
Northern Trust USA
Old Mutual plc United Kingdom
Ontario Municipal Employees RetirementSystem (OMERS) Canada
Ontario Teachers Pension Plan Canada
Opplysningsvesenets fond (TheNorwegian Church Endowment) Norway
Oregon State Treasurer USA
Orion Energy Systems, Ltd USA
Pax World Funds USA
Pension Plan for Clergy and Lay Workersof the Evangelical Lutheran Church inCanada Canada
PETROS – The Fundação Petrobras deSeguridade Social Brazil
PGGM Netherlands
Phillips, Hager & North InvestmentManagement Ltd Canada
PhiTrust Active Investors France
Pictet Asset Management Switzerland
Pioneer InvestmentsKapitalanlagegesellschaft mbH Germany
Portfolio 21 and Progressive InvestmentManagement USA
Portfolio Partners Australia
Prado Epargne France
PREVI Caixa de Previdência dosFuncionários do Banco do Brasil Brazil
Prudential Plc United Kingdom
PSP Investments Canada
Rabobank Netherlands
Railpen Investments United Kingdom
Rathbone Investment Management /Rathbone Greenbank Investments United Kingdom
Reynders McVeigh Capital ManagementUSA
RLAM United Kingdom
Robeco Netherlands
Rock Crest Capital LLC USA
Royal Bank of Canada Canada
SAM Group Switzerland
Samsung Investment Trust ManagementCo., Ltd South Korea
Sanlam Investment Management South Africa
Sauren Finanzdienstleistungen GmbH &Co. KG Germany
271334_CDP_Rep_2007_engl_f:CDP_Bericht_2007 22.10.2007 10:33 Uhr Seite 5

CDP5 Signatories 2007
Carbon Disclosure Project 20076
The Bullitt Foundation USA
The Central Church Fund of FinlandFinland
The Collins Foundation USA
The Co-operative Bank United Kingdom
The Co-operators Group Ltd Canada
The Daly Foundation Canada
The Dreyfus Corporation USA
The Ethical Funds Company Canada
The Local Government PensionsInstitution (LGPI) (keva) Finland
The RBS Group United Kingdom
The Russell Family Foundation USA
The Shiga Bank, Ltd (Japan) Japan
The Standard Bank Group Limited South Africa
The Travelers Companies, Inc. USA
The United Church of Canada – GeneralCouncil Canada
The Wellcome Trust United Kingdom
Third Swedish National Pension Fund(AP3) Sweden
Threadneedle Asset Management United Kingdom
Tokio Marine & Nichido Fire Insurance Co.,Ltd Japan
Trillium Asset Management CorporationUSA
Triodos Bank Netherlands
Tri-State Coalition for ResponsibleInvesting USA
UBS AG Switzerland
Unibanco Asset Management Brazil
UniCredit Group Italy
Union Asset Management HoldingGermany
Unitarian Universalist Association USA
United Methodist Church General Boardof Pension and Health Benefits USA
Universal-Investment-Gesellschaft mbHGermany
Universities Superannuation Scheme(USS) United Kingdom
Vancity Group of Companies Canada
Vermont State Treasurer USA
VicSuper Proprietary Limited Australia
Vital Forsikring ASA Norway
Wachovia Corporation USA
Walden Asset Management, a division ofBoston Trust and Investment ManagementCompany USA
Savings & Loans Credit Union (S.A.)Limited. Australia
Schroders United Kingdom
Scotiabank Canada
Scottish Widows Investment PartnershipUnited Kingdom
SEB Asset Management AG Germany
Second Swedish National Pension Fund(AP2) Sweden
Seligson & Co Fund Management PlcFinland
Service Employees International UnionUSA
Seventh Swedish National Pension Fund(AP7) Sweden
Shinhan Bank South Korea
Shinkin Asset Management Co., LtdJapan
Shinsei Bank Japan
Siemens Kapitalanlagegesellschaft mbHGermany
Sierra Club Mutual Funds USA
Signal Iduna Gruppe Germany
Signet Capital Management Ltd United Kingdom
SNS Asset Management Netherlands
Société Générale France
Société Générale Asset Management UKUnited Kingdom
Sompo Japan Insurance Inc. Japan
Standard Chartered PLC United Kingdom
Standard Life Investments United Kingdom
State Street Corporation USA
State Treasurer of North Carolina USA
Storebrand Investments Norway
Stratus Banco de Negócios Brazil
Sumitomo Mitsui Financial Group Japan
Sumitomo Trust & Banking Japan
Superfund Asset Management GmbHGermany
Swedbank Sweden
Swiss Reinsurance Company Switzerland
Swisscanto Switzerland
TD Asset Management Inc. and TD AssetManagement USA Inc. Canada
Teachers Insurance and AnnuityAssociation – College Retirement EquitiesFund (TIAA-CREF) USA
Terra Kapitalforvaltning ASA Norway
TfL Pension Fund United Kingdom
Warburg-HendersonKapitalanlagegesellschaft mbH Germany
West Yorkshire Pension Fund United Kingdom
WestLB Mellon Asset Management(WMAM) Germany
Winslow Management Company USA
YES BANK Limited India India
York University Pension Fund Canada
Zurich Cantonal Bank Switzerland
271334_CDP_Rep_2007_engl_f:CDP_Bericht_2007 22.10.2007 10:33 Uhr Seite 6

Carbon Disclosure Project 2007 7
271334_CDP_Rep_2007_engl_f:CDP_Bericht_2007 22.10.2007 10:33 Uhr Seite 7

271334_CDP_Rep_2007_engl_f:CDP_Bericht_2007 22.10.2007 10:33 Uhr Seite 8

Carbon Disclosure Project 2007 9
In the past year, the effects of global climate change on society and economy have become thecentre of public discussion. The international community must act immediately to prevent theworst consequences of climate change. We need an effective international climate regime whichincludes all relevant countries and sets clear incentives to reduce global emissions.
The Federal Government is a pioneer in the field of climate protection, with its ambitious aimsand measures in Europe as well as the rest of the world. We hope that our function as role modelwill motivate others to act with similar determination. The “key measures for an integrated energyand climate programme” which have recently been agreed on in Meseberg are an important con-tribution to reach this aim.
Global climate change, as well as international and national efforts to contain its effects, arechanging not only the regulatory environment but also the rules of competition for companies.The issues of the costs and risks of climate change and the prospects for climate protection isbecoming more and more also a topic for the economy and the financial markets. In 2006, thelargest German companies were therefore interviewed for the first time within the scope of the“Carbon Disclosure Project” as to the importance of climate change and its effects on their busi-ness. The aim was to create, as a first step, more transparency in the market concerning thechallenges, changes and risks from the companies’ viewpoint. I welcome this approach.
Compared to last year, the number of returns of the CDP interview has increased considerably. Itis an encouraging sign that German companies choose to support this initiative, and I wish theCDP and its German partners BVI and WWF much success. Success, however, depends on theactive participation of even more companies, as well as a further improvement of the answerquality and information about CO2 emissions. I would like to expressly encourage all involved toassist this project.
Yours truly,
Michael GlosFederal Minister of Economy and Technology
Foreword of the Federal Minister of Economy and Technology,Michael Glos (Member of the Lower House of the German Parliament)
for the Second German Report of the “Carbon Disclosure Project (CDP)”
271334_CDP_Rep_2007_engl_f:CDP_Bericht_2007 22.10.2007 10:33 Uhr Seite 9

Table of Contents
271334_CDP_Rep_2007_engl_f:CDP_Bericht_2007 22.10.2007 10:33 Uhr Seite 10
CDP5 Signatories 2007 3
Foreword of the Federal Minister ofEconomy and Technology, Michael Glos 9for the Second German Report of the Carbon Disclosure Project (CDP)
1 The Cabon Disclosure Project (CDP) 12
Background to the CDP 13
Partners of the CDP German Report 15
2 Climate change – a capital market perspective 16
A greener world – a threat to credit profiles? The perspective of Fitch Ratings 17
Climate change and its effects on credit qualityThe perspective of Standard & Poor’s 19
Interview of fund managers on climate change 21
3 Analysis of the answers of german companies in the CDP 26
Introduction: Developments around ”climate change“ from 2006 to 2007 27
Responses 34
Transparency 35
Methodology 35
Company-specific risks and opportunities of climate change 36
Strategy 39
Targets for reducing emissions 40
GHG emissions reporting 40
Emissions reporting in the CDP 43
Scope and distribution of emissions 44
Further information on the most affected companies 45
Emissions – a value driver 46
4 Appendix 50
CDP5 Questionnaire 51
German 200 Response Status 54
Key trends from CDP geographic and sector expansions 58
Table of Contents
11Carbon Disclosure Project 2007
Table of Contents
271334_CDP_Rep_2007_engl_f:CDP_Bericht_2007 22.10.2007 10:33 Uhr Seite 11

1 CDP provides a coordinating secretariat andinnovative forum for investor and corporate
collaboration on climate change. Based onanswers to its questionnaire, CDP provides theinvestment community with information about cor-porations’ greenhouse gas emissions and climatechange management strategies. Through CDP’sdatabase, this information is available in a compa-rable format that adds value for investors and awide range of stakeholders.
271334_CDP_Rep_2007_engl_f:CDP_Bericht_2007 22.10.2007 10:33 Uhr Seite 12

panies and 235 corporations thatanswered the first request in 2002.
Having launched at No.10 Downing Streetin 2000, CDP has become the global stan-dard mechanism by which companiesreport their greenhouse gas emissions toinvestors. Its process has been applaudedby Al Gore (Former US Vice President), SirJohn Bond (then Chairman HSBC), JeffImmelt (CEO, General Electric), AngelaMerkel (German Chancellor) and TonyBlair (former UK Prime Minister) amongothers. CDP is proud to have assisted thepioneering efforts of global investors increating this comprehensive and interna-tional system of disclosure.
CDP data has also enabled stakeholderssuch as policymakers, service providers,and NGO’s to accelerate their own initia-tives. Last year CDP reports were pro-duced in English, French, German, Japan-ese and Portuguese and launched at aseries of high profile events in the maincapital markets in the world. CDP nowhosts the largest registry of corporategreenhouse gas data in the world, and thisinformation along with reports analyzing itcan be downloaded free of charge atwww.cdproject.net.
The CDP Secretariat extends sincerethanks to the signatory investors,responding corporations and regionalpartners for their participation in CDP5.
New CDP Initiatives in 2007
In addition to the expansion of its existingactivity in 2007, CDP is delighted to haveevolved its service offering in a number ofexciting directions:
Improved database. CDP is launching a user-friendly interfaceto its comprehensive database ofresponses. This will enable users to easilyand quickly perform comparative analysisby sorting company information by sector,geography, emissions and the CDP ques-tions.
CDP’s mission is to facilitate a dialoguebetween investors and corporations, sup-ported by high quality information fromwhich a rational response to climatechange will emerge.
The Carbon Disclosure Project (CDP)
In February 2007, CDP issued its fifthinformation request on behalf of 315 insti-tutional investors with assets of 41 trillionUS Dollar under management. Therequest was sent to 2,400 of the largestquoted companies in the world by marketcapitalization for disclosure of investment-relevant information concerning the risksand opportunities facing these companiesdue to climate change. These companiesincluded the largest listed companies inAsia, Australia, Brazil, Canada, France,Germany, India, Italy, Japan, New Zea -land, Scandinavia, South Africa, Switzer-land, UK, US, and the Electric Utilities andTransport sectors.
As in previous years the request focusedupon the issues CDP has identified inconjunction with many signatoryinvestors, corporations and other expertsas being most pertinent to the effect of cli-mate change on company value. Thoseissues include regulatory risk/opportunity(e. g. limits on emissions); physicalrisk/opportunity (e. g. changes in weatherpatterns impacting operations); consumersentiment risk/opportunity (e. g. reputa-tion); total company wide global green-house gas emissions and steps taken tomanage and reduce emissions.
41 trillion US Dollar of assets under man-agement represents more than one thirdof total global invested assets and is amarked increase from the 4.5 trillion USDollar that participated in the first CDPrequest in 2002.
76 percent of FT500 companies and atotal of 1,300 corporations answered thefifth CDP request in 2007, evidencing asignificant increase in support for CDP’swork from the 45 percent of FT500 com-
“The aim of CDP is to graduallyimprove information on CO2 emis-sions and climate strategies as wellas to initiate long-term plans for thefuture. I wish the Carbon DisclosureProject success with its furtherefforts both in Germany and world-wide.”
Dr. Angela MerkelGerman Chancelloron the occasion of the First German CDP Report
The Carbon DisclosureProject (CDP)Background to the CDP
13Carbon Disclosure Project 2007
The Carbon Disclosure Project (CDP)
271334_CDP_Rep_2007_engl_f:CDP_Bericht_2007 22.10.2007 10:33 Uhr Seite 13
The Carbon Disclosure Project (CDP)
Carbon Disclosure Project 200714
CDP Membership. CDP is now providing a premium servicefor those signatory investors who havebecome CDP members. This service pro-vides members with enhanced recognitionand access to the entire functionality ofthe database.
Supply Chain Initiative. In 2007, CDP was delighted to enter intopartnership with Wal-Mart Stores to sendthe CDP information request to a subsetof their suppliers. This contract representsthe start of an exciting development forCDP as it begins to mirror its activity withshareholders and corporations via corpo-rations and suppliers. The Wal-Mart workis now being developed for broader reachand impact with the launch of the SupplyChain Leadership Collaboration project(SCLC project) aimed at working with keysector leaders including: Retail, Brands,Aviation, Automotive and Governmentamong others. This work will help identifyand reduce emissions within their supplychains. The CDP Secretariat expressessincere thanks to Wal-Mart for their lead-ership in developing this new system forcorporate disclosure of emissions fromsupply chains
Climate Disclosure Standards Board(CDSB). CDP became a member of the CDSB con-sortium convened by the World EconomicForum in January 2007 and has beenfunded by the UK Department for Environ-ment to provide the Secretariat to CDSB,supporting its activities focused upon cli-mate change reporting standards.
“The first step towards managingcarbon emissions is to measurethem. Because in business whatgets measured gets managed. TheCarbon Disclosure Project hasplayed a crucial role in encouragingcompanies to take the first steps inthat measurement and manage-ment path. If more businessesprogress further down that meas-urement and management path,within the context of public policywhich spurs on the business lead-ers and drags up the business lag-gards, then we will be able – and atsurprisingly small economic cost –to offset the dangers which climatechange poses to our world.”
Lord Adair TurnerStandard Chartered plc
“It’s not surprising that investors areworried and that they are support-ing the Carbon Disclosure Project.In BT we share their concern – andwe have good business reasons fordoing so. We have a huge invest-ment in the UK telecommunicationsinfrastructure and that will beincreasingly at risk (…) the CarbonDisclosure Project does us all agreat service in bringing these mat-ters to the attention of the invest-ment and business communities. It is an important catalyst forchange – the change without whichthe world will be a very dangerousplace.”
Sir Christopher Bland,Chairman BT Group
Going Forward
CDP’s primary goal is to continue toimprove the quality and quantity ofresponses for its core disclosure activityand in doing so better inform the decision-making of investors and corporationsregarding the implications of climatechange.
CDP will also continue to respond tostakeholder requests to expand and inaddition to the new initiatives for 2007 isdeveloping further projects including:
• Expansion of the CDP process into fur-ther geographies and sectors.
• Expansion of the CDP process into pri-vate equity and private companies.
• Workshops for corporations andinvestors.
• Further development of the CDP data-base
• Assisting Pension Funds to developmandates incorporating climate changecriteria
CDP would be delighted to hear from parties interested in participating or part-nering with CDP and invites them toapproach the Project [email protected]
271334_CDP_Rep_2007_engl_f:CDP_Bericht_2007 22.10.2007 10:33 Uhr Seite 14

The Carbon Disclosure Project (CDP)
Carbon Disclosure Project 2007 15
CDP works to improve the informa-tion flow, seeks to improve Cityengagement, to improve under-standing and ultimately to improveeconomic performance… and ittackles it at the highest level with across border span, with force andwith directness (…) CDP representsa very positive aspect of sharehold-er engagement and if there aremore shareholders ready to sign upthat can only be, from my perspec-tive, a very good thing.”
Derek Higgs author Higgs Report on Corporate Governance
“Initiatives such as the Carbon Dis-closure Project (CDP) can play ameaningful role in our sharedendeavours to reduce greenhousegas emissions. The project showsthat both companies and investorshave key roles to play. It is verypositive and inspiring that the capi-tal markets are considering climaterelated aspects more and more intheir investment decisions. It provesthat the climate challenge is notonly a matter of technology it isalso an important economic issue.As Deputy Prime Minister and Min-ister of Enterprise and Energy it isespecially encouraging to see thatcompanies go ahead without stateintervention.”
Maud Olofsson Deputy Prime Minister Sweden
“(…) the members of the CarbonDisclosure Project have recognisedthat the cost benefit analysis pointsto it being in the interest of busi-ness to take action. The growth ofthe Carbon Disclosure Project itselfshows that investors are increas-ingly aware of the impact climatechange will have on shareholdervalue (…) this is a project that hasconsiderable momentum and thatin itself is significant.”
Rt Hon Margaret Beckett MPthen Secretary of State for Environment, Food & Rural Affairs
“It has been a really interestingexperience to watch the develop-ment of the Carbon DisclosureProject and I congratulate thosewho have worked so hard. It’sextremely significant because thereis a major shift in awareness of theclimate crisis and the need to inte-grate the behavior of companiespublic and private towards the cli-mate crisis, both it’s risks and it’sopportunities in the investmentmarket place and in the businessmarket place generally.”
Al Gore speaking at the CDP 2006 launch in New York
“CDP’s reporting mechanism offersa trusted solution for consistentand transparent reporting of ourenergy and carbon numbers, aswell as a way to share our reduc-tion strategies with our sharehold-ers and other companies. NewsCorp. is still at the very beginning ofour energy and climate changework and we’re delighted to haveaccess to the wealth of informationthat CDP provides for us to learnfrom.”
News Corporation
Partners of theCDP5 Report 2007GermanyThe partners of the CDP5 report forGermany are the BVI BundesverbandInvestment und Asset Managemente. V. and the World Wide Fund ForNature (WWF). The author of thereport is Professor Dr. AlexanderBassen.
The BVI represents the interests of86 companies which are active inasset management. Its members aremanaging over 1.6 trillion Euro ininvestment funds and assets outsideinvestment funds for over 15 millionprivate and institutional investors. 40BVI-members are supporting theCDP directly as “SignatoryInvestors”.
The WWF, one of the biggest organi-sations for the protection of natureworldwide, has been supporting theglobal work of the CDP since 2001for improved transparency of theman-made climate change and itseffects on the capital market and oncorporations; since 2006, the WWFhas been a partner within Germany.
The BVI and the WWF support theCDP in order to strengthen the con-sideration of the effects of the cli-mate change on the economic situa-tion of the listed joint stock compa-nies and the German economy in thearea of investment research. Theholistic analysis of the chances andrisks of the climate change mustinclude companies of all sectors andmust not limit itself to the obviousproducers of greenhouse gases. Theimproved transparency will acceler-ate the necessary systematic inte-gration of climatic risks when itcomes to decisions by investors.
Professor Dr. Alexander Bassen, University Hamburg, chair of invest-ment/financing, is the author of theCDP5 report for Germany. ProfessorBassen researches, teaches andconsults interested parties about theeffects of corporate governance,corporate responsibility, climatechange and investor relations in thecapital market.
271334_CDP_Rep_2007_engl_f:CDP_Bericht_2007 22.10.2007 10:33 Uhr Seite 15

2 Climate change – a capital market perspective
271334_CDP_Rep_2007_engl_f:CDP_Bericht_2007 22.10.2007 10:33 Uhr Seite 16

Climate change – a capital market perspective
Carbon Disclosure Project 2007 17
as testing, measuring, administratingand reporting. Purchase of more expen-sive substitutes. Fines for non-compli-ance.
• Increased capex: new substances orban of existing ones may require refur-bishment of plants and productionequipment. Investment in R&D may benecessary to produce substitute prod-ucts.
In addition, the risk of material impactfrom litigation will be increased. The intro-duction of REACH for instance changesdramatically the standing of polluters. Pre-viously, the onus of demonstrating dam-age lay with the plaintiff, with the difficultyof demonstrating a connection betweenharm and the chemical substance. WithREACH, however, a polluter’s liability canbe established by demonstrating that reg-ulation has not been followed, rather thanhaving to establish that harm has resultedfrom exposure to a chemical. The case ofasbestos with the litigation and financiallosses to industrial companies in the US isa pertinent example of how financiallydamaging litigation can be.
However, Fitch believes some of theincreased cost pressure will be mitigatedby increased efficiency of new productionmethods as well as lower energy costs,where processes have focused on suchimprovements. In addition, increasinglyenvironmentally-aware consumers may beopen to the offer of “greener” premiumprice products. Further, there are impor-tant business opportunities for companiesproviding the services and goods whichtarget environmental improvements.
As economic and population growth hasaccelerated in recent centuries post-industrialisation, it has become clear thatwe have to adjust our use of the world’sresources in the interest of the survival ofour species. Environmental disasters,including increasingly extreme weatherpatterns causing floods and otherdestruction, have direct negative econom-ic impact. Concerns are no longer voicedonly by environmental scientists and spe-cialist campaigners but have becomeshared by the general public. Hence, solu-tions for environmental challenges haveentered the political agenda. There is nowa number environmental legislative initia-tives (see Fact box), many of which focuson producers of goods. How will industrialcompanies cope with the extra burden ofcompliance?
The negative impact from environmentallegislation is expected to derive mainlyfrom the following areas: reduction in rev-enues, increased operating costs andincreased capex.
• Revenue reduction: this may occur if aban on a dangerous chemical results inthe termination of business segment of achemicals manufacturer. Alternatively,interruption in supplies due to either banor delays in production due to non-com-pliance can affect downstream end-users if a substitute cannot be identifiedin a timely manner. Increased productprice to recover higher manufacturingcosts may be rejected by customerswho may switch suppliers or substituteproduct entirely.
• Increased operating costs: labourcosts associated with compliance, such
New legislation –financial impactAs REACH As REACH (Registration, Evaluation,(Registration, Evaluation,Authorisation and Restriction ofAuthorisation and Restriction ofChemicals)Chemicals), WEEE , WEEE (Directive imposes(Directive imposesresponsibility on manufacturers andresponsibility on manufacturers andimporters of electrical and electronicimporters of electrical and electronicequipment)equipment) and RoHS and RoHS (Restriction of(Restriction ofthe Use of Certain Hazardous Sub-the Use of Certain Hazardous Sub-stances in Electrical and Electronicstances in Electrical and ElectronicEquipment Regulations 2006)Equipment Regulations 2006) areareambitious pieces of legislation, andambitious pieces of legislation, andas such, have been the object ofas such, have been the object ofpublic consultations during whichpublic consultations during whichindustry is invited to voice its con-industry is invited to voice its con-cerns, it is unlikely that their imple-cerns, it is unlikely that their imple-mentation would lead to materialmentation would lead to materialdeterioration of an industry’s viability.deterioration of an industry’s viability.Nevertheless, Fitch expects thatNevertheless, Fitch expects thatsome sub-sectors and individualsome sub-sectors and individualcredits can potentially see their per-credits can potentially see their per-formance impaired under the weightformance impaired under the weightof these new environmental rules.of these new environmental rules.Small to medium sized chemical andSmall to medium sized chemical andcapital goods manufacturers are twocapital goods manufacturers are twocategories which could potentiallycategories which could potentiallysee their credit profiles affected.see their credit profiles affected.
Climate change – a capital marketperspectiveA greener world – a threat to credit profiles? The perspective of Fitch, by Monica Klingberg-Insoll1
1 Managing Director, Head of Emerging Markets, Europe & Asia, Industrials, Fitch Ratings, London.
271334_CDP_Rep_2007_engl_f:CDP_Bericht_2007 22.10.2007 10:34 Uhr Seite 17

Climate change – a capital market perspective
Carbon Disclosure Project 200718
A key issue regarding potential creditimpact of increased environmental legisla-tion is the ability of a company to passincreased costs on to its customers. Theability to pass on costs is largely depend-ent on the structure of the industry andthe balance of pricing power betweencustomers and suppliers.
Provisions
In an effort to quantify the financial impactof environmental legislation, Fitch sur-veyed a sample of 52 EU industrial com-panies. The agency calculated that theaverage environmental provision amount-ed to approximately 15 percent of EBITDAR (Earnings before Interest, Taxes,Depreciation, Amortization and Rent) withlittle change observed in this levelbetween the financial reporting years of2004 and 2005. In practice, the cash out-flows related to provisions are spread overa number of years, thus limiting the cashimpact of a provision.
Some sectors showed little or no provi-sioning at all, such as the construction,auto manufacturing and aerospace sec-tors. Diversified manufacturing had anaverage level of provisioning and the high-est provisioning was seen for chemical,capital goods and unsurprisingly for thenatural resources sectors. Of those whoreported specific reasons for provisioning,site and water rehabilitation and asbestoswere the most commonly stated. Amongcapital goods companies, Electrolux(’BBB’/Stable) stood out as the only com-pany to have announced and provided forthe expected financial cost of complying
with the WEEE directive, estimated that itcould cost the equivalent of 11 percent ofits EBITDAR annually. Among the 52industrials companies examined, only nineactually referred to WEEE, RoHS andREACH in their annual reports of the year2005.
However, the approach to provisioning isnot homogenous and Fitch is aware thatthe automotive industry in particular isconscious of the new legislation. Thecombination of CO2 reduction, voluntarycommitments and more stringent EU reg-ulations to curb exhaust emissions willcontinue to weigh on manufacturers' cred-it profiles and will have consequences ontheir product mix. The financial impact ofcomplying with these regulations is sub-stantial. For example, in 2006 only,Renault SA ('BBB+'/Stable Outlook) andPeugeot SA (PSA, 'A-' (A minus)/F2/Neg -ative Outlook) reported charges linked toEU4 regulations of 360m Euro and188m Euro respectively. In a context offierce competition and extreme pricingpressure, Fitch believes that manufactur-ers will have difficulties to pass on to cus-tomers the extra cost of environmentalregulations. The European AutomobileManufacturers Association (ACEA) esti-mated that the cost of meeting lower CO2
emissions limits may reach 4,000 Euro percar on average although this figure isdeemed overestimated in other analyses.In addition, extra costs to comply withEuro 5 and Euro 6 norms may reach590 Euro to 900 Euro per vehicle accord-ing to various industry estimates.
Figure 1: Provisioning for environmental costs by industrial sector as % of EBITDAR (financial year 2005)
70
60
50
40
30
20
10
0Capital goods Auto & related Chemicals
62,3%
%
30,3%
6,1%
0 % 1,3%
58,0%
15,1%
3,7% 2,1% 3,5%
18,3%
5,5%
11,9%
37,4%
0,3%
6,0%
63,1%
13,9%
Naturalressources
Aerospace &defense
Building materials &
construction
� Max.
� Min.
� Median
271334_CDP_Rep_2007_engl_f:CDP_Bericht_2007 22.10.2007 10:34 Uhr Seite 18

Climate change – a capital market perspective
Carbon Disclosure Project 2007 19
tors and companies will be able to absorbthe additional costs without significantdeterioration of credit profiles. To theextent that the new demands also drivemore efficient, lower energy processes,they may even have positive effects.
Conclusion – limited impact
In conclusion, while Fitch recognizes thatthe impact on credit profiles of increasedenvironmental legislation is on balancenegative, the agency believes most sec-
Climate change and its effects on credit qualityThe perspective of Standard & Poor’s bySwaminathan Venkataraman and Peter Kernan
price of 100 US Dollar per ton for CO2
credits, the price increase to consumerswould only be about 1 US Dollar per gal-lon of gasoline (since 100 gallons of gaso-line burn to produce one tonne of CO2),which drivers have absorbed in the recentpast without switching en-masse to less-polluting vehicles.
Auto emissions do not currently fall underthe EU ETS, but it may do so in the US orother countries and perhaps in the EU aswell in future. In any case, given any spe-cific economy-wide emission cap, the useof legislation that mandates higher fueleconomy for autos, or greater use of bio-fuels etc. would be a key determinant ofhow much reductions are achieved fromautos and thus how much is demandedfrom other sectors. Power generation mayend up with a disproportionately largershare of emission reductions and costsbecause, even at 100 US Dollar per tonfor carbon credits, auto emission reduc-tions will depend on the extent to whichconsumers see higher gas prices as per-manent and change their behavior, and onthe extent to which automakers respondwith lesspolluting vehicles. By contrast, ata carbon emissions cost of 100 US Dollarper ton the power sector could becomealmost entirely emissions-free, as most ifnot all estimates of the cost to utilities ofcapturing and sequestering carbon areless than 100 US Dollar per ton.
Impact on the existing assets
Auctioning versus allocation of carboncredits in a cap-and-trade regime has thegreatest impact on the value of existingassets, including power generationassets. The free allocation of CO2 emis-sion allowances in Phase I of the EU ETSallowed gas and coal-fired generators tobe more profitable than in the absence ofthe ETS. This profitability will decline inPhase II and beyond as more credits areauctioned rather than assigned and the
In developed countries, there are manywho accept the inevitability of carboncontrols and industry is in many casesnow seeking to influence their final formand negotiating the future participation ofdeveloping nations in a global carbonregime. Credit consequences may resultas restrictions on greenhouse gas (GHG)emissions cause significant increases incapital costs and/or reductions in prof-itability. Standard & Poor’s sees carboncontrols impacting credit quality globallyin four broad ways, which we summarizebelow and discuss with a specific focuson the energy industry. For a moredetailed discussion, please refer to Stan-dard & Poor’s Europe-focused “ClimateChange Credit Survey” published inNovember 2005 and a more recent Credit -Week special issue of May 23, 2007 titled“The Credit Impact of Climate Change”
Sectoral Distribution of EmissionReductions and Costs
The economy-wide target emissions levelwill clearly be the primary driver of thetotal costs of complying with emissioncontrols. However, the sectoral distribu-tion of emission reductions, and hencecosts, will vary substantially dependingupon the implementation mechanismschosen. A cap-and-trade approach, takenin isolation, may result in a disproportion-ate allocation of emission reductionsamong different sectors. The power andautomobile sectors provide a prime exam-ple of this. Some U.S. Senate bills pro-pose that oil refiners be responsible notonly for their own emissions, but also forauto tailpipe emissions. However, refinerscontrol neither the fuel efficiency of carsnor the driving habits and model prefer-ences of drivers. At best, refiners can indi-rectly affect such decisions by passingthrough to customers the cost of carbonallowances in the form of higher gasolineprices. But this is potentially a weak pricesignal. To take an extreme example, at a
271334_CDP_Rep_2007_engl_f:CDP_Bericht_2007 22.10.2007 10:34 Uhr Seite 19
20 Carbon Disclosure Project 2007
Climate change – a capital market perspective
absolute level of freely granted allowancesto the power sector is likely to decline.Regional initiatives in the US are lookingat auctioning a majority of the credits.
Given any level of auctioning, two factorswill have a key influence on the value ofpower generation assets in a carbon-con-strained world. The characteristics of thepower markets in which the companyoperates, chiefly the fuel that sets themarginal price at various times and howthat changes over the years, and thenature of a company's generation portfo-lio, whether it is Fossilheavy, Carbon-lightor Diversified between the two. Interest-ingly, it appears that well-diversified com-panies may be indifferent to whether car-bon legislation is stringent or lenient. Ofcourse, these factors determine only thetotal magnitude of compliance costs andthe actual credit impact will be determinedby the ability of any company to passthese costs on to consumers. Regulatedutilities may be able to pass-through coststo customers while unregulated powergenerators and other sectors of the econ-omy will depend upon market forces.
Impact on future assets
The nature of assets acquired in the futurepromises to be substantially different fromthat in the past, whether in power genera-tion, autos or other polluting industries. Ifa global consensus develops around theneed for post-Kyoto legislation thatachieves a long-term CO2 concentrationtarget anywhere close to the 500 +/– 50ppm indicated by many scientific models,there is no technological silver bullet and aportfolio of strategies would be required toachieve the target. A paper that StephenPacala and Robert Socolow of PrincetonUniversity published in the journal Sciencein August 2004 estimated that emissionreductions of about 7 Gigatonnes of Car-bonequivalent (GtC) per year would berequired by the middle of the centurycompared to a business-as-usual sce-nario to stabilize CO2 levels at this target,although the number is perhaps highernow given that growth in Asia has general-ly be stronger than assumed in many ofthe models. They also calculate the mag-nitude of effort that will be required under15 different GHG reduction options inpower, autos, afforestation, agricultureetc. For instance, a doubling of currentlyinstalled global nuclear capacity, in itselfextremely uncertain, will only provideabout 1 GtC/yr of emission reductionrequirements. 2 million 1 MW peak wind-
mills (50 times the current capacity) will berequired to achieve the same effect, indi-cating the magnitude of the emissionsreduction task.
Strategy selection would vary by countryand, indeed, regionally within each coun-try, depending upon the nature and costof resources available, the kind of busi-nesses present, public support for specificoptions, and the regulatory regime. Thecredit impact varies by the choice of strat-egy and a look at power productionoptions is instructive.
Energy efficiency, a popular choice,reduces utility revenue growth, and thusmargins, in the absence of regulatory“decoupling mechanisms” that separateutility profits from sales. Coal gasificationtechnology and carbon capture andsequestration (CCS) suffer from highercosts, lower reliability and a lack of com-mercial track record all of which are creditnegatives. This is a major factor as theIntergovernmental Panel on ClimateChange (IPCC) estimates that CCS couldaccount for 15 percent to 55 percent ofthe cumulative GHG mitigation effortworldwide until 2100. CCS also suffersfrom substantial legal and regulatory risksif utilities will be responsible for the safetyand monitoring of CO2 storage sites overperiods potentially lasting thousands ofyears. Wind energy, which currently hasthe largest potential among renewablesources, is an intermittent resource andrequires additional investment in back-upgeneration, while nuclear power involvesextremely large capital expenditures andsuffers from waste disposal and terrorismrisks. Finally, other “green” options suchas solar, wave, and tidal power are stillimmature, expensive, and will be marginal.
Corporate Governance
With the emergence of climate change asa major social concern and a more impor-tant input to corporate decision makingand national energy policies, corporatedisclosure about climate change risks andexposures has acquired importance asinvestors clamour for better disclosureover the potential risks faced by their port-folios. Industry-wide standards of disclo-sure not only promote transparency andcomparability across companies but, allelse being equal, also result in greatermarket confidence and more secureaccess to capital markets for companies,an important credit factor.
271334_CDP_Rep_2007_engl_f:CDP_Bericht_2007 22.10.2007 10:34 Uhr Seite 20

21Carbon Disclosure Project 2007
Climate change – a capital market perspective
Dr. Thomas Deser
Potential influences of climate change areprincipally very important as they caninfluence the economic success potentialand, thus, especially affect the stakehold-er value in the long run. The importance ofthese aspects has grown in the past fewyears. The main driver is the influence ofthese aspects on the cost situation of thecompanies as well as the higher regard ofthe investors for companies with a proac-tive business policy in this respect.
Felix Adrian
The effects of climate change have directas well as indirect importance for theinvestment process. The direct chancesare, among others, the accelerated techni-cal progress of development, and the useof environmentally-friendly technologies inmany areas, (which consume lessresources), ranging from alternative ener-gy generation, via the reduction of con-sumption or general environmental tech-nology to consumer products. Indirectly,the increasing of investment volumes insuch areas offers chances for growth for agreat number of industries and, thus, aneconomic capital allocation which is moreenvironmentally-friendly. As a conse-quence, we see opportunities for growthas well as investment chances, which werespond with specific product offers. Dueto the many diversified aspects in a largenumber of companies, we also incorpo-rate these chances into our existing prod-uct ranges.
Some risks associated with climatechange might be heavy losses due to badweather (which could hit single industriessuch as mining or oil and gas extraction),increased variations in harvests (whichthen trigger large fluctuations in raw mate-rial prices), or added dangers duringtransportation. The monitoring of suchphenomena and the necessary reactionsinfluence the tactical level of asset alloca-tion and stock selection.
Interview of fund managers on climate change
Question: Climate change can have direct as well as indirect effects on companies.What fundamental importance have chances and risks, as a consequence of cli-mate change, for your investment strategies and asset allocation, and how has theirimportance changed recently?
Felix Schnella
In principal, we can say that the futurelegal, political and economic conditionsfor chances and risks which might be trig-gered by climate change cannot be fullyevaluated neither for the global marketsnor for the individual industries. Whereasin some areas the topic of environmentalprotection is much discussed and politi-cised (e. g. aviation and automotive indus-tries), the topic has not yet reached theawareness of the public at large.
For many years we see our role as assetmanagers as identifying all imaginablerisks, using all qualified research sourcesfor deducing medium- to long-term orient-ed investment strategies and effectivedecision processes for investment. Forthis purpose we developed a specialresearch approach with “Grassroots”which exceeds the traditional methods ofanalysis by including multipliers such asmarket researchers, free journalists, physi-cians, manufacturers, managers, sales-persons, consumers and other relevantgroups of individuals in order to identifymarket trends and opportunities at anearly stage.
The importance of the chances and riskswhich could be caused by climate changehave already determined our investmentstrategies and our asset allocation for sev-eral years. This forward-looking view hasbeen widely accepted by private and alsoinstitutional investors; it has influenced thechoice of products and of our asset man-agement partner who will be entrustedwith the management of the capitalinvested.
The correct evaluation of these changes,and the possible re-orientation of thosecompanies which are under considerationas investments for professional assetmanagement, are pre-requisites for us toidentify potential winners and losers, aswell as to balance the effects on the indi-vidual industries and companies bychanging the sectoral weighting.
Felix AdrianCFA, cominvest, head of securities fund management
Dr. Thomas DeserCEFA, Union Investment, Equities,Senior Portfolio Manager
Michael Schneiderfund manager of Deka-UmweltInvest
Felix SchnellaCFA, Allianz GlobalInvestors, Senior Portfolio ManagerEuropean Equities
Nicolas HuberDWS, responsible forthe area of climaticchange/renewableenergies, Senior Port-folio Manager
271334_CDP_Rep_2007_engl_f:CDP_Bericht_2007 22.10.2007 10:34 Uhr Seite 21

Climate change – a capital market perspective
Carbon Disclosure Project 200722
Question: The discussion is often limited to industries which, due to their businessmodel, have to deal with emissions already for many years (utilities, logistics).Which other industries are concerned and how should the discussion and imple-mentation be organized in the service sector?
Dr. Thomas Deser
The problem also concerns companiesthat extract raw materials (oil, coal, etc.),chemical companies, construction com-panies and engineering works of all disci-plines. The discussion and implementa-tion in the service sector could start withaspects of the energy efficiency of build-ings and of office technology.
Nicolas Huber
The re-insurance industry, for instance,has to contend with markedly higherclaims and is thereby forced to imposemarkedly higher insurance premiums.New industries have also evolved, e. g.solar, bio and wind energy. The diversity ofthe agricultural sector has increased con-siderably. And car manufacturers who donot concentrate on climatic neutrality arealready suffering comptetitive disadvan-tage.
Felix Adrian
Service providers are consumers of ener-gy, industrially produced products, infra-structure, transport services and con-sumer goods. Therefore, service providersshould give preference to modern, envi-ronmentally-friendly products and prefermodern technologies e. g. in communica-tion, lighting and building technology or intransportation in order to use resources ina more considered way. This includes aproper, comprehensive examination of theproducts used and the work processes inplace and, if necessary, also of locations.
Felix Schnella
The industries, which will of course be hitmost, are where increases in the prices ofraw materials, regulatory restrictions orchanges of the customer requirementshave a direct impact, e. g. in the areas ofenergy supply, the automotive industry,aviation and logistics but also consump-tion, tourism or the technology companieswhich work within these industries. Manycompanies have already carried out effec-tive adjustments, e. g. through continuousprocess improvements in their production.
Other companies profit directly from thepricing of CO2, such as financial instituteswhich are active in the emission trade orconsultancies which offer their servicesfor the necessary adjustments. Compa-nies which offer new technologies, e. g. forthe reduction of CO2 emissions, will alsobe measurably effected. The changing rel-ative prices will enforce adjustments with-in the companies concerned.
Michael Schneider
In principle, climate change concerns allindustries and companies. It is even pos-sible that operators of coal power stationswill receive so many CO2 certificates thatthey will be able to profit from the environ-mental trend in the short-run. This isalways dependent on regulations, quotas,(in)efficient markets and politics. In theaviation industry, the trend goes towardsnew and efficient airplanes although at thesame time, environmental surcharges leadto cost increases in that industry. Byfocussing on the critical utilization factor,every airline is in a position to increase
There are two basic challenges. Fossilfuels are scarce and tend to become moreexpensive; at the same time, the process-ing of fossil material to generate energycauses more emissions e. g. of CO2, nitro-gen oxides, methane, which contribute toclimate change. The top management ofDeka Investment includes questions aboutclimate change into its asset allocationconsiderations.
Michael Schneider
In how far climate change will effect cor-porate strategies depends on many fac-tors. These include the regulatory environ-ment, laws and quotas of local industrialpolicy, political declarations of intent, sub-sidies, consumer behaviour, costs of rawmaterials/input and also public debates.
Moreover, climate change should not beregarded as an isolated phenomenon.
271334_CDP_Rep_2007_engl_f:CDP_Bericht_2007 22.10.2007 10:34 Uhr Seite 22

Climate change – a capital market perspective
Carbon Disclosure Project 2007 23
Question: The implications of climate change are most visible in the automotiveindustry: the largest part of emissions is caused by using the products. Neverthe-less, CO2 is also relevant in product development and production. Which competi-tive advantages or risks as a consequence of climate change do you especially notewithin the automotive sector, with a view to processes and products?
Dr. Thomas Deser
Possible competitive advantages or risksof climate change with a view to process-es are the following:
• The pressure for ever more efficiency inproduction through mechanization (i. e. aconstantly high demand for investments)in order to reduce CO2 emissions, aswell as – especially concerning Germanlocations – to counteract the high wagelevel and the foreseeable demographicproblems.
Possible competitive advantages or risksof climate change regarding products:
• Among others, the urge to develop alter-native drive concepts with at least thesame or a better cost-benefit ratio com-pared to the established drive concepts.
• The urge to develop alternative driveconcepts which are especially suitablefor local and regional use as the moredynamic markets (China, Russia) have acomparatively poor traffic infrastructure.
Nicolas Huber
The recent success of Toyota shows howmuch an understanding of climaticchange can determine corporate develop-ment. Even in the USA, consumers prefera climatically neutral (environmentallyfriendly) product because, amongst otherreasons, the petrol/gas prices have sky-rocketed. Companies also emphasise theuse of environmentally-friendly materialsin their publicity. Automotive suppliers,e. g. Georg Fischer, are also very success-ful with their clear focus on climatically-neutral processes and products.
Felix Adrian
The car manufacturers are very muchfocussed on development and productioncosts so as to be able to offer competitiveprices for their products. Innovations inthe area of environmental aspects are stillplaying a minor role as factors of competi-tiveness compared to the classic technicalproduct features and alleged consumerrequirements.
European countries are more consistentand faster in the implementation thanmany other countries. This, however,means first of all higher research anddevelopment expenses and additionalrisks arising from the question as to whichtechnologies and fuels will finally beaccepted by the market e. g. hydrogen,hybrids, fuel cell or new Diesel technolo-gies. Cost and competitive risks go alongwith this, e. g. when compared to importsfrom other locations with a lower cost bur-den such as Asia. Due to product mix, thecost reduction effects which depend onthe number of units are still too weak; as aconsequence, complicated and expensiveproduction procedures still affect thecompetitive position.
The European standards are creatingmore uniform market conditions in so faras the suppliers are only allowed to offervehicles which correspond to the stan-dard. To give you an example: the addi-tional production costs for engines whichwill correspond to the European standardno. 5 , applicable for all new vehicles from2010 onwards, will be seven times higherfor Diesel engines (ca. 380 Euro) com-pared to Petrol engines (ca. 50 Euro)according to an estimate by the EU com-mission.
sales and earnings. On the other hand,higher transportation costs as a conse-quence of more expensive and more envi-ronmentally-friendly technology may affectdemand, sales and earnings. In the auto-motive industry, too, new chances willarise from fuel savings and new technolo-gies. Thus the pressure will increase in anindustry which already suffers from lowmargins. There is, however, potential for
suppliers with solutions for efficient drivetechnologies and exhaust filter technolo-gy. The demand for new apartments andhouses with low energy consumption andheat efficiency is on the rise. Moreover,old buildings are being renovated. Thedisadvantage in this field are the increas-ing costs, which will have a negative influ-ence on the entire property market.
271334_CDP_Rep_2007_engl_f:CDP_Bericht_2007 22.10.2007 10:34 Uhr Seite 23

24 Carbon Disclosure Project 2007
Climate change – a capital market perspective
Felix Schnella
The CDP offers investors a good possibili-ty to receive specific information from thecompanies about this important topic. Itis, important for asset managers to knowthat the number of companies whichactively participate in the CDP is continu-ously increasing. Just as important, how-ever, is the better quality of the answersas it is only in this way that the quality ofthe sector-specific reports can beimproved.
Dr. Thomas Deser
We expect additional and in particularproactive statements by the companiesconcerning their individual corporate risksarising from the effects of climate changeas well as their respective compensatingmeasures.
Competitive advantages may arise in themedium- and long term from researchsuperiority. Protected technical develop-ments, patents and know-how in theapplication and production of new, alter-native drive technologies are an advan-tage for experience and cost curves whichthen have a positive effect on exportswhen climate problems become more andmore urgent and political change process-es in other regions accelerate. If con-sumers’ awareness changes even faster,the advantages will also materialize muchfaster. Only then will the producers beable to pass on adequate, higher pricesfor their end products.
Should this, however, not happen, majorprofitability risks will arise especially forthe volume producers with their low mar-gins. According to estimates of industryanalysts, the additional costs for CO2
reduction and the implementation of theEuropean standard no. 5, will amount tomore than 800 Euro per vehicle for theproducers of mass volumes (e. g. PSA,Renault, VW, FIAT); this amount exceeds
by far both the estimates of the EU com-mission and the estimated margins of theproducers.
Felix Schnella
The fact that CO2 is more and moreincluded in the fuel price and the changingsense of responsibility of the populationregarding their own CO2 emission leads toincreased sensitizing of the consumersconcerning the pollution level of vehicles.Those car manufacturers which succeedin developing clean and, at the same time,attractive vehicles, will certainly be able togain market advantage. Besides all techni-cal and supply problems which still existtoday in the development of vehicles, thequestion of fuel supply and availability(e. g. hydrogen, natural gas, storage ofelectric energy, etc.), as well as the envi-ronmental compatibility (e. g. bio-fuel andtheir own CO2 emissions as well as theeffects on food production and agricul-ture, etc.), will also play an important rolein the meantime.
Question: The CDP intends to meet the demand for information that up to now hasnot been provided. In your opinion, is the present information sufficient to meetyour needs, or, which additional information from the companies would you expectin the future?
271334_CDP_Rep_2007_engl_f:CDP_Bericht_2007 22.10.2007 10:34 Uhr Seite 24

25Carbon Disclosure Project 2007
Climate change – a capital market perspective
271334_CDP_Rep_2007_engl_f:CDP_Bericht_2007 22.10.2007 10:34 Uhr Seite 25

3 This current report is the second CarbonDisclosure Report looking at the carbon
performance of German Companies. In theirresponses to the information request the 200largest German companies by market capitalisa-tion disclose which risks and opportunities theyidentify and which corporate strategies they areapplying or developing to meet the challengesposed by climate change.
271334_CDP_Rep_2007_engl_f:CDP_Bericht_2007 22.10.2007 10:34 Uhr Seite 26

Analysis of the answersof German companies in the CDP5Introduction: Developments around “Climate Change” from 2006 to 2007, by Matthias Kopp, WWF
Further the report analyses the answerswith a view on how these companies con-trol their own carbon emissions. Thisinformation request was sent to andanswered by the companies at a time ofsignificant developments in the field of cli-mate change – the reader of the reportshould bear in mind this context whendrawing conclusions from the followingchapters of analysis. Some of the changesto the competitive environment areaddressed in more detail in the few follow-ing paragraphs.
The past twelve months saw some funda-mental changes in the public perceptionof climate change as well as the quality ofthe public debate on climate change. Alsothe political approach to climate changedid shift substantially. These develop-ments could mean possible or probablechanges in the competitive environmentfor German companies. The resulting risksand opportunities for investors and otherfinancial market actors should be identi-fied and looked at very carefully.
Implications of climate change forcompetitive environments
Since the publication of the first GermanCDP report twelve months ago, thedebate and discussion on climate changein Germany has fundamentally changed.From being a niche issue that was dis-cussed within politics and the publicdomain but not seen as particularly rele-vant, climate change has taken centrestage in domestic and international poli-tics. At the same time, carbon emissionshave become increasingly relevant to thecorporate world, as is shown by someillustrative tendencies in the table below.
This development was triggered and sup-ported most of all by the publication of the“Stern Review” and the fourth assessment
report of the Intergovernmental Panel onClimate Change (IPCC). Nicolas Stern,former chief economist of the World Bank,oversaw a project, comissioned by the UKGovernment (The Stern Review) theobjective of which was to look into theeconomics and costs of damages fromclimate change compared to costs arisingfrom preemptive measures of an abate-ment strategy for climate change. TheIPCC’s fourth assessment report sum-marised the current status of the scientificknowledge about climate change (the sci-entific basis, options for mitigation andadaptation, and impacts). These andsome other developments over the previ-ous year are demonstrated in table 1below.
The Stern review concentrated on theeconomics of climate change and con-cluded in saying that:
• Climate change is foremost an econom-ic issue.
• It is an externality, but as such hasunique characteristics:
- It is global in nature as well as in causeand effect.
- It is long-term and possibly permanent,which therefore poses structural ques-tions that must be answered.
- It is fundamental in scale and scope ofits uncertainties, implications and risks.
Stern identified climate change and thefact that market forces are not respondingin such a way as to prevent it becomingthe biggest market failure ever seen. Theanalysis in the report endeavors to quanti-fy and compare the costs of inaction pre-sented by the damages caused by climatechange-related events with the costsrequired for acting preemptively. Despite
27Carbon Disclosure Project 2007
Analysis of the answers of German companies in the CDP5
271334_CDP_Rep_2007_engl_f:CDP_Bericht_2007 22.10.2007 10:34 Uhr Seite 27

Analysis of the answers of German companies in the CDP5
Carbon Disclosure Project 200728
amongst the scientific community callingfor quick, comprehensive and decisiveaction against a further acceleration andto keep global waming well below a 2 °Cincrease as compared to pre-industriallevels within the 20th century. By achiev-ing a “below 2 °C increase”, there is a sig-nificant chance that both dramatic lossesin eco-regions and dangerous conse-quences for human livelihoods can beavoided. This requires global CO2 emis-sion trends to peak by 2020 with a strictand consistent reduction following on tohalve global emissions by 2050, as com-pared to 1990 levels. These factualrequirements make it quite obvious to cor-porations as well as to investors that as aresult, regulatory frameworks and hencecompetitive environments in almost anysector will clearly need to change mas-sively, if preventing dangerous climatechange is to be taken seriously.
The following table indicates examples oftrends observed since the latest CDP Ger-many report was presented twelve monthsago. The illustration aims to demonstratechanging environments and dynamics andtries to idenitfy potential consequences (itis not meant to be exhaustive and errorsin the translated quotes are solely theresponsibility of the author).
all existing and remaining uncertainties theconclusion presented in the report is aclear economic rationale to reduce CO2
emissions based on available and existingtechnologies and processes. Undertakingpre-emptive measures today results inlower costs and is hence the only eco-nomically rational choice
Consequently, if designed and implement-ed strictly and robustly, action driven bythe objective to mitigate dangerous cli-mate change can fundamentally alter thecompetitive environments for many sec-tors. This would require different regulato-ry instruments, carefully chosen accordingto the application or sector. The funda-mental concept of a carbon market, i.e.caps on emissions and tradable emissionrights, is however expected to have a veryimportant role to play and is projected tosee a wide application base in manyabatement strategies. Creating a consis-tent and meaningful price signal on CO2
will depend on the political will to createefficient and effective markets, but policydecisions will also, vice versa, be impact-ed by market results.
The IPCC’s forth assessment report pub-lished earlier this year detailed globalempirical observations as well as model-ling results on the current acceleration ofclimate change. There is broad consensus
Developments over latest 12 months
Resulting in Potential consequences
Intergovernmental Panel on Climate Change, 4. Assessmentreport
• Climate change is very likely caused by anthropogeniceffects, i. e. man made with >90 % probability
• The already embedded, unpreventable temperatureincrease in the system lies at around 1,4 °C until 2100 (wealready observe 0,7 °C today)
• Beyond 2 °C significant and irreversible losses in eco-regions and danger of negative feedback-loops
• Sea-level rise of about 50 cm likely by 2100
• Global growth trends for CO2 emissions need to peak by2020 and be reversed to half of 1990 levels with industri-alised countries achieving minus 80 %
• There is a de facto conflict between current growth trendsin carbon emissions globally and EU (the EU is +11 %compared to 1999) and the mounting urgency to bringabout the peaking of global emissons followed by reduc-tions; the window of opportunity until 2020 is rapidly closing
• Regulation on emissons growth will need to become sub-stantially stricter and extended to other sectors andgeogaphies
Stern Review October 2006 • Climate change is the biggest market failure ever seen;damage costs are not internalised from the externality ofCO2 emissions in current markets
• It is quite obvious, that economic risks from doing nothingwhen facing climate change will be significantly high
• There is no longer any economic argument to prevent pre-emptive action; it is cost considerations and economicrational which argue in favour of precautions and climatechange mitigation
Economy
Table 1: Trend of climate change during the period 2006/2007
Science
271334_CDP_Rep_2007_engl_f:CDP_Bericht_2007 22.10.2007 10:34 Uhr Seite 28

Analysis of the answers of German companies in the CDP5
Carbon Disclosure Project 2007 29
Developments over latest 12 months
Resulting in Potential consequences
Stern Review October 2006 • Investments, taken over the coming 10-20 years couldlock us in to very high emissions trajectories over the next50 years (…) or they could put the world on to a moresustainable path
• Markets for less carbon intensive products will grow to asize of at least 500 bln. US Dollar/a by 2020
• For the individual company, implementing carbon guide-lines could help reap financial benefits and savings
• Costs for stabilising global emissions at 500-550 ppmCO2e by 2050 are estimated to lie around 1% of globalGDP, whereas the costs of inaction in a BAU [business asusual] scenario will reduce globale welfare by a reductionof per capita consumption equivalent to 5-20 %
G8 Process • Agreement that the UN should co-ordinate political actionto regulate CO2 emissions
• The institutional basis for the Kyoto rules is therebystrengthened, and the probability of an agreementimproved
Continuation Table 1: Trend of climate change during the period 2006/2007
European Regulation for car emis-sions announced
• Europes car industry fails to meet its own reduction targets
• Political Regulation announced to be enacted by car manufacturers before 2012
• Engine emissions become a crucial factor for sales ofcars – i. e.: a formerly neglected ecological factorbecomes more and more central for strategic success
• The industry dynamics change considerably with CO2
becoming strategic focus. German producers, who untilrecently rejected hybrid engines, already feel pressuredinto developing their own models
• If sectors fail to act by themselves, government regulationon CO2 emissions is likely to be enforced
European emissions trading rulespassed for Phase II in 2008-12across large parts of Europe
• Most of the submitted national allocation plans wererejected, tightended by the EU commission and sent backto the member states governments
• EU Comissions significantly reduced the submittednational caps, e. g. Germany down to 453 mio t/a
• Special provisions, widely applied by member states inphase one, were cut back. Some very problematic ones(from a CO2 reduction integrity perspective) like bench-marking could not be changed
• Introduction of auctioning of certificates, Germany around9 % out of a max. allowed of 10 %
• Political announcements on target setting on reductiontargets, UK/France around 60 % by 2050, Germany minus40 % bis 2020
• Example – according to its own calculations, RWE willneed to spend around 1 bln. Euro at prices of 20 Euro/tgiven current rules in EU ETS, and its current fuel invest-ment startegies. The economic base for CO2-intensiveindustrial production or energy production will changewith a changing price for CO2
• Energy-generation-mix will change if there is a meaningfulCO2 price signal
• Long-term political frameworks are oriented increasinglytowards a focus on reduction levels of 80 % by 2050.Corporate and investment strategies will have to reflectthese changed dynamics
Climate and energy programme inGermany, Climate Bill in the UKand the Netherlands
• The incentive structures change towards less CO2-inten-sive buildings, transportation, energy-comsumptions andsupply, etc.
• CO2 could become a driving force for corporate profit ifframeworks are implemented which reward less CO2-intensive products and processes
• Clients and customers’ perception could change towardsgrowing awareness of CO2; more fundamental competi-tive dynamics could shift.
Emissions reduction-goals agreedfor at least –20 % by 2020 forEurope unilaterally, –30 % comitt-ment is given for bilateral activities
• EU-committment on a unilateral reduction of 20 % by2020
• Implementation is leading to a binding and increasedmarket share for renewable energies across Europe by2020, similarly ambious improvements in energy efficien-cy, etc. planned
• Follow-on effects for electricity mix, for grid and powergeneration structures, which can potentially trigger newdynamics as fossil fuel based power stations will facealtered economics with a resulting shift in the merit order,i. e. annual utilisation rates might fall below the profitabiitythreshold
Politics Europe
Continuation Economy
271334_CDP_Rep_2007_engl_f:CDP_Bericht_2007 22.10.2007 10:34 Uhr Seite 29

Analysis of the answers of German companies in the CDP5
Carbon Disclosure Project 200730
Developments over latest 12 months
Resulting in Potential consequences
USA – regional cap & trade emis-sion trading systems agreed orannounced
• The Regional Greenhouse Gas Initiative (RGGI) in theNorth-East USA, will start in 2009, with about 7-11 statesjoining
• Other initiatives on cap&trade systems, e. g. in California
• Development of linked and working global carbon mar-kets appear possible in the near term future, which couldresult in a consistent and meaningful price signal for CO2
Carbon labelling on consumergoods
• The UK has the first CO2 labelling scheme in a pilot phaseon a small sample of fast moving consumer goods – CO2
content of production and disposal as a piece of productinformation
• CO2 content could become a differentiating factor forproducts and hence relevant for the entire supply chain
• CO2 data availability needs to be improved
Continuation Table 1: Trend of climate change during the period 2006/2007
Corporations and initiatives • 2007 saw several initiatives against climate change, Ger-many saw the „Initiative 2 Grad“, in Europe the „EuropeanLeaders Group on CC“, in the US „Roundtable on ClimateChange“ advocating clear frameworks on emissionsreduction regulation, all in reference with the IPCC
• Climate indices are being created and a first climateawareness bond of the EIB (European Investment Bank), etc.
• Climate change regulation requires longterm certainty forbusinesses as it is fundamentally a politically createdmarket
• Accepting the 2 °C threshold as an upper limit translatesinto significant reduction obligations for CO2 emissions,which in turn will have fundamentally changing effects oncorporate business models in most sectors
CO2 neutralisation services and cli-mate change in financial productsto invest in
• CO2 offsetting became a widely emerging businessmodel, in large part with a lack of transparency as towhere the projects take place, and often with a totallyunclear credit quality as to their value from a sustainabilityor climate change related robustness perspective
• Mutual funds and other retail products are being offeredthat sell climate change related products
• Companies emissions become more and more relevant asa differentiating factor
• As there is a clear lack of standards for generated creditsin the voluntary carbon markets, clients and buyers arefaced with a lack of transparency
• Increasing engagement of capital market companies
Financial analysts increasinglyaddress climate change in specialresearch reports
• Increasing numbers of broker reports which solely focuson implications from climate change
• Winners and loosers identified and individually analysed(sector and company basis)
• Business models are facing fundamental changes
• Capital allocation will eventually be oriented on CO2
• Company wide CO2-data-quality and availability is growing
Climate change related invest-ments
• Banks announce investments triggered by discussions(e. g. Bank of America 20 bln. US Dollar. Citigroup 50 bln.US Dollar, HSBC et al.), with very little transparency as tothe actual activities
• Climate change represents chances and opportunities
Investors • UN Principles of Responsible Investment released
• Institutional Investors Group on Climate Changeannounced declaration to invest responsibly with regardsto climate change
• Investors need to look at the carbon footprint and profileas a criterion when making investments
CO2 reporting initiatives • Carbon Disclosure Standards Board, (CDSB), announce-ment of a technical report on the status quo that com-bines external financial reporting and CO2 reporting, mini-mum goal to develop a standard for CO2 reporting
• Regular CO2 data availability is required when integratingcarbon into regular financial reporting
Reporting
Carbon markets
USA – Regulation of CO2 as a “Pollutant” required by the Envi-ronmental Protection Agency
• The EPA is now required to regulate CO2, as CO2 wascharacterised as a pollutant, this having been long disput-ed by opponents
• Likelyhood of a widespread CO2 regulation is rising
• New dynamics in the discussions on global CO2 regula-tion regimes
Politics USA
Emissions reduction-goals agreed • Valuation principles for capital intensive, longterm invest-ments will change
Continuation Politics Europe
271334_CDP_Rep_2007_engl_f:CDP_Bericht_2007 22.10.2007 10:34 Uhr Seite 30

Analysis of the answers of German companies in the CDP5
Carbon Disclosure Project 2007 31
“Climate risk map”
Climate change exerts a variety ofimpacts on the macro-economic environ-ment of industries. It therefore has a sig-nificant impact on existing risks, and viceversa. The extent to which German com-panies are prepared for and aware of cli-mate change will be analysed in thisreport. In general, companies will be facedwith direct impacts from climate change,but also with indirect risks which arguablywill have bigger impacts. The totality ofrisks from climate change can be illustrat-ed by ways of a risk map.
Such a risk map needs to be looked on aby-company basis, it is not identicalacross sectors; it might even differ forcompanies within a given sector. Accord-ingly, it is important from the individualcompany perspective to understand rele-vance, importance, urgency, scale andscope of the risks the company mightface as well as of the sources where the
risks arise from. Existing risk managementor general management systems need tobe adjusted to cater also for the new orhitherto neglected risks from carbon. On atop-mangement level this is all the moreimportant for drawing up a robust strate-gy. Which risks are valid and how theyarise from climate change will have animpact on the company’s process of
determining strategy. On the other hand,the strategy itself is partially responsiblefor how companies are affected as itdetermines the agility, flexibility and vul-nerability with which the company can actor react.
The risks from climate change can beclassified, as shown above, as direct orindirect. The CDP has further divided theindirect risks into two sub-catagories:those due to regulation and all others (seebelow).
Direct risks
Direct Risks arise immediately from cli-mate change-related events, for instancevia more frequent and more intensiveextreme weather events such as floodsand draughts (also refered to as physicalrisks). The continuously changing trendsin weather patterns and global warming,which alter the potentials for agriculturalproduction and procedures, or reductions
in power plant capacity via reduced cool-ing potential from warmed-up river water,are further examples for risk arising direct-ly from the changing climate, as are fallingriver levels in limiting transportationpotentials, tourist destinations loosingattractiveness caused by too high temper-atures or suffering from desertification,etc. – all of which has its root cause in the
Figure 2: Direct and indirect risks
Direct risks Indirect risks
Regulatoryrisks
Other risks
Litigation risk
Physical risks –extreme
weather events
Weather patternchanges
Sector/Corporate
Market price risk Repu tation
riskOpera-
tional risk
Credit risk
Regula toryrisk
271334_CDP_Rep_2007_engl_f:CDP_Bericht_2007 22.10.2007 10:34 Uhr Seite 31

Carbon Disclosure Project 200732
fundamental changes in weather paternscaused by climate change.
Indirect risks
Apart from the the direct risks of climatechange, it also has an impact on all otherrisks already being considered as part ofrisk management:
Regulatory risks:
Regulatory risks: changes in the regulato-ry environment, political and legal require-ments, e. g. the regulation on CO2 emis-sion allowances, or on products and pro-duction processes.
Litigation risk: the risk arising from legalaction against polluters may becomemuch more relevant in the future; currentlythis risk also depends on the jurisdictionone is subject to.
Other risks:
Market price risks: demand and supply forproducts and fuels determine the prices –as a result of regulation; CO2 now has itsown price, hence it entails a risk, but thisprice will partially be passed throughwhere possible; increased volatility isanother example of market price relatedrisks.
Operational risk: risks within the opera-tions, e. g. HR, processes and procedures,will increase if climate change is not prop-erly reflected.
Credit risk: asset managers, banks, ratingagencies increasingly recognise that cli-mate change is a factor that has animpact on a lot of other areas, and there-fore it has a potential impact to the com-ponents looked at when deriving the con-ventional counterparty credit risk.
Analysis of the answers of German companies in the CDP5
Figure 3: Climate-related risks in the market environment
Source: Own illustration, after a Thommen/Achleitner 2003, p. 40
Litigation risks
Regula tionrisks
Litigation risks
Regula tionrisks
Credit risks
Litigation risks
Regula tionrisks
Litigation risks
Regula tionrisks
Physical risks
Weather patternchange
Physical risks
Weather patternchange
Physical risks
Weather patternchange
Credit risks
Operationalrisks
Reputation risks
Market price risks
Operational risks
Reputation r.
Credit r.
Market price risks
Operational risks
Reputation r.
Credit r.
Procurement
Procurement/supply market
Lab
our
mar
ket
Cred
it and cap
ital market
Marketplace
Production process and economic value addedcompany internal
Expenses
Sales Revenue
271334_CDP_Rep_2007_engl_f:CDP_Bericht_2007 22.10.2007 10:34 Uhr Seite 32

33Carbon Disclosure Project 2007
Analysis of the answers of German companies in the CDP5
develop an educated understanding of thechanging conditions in order to be able toact or react with adapted strategies ininvestments or general corporate strate-gies. The risk represented by climatechange needs to be reflected in prices,costs and conditions.
Whether or not these risks are adequatelycaptured, quantified and measured withinthe scope of existing risk managementregulation, such as KonTraG2 in Germany,Basle II or Solvency II and how this is tobe done, is not the subject of this report.Nevertheless, given the potentially highrisks that companies are presented withby the impacts of climate change this isan open question deserving further con-sideration at another opportunity.
Reputational risk: ignoring climate changemay have detrimental effects on a compa-ny’s reputation or its products, e.g. ascould have actively denying climatechange etc.
This theoretical discussion of risks canalso be mapped onto the generic under-standing of the market environment and isillustrated below.
Examples of potential competitivenesseffects of climate change-related risks(direct/indirect) for different sectors:
Climate change and its impacts can tosome degree have implications for thecompetitive environment of almost anysector as illustrated in table 2 below. Corporations and their investors need to
Sector Potential effects
Transport & Logistics
Tourism
Financial sector
(Health-)Insurance
Forestry/Agriculture
Chemical industry
Services
Electric utilities
Telecommunication/IT/Communication
Most likely emissions from air and ground transport will be regulated and priced. Costs will increase and the cost structureof this industry will be negatively impacted.
Flights and airlines in general will also be subject to limitations as emissions from flights will be priced; with only very limit-ed technological emissions reduction potential to date, airlines might as well be subject to restrictions on flights; as cost-pass- through will harm some segments of the customer base more than others this might mainly jeopardise low cost carri-ers; flights in Europe will be subject to emissions trading from 2011 onwards.
Measurement, analysis and management of CO2 related risks of counterparties as well as the integration of climate changerelated aspects into risk management systems, investment processes, risk models, valuation processes, etc. will berequired. Changes in all climate change related risks to own operations, but even more so to investments and productsmust be captured and reflected in risk adjusted loans, credits, valuation etc.
Increasing expenses for health care from heat stress (the 2003 heat wave caused 30.000 premature death in France, 7000in Germany); increasing frequency and strength of extreme events like winter storms, improved living conditions for vectorsand desease-transporting insects result from increased temperature; the tendency for an accumulation of economic assetsin areas most exposed to climate change related impacts (i. e. particularly coastal areas) is adding to potential impacts forinsurance companies.
More frequent and stronger extreme weather events, as well as the fundamental impacts of altered weather patterns havean impact on yield levels and can cause increased levels of pests and changes to harvesting periods.
Currently, chemical industry is not directly subject to CO2 regulation, but indirectly via the EU ETS, and electricity prices; itis however one of the prime candidates to consider when regulation on CO2 is extended. On the other hand its productsprovide ample opportunities for increasing energy efficiency, i. e. insulationmaterials etc., which are business opportunities.
“Travel expenses” make up a substantial part of the cost structure, which will increase with more comprehensive CO2 regu-lation. Extreme weather events might result in different consumption patterns, hence business models might become obso-lete (skiing in the Alpes); new services, like energy efficiency consulting, contracting etc, offer opportunities.
The main sector responsible for CO2 emissions, very capital intensive, longterm investments – already subject to emissionscaps and at the focus of future regulation and emissions restrictions; current economics of investments may be substantial-ly altered by forseeable regulation, e. g. planned 20 % market share of renewables by 2020.
Energy intensive grid- and network structures, data centres etc., can be subject to rising energy costs and weather events;economics of big car fleets in operation might suffer from regulation on ground transport; opportunities exist in servicesinformation and communication technology can offer to avoid unnecessary business travel etc.
Table 2: Impact of climate change on the competitive environment
2 Gesetz zur Kontrolle und Transparenz im Unternehmensbereich
271334_CDP_Rep_2007_engl_f:CDP_Bericht_2007 22.10.2007 10:34 Uhr Seite 33
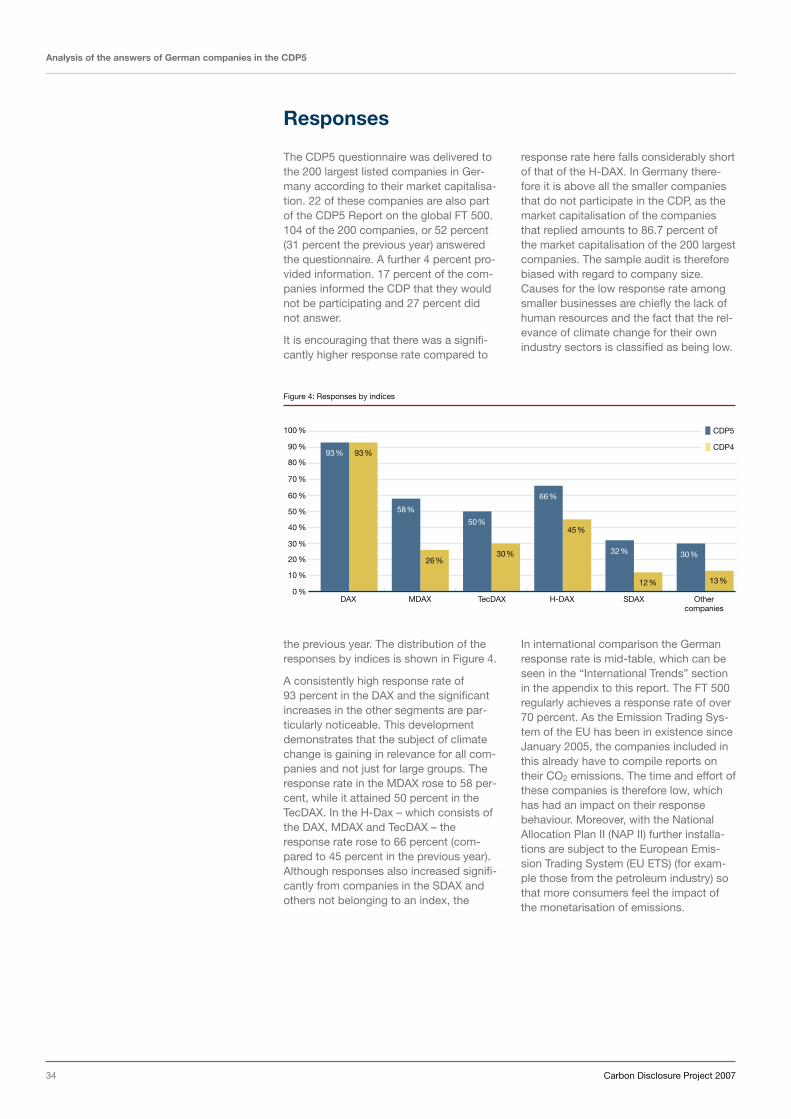
Responses
The CDP5 questionnaire was delivered tothe 200 largest listed companies in Ger-many according to their market capitalisa-tion. 22 of these companies are also partof the CDP5 Report on the global FT 500.104 of the 200 companies, or 52 percent(31 percent the previous year) answeredthe questionnaire. A further 4 percent pro-vided information. 17 percent of the com-panies informed the CDP that they wouldnot be participating and 27 percent didnot answer.
It is encouraging that there was a signifi-cantly higher response rate compared to
the previous year. The distribution of theresponses by indices is shown in Figure 4.
A consistently high response rate of93 percent in the DAX and the significantincreases in the other segments are par-ticularly noticeable. This developmentdemonstrates that the subject of climatechange is gaining in relevance for all com-panies and not just for large groups. Theresponse rate in the MDAX rose to 58 per-cent, while it attained 50 percent in theTecDAX. In the H-Dax – which consists ofthe DAX, MDAX and TecDAX – theresponse rate rose to 66 percent (com-pared to 45 percent in the previous year).Although responses also increased signifi-cantly from companies in the SDAX andothers not belonging to an index, the
response rate here falls considerably shortof that of the H-DAX. In Germany there-fore it is above all the smaller companiesthat do not participate in the CDP, as themarket capitalisation of the companiesthat replied amounts to 86.7 percent ofthe market capitalisation of the 200 largestcompanies. The sample audit is thereforebiased with regard to company size.Causes for the low response rate amongsmaller businesses are chiefly the lack ofhuman resources and the fact that the rel-evance of climate change for their ownindustry sectors is classified as being low.
In international comparison the Germanresponse rate is mid-table, which can beseen in the “International Trends” sectionin the appendix to this report. The FT 500regularly achieves a response rate of over70 percent. As the Emission Trading Sys-tem of the EU has been in existence sinceJanuary 2005, the companies included inthis already have to compile reports ontheir CO2 emissions. The time and effort ofthese companies is therefore low, whichhas had an impact on their responsebehaviour. Moreover, with the NationalAllocation Plan II (NAP II) further installa-tions are subject to the European Emis-sion Trading System (EU ETS) (for exam-ple those from the petroleum industry) sothat more consumers feel the impact ofthe monetarisation of emissions.
Figure 4: Responses by indices
34 Carbon Disclosure Project 2007
Analysis of the answers of German companies in the CDP5
100 %
90 %
80 %
70 %
60 %
50 %
40 %
30 %
20 %
10 %
0 %DAX MDAX TecDAX H-DAX SDAX Other
companies
� CDP5
� CDP493% 93%
58%
26%
50%
30%
66%
45%
32%
12%
30%
13%
271334_CDP_Rep_2007_engl_f:CDP_Bericht_2007 22.10.2007 10:34 Uhr Seite 34

Figure 5: Climate risks: Response rate in Germany (CDP5)
� Questionnaire answered 52 %
� No response 27%
� Participation declined17 %
� Provided information4%
3 The supporting investors (signatories) of CDP5 have access to all the information and answers provided bythe companies via a database.
Transparency
The participating companies were able todecide whether their submitted informa-tion was published in this report and onthe CDP website www.cdproject.net.59 percent gave permission for theiranswers to be accessible to the public3.Publication of this information improvestransparency of climate risks and opportu-nities for companies and removes theinformation asymmetry. The increasingwillingness to publicise also shows that
the professionalism of companies inreporting emissions in the second year ofCDP in Germany has increased. Severalcompanies have not participated this year,as their emissions data was not availablein a form that could be externally commu-nicated. The higher response rate showsthat a process of adaptation is takingplace and therefore another increasedresponse rate is anticipated for the nextyear.
Methodology
The questionnaire is separated into twoparts. Part A is relevant for all companiesand covers risks and opportunities arisingfrom climate change as well as the strate-gies of companies on how it will or shouldbe reacted to. In addition it was askedwhether and, if necessary, which targetsexist with regard to the reduction ofgreenhouse gas emissions. Moreover,questions were set on the methods ofrecording emissions as well as on theextent, types and distribution of specificCO2 emissions. Overall Part A consists of15 questions.
Part B of the questionnaire is relevant tocompanies that are subject to the GermanGreenhouse Gas Emission Trading Law(TEHG) and industry sectors particularlyaffected by it. Detailed data on emissionsby country and plant emitting are request-ed here as well as the impact of the EUETS on profitability. In the section ongreenhouse gas (GHG) managementquestions were asked about programmesfor cutting down GHG emissions, thestrategy of emission trading, the industry-specific extent of emission measurement,energy costs and the provision for emis-sion costs in planning. It was finallyenquired as to who on the ExecutiveBoard was responsible for questions ofclimate change.
The evaluation that follows takes the formof both general and industry-specificanalyses. Despite the high response rate
from a total of 104 companies, the data isnot always sufficient to derive reliableindustry-specific statements from. Inthese cases only the overall results arediscussed.
For the industry-specific evaluation theadditional problem of differentiation arose:A very precise differentiation has theadvantage of increasing the comparabilityof companies within an industry. The sam-ple size is then however mostly too smalland therefore industries have to be sum-marised. Furthermore companies are onthe one hand affected through direct(Scope 1) or indirect emissions (Scope 2and 3). On the other hand there are anumber of companies that only indicatelow emissions in the value chain, butwhose products however can contributesignificantly to emissions (for exampleautomotive manufacturers) or can containclimate risks (for example insurance com-panies, the asset management of banks).However, these risks cannot be includedin the business-specific GHG emissions.For this reason the analysis has beenbased upon the following industry classifi-cation, the number of companies in eachone is given in brackets
• Automobile (8)
• Chemical/Pharmaceutical (13)
• Energy suppliers (6)
• Financial service providers (16)
35Carbon Disclosure Project 2007
Analysis of the answers of German companies in the CDP5
271334_CDP_Rep_2007_engl_f:CDP_Bericht_2007 22.10.2007 10:34 Uhr Seite 35

Company-specific risks and opportunities of climate change
What commercial risks does climatechange present to your companyincluding, but not limited to, those list-ed below? Regulatory risks associatedwith current and/or expected govern-ment policy on climate change e. g.emissions limits or energy efficiencystandards. Physical risks to your busi-ness operations from scenarios identi-fied by the Intergovernmental Panel onClimate Change or other expert bodies,such as sea level rise, extreme weatherevents and resource shortages. Otherrisks including shifts in consumer atti-tude and demand. (Question 1a of the CDP5 questionnaire)
This year the companies were again askedfor their appraisals on the opportunitiesand risks regarding climate change. Thisdemonstrates that the perception of therisk has increased compared to the previ-ous year. However, the risk was often per-ceived as being latent and intangible.Although an effect on the company isexpected, it is not clear what form this willtake.
77 percent of the companies see climatechange as a risk factor. The perception ofthe form this risk will take is howeverextremely varied.
Only 23 percent see climate change hav-ing no influence on their own businessmodel. It is interesting, however, that sev-eral of these companies stated that theywere insured against weather damages.Thus there are companies in this groupwhich indeed hedge a risk, but do notregard it as a risk factor of climatechange.
In addition there is a group of companieswhich state that climate change has asmall and/or no company-specific charac-ter. In order to analyse this more precisely,the companies have provided informationon regulatory, physical and other risks.
Regulatory risk
70 percent of the companies see them-selves as being exposed to a regulatoryrisk, whereby 50 percent of the respon-dent companies gave detailed informationon the company-specific effect and a cor-responding 20 percent saw a more gener-al risk. In particularly affected industriesthis risk is perceived by some 87 percentof companies. An exception here arefinancial service providers, where only40 percent could identify regulatory risks.Indeed in the automotive industry 75 per-cent of businesses anticipated a regulato-ry risk. In view of the discussion on vehi-cle fleet emissions however this percent-age seems rather low.
The general regulatory risk is seen aboveall as an indirect price risk. This is foundedby the companies' fear of a furtherincrease in energy prices through regula-tions introduced within the scope of theEU ETS for example. It must however betaken into account that energy prices ori-ent themselves towards the marginalcosts (including emission rights) of the lastutilised power plant, so that the pricesfluctuate according to demand and theassociated marginal costs. The price ofCO2 is thus already included in today'selectricity prices. Another CO2 relatedprice rise on top of this cannot be legit-imised before 2012.
Figure 6: Climate change as a risk
� Risk 77 %
� No risk 23 %
Climate change creates significantcosts for the financial industry. Inthe interest of our clients andshareholders we are obligated totake these risks into account whenmaking decisions on insuranceunderwriting, investments or lend-ing credit.
Allianz SE
• Engineering (16)
• Raw materials, consumables and supplies (7)
• Transport/Logistics (4)
• Insurance (6)
• Non-intensive sectors (28)
The companies answer the questions intext form. In order to improve the compa-rability of the answers, these were evalu-ated in the same way as the FT 500Report based on the Climate Disclosure
Leadership Index (CDLI). The verbalanswers of companies were classified intothree groups for this purpose. The compa-nies on which climate change exerts partly“no influence” are assigned to the firstgroup. In the second group the influenceis rated as a “low and/or non-company-specific influence”, if for example conse-quences are seen for other industry sec-tors or regarded as carrying a small levelof risk. Companies of the third group areparticularly exposed to the risks andopportunities of climate change, whichexert a “high company-specific influence”.
36 Carbon Disclosure Project 2007
Analysis of the answers of German companies in the CDP5
271334_CDP_Rep_2007_engl_f:CDP_Bericht_2007 22.10.2007 10:34 Uhr Seite 36

Analysis of the answers of German companies in the CDP5
Carbon Disclosure Project 2007 37
increased transparency it would be ofgreat use to the companies if they quanti-fied the uninsured risks of climate changeor specified the costs through higherinsurance premiums. Information on thishas not yet been provided by the compa-nies however.
Other risks
50 percent of the companies see them-selves as being confronted with additionalrisks, which are primarily related to achange in consumer behaviour. 35 percenthave provided a very differentiated analy-sis here, while 15 percent assume someeffect in general. As regards content, acritical debate by consumers over issuesof climate protection is anticipated. This iscapable of having a direct impact on buy-ing behaviour regarding a particular prod-uct or indirectly on the reputation of acompany. As expected this perception ispredominantly shared by companies thatdeliver directly to the consumer.
Opportunities from climate change
What commercial opportunities doesclimate change present to your compa-ny for both existing and new productsand services? (Question 1b of CDP5 questionnaire)
For the first time in the CDP5 a questionon the issue of business opportunitiespresented by climate change appeared.
As is shown in table 4, 80 percent of thecompanies questioned recognize a busi-ness opportunity as a result of climatechange. A 58 percent majority see this
Physical risk
61 percent of companies see themselvesconfronted by a physical risk, of which17 percent only make a general assess-ment. 44 percent gave a highly varyingperception of this risk. Of this percentage21 percent feel directly threatened byextreme weather events, partly due to thepossible loss of use of production plants.At the same time the risk through stormsis seen as being greater in comparison torising sea levels or average temperatures.A further 23 percent fear shortages of rawmaterials. This demonstrates a higherawareness of the risks in comparison withthe previous year. As in 2006 only 14 per-cent anticipated a physical risk.
The physical risks are assessed as beingparticularly high in industries that areheavily dependent on weather conditions.These include transport/logistics, energyproviders (due to their cooling needs andoverhead power lines) and the automotiveindustry. An interesting factor is that thetransport/logistics and automotive indus-tries perceive the regulatory and physicalrisks very similarly. This is consistent, asboth are faced with similar risks, on theone hand directly through the use of andon the other through the manufacture ofproducts necessary for transport.
However, the companies principallyassume that these risks are coveredthrough insurance policies and thereforeexpect an increase in insurance premiumsrather than direct costs arising from aninterruption in the value chain. In terms of
Table 3: Appraisal of risks by industry
Sector Regulatory risk Physical risk Other risks
Automotive 75% 81% 69%
Chemical/Pharmaceutical 62% 65% 46%
Energy providers 83% 75% 50%
Financial services providers 41% 41% 34%
Engineering 63% 48% 44%
Raw material, consumables 93% 57% 50%
and supplies
Transport/Logistics 75% 88% 50%
Insurance 83% 42% 58%
Non-intensive 52% 50% 43%
60 % 80 %40 %20 %0 %
15 %35 %
44 % 21%
20 %50 %Regulatory risk
Physical risk
Other risks
� Important
� Less important
Figure 7: Perception of risk types
271334_CDP_Rep_2007_engl_f:CDP_Bericht_2007 22.10.2007 14:49 Uhr Seite 37

Table 4: Evaluation of opportunities by industry
Sector Opportunities Opportunity/risk coefficient
Automotive 100 % 1,1
Chemical/Pharmaceutical 81 % 1,0
Energy providers 92 % 1,1
Financial services providers 41 % 0,9
Engineering 85 % 1,5
Raw materials, consumables 86 % 1,5
and supplies
Transport/logistics 50 % 0,6
Insurance 58 % 1,0
Non-intensive 62 % 1,0
Figure 8: Climate change as an opportunity
� Numerous opportunities 58 %
� Individul opportunities22 %
� No opportunities 20 %
We are convinced that enterpriseswhich do not succeed in managingtheir CO2 emissions will thereforeface great problems in the future.However, the need to react tofuture challenges also presents uswith numerous opportunities forservices and products that can helpto increase efficient use ofresources and to reduce CO2 emis-sions in society and among ourcustomers.
Deutsche Telekom AG
out (33 percent). For 39 percent of thecompanies the opportunities outweigh therisks, of which 20 percent see a heavybias towards opportunities. These compa-nies belong above all to engineering andthe Raw materials, consumables and sup-plies sector. For 13 percent the opportuni-ties are not opposed by any risks at all.Only 8 percent see themselves as underrisk from climate change that would notbe (over) compensated by the opportuni-ties. These include primarily the trans-port/logistics and financial services sec-tors. Opportunities are perceived mainlyby the companies that produce substituteproducts for CO2-intensive goods or thatimprove energy efficiency. For instancealternative energies and their providerswould be included here and also parts ofthe chemical industry and automobilemanufacturers.
To conclude, the opportunities appear tobe perceived as being significantly higherthan the risks. However, this could also bedue to the full extent of the risks beingunknown to the companies.
opportunity as significant and therefore asan important part of their business devel-opment, while 22 percent at the very leastrecognise individual potential.
When analysing these results by industrythere appear to be opportunities particu-larly in the automotive, energy, engineer-ing, raw materials, consumables and sup-plies and chemical/pharmaceutical indus-tries. Opportunities are seen above all inthe manufacturing of products with lowenergy consumption.
The results in this context reveal a lotabout how the relationship betweenopportunity and risk is rated for the indi-vidual companies and industries. For thisan opportunity/risk coefficient was estab-lished. If this is above 1, the companyrates the opportunities arising from cli-mate change higher than the connectedrisks. For 53 percent of the companiesopportunities and risks hold equal weight.This means that either no opportunities orrisks were perceived (20 percent) or thatopportunities and risks were perceived asbeing present but cancelling each other
38 Carbon Disclosure Project 2007
Analysis of the answers of German companies in the CDP5
271334_CDP_Rep_2007_engl_f:CDP_Bericht_2007 22.10.2007 14:49 Uhr Seite 38

39Carbon Disclosure Project 2007
Analysis of the answers of German companies in the CDP5
RWE makes use of all measuresthat are economically viable andtechnologically sound. That is whyRWE has set up a climate protec-tion scheme that rests on four pil-lars: investments in efficient powerplants which make use of bestavailable technology; the zero emis-sions power plant (research anddevelopment); the development ofrenewables and the involvement ininternational climate protection pro-grammes based on ‘Joint Imple-mentation’ and ‘Clean Develop-ment Mechanism’, instruments pro-vided for in the Kyoto Protocol.
RWE AG
Reducing GHG emissions is to alarge part equivalent to increasingvehicle efficiency and saving ener-gy. With view to rising energy pricesfuel consumption becomes moreand more important in the cus-tomers’ purchase decisions. Ourengagement in reducing emissionsof our products therefore directlybecomes a sustainable competitiveadvantage. Against this back-ground, it is becoming increasinglyimportant for us to use new, partic-ularly renewable energy sources,develop efficient drive-trains andsupplement them with optimized,lighter-weight vehicle concepts.
Volkswagen AG
Strategy
prominence of the opportunities and risksare however only classified as low tomedium. Here it is not possible to identifya dominant industry. This is a commonstrategy in all industries, and thereforealso in those most affected, but above allin small businesses.
Strategy type 3 (17 percent): These com-panies mostly recognise only low risks oropportunities and are just beginning totake climate change into account in theirbusiness strategy. Such companies are onaverage roughly twice as large as thecompanies applying strategy types 1 and2 and belong predominantly to the engi-neering sector.
Strategy type 4 (40 percent): These com-panies see numerous opportunities andrisks and have a corresponding strategy.This most common strategy type is to befound chiefly in industries that are particu-larly affected and in big companies.
Strategy type 5 (10 percent): These com-panies have a strategy that is gearedeither to risks (3 percent) or to opportuni-ties alone (7 percent). No industry is domi-nant here, but this type generally includescompanies that are highly specialised intheir industry.
Please detail the objectives and targetsof the strategies you have undertakenor are planning to take to managethese risks and opportunities. Pleaseinclude adaptation to physical risks (Question 1c of the CDP5 questionaire)
The following will explore the ways inwhich the companies incorporate theopportunities and risks of climate changein their business strategy. 67 percent ofthe companies state that they incorporatethese opportunities and risks in their strat-egy. For 24 percent these only play aminor role, while 44 percent demonstratedthe integration of these into their strategyin some detail. Five different climate-rele-vant types can be identified:
Strategy type 1 (10 percent): These com-panies have no strategy, but also see nopossible opportunities or risks and there-fore no need for a strategy. Among theseare financial services providers and non-intensive industries. Measured by theirmarket capitalisation, the companies with-in these segments are rather small.
Strategy type 2 (22 percent): Althoughthese companies perceive opportunitiesor risks, climate change is not taken intoaccount in the business strategy. The
40%
22%17%
10%
10%
none
med
ium
high
none medium significant
Ris
k/o
pp
ort
unit
y
Strategy
Figure 9: Strategy types
� Type 1: No strategy, no risk/opportunity 10 %
� Type 2: No strategy,with risk/opportunity 22 %
� Type 3: Strategy approacheswith risk/opportunity 17 %
� Type 4: Strategy, with risk/opportunity 40 %
� Type 5: Strategy, with risk or opportunity 10 %
271334_CDP_Rep_2007_engl_f:CDP_Bericht_2007 22.10.2007 10:34 Uhr Seite 39

companies of types 2 and 3. To whatextent the given strategies are suitableand whether the perception of risks andopportunities is exhaustive and above allcorrect cannot be deduced from theanswers given. A stronger allowance forclimate risks in the management reportcould certainly contribute to a clearassessment of strategies and their imple-mentation from a capital market point ofview.
Targets for reducing emissions
What are your emissions reduction tar-gets and time frames to achieve them?What renewable energy and energy effi-ciency activities are you undertaking tomanage your emissions? (This questionnot required if answering Section B.) (Question 1d of the CDP5 questionnaire)
The basic willingness to reduce emissionsis reflected in the strategies chosen. Thetargets for reducing emissions represent aconcrete realization of this. A total of57 percent of the companies have issuedstatements regarding the future reductionof emissions. However 30 percent of com-panies have acted on this in detail byenvisaging programmes for the efficientuse of energy and switchover to renew-able energy. It was mainly quantified goals
and timelines for achieving the targets thatwere given here. 27 percent stated thatthey are at least aiming towards reducingemissions. The scope and time period forthis were however not specified, or atleast not externally communicated. Asexpected there is a high correlationbetween strategies and targets: 80 per-cent of companies that have an emissionsstrategy have defined emissions targetsand communicate these.
The differences arise above all throughregulation. 88 percent of companies thatare subject to the TEHG communicatetheir set emissions targets. Furthermore itis mainly automobile manufacturers thatmake their reduction goals public, theserelating to both manufacturing emissionsas well as product use.
Figure 10: Emissions targets
� Quantified reductiontargets 30 %
� General reduction tar-gets 27 %
� No reduction targets43 %
Overall this demonstrates that the majorityof the companies are at the very leastshowing the beginnings of incorporatingclimate change into strategy. Strategytype 4 reflects a coordinated strategy. Inall the other companies the question aris-es as to whether the opportunities andrisks have been understood to an extentthat would enable the development of acorresponding strategy. The adjustment ofstrategies seems particularly necessary in
40 Carbon Disclosure Project 2007
Analysis of the answers of German companies in the CDP5
GHG emissions reportingCurrent development concerning internal and external emissions reporting
for free and 9 percent by auction. Theseare currently all companies that operatecombustion plants that exceed a certainthermal performance. From 2011 airlineswill also belong to this group, as directedby the European Commission. Thesecompanies are legally obliged to submit areport within the scope of the TEHG,which is outlined in § 5. In addition emis-sion rights have to be disclosed in exter-nal accounting.
In order to determine emissions in exter-nal accounting it is first of all necessary todefine which parts of the company areincluded. According to the managementcontrol approach emissions from holdings
The CDP is closely involved in the cre-ation of global reporting standardsregarding climate change. These stan-dards are fundamental to investors asthey improve comparability. In order togive an overview of the current state ofthe discussion, the significance ofemissions reporting in external andinternal accounting will be examined.
Up until now, within the scope of externalaccounting it was only compulsory thatcompanies subject to the TEHG be affect-ed. As shown in the National AllocationPlan II (NAP II) from 2007 onwardsapproximately 91 percent of emissionrights are allocated to these companies
271334_CDP_Rep_2007_engl_f:CDP_Bericht_2007 22.10.2007 10:34 Uhr Seite 40

Analysis of the answers of German companies in the CDP5
Carbon Disclosure Project 2007 41
4 See A. Liebig/M. Maisch: CO2-Emissionshandel nach IFRS – eine Analyse der Theorie sowie der praktischen Umsetzung, unpublished working paper written on behalf of the WWF, Berlin 2006.
5 See IDW RS HFA 156 See letter of the BMF of 6. 12. 2005, GZ IV B 2 – S 2134a – 42/05.
are to be included if they are controlled bythe parent company. This is typically thecase when the shareholding exceeds50 percent. Under the equity shareapproach emissions are taken intoaccount in proportion with the share heldin the company. In addition it must bedetermined whether emissions are gener-ated directly through own plants and/orindirectly e. g. through power consump-tion and business travel. Furthermore itmust also be established which emissionsare to be taken into account or how theseare allocated (so-called CO2 equivalents).Finally, also of importance is whether theemissions are measured, calculated orestimated. The company is allowed flexi-bility through the alternatives describedabove. This does however reduce compa-rability. On the other hand, it is exactly thiscomparability that is of particular impor-tance to investors.
Alongside the variation in systems theconcrete form of emissions assessment inexternal accounting differs according tothe accounting standards. The regulationsof the German Commercial Code and theIFRS (International Financial ReportingStandards) will be described in more detailbelow.
Special interpretations of emission rightswithin the scope of IFRIC 3 in 2005 weredismissed, so that the existing standardsmust now be interpreted by the compa-nies with regard to their suitability foremission rights. As a general rule theaccounting of emission rights can bedivided into the categories of intangibleassets and inventories. In addition thequestion of how to value emission rights issignificant here.4
The concrete form of emissions assess-ment in external accounting differsaccording to accounting standards. UnderGerman Commercial Law bought andauctioned emission rights are intangibleassets, for which there is an obligation tocapitalise. Rights obtained free of chargemay only be disclosed under currentassets as inventories5. The question of thevaluation of emission rights arises gener-ally. Pursuant to § 255 of German Com-mercial Law this is the cost of acquisitionof bought and auctioned rights. For rightsobtained free of charge the cost is debat-able. The following are possible: the cur-
rent value at the time of addition includingcorresponding special items on the liabili-ties side between shareholders’ equityand provisions5, zero or a memo value ofone, according to the BMF6. Revenue fromauctioned or purchased rights has animmediate effect on earnings, as concernsrights obtained free of charge. However itis only the part that exceeds the specialreserves established that has such aneffect.
Emissions also play an important role ininternational accounting. Generally, arequirement to capitalise into an intangibleasset applies (pursuant to IAS 38). Theaddition of rights obtained free of chargeoccurs at the current value or at a symbol-ic value. For the recognition at currentvalue a deferred income item is formed, inorder to allocate income. Purchased orauctioned emission rights are capitalisedat their acquisition costs. Subsequentmeasurements occur at acquisition costsor at fair value. Alternatively EUAs (Euro-pean Carbon Futures) can also be inter-preted as inventories (IAS 2). The follow-ing applies to inventories: in the case ofimpairment, devaluation and reversal ofwrite-downs up to the maximum purchaseprice, initial measurement occurs at acqui-sition costs.
It therefore appears that the companiesalso have generous leeway in reportingtheir emission rights, which complicatesimpact evaluation for investors. Thus thevaluation ranges from a valuation at zeroto the fair value, which is disclosed aseither a long-term (intangible) asset oronly as an inventory. In addition this canresult in extraordinary income or expenseswith an effect on earnings through buyingor selling. For investors who want toderive the most realistic company repre-sentation possible from the accounts, thisleeway is unfavourable.
Emissions are however also taken intoaccount in internal reporting and in costaccounting in particular. In the sense ofopportunity costs, emission costs presentimputed variable costs if they arisethrough free emission rights and if a mar-ket exists. These can be considereddepending on the market power and theprobability of supplying the customer (lowelasticity of demand, as there is probablyno substitute product) when calculating
271334_CDP_Rep_2007_engl_f:CDP_Bericht_2007 22.10.2007 10:34 Uhr Seite 41

Analysis of the answers of German companies in the CDP5
Carbon Disclosure Project 200742
trading as of 2011, which will influencetransport costs.
As this information is obviously insufficientfor investors or is limited to individualindustries, there are a variety of initiativesthat call for additional voluntary reportsalongside the aforementioned types ofemissions reporting. In addition to theCDP these include the Greenhouse GasProtocol, the Intergovernmental Panel onClimate Change (IPCC), the Key Perform-ance Indicators on ESG (EnvironmentalSocial and Governance Reporting) of theGerman DVFA (Deutsche Vereinigung fürFinanzanalyse und Asset Management)and the Carbon Disclosure StandardsBoard (CDSB) of the World EconomicForum. The goal of the CDSB, which wasestablished in 2007, is to develop a stan-dard for corporate reporting through cli-mate change. Taking into considerationthe opinion of leading global minds on thistopic, it is imperative that a necessarystandardisation and therefore comparabili-ty of reporting be achieved.
To summarize, it appears that emissionsreporting is already playing an importantrole in internal and external accountingand will probably gain further in influencein the future. Further standardisation ofreporting will continue, this includes thoseindustries that are not subject to theTEHG. Therefore it can be expected thatthe management report gains increasingimportance in the disclosure of the risks ofclimate change.
42
the price and therefore lead to higherprices. The German Federal Cartel Officeestablished in 2007 that energy providersmay account for a maximum of 25 percentof emission rights as opportunity costs.Auctioned or purchased emission rightsare accounted for as expense-basedcosts both in costing and in the incomestatement. To what extent this is reflectedin the prices is in turn dependent on themarket power of the provider. For the con-sumer this means that prices in the indus-tries affected by NAP II can increase dueto allocated and auctioned or purchasedemission rights, as these reflect expensesor imputed costs. Whether this reducesthe company’s success is dependent onthe market power of the company.
Payments for emissions are also reflectedin the investment decision: A trade-offexists between possibly higher investmentpayments today and lower payments foremission rights in the future and viceversa.7 Future payments for emissionrights are tainted with the risk that theywill be influenced by the price trend forthe EUA and by regulatory measures. Thiscan be considered in investment deci-sions with the help of simulation oroptions models. For companies that are(still) not subject to emission trading,emissions still play a role as business suc-cess can be influenced by higher electrici-ty or transport prices, for example. Thisparameter in the capital expenditureaccount also carries risks, as is illustratedby the inclusion of airlines in emission
Carbon Disclosure Project 2007
7 See Urdal, B./Kopp, M./Vökler, T.: Carbonising Valuation Sam Study 2007
271334_CDP_Rep_2007_engl_f:CDP_Bericht_2007 22.10.2007 10:34 Uhr Seite 42

Analysis of the answers of German companies in the CDP5
Carbon Disclosure Project 2007 43
Emissions reporting in the CDP
Against this background, analysis of thecompanies’ emissions reporting within thescope of the CDP provides insight into thematter.
Please provide the following informa-tion on your company’s emissionsmeasurements: The accounting yearused to report GHG emissions. Themethodology by which emissions arecalculated. Whether the informationprovided has been externally verified oraudited. An explanation for any signifi-cant variations in emissions from yearto year, e. g. due to major acquisitions,divestments, introduction of new tech-nologies, etc. (Question 2a of the CDP5 questionnaire)
63 percent of the companies describetheir methods of reporting GHG emissionsin detail (44 percent) or more generally(19 percent).
It is noticeable that until now no standardexists and the reports are therefore diffi-cult to compare. This relates to both thescope and method of the reports and theiraudits.
According to company information,11 percent base their reporting scope onthe consolidated financial statements,3 percent on the exerted control and5 percent of cases on ownership struc-tures. The remaining companies gave noinformation on this.
The variety of reporting methods alsocomplicates comparison. The followingtable 5 gives an overview.
According to this the most widespreadmethod of reporting is reporting in linewith the GHG Protocol. This may well bedue to the fact that a direct reference tothis protocol is made in the CDP question-naire. The indirect recording of CO2 emis-sions through energy consumption is alsoa common method. Additionally thereporting methods in line with the EUETS/TEHG and the industry-specific VfUIndicators for financial services providersare also relevant. It is desirable that infuture a comparable basis of informationbe achieved through further standardi -sation.
A total of 24 percent of the companiesrequire that their GHG emissions reportingundergo an external audit. The majority of10 percent rely on auditors for this pur-pose. Certification as per ISO 14001 iscarried out by 3 percent of the companies.Experts and advisors are used by 3 per-cent of corporations and consultants by2 percent. 6 percent do not give any pre-cise details on the type of audit used.
For participants in the capital markets it ishere that the question of comparabilityand credibility of the information arises.The results underline the need to developa set of standards for reporting and auditing.
Table 5: Methods of emissions reporting
Method Percentage
GHG Protocol 16 %
Energy consumption 10 %
EU Emission Trading System (EU ETS)/TEHG 7 %
VfU-Indicators 4 %
Global Emission Model for Integrated Systems (GEMIS) 2 %
Others 2 %
Figure 11: Emissions reporting audits
� Auditor 10 %
� Other 6 %
� ISO 14001 3 %
� Expert, surveyor 3 %
� Consultant 2 %
� None 76 %
271334_CDP_Rep_2007_engl_f:CDP_Bericht_2007 22.10.2007 10:34 Uhr Seite 43

Scope and Distribution of Emissions
8 See Greenhouse Gase Protocol, A Corporate Accounting and Reporting Standard, revised version(www.ghgprotcol.org).
9 See Machat, M./Werner, K,: Entwicklung der spezifischen Kohlendioxid-Emissionen des deutschen Strommix, Dessau 2007. The value in the sample audit is presumably somewhat lower, as the proportion ofrenewable energy is 12 percent, while it stands at 10.1 percent nationwide.
Figure 12: Availability of emissions data
� Available 67 %
� None 33 %
Figure 13: Emissions data
30 % 40 % 50 %20 %10 %0 %
Energy consumption
Other indirectemissions(Scope 3)
Indirect Emissions(Scope 2)
Direct Emissions(Scope 1)
Scope 1 and 2 of GHG Protocol: Pleasecomplete the table below for tonnesCO2e emitted and electricity consump-tion, percentage of purchased MWhfrom renewables both global and annexB countries.
Scope 3 of GHG Protocol: Other Indi-rect GHG emissions. Where feasibleplease provide estimates for the follow-ing categories of emissions:Use/disposal of company’s productsand services, your supply chain, exter-nal distribution/logistics, employeebusiness travel. (Question 2b and 2c of the CDP5 ques-tionnaire)
The majority of companies are alreadyable or willing to quantify their GHG emis-sions. 50 percent of those companies thatresponded had quantified their CO2 emis-sions. This came to a total of 675 milliontonnes. At the current market price forphase II of approx. 20 Euro/t these emis-sions correspond to costs of 13.5 billionEuro. The majority of the emissionsdeclared (54 percent) originate from powerproviders. Depending on the sector andlegal regulation, these costs are partlyaccounted for as opportunity costs andpassed on to consumers.
Companies also separate emissionsaccording to type (scopes 1 to 3) and theirregion of origin8 (industrialised nations inaccordance with the Kyoto protocol (so-called annex B countries and other coun-tries). However, companies are not alwaysable to attribute emissions to their coun-tries of origin.
Scope 1 covers all emissions causeddirectly by the companies. This includesall emission sources belonging to or con-trolled by the company, such as powerstations, production facilities and vehicles.31 percent of companies give informationon their scope 1 emissions, 19 percentcan provide information on developedcountries, to which 85 percent of theseemissions apply.
Scope 2 emissions include indirect emis-sions resulting from the consumption ofpurchased energy. 23 percent assignedtheir emissions to this category. For the
17 percent of companies that made state-ments about regional emissions in devel-oped countries, their share of total emis-sions was also an average of 85 percent.
These scope 2 emissions can also partlybe determined from details about pur-chased and consumed electricity. Here,41 percent of companies made informa-tion available. To convert this consump-tion into CO2 emissions, assumptionshave to be made about the CO2 emissionfactor, depending on the German electrici-ty mix. The Federal Environment Agencycurrently uses the factor 616 g/KWh.9
According to the information provided bycompanies, total global consumption is2.28 billion MW/h. This corresponds to aCO2 discharge of 1.4 billion tonnes. Thisvalue considerably exceeds the emissionsresulting from power generation in Ger-many, as companies are active worldwideand purchase electricity accordingly. Distributing the costs of power generationby determining the energy consumptionwould lead to emissions costs of 28.1 bil-lion Euro.
Only very few companies provideddetailed information about scope 3, thatis, anything concerning CO2 emissionscaused by use or consumption of prod-ucts (6 percent), in the supply chain(6 percent) or during business trips(13 percent).
However, information about CO2 emis-sions resulting from utilisation is of partic-ular importance in many industries, as isevident in the ongoing debate about CO2
discharge due to car use. So far however,companies have not been particularlyforthcoming with this information. Asregards the CDP, BMW and Volkswagenhave been rated positively, as both com-panies provide extensive details of theiremissions and allow this information to bepublished. BMW put their emissions forcar production at 1.2 million tonnes andVolkswagen at 6 million tonnes. For thisquantity, BMW manufactures 1.374 millionvehicles, Volkswagen 5.734 million. CO2
emissions per vehicle are therefore slightlylower at BMW with 0.93 tonnes per vehi-cle, compared to Volkswagen with
44 Carbon Disclosure Project 2007
Analysis of the answers of German companies in the CDP5
41%
16%
23%
31%
271334_CDP_Rep_2007_engl_f:CDP_Bericht_2007 22.10.2007 10:34 Uhr Seite 44

1.05 tonnes per vehicle. However, a highproportion of the emissions result from theuse of sold vehicles. Assuming a conser-vative mileage of 150,000 km (93.750miles) and a fleet consumption for BMWof 192 g CO2/km10, the annually sold vehi-cles have an CO2 discharge of 39.6 milliontonnes. At Volkswagen, with an averagefleet consumption of 161 g CO2/km, theresulting CO2 emissions total 138.48 mil-lion tonnes. This corresponds to emis-sions 25-35 times greater than thoseresulting from manufacture, representing,at a market price of 20 Euro per tonne, a
total value of 3.56 billion Euro. These twocar manufacturers are therefore jointlymore responsible for higher emissionsthan even the largest German electricityprovider. These relations are very similarfor other car manufacturers too. As thesesimple calculations use average figures,they can only be used to express roughtendencies. Moreover, the risk from theseemissions is best measured according tothe discharge from different models andtheir contribution to the total emissions.Exhaust emissions from BMW, for exam-ple, generate between 118 and 80 g CO2
per km.
Further information on the most affected companies
Classification of industries
How much a company is affected withregard to emissions and the impact of theGHG effect depends on the companycharacteristics. For this reason there is aseries of extra questions in the CDP,which are answered by the companiesmost affected.11
Additional GHG emissions reports
9 percent of companies provided reportson emissions according to country. Withinthe companies most affected, these com-panies are spread across all industries.
15 percent of companies give detailedinformation about their EU ETS emissionsand NAP allocations. According to thisinformation, 45 percent of all emissionsrecorded in the German CDP5 fall into theEU ETS category. At first glance, the totalof required and allocated emissions rightsis roughly equal. This means, however,that some companies are lumbered withthe additional burden of buying emissionsrights, while other companies increasetheir revenues by means of free alloca-tions. Based on the information received,additional revenues of 135 million Euro orcosts of 226 million Euro would result in aprice of 20 Euro per tonne. Very few com-panies voluntarily release informationabout profits or losses made from thetrade of emissions. Any informationoffered tends to relate more to costs
rather than profits made from the sale ofemissions rights. Depending on theaccounting policy it is not always possibleto derive this value from financial state-ments. However, this information is cer-tainly of relevance to investors, as itenables the cost-saving potential ofinvestment in the reduction of CO2 emis-sions to be clearly identified.
GHG emissions management
Particularly in the most affected indus-tries, the reduction of CO2 emissionsplays a considerable financial role. 89 per-cent of these companies have thereforeestablished programmes for the reductionof CO2 emissions. The majority of theseprogrammes are planned for the long-termand have an average duration of 14 years.These should result in emissions being cutby 1.7 percent per year. As the base yearwas not always given for the programmes,it is not possible to forecast to what extentthe German emission-cutting targets canbe achieved through these programmes.
Emissions intensity
The question related to measurement ofCO2 emissions must also be seen asindustry-specific. 18 percent of compa-nies used individual units for measuringthe intensity of emissions. A statementabout the CO2 discharge in absoluteterms is therefore often only of limitedbenefit. The majority of companies relate
10 Cf. Company data in the CDP and Centre for Automotive Research, FH Gelsenkirchen.11 These include companies that are subject to the TEHG and/or belong to the automobile, aircraft, chemical,
building materials, energy suppliers, oil and gas, metal and mining, paper and forestry and transport indus-tries.
Figure 14: Programme for reducing emissions
� In place 89 %
� Not in place 11%
Each Cent/kWh of electricity priceincrease results in additional costsof 10 million Euro p. a..
Norddeutsche Affinerie AG
45Carbon Disclosure Project 2007
Analysis of the answers of German companies in the CDP5
271334_CDP_Rep_2007_engl_f:CDP_Bericht_2007 22.10.2007 10:34 Uhr Seite 45

Energy costs contribute on average 5 per-cent to operational costs. There are how-ever differences between companies, asvalues given range from less than 1 per-cent to 17 percent.
Companies are also reluctant to releaseinformation about their planning asregards future emissions. 50 percent ofcompanies make general basic state-ments. A further 26 percent of companiesprovide some additional information aboutinvestment volumes, methods and so on.Reasons of competitiveness could cer-tainly negatively influence the readiness ofcompanies to release information herealso.
With regard to its organisational imple-mentation, the companies most affectedfeel a clear sense of responsibility atboard level for climate change issues.Often however, this is not dealt with as aseparate issue, but rather bundled togeth-er with other topics relating to environ-mental protection and/or social responsi-bility. In the companies most affected,78 percent deal with this issue at boardlevel. 14 percent have placed this respon-sibility with the middle management.
CO2 discharge to an underlying product.For this purpose, it is necessary to specifythe product. Depending on the type ofproduct, it is related either to a unit ofmeasurement, e. g. CO2 per tonne of theproduct, or to product units, e. g. CO2 perfinished product. Typical examples givenby the companies are• CO2/tonne of product• CO2/vehicle• CO2/generated MW/h• CO2/pair of shoes
It would be useful to develop similar CO2
emissions ratios for other industries inorder to enhance comparabilitiy of indus-tries worldwide. However, it is importantto note that regulation is geared toabsolute emission values, meaning thatrelative values are only used as supple-mentary information for the benefit ofexternal communication or competitivecomparison.
The proportion devoted to energy costscan be seen as a further indicator of therisk of CO2-related price increases andtherefore the risks of climate change. Forcompetitive reasons, however, many com-panies refuse to publish details of theirenergy costs, whether absolute or relative.
Due to the strong increasing pricefor fossil fuels in the past five years,this factor (reducing the consump-tion of resources) has a strongimpact already on today’s invest-ment decisions. The possible, addi-tional future costs of emissions areconsidered in investments deci-sions for new aircraft buttoday linked to a high uncertaintyfactor regarding the price for CO2
emissions.
Deutsche Lufthansa AG
Figure 15: Information about emissions planning
� Detailled 26 %
� General 50 %
� None 24 %
Figure 16: Responsibility for climate change
� Executive board 78 %
� Middle management14 %
� No Information 8 %
Emissions – a value driver
12 Cf. to EVA concept e. g. Stern, J./Shiel, J./Ross, I.: The EVA Challenge: Implementing Value-added Changein an Organisation, 2004.
is used, which, alongside operational suc-cess, also takes into account the cost ofcapital for the company and permits anextension as regards emissions costs.Due to its conceptual prevalence, theEconomic Value Added (EVA) indicatorfrom the Stern Stewart consultancy firm isused for this. This is based on the adjust-ed performance indicator Net OperatingProfit After Tax (NOPAT), which has tocover the cost of capital for the compa-ny.12 The EVA is the value created by acompany in a period that exceeds thecost of capital. The cost of equity capitalis adjusted according to risk and repre-sents an external cost for the companies.This is in contrast an opportunity cost forthe investors. It is therefore taken intoaccount that companies not only have tocover their operational costs but also theirequity capital costs.
Emissions can have an impact on the suc-cess of companies, either through costsor income from the purchase or sale ofemissions rights, through price increasesin industries most affected and throughindividual pricing strategies. However, thissuccess factor depends largely on futureregulatory measures, such as the expan-sion of emissions trading into previouslyunaffected industries. Own CO2 emissionsand a great amount of outsourcing inhigh-emission industries therefore presenta particular risk. Such risks regularly leadto a discount in firm valuations. Forinvestors it raises the question of whichrisks individual companies are exposed tobecause of their emissions and how thesecan be quantified.
To get an indicator for the quantification ofthe risk, a periodic performance indicator
46 Carbon Disclosure Project 2007
Analysis of the answers of German companies in the CDP5
271334_CDP_Rep_2007_engl_f:CDP_Bericht_2007 22.10.2007 10:34 Uhr Seite 46

13 See also the same procedure in the CDP Report 2006 Electric Utilities, p. 29 at www.cdproject.net.14 Cf. Thomas, S./Repetto, R./Dias, D.: Environmental and Financial Performance Metrics for Investment
Analysis and Portfolio Management, in: Corporate Governance, Vol. 15 2007, p. 421-426.15 Cf. Machat, M./Werner, K, : Entwicklung der spezifischen Kohlendioxid-Emissionen des deutschen Strom-
mix, Dessau 2007.16 Return on Capital (ROC) calculates it as EVA or TruEVA divided by the average invested capital (CE).
47Carbon Disclosure Project 2007
Analysis of the answers of German companies in the CDP5
The TruEVA concept also represents ananalogy for taking external costs intoaccount.13 Here the NOPAT is adjusted,not only for the cost of capital, but also forthe monetised emissions costs.14 This isnot only used to determine parts of theemissions-related external costs, but alsoshows the risk which companies aretherefore exposed to. To calculate theTruEVA, information about EVA, emissionsand emissions costs is required. The EVAindicators used on the following pageswere provided by Stern Stewart inMunich. CO2 and CO2-equivalent emis-sions from the CDP5, are used exclusivelyas a base, in accordance with the infor-mation received from companies. On thebasis of the current market values of Euro-pean Carbon Futures (EUA), 20 Euro pertonne of CO2 is applied as the cost ofemissions. If the company did not giveany information about its direct CO2 emis-sions, these were calculated using detailsof electricity consumption on the basis ofthe German electricity mix using the ratio616 g/KWh15 The marginal tax rate alsoneeds to be taken into account, as thecosts of CO2 emissions also have to becalculated according to taxation, alongthe lines of NOPAT. In total, a TruEVAcould be calculated for 46 companies.This corresponds to 43 percent of thecompanies that responded in the CDP5.
On the following pages, only the compa-nies that have a return on capital reduc-tion due to emissions costs of >1 percentare shown and examined.16 There are18 companies in total, corresponding to39 percent of the companies surveyed.These include the most affected industrieswith high emissions in their value chain,such as chemicals/pharmaceuticals, ener-gy providers, engineering, raw materials/consumables/supplies and trans-port/logistics. As unfortunately not allcompanies in the CDP agreed to theirdata being published, it is subsequentlyonly possible to carry out an industryanalysis.
A total of 81 percent of all surveyed com-panies achieved a positive EVA after capi-tal and emissions costs. The averagedecrease in return on capital after the
inclusion of emissions costs is 2.4 per-cent. In total the monetarised emissionscosts of the companies surveyed amount-ed to 9.5 billion Euro after tax. Thus in thissample audit, 89 percent of emissionscovered by the CDP5 in Germany havebeen taken into account, so that theresults deliver a good insight into theemissions-related reduction of value cre-ation for investors.
The need for an industry-specific analysisof emissions costs (CO2 costs after tax) isonce again evident. Energy suppliers areagain particularly affected, as a full mone-tarisation of emissions would lead tocosts between 200 million Euro and2.3 billion Euro, which would result in anegative TruEVA for all energy providers.Return on capital would decline bybetween 3 percent and 11 percent. In thechemical/pharmaceutical industry a gen-eral reduction in returns on capital of1 percent can be expected. It is howeverinteresting that the effect of incorporationof emissions in this industry is not affect-ed by size. There is a particularly widespread in the area of raw materials, con-sumables and supplies. Here the declinein return on capital varies between 1 per-cent and 18 percent. The company withthe smallest change in return on capital,however, operates in several industrieswhich means that emissions are lower inrelation to employed capital and have alesser effect on the EVA. There is a simi-larly wide spread in the engineering sec-tor. The decline in return on capital of thethree companies illustrated here variesbetween 2 percent and 27 percent. How-ever, it has to be taken into account thatan influence of <1 percent was calculatedfor the other seven engineering firms.
In one scenario it would be conceivable tocharge automobile manufacturers with theemissions costs of the products sold inaddition to the direct emissions of produc-tion. Such an inclusion of emissions costsfrom sold vehicles would result in adecline in return on capital of between3 percent and 8 percent. The considera-tion of this loss in value implies howeverthat through regulatory measures, emis-sions costs would be carried by the man-
271334_CDP_Rep_2007_engl_f:CDP_Bericht_2007 22.10.2007 10:34 Uhr Seite 47

Table 6: Influence of emissions on success
Industry EVA CO2 costs after tax TruEVA ROC (in € million) (in € million) reduction
Chemical/ 8 125 – 117 1 %
Pharmaceutical 25 14 11 1%
1.809 265 1.543 1%
– 208 30 – 239 1%
75 19 57 1%
Energy providers 30 337 – 307 3%
1.325 2.105 – 781 4%
1.387 2.344 – 957 6%
185 1.050 – 866 11%
Engineering 72 23 50 2%
– 53 197 – 251 3%
– 6 12 – 18 27%
Raw materials, 287 190 97 1%
consumables and – 87 1.319 – 1.406 15%
supplies 19 119 – 100 18%
Transport/ 1.615 116 1.500 1%
Logistics – 181 387 – 568 5%
258 374 – 116 5%
ufacturer, similar to the policy of returningold vehicles.
This demonstrates a measurable but verydistinct effect of emissions on the successof a business. However some limitationsto the interpretation of these results apply.
1) Emissions are calculated differentlyfrom company to company, whichmakes a comparison difficult.
2) As the companies do not always unam-biguously distinguish between Scope 1(direct) and Scope 2 (indirect) emis-sions, emissions are recorded morethan once, that is by the originator andthe user of a manufactured product.This is however, acceptable as compa-nies are faced with a price risk throughhigh indirect emissions, which is to betaken into account accordingly in theassessment.
3) The emissions are already partiallymonetarised: Expenses and revenuefrom purchased and sold emissionrights are already included in theincome statement. However, theseamounts are often not disclosed sepa-rately in the annual financial statements.
4) Direct emissions are sometimes alreadyincluded in the prices as opportunitycosts or expenses on a proportionatebasis. Companies have alreadyaccounted for their indirect emissionsthrough higher purchase prices.Depending on market power thesecosts have been passed on to con-sumers.
5) Climate change does not just exertinfluence on the value added of a com-pany through direct and indirect emis-sions, but can also influence its suc-cess much more through its reputation,new product lines etc. The economiceffect is simply reduced to emissionsand thus rated much higher.
A consideration of these critical points onthe basis of the data currently available ishowever scarcely possible. By means ofexample a necessary adaptation in theinstance of RWE can be undertaken. RWEhas emissions of approximately 149 mil-lion tonnes and emission rights of 141 mil-lion tonnes CO2 annually. RWE has there-fore acquired 8 million tonnes of additionalemission rights. In the annual report avalue of approximately 230 million Euro
48 Carbon Disclosure Project 2007
Analysis of the answers of German companies in the CDP5
271334_CDP_Rep_2007_engl_f:CDP_Bericht_2007 22.10.2007 10:34 Uhr Seite 48

49Carbon Disclosure Project 2007
Analysis of the answers of German companies in the CDP5
was disclosed for this. This represents acost and has already reduced the NOPAT.At the same time however, it can beassumed that this amount was used forcosting and pricing purposes, so thatthese emissions costs are a low to non-existent burden on business success.
According to a warning from the FederalCartel Office, the allocated free emissionsmay only account for up to 25 percent ofthe proportionate market value of theemissions certificates in price fixing. Tak-ing the average price of 20 Euro pertonne, 705 million (25 percent x 141 mil-lion tonnes x 20 Euro) of these allocatedfree emission rights may be reflected inthe price calculation. Assuming that thecompany has also benefited from thisamount through the prices, the emissionscosts unaccounted for amount to2,115 million Euro before tax (75 percent x141 million tonnes x 20 Euro). In order toobtain the TruEVA, this amount is to bededucted, adjusted by tax, from EVA. Inthe case of RWE the TruEVA wouldimprove by just under 700 million Euro,but would still be negative.
Furthermore additional changes may arisein 2008: the sum of 2,115 million Euro canbe at least partially allocated to the energyprices in 2008 if 10 percent have to beobtained by auction. According to its ownstatements RWE must then acquire addi-tional emissions certificates at the currentvalue (as at August 2007) of 1.6 billionEuro. The question is whether this cost isalready contained in the market prices viathe marginal costs of the last power plantor if it can still be priced in.
The indications from the results and limita-tions underline the need to make theeffects of emissions more transparent.Only this way will it be possible forinvestors and analysts to adequately con-sider the risk factor in their valuations.
271334_CDP_Rep_2007_engl_f:CDP_Bericht_2007 22.10.2007 10:34 Uhr Seite 49

4 Appendix
271334_CDP_Rep_2007_engl_f:CDP_Bericht_2007 22.10.2007 10:34 Uhr Seite 50
Appendix
Carbon Disclosure Project 2007 51
3. Companies in any sector that may besignificantly influenced by GHG emis-sions or climate change.
New procedures for CDP in 2007
Please use our website for direct dataentry via www.cdproject.net/cdp5. If nec-essary, send your response electronicallyin English to the Project Coordinator [email protected].
Your response will be made publicly avail-able at www.cdproject.net in September2007, unless you notify us to the contrary.If you inform us that you do not want yourinformation disclosed, we will only use itin production of aggregate statistics.
For additional guidance and informationplease see the Further Informationattached to this questionnaire, or refer tothe Reporting Guidance section atwww.cdproject.net.
1 Climate Change Risks, Opportunitiesand Strategy
For each question please state the timeperiod and where possible the associatedfinancial implications.
a Risks: What commercial risks does cli-mate change present to your companyincluding, but not limited to, those listedbelow?
i Regulatory risks associated with cur-rent and/or expected governmentpolicy on climate change e. g. emis-sions limits or energy efficiency stan-dards.
ii Physical risks to your business oper-ations from scenarios identified bythe Intergovernmental Panel on Cli-mate Change or other expert bodies,such as sea level rise, extremeweather events and resource short-ages.
iii Other risks including shifts in con-sumer attitude and demand.
We request a reply to the following ques-tions by the 31st May 2007. Pleaseanswer the questions as comprehensivelyas possible or state the reasons why youare unable to supply the informationrequested. If at this stage you can onlyprovide indicative information we still wel-come this, as a ‘best guess’ is more valu-able to us than no response.
One of the main objectives this year is toimprove the quality of the responses andstandardize reporting to facilitate bettercomparison of data across and withinsectors. We therefore request thatanswers to the following questions areprovided for your company as defined inyour consolidated audited financial state-ments. If you are unable to respond onthis basis, please explain why and detailthe reporting boundaries you have used.
We recognize GHG emissions and climatechange have varying impacts on sectorsand companies. We have therefore divid-ed the questionnaire into two sections toreflect these differences. Companies areencouraged to answer both parts of thequestionnaire where relevant.
Section A: For all companies to com-plete.17
Section B: For the following companies tocomplete:
1. Companies with combustion installa-tions with a rated thermal input exceed-ing 20 MW.
2. Companies involved in the followingsectors: • automobiles & components• aerospace & defense• chemicals• construction materials• electric utilities• energy equipment & services• oil, gas & consumable fuels• metals & mining• paper & forest products• transportation
CDP5 QuestionnaireCarbon Disclosure Project (CDP5) Greenhouse Gas Emissions Questionnaire
17 For the purposes of responding to this section, please follow the World Resources Institute (WRI), WorldBusiness Council for Sustainable Development’s (WBCSD’s) Greenhouse Gas Protocol (corporate standardrevised version), details of which can be found at www.ghgprotocol.org
271334_CDP_Rep_2007_engl_f:CDP_Bericht_2007 22.10.2007 10:34 Uhr Seite 51

Appendix
Carbon Disclosure Project 200752
18 The six main Greenhouse Gases are carbon dioxide (CO2), methane (CH4), nitrous oxide (N2O), hydrofluoro-carbons (HFCs), perfluorocarbons (PFCs) and sulphur hexafluoride (SF6).
19 If you are responding to CDP for the first tiame, please provide details where available, of emissions for thelast three measurement cycles.
b Opportunities: What commercialopportunities does climate changepresent to your company for both exist-ing and new products and services?
c Strategy: Please detail the objectivesand targets of the strategies you haveundertaken or are planning to take tomanage these risks and opportunities.Please include adaptation to physicalrisks.
d Reduction targets: What are youremissions reduction targets and timeframes to achieve them? What renew-able energy and energy efficiency activi-ties are you undertaking to manage youremissions? (This question not required ifanswering Section B.)
2 Greenhouse Gas Emissions Accounting18
a Methodology: Please provide the fol-lowing information on your company’semissions measurements:
i The accounting year used to reportGHG emissions.
ii The methodology by which emis-sions are calculated.
iii Whether the information providedhas been externally verified or audit-ed.
iv An explanation for any significantvariations in emissions from year toyear, e. g. due to major acquisitions,divestments, introduction of newtechnologies, etc.
b Scope 1 and 2 of GHG Protocol:Direct and Indirect GHG emissions andelectricity consumption.19 Please com-plete the table below for tonnes CO2eemitted and electricity consumption:Globally Annex B CountriesScope 1 activity tonnes CO2e emittedScope 2 activity tonnes CO2e emittedMWh of purchased electricityPercentage of purchased MWh fromrenewables
c Scope 3 of GHG Protocol: Other Indi-rect GHG emissions. Where feasibleplease provide estimates for the follow-ing categories of emissions:
i Use/disposal of company’s productsand services.
ii Your supply chain.
iii External distribution/logistics.
iv Employee business travel.
271334_CDP_Rep_2007_engl_f:CDP_Bericht_2007 22.10.2007 10:34 Uhr Seite 52

Appendix
Carbon Disclosure Project 2007 53
b Emissions trading: What is your com-pany’s strategy for trading in the EUEmissions Trading Scheme, CDM/JIprojects and other trading systems (e. g.CCX, RGGI, etc), where relevant?
c Emissions intensity: Please statewhich measurement you believe bestdescribes your company’s emissionsintensity performance? What are yourhistorical and current emissions intensi-ty measurements? What are your tar-gets?
d Energy costs: What are the total costsof your energy consumption e. g. fromfossil fuels and electric power? Whatpercentage of your total operating costsdoes this represent?
e Planning: Do you estimate your compa-ny’s future emissions? If so please pro-vide details of these estimates andsummarize the methodology for this.How do you factor the cost of futureemissions into capital expenditure plan-ning? Have these considerations madean impact on your investment deci-sions?
5 Climate Change Governance
a Responsibility:
i Which Board Committee or otherexecutive body has overall responsi-bility for climate change?
ii What is the mechanism by which theBoard or other executive bodyreviews the company’s progress andstatus regarding climate change?
b Individual performance: Do you pro-vide incentive mechanisms for man-agers with reference to activities relatingto climate change strategy, includingattainment of GHG targets? If so, pleaseprovide details.
3 Additional Greenhouse Gas Emis-sions Accounting
Using the methodology as set out in 2(a),please state your Scope 1 and 2 emis-sions as follows:
a Countries: For each country in whichyou have operations, where available.
b Facilities: For facilities covered by theEU Emissions Trading Scheme (EUETS). Please also include the number ofallowances you were issued under theapplicable National Allocation Plans.
c EU ETS impact: What has been theimpact on your profitability of the EUEmissions Trading Scheme?
4 Greenhouse Gas Emissions Manage-ment
a Reduction programmes: What emis-sion reduction programs does yourcompany have in place? Please include any reduction programsrelated to your operations, energy con-sumption, supply chain and productuse/disposal.
i What is the baseline year for theemissions reduction program?
ii What are the emissions reductiontargets and over what period dothose targets extend?
iii What investment has been/will berequired to achieve the targets andover what time period?
iv What emissions reductions andassociated costs or savings havebeen achieved to date as a result ofthe program?
v What renewable energy and energyefficiency activities are you undertak-ing to manage your emissions?
Section BTo be completed by companies defined in the introduction to this questionnaire.20
20 These include companies that are subject to the TEHG and/or belong to the automobile, aeronautical,chemical, building materials, energy supplying, oil and gas, metal and mining, paper and forestry andtransport sectors.
271334_CDP_Rep_2007_engl_f:CDP_Bericht_2007 22.10.2007 10:34 Uhr Seite 53
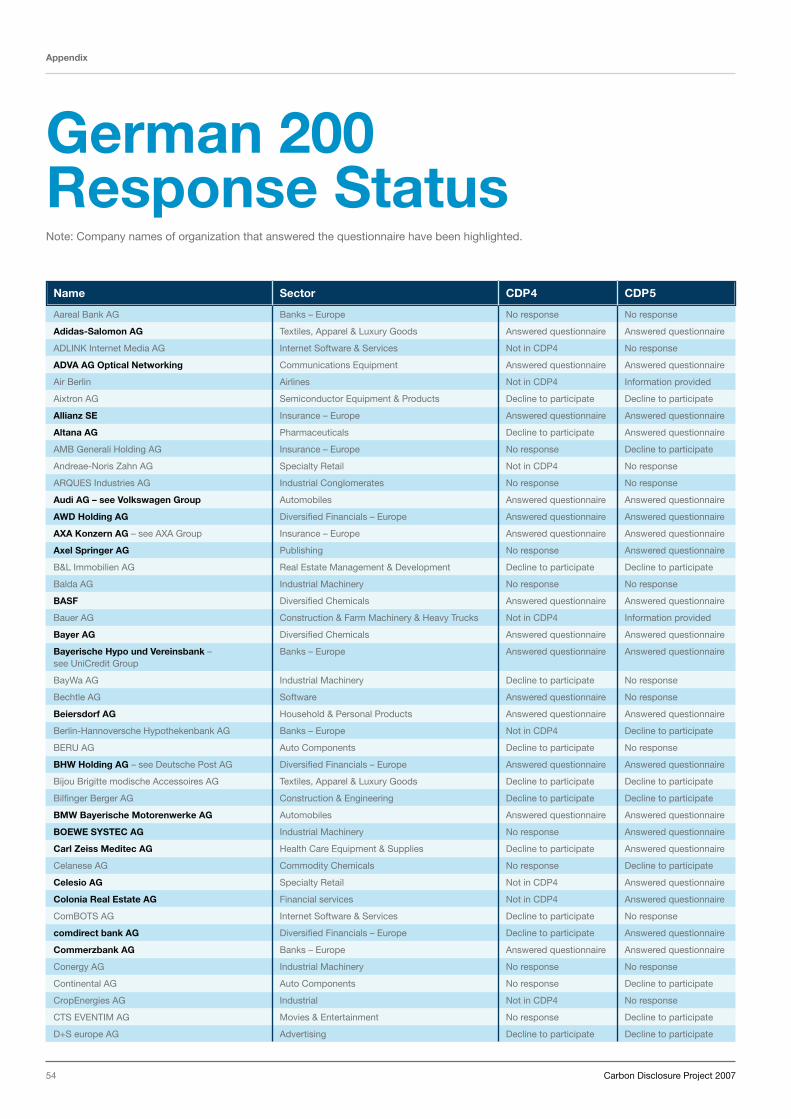
Appendix
Carbon Disclosure Project 200754
German 200 Response StatusNote: Company names of organization that answered the questionnaire have been highlighted.
Name Sector CDP4 CDP5
Aareal Bank AG Banks – Europe No response No response
Adidas-Salomon AG Textiles, Apparel & Luxury Goods Answered questionnaire Answered questionnaire
ADLINK Internet Media AG Internet Software & Services Not in CDP4 No response
ADVA AG Optical Networking Communications Equipment Answered questionnaire Answered questionnaire
Air Berlin Airlines Not in CDP4 Information provided
Aixtron AG Semiconductor Equipment & Products Decline to participate Decline to participate
Allianz SE Insurance – Europe Answered questionnaire Answered questionnaire
Altana AG Pharmaceuticals Decline to participate Answered questionnaire
AMB Generali Holding AG Insurance – Europe No response Decline to participate
Andreae-Noris Zahn AG Specialty Retail Not in CDP4 No response
ARQUES Industries AG Industrial Conglomerates No response No response
Audi AG – see Volkswagen Group Automobiles Answered questionnaire Answered questionnaire
AWD Holding AG Diversified Financials – Europe Answered questionnaire Answered questionnaire
AXA Konzern AG – see AXA Group Insurance – Europe Answered questionnaire Answered questionnaire
Axel Springer AG Publishing No response Answered questionnaire
B&L Immobilien AG Real Estate Management & Development Decline to participate Decline to participate
Balda AG Industrial Machinery No response No response
BASF Diversified Chemicals Answered questionnaire Answered questionnaire
Bauer AG Construction & Farm Machinery & Heavy Trucks Not in CDP4 Information provided
Bayer AG Diversified Chemicals Answered questionnaire Answered questionnaire
Bayerische Hypo und Vereinsbank – Banks – Europe Answered questionnaire Answered questionnairesee UniCredit Group
BayWa AG Industrial Machinery Decline to participate No response
Bechtle AG Software Answered questionnaire No response
Beiersdorf AG Household & Personal Products Answered questionnaire Answered questionnaire
Berlin-Hannoversche Hypothekenbank AG Banks – Europe Not in CDP4 Decline to participate
BERU AG Auto Components Decline to participate No response
BHW Holding AG – see Deutsche Post AG Diversified Financials – Europe Answered questionnaire Answered questionnaire
Bijou Brigitte modische Accessoires AG Textiles, Apparel & Luxury Goods Decline to participate Decline to participate
Bilfinger Berger AG Construction & Engineering Decline to participate Decline to participate
BMW Bayerische Motorenwerke AG Automobiles Answered questionnaire Answered questionnaire
BOEWE SYSTEC AG Industrial Machinery No response Answered questionnaire
Carl Zeiss Meditec AG Health Care Equipment & Supplies Decline to participate Answered questionnaire
Celanese AG Commodity Chemicals No response Decline to participate
Celesio AG Specialty Retail Not in CDP4 Answered questionnaire
Colonia Real Estate AG Financial services Not in CDP4 Answered questionnaire
ComBOTS AG Internet Software & Services Decline to participate No response
comdirect bank AG Diversified Financials – Europe Decline to participate Answered questionnaire
Commerzbank AG Banks – Europe Answered questionnaire Answered questionnaire
Conergy AG Industrial Machinery No response No response
Continental AG Auto Components No response Decline to participate
CropEnergies AG Industrial Not in CDP4 No response
CTS EVENTIM AG Movies & Entertainment No response Decline to participate
D+S europe AG Advertising Decline to participate Decline to participate
271334_CDP_Rep_2007_engl_f:CDP_Bericht_2007 22.10.2007 10:34 Uhr Seite 54

Appendix
Carbon Disclosure Project 2007 55
Name Sector CDP4 CDP5
DAB bank AG Diversified Financials – Europe Decline to participate No response
DaimlerChrysler AG Automobiles Answered questionnaire Answered questionnaire
DBV-Winterthur Holding AG Insurance – Europe Not in CDP4 Answered questionnaire
Demag Cranes AG Construction & Farm Machinery & Heavy Trucks Not in CDP4 Decline to participate
Depfa Bank Banks – Europe Decline to participate Answered questionnaire
Deutsche Bank Banks – Europe Answered questionnaire Answered questionnaire
Deutsche Beteiligungs-AG Banks – Europe No response Decline to participate
Deutsche Börse AG Diversified Financials – Europe Answered questionnaire Answered questionnaire
Deutsche EuroShop AG Real Estate Investment Trusts No response Answered questionnaire
Deutsche Hypothekenbank AG Banks – Europe Not in CDP4 No response
Deutsche Lufthansa AG Airlines Answered questionnaire Answered questionnaire
Deutsche Post AG Air Freight & Logistics Answered questionnaire Answered questionnaire
Deutsche Postbank AG – see Deutsche Post Banks – Europe Answered questionnaire Answered questionnaire
Deutsche Telekom AG Integrated Telecommunication Services Answered questionnaire Answered questionnaire
Deutsche Wohnen AG Financial services Not in CDP4 Answered questionnaire
DEUTZ AG Industrial Machinery Decline to participate No response
DIC Asset AG Financial services Not in CDP4 Decline to participate
DIS Deutscher Industrie Service AG Industrial No response No response
Douglas Holding AG Specialty Retail Information provided No response
Draegerwerk AG Health Care Equipment & Supplies No response No response
Duerr AG Industrial Machinery No response Decline to participate
DVB Bank AG Banks – Europe Not in CDP4 Answered questionnaire
Dyckerhoff AG Construction Materials No response No response
E.ON AG Electric Utilities – International Answered questionnaire Answered questionnaire
EADS Aerospace & Defense Answered questionnaire Answered questionnaire
Eisen- und Huettenwerke AG Construction Materials Not in CDP4 Answered questionnaire – see ThyssenKrupp AG
ElringKlinger AG Auto Components No response Answered questionnaire
EM.TV AG Movies & Entertainment Answered questionnaire No response
EnBW Energie Baden-Württemberg Electric Utilities – International Answered questionnaire Answered questionnaire
EPCOS AG Electronic Equipment & Instruments Answered questionnaire Answered questionnaire
ERGO Versicherungsgruppe AG Insurance – Europe Not in CDP4 Answered questionnaire
ErSol Solar Energy AG Industrial Renewables Answered questionnaire Answered questionnaire
Escada AG Textiles, Apparel & Luxury Goods No response Decline to participate
Eurohypo AG Diversified Financials – Europe No response No response
Fielmann AG Specialty Retail No response No response
Francotyp-Postalia Holding AG Industrial Not in CDP4 Answered questionnaire
Fraport AG Surface Transport Answered questionnaire Answered questionnaire
freenet.de AG Software No response No response
Fresenius AG Health Care Equipment & Supplies Information provided Information provided
Fresenius Medical Care KGaA Health Care Providers & Services Decline to participate Information provided
FUCHS PETROLUB AG Specialty Chemicals Answered questionnaire Answered questionnaire
GEA Group AG Commodity Chemicals Decline to participate Answered questionnaire
Gelsenwasser AG Water Utilities No response No response
GERRY WEBER INTERNATIONAL AG Textiles, Apparel & Luxury Goods Decline to participate Information provided
GfK Group Industrial Products & Services Information provided Answered questionnaire
GILDEMEISTER AG Industrial Machinery No response No response
GPC Biotech AG Biotechnology No response Answered questionnaire
Grammer AG Auto Components No response No response
GRENKELEASING AG Diversified Financials – Europe Decline to participate Decline to participate
H&R WASAG AG Specialty Chemicals No response No response
Hannover Rückversicherung AG Insurance – Europe Answered questionnaire Answered questionnaire
HCI Capital AG Diversified Financials – Europe No response Answered questionnaire
HeidelbergCement AG Construction Materials No response Answered questionnaire
271334_CDP_Rep_2007_engl_f:CDP_Bericht_2007 22.10.2007 10:34 Uhr Seite 55

Appendix
Carbon Disclosure Project 200756
Name Sector CDP4 CDP5
Heidelberger Druckmaschinen AG Industrial Machinery Answered questionnaire Answered questionnaire
Henkel KGaA Household & Personal Products Answered questionnaire Answered questionnaire
HOCHTIEF AG Construction & Engineering Answered questionnaire Answered questionnaire
Hornbach Holding AG Specialty Retail Decline to participate Answered questionnaire
HUGO BOSS AG Textiles, Apparel & Luxury Goods Decline to participate No response
Hymer AG Leisure Equipment & Products Decline to participate No response
Hypo Real Estate Holding AG Diversified Financials – Europe Decline to participate Answered questionnaire
IDS Scheer AG Software Decline to participate Decline to participate
IKB Deutsche Industriebank AG Banks – Europe Decline to participate No response
INDUS Holding AG Diversified Industrial Decline to participate Decline to participate
Infineon Technologies AG Semiconductor Equipment & Products Answered questionnaire Decline to participate
Interhyp AG Diversified Financials – Europe Decline to participate Answered questionnaire
INTERSEROH Aktiengesellschaft Steel Decline to participate Answered questionnaire zur Verwertung von Sekundärrohstoffen
IVG Immobilien AG Real Estate Investment Trusts Decline to participate Answered questionnaire
IWKA AG Industrial Machinery Decline to participate Information provided
Jenoptik AG Industrial Machinery Decline to participate Answered questionnaire
Jungheinrich AG Industrial Machinery Decline to participate Decline to participate
K + S AG Specialty Chemicals Answered questionnaire Answered questionnaire
KarstadtQuelle AG Multiline Retail Decline to participate Answered questionnaire
Klöckner-Werke AG Industrial Machinery Decline to participate No response
Kölnische Rückversicherungs-Gesellschaft AG Insurance – Europe Not in CDP4 No response
Koenig & Bauer AG Industrial Machinery Decline to participate Answered questionnaire
Kolbenschmidt Pierburg AG Auto Components Not in CDP4 No response
Kontron AG Electronic Equipment & Instruments No response No response
Krones AG Industrial Machinery No response Answered questionnaire
KSB AG Industrial Products & Services No response Decline to participate
KWS SAAT AG Food Products No response Decline to participate
Landesbank Berlin Holding AG Banks – Europe Not in CDP4 Decline to participate
Lanxess AG Specialty Chemicals Answered questionnaire Answered questionnaire
Lechwerke AG Electric Utilities – International Not in CDP4 No response
Leoni AG Auto Components No response Decline to participate
Linde AG Industrial Machinery Answered questionnaire Answered questionnaire
MAN AG Industrial Machinery Answered questionnaire Answered questionnaire
Mannheimer AG Holding Insurance – Europe Not in CDP4 Decline to participate
MEDION AG Specialty Retail No response Answered questionnaire
Merck KGaA Pharmaceuticals No response Decline to participate
Metro AG Multiline Retail Answered questionnaire Answered questionnaire
MLP AG Diversified Financials – Europe Information provided Answered questionnaire
Mobilcom AG Wireless Telecommunication Services No response No response
MorphoSys AG Biotechnology Decline to participate Answered questionnaire
MPC Capital AG Diversified Financials – Europe Answered questionnaire Decline to participate
MTU Aero Engines Holding AG Industrial Machinery No response Answered questionnaire
Munich Re Insurance – Europe Answered questionnaire Answered questionnaire
MVV Energie AG Multi-Utilities & Unregulated Power No response Answered questionnaire
Norddeutsche Affinerie AG Steel Answered questionnaire Answered questionnaire
Nordex AG Industrial Renewables No response Answered questionnaire
Nürnberger Beteiligungs-AG Insurance – Europe Decline to participate No response
OVB Holding AG Diversified Financials – Europe Not in CDP4 Answered questionnaire
Patrizia Immobilien AG Financial services Not in CDP4 Decline to participate
Pfeiffer Vacuum Technology AG Industrial Machinery No response Answered questionnaire
Pfleiderer AG Industrial Products & Services No response Answered questionnaire
Phoenix AG Industrial Products & Services No response Decline to participate
Pilkington Deutschland AG Industrial Products & Services Not in CDP4 Decline to participate
271334_CDP_Rep_2007_engl_f:CDP_Bericht_2007 22.10.2007 10:34 Uhr Seite 56

Appendix
Carbon Disclosure Project 2007 57
Name Sector CDP4 CDP5
Porsche AG Automobiles Decline to participate No response
Praktiker Bau- und Heimwerkermärkte AG Specialty Retail Decline to participate Decline to participate
Premiere AG Broadcasting & Cable TV Information provided Answered questionnaire
Princess Private Equity Holding Limited Diversified Financials – Europe Not in CDP4 Decline to participate
ProSieben/Sat.1 Media AG Broadcasting & Cable TV Decline to participate No response
Puma AG Textiles, Apparel & Luxury Goods Information provided Answered questionnaire
Q-Cells AG Industrial Renewables No response Answered questionnaire
QSC AG Integrated Telecommunication Services No response Answered questionnaire
Rational AG Industrial Products & Services Decline to participate Answered questionnaire
REpower Systems AG Electric Utilities – International No response Answered questionnaire
Rheinmetall AG Industrial Conglomerates Decline to participate No response
Rhon Klinikum AG Health Care Providers & Services No response Answered questionnaire
Rofin-Sinar Technologies Inc. Industrial Machinery Answered questionnaire Answered questionnaire
RSE Grundbesitz und Beteiligungs-AG Diversified Financials – Europe Not in CDP4 No response
RWE AG Electric Utilities – International Answered questionnaire Answered questionnaire
Saint-Gobain Oberland AG – Materials Not in CDP4 Answered questionnaire see Saint Gobain (Frankreich)
Salzgitter AG Stahl und Technologie Steel Decline to participate Decline to participate
SAP AG Software Answered questionnaire Answered questionnaire
SAP Systems Integration AG – see SAP AG Software Decline to participate Answered questionnaire
Sartorius AG Industrial Machinery Answered questionnaire No response
SCA Hygiene Products AG Household & Personal Products No response No response
Schering AG – see Bayer AG Pharmaceuticals Decline to participate Answered questionnaire
Schmack Biogas AG Industrial Not in CDP4 No response
Schwarz Pharma AG Pharmaceuticals Answered questionnaire Answered questionnaire
SGL Carbon AG Specialty Chemicals Decline to participate No response
SHB Stuttgarter Finanz- und Beteiligungs-AG Diversified Financials – Europe No response No response
Siemens AG Industrial Conglomerates Answered questionnaire Answered questionnaire
Singulus Technologies AG Electronic Equipment & Instruments Answered questionnaire Answered questionnaire
Sixt AG Surface Transport Decline to participate No response
Software AG Software Information provided Answered questionnaire
SolarWorld AG Industrial Renewables Answered questionnaire Answered questionnaire
Stada Arzneimittel AG Pharmaceuticals Decline to participate Decline to participate
Strabag AG Construction & Engineering No response No response
Südzucker AG Mannheim/Ochsenfurt Food Products No response Decline to participate
SURTECO AG Consumer Not in CDP4 Decline to participate
Symrise AG Chemicals Not in CDP4 Answered questionnaire
TAKKT AG Multiline Retail Answered questionnaire Answered questionnaire
Techem AG Industrial Products & Services No response No response
Telegate AG Telecommunications Not in CDP4 No response
Thielert AG Steel Answered questionnaire Answered questionnaire
ThyssenKrupp AG Diversified Industrial Answered questionnaire Answered questionnaire
TUI AG Hotels, Restaurants & Leisure Answered questionnaire Answered questionnaire
United Internet AG Software Decline to participate Decline to participate
Vattenfall Europe AG Electric Utilities – International No response Answered questionnaire
Vivacon AG Real Estate Investment Trusts No response No response
Volkswagen Automobiles Answered questionnaire Answered questionnaire
Vossloh AG Industrial Products & Services Decline to participate Answered questionnaire
Wacker Chemie AG Chemicals Not in CDP4 Answered questionnaire
Wella AG – see Procter & Gamble Consumer Not in CDP4 Information provided
Wincor Nixdorf AG Computers & Peripherals Answered questionnaire Answered questionnaire
Wirecard AG Software Not in CDP4 No response
Wüstenrot & Württembergische AG Diversified Financials – Europe No response No response
271334_CDP_Rep_2007_engl_f:CDP_Bericht_2007 22.10.2007 10:34 Uhr Seite 57

Appendix
Carbon Disclosure Project 200758
Following successful expansion in CDP4,the CDP5 universe was expanded evenfurther in 2007 to include over 2,400 com-panies. This was made possible by six-teen geographical and two sector expan-sions. This section provides details ofthese partnerships, the overall responserates, and some headline analysis of thekey trends.
Please visit the CDP websitewww.cdproject.net in order to view anddownload the analytical reports based onthe responses from the specific geograph-ical locations. Reports will be available forthe Asia, Australia & New Zealand, Brazil,Canada, France, Germany, India, Japan,Scandinavia, South Africa, Switzerland,UK and USA samples.
The key trends from CDP expansionshighlighted in the table overleaf produce anumber of interesting findings, includingthe fact that the majority of respondingcompanies around the world see climatechange as posing commercial risks. Withthe lowest rate of companies recognizingpotential impacts showing 72 percent, it istelling that the majority of businesses areidentifying climate change as an imminentthreat. With the Brazilian rate at 100 per-cent of responding companies recognizinghazards, the FTSE 100 at 98 percent, andthe Australia 150 at 97 percent, thesesamples are showing that corporateawareness of risks is high.
Unlike other analysis, the graph abovereflects all responses received up toAugust 2007.The graph below shows theresponse rates from the various regionslast year in CDP4.If business wants to bea significant force in addressing climatechange, it is equally important that corpo-rations recognize the opportunity andpotential to adjust to shifting markets,resource availability, government regula-tion and consumer demand. The recogni-tion of business opportunities corre-sponds accordingly to the trends con-cerning risks, showing that the potentialfor development is already being integrat-ed to corporate planning.
In ten of the samples, the recognition ofopportunities was actually higher than therecognition of risk, showing market fore-sight alongside possible product develop-ment.
Key trends from CDP geographic and sectorexpansions
It should be noted that the questionsregarding management strategies andtrading opportunities were only answeredby corporations who completed the entirequestionnaire (Section B). As it was notmandatory, this can account for the lowerpercentages witnessed in the table outlin-ing key trends above. Additionally, thequestion regarding emissions tradingschemes is expected to be lower, withmany companies falling outside the scopeof such schemes. Interestingly the numberof companies in developing countriessuch as Brazil, India and South Africa whosee emissions trading opportunities ishigher than companies based in Europeshowing high interest in the CDM market.
While the emissions target question islocated within Section B, there is anopportunity for companies to disclose tar-get information at the end of Section A,Question 1(d), so all responses shouldhave been included in the analysis. Allcompanies were asked if they have anemissions reduction target. Many compa-nies do have reduction programmes inplace however the question specificallyasks for targets and unless those weredisclosed, the response was not countedin the analysis. As such, the average num-ber of companies with a specific reductiontarget stands close to 50 percent, show-ing robust leadership in setting reductiontargets. The FT500 and Japanese 150companies stand out as the two samplesworking most stringently to limit theiremissions. Whilst we have seen a greatincrease in the number of companies set-ting emission reduction targets thisremains an area for global improvement.
271334_CDP_Rep_2007_engl_f:CDP_Bericht_2007 22.10.2007 10:34 Uhr Seite 58

Appendix
Carbon Disclosure Project 2007 59
Sample(Number of Companiees)
� No Response
� Participation declined
� Provided Informations
� Answered Questionnaire% Answered Questionnaire
Table 7: CDP5 Response by region/sector
FTSE100(100)
621
9191
Brazil60(57)
362
4681
Switzer-land 50
(50)
650
3978
GlobalFT500(500)
623916
38377
Japan150(151)
3243
11274
Scan-din. 125
(125)
12216
8486
SouthAfrica 40
(38)
831
2668
UK FTSE250(250)
473718
14859
France120(120)
40103
6756
USAS&P 500
(500)
1177625
28256
Germany200(200)
54357
10452
Austr./NZ150(141)
45206
7050
ElectricUtilities(240)
951616
11347
Transp.100(100)
33128
4747
Canada200(194)
43582
9147
Italy40(40)
2011
1845
India110(110)
7020
3835
Asia80(77)
14444
1519
100 %
90 %
80 %
70 %
60 %
50 %
40 %
30 %
20 %
10 %
Sample(Number of Companiees)
� No Response
� Participation declined
� Provided Informations
� Answered Questionnaire% Answered Questionnaire
FTSE100(100)
52
108383
FT500(500)
524642
36072
Japan
(152)
50439562
Brazil
(50)
9110
3060
Austr./NZ
(134)
41267
6045
S&P500(500)
1893552
22445
France120(120)
43185
5445
ElectricUtilities(265)
904320
11242
FTSE250(250)
9429388935
Asia
(39)
11123
1333
Germany
(200)
6760106331
Canada
(280)
13355147828
100 %
90 %
80 %
70 %
60 %
50 %
40 %
30 %
20 %
10 %
Table 8: CDP4 Response by region/sector
271334_CDP_Rep_2007_engl_f:CDP_Bericht_2007 22.10.2007 10:34 Uhr Seite 59

Appendix
Carbon Disclosure Project 200760
Table 9: International key trends
Number ofresponsesanalysed**
Responding companies thatsaid they considerclimate change to represent commercial risks
Responding companies thatsaid they considerclimate change to represent commercial opportunities
Responding companies thatdisclosed theirGHG data
Responding com-panies that allocat-ed board-level orupper managementresponsibility forclimate change-related issues*
Responding companies thatconsidered emissions tradingopportunities*
Responding companies thatimplemented emission reductionprograms withtarets*
77 % 79 % 49 % 38 % 47 % 38 % 15
97 % 89 % 60 % 93 % 77 % 36 % 68
100 % 100 % 59 % 59 % 61 % 52 % 46
85 % 86 % 66 % 53 % 27 % 24 % 86
90 % 95 % 79 % 70 % 54 % 44 % 113
88 % 84 % 72 % 34 % 31 % 43 % 67
80 % 82 % 79 % 64 % 46 % 77 % 378
98 % 82 % 83 % 53 % 38 % 41 % 91
83 % 80 % 69 % 24 % 2 % 37 % 151
77 % 80 % 67 % 38 % 20 % 35 % 104
79 % 84 % 39 % 39 % 47 % 34 % 38
89 % 83 % 89 % 33 % 33 % 22 % 18
78 % 82 % 95 % 93 % 69 % 81 % 112
81 % 69 % 65 % 50 % 36 % 29 % 269
81 % 80 % 76 % 41 % 37 % 23 % 77
80 % 92 % 56 % 60 % 44 % 44 % 25
72 % 77 % 72 % 36 % 15 % 44 % 39
83 % 85 % 77 % 79 % 42 % 46 % 48
Asia 80
Austr. & NZ 150
Brazil 60
Canada 200
Electric Utilities
France 120
FT500
FTSE100
FTSE250
Germany 200
India 110
Italy 40
Japan 150
S&P 500
Scandinavia125
South Africa 40
Switzerland 50
Transport 100
International Key Trends
* Section B responses only.
**Some responses will have been received after this analysis was carried out, the analysis was carried out by different report writers.
271334_CDP_Rep_2007_engl_f:CDP_Bericht_2007 22.10.2007 10:34 Uhr Seite 60

Appendix
Carbon Disclosure Project 2007 61
Country/Expansion Partner Web Address
Asia Association for Sustainable and Responsible Investment in Asia (ASrIA) www.asria.org
Australia & New Zealand Investor Group on Climate Change (IGCC) www.igcc.org
Brazil Banco ABN Amro Real www.abnamro.com
ABRAPP www.abbrapp.org.br
Fabrica Ethica www.fabricaethica.com.br
Canada Conference Board of Canada www.conferenceboard.ca
Electric Utilities CDP Secretariat www.cdproject.net
France AXA www.axa.com
Agence de l’Environnement et de la Maitrise de l’Energie (ADEME) www.ademe.fr
BNP Paribas www.bnpparibas.com
Germany BVI Bundesverband Investment und Asset Management e.V. www.bvi.de
WWF Germany www.wwf.de
India Confederation of Indian Industry www.ciionline.org
WWF India www.wwfindia.org
Italy CDP Secretariat Europe www.cdproject.net
Japan CDP Secretariat Japan www.cdproject.net
Nordic Region CDP Nordic Secretariat www.cdproject.net
KLP www.klp.no
Folksam www.folksam.se
Nutek (Swedish Agency for Economic & Regional Growth) www.nutek.se
South Africa Incite www.incite.co.za
National Business Initiative (NBI) www.nbi.org.za
Switzerland Ethos www.ethosfund.ch
Pictet Asset Management www.pictet.com
Transport CDP Secretariat www.cdproject.net
United Kingdom Department for Environment, Food and Rural Affairs (DEFRA) www.defra.gov.uk
United Kingdom – Adaptation UK Climate Impacts Programme www.ukcip.org.uk
USA Merrill Lynch www.ml.com
CDP Secretariat www.cdproject.net
Table 10: Partners of CDP
271334_CDP_Rep_2007_engl_f:CDP_Bericht_2007 22.10.2007 10:34 Uhr Seite 61

Carbon Disclosure Project 200762
271334_CDP_Rep_2007_engl_f:CDP_Bericht_2007 22.10.2007 10:34 Uhr Seite 62

Imprint
© BVI Bundesverband Investmentund Asset Management e. V.
Eschenheimer Anlage 2860318 Frankfurt am MainTelefon 0 69/15 40 90-0Telefax 0 69/5 9714 [email protected]
Author: Professor Dr. Alexander BassenPrint and Design: Druck- und Verlagshaus Zarbock GmbH & Co. KG, Frankfurt am Main
This brochure has been printed in a FSC certified company, using a recycling paper consisting of 100 percent recovered paper.
978-3-937790-17-6
271334_CDP_Rep_2007_engl_f:CDP_Bericht_2007 22.10.2007 10:33 Uhr Seite U3

Contacts
Carbon Disclosure ProjectPaul DickinsonExecutive Director+44 7958 772 [email protected] Farringdon RoadLondonEC1M 3JBUnited Kingdomwww.cdproject.net
BVI Bundesverband Investmentund Asset Management e. V.Rudolf SiebelManaging Director+49 69 [email protected] Anlage 2860318 Frankfurt am MainGermanywww.bvi.de
Professor Dr. Alexander BassenUniversität HamburgVon-Melle-Park 920146 Hamburg+49 40 42 838 [email protected]
Bundesverband Investment und Asset Management e. V.Eschenheimer Anlage 28 · 60318 Frankfurt am MainTelefon 0 69/15 40 90-0 · Telefax 0 69/5 9714 [email protected] · www.bvi.de
Supported by:
WWFMatthias KoppProjectlead Finance & Energy+49 30 3087 [email protected]ße Präsidentenstraße 1010178 BerlinGermanywww.wwf.de
271334_CDP_Rep_2007_engl_f:CDP_Bericht_2007 22.10.2007 10:33 Uhr Seite U4