Carbon credits and insurance Can insurance address the ...aida.org.uk/pdf/CC Cedric Wells.pdf ·...
103
Ecole nationale d'assurances l’Enass Ecole nationale d’assurances Carbon credits and insurance Can insurance address the current and future needs of the industries? Cédric WELLS
Transcript of Carbon credits and insurance Can insurance address the ...aida.org.uk/pdf/CC Cedric Wells.pdf ·...

Ecole nationale d'assurances
l’EnassEcole nationale d’assurances
Carbon credits and insurance
Can insurance address the current and future needs of the industries?
Cédric WELLS

Cedric Wells - MBA ENASS 2009-2011 - Carbon credits and Insurance 2
TABLE OF CONTENTS
PARAGRAPH PAGE
Executive Summary .................................................................................................................................4 Key words ................................................................................................................................................5 Acknowledgment .....................................................................................................................................5 Reasons for choosing carbon credit insurance as a topic .........................................................................8 Methodology ............................................................................................................................................8 List of acronyms and abbreviations .......................................................................................................11
INTRODUCTION ....................................................................................................................................12
(1) INSURANCE AND CLIMATE CHANGE ................................................................................................12
a. Global initiatives and calls from insurers’ associations ................................................................12 b. New business opportunities ..........................................................................................................13
(2) BASIC TERMINOLOGY ......................................................................................................................13
a. Carbon emissions ..........................................................................................................................13 b. Cap and trade schemes ..................................................................................................................15
(3) SCOPE OF THIS STUDY ......................................................................................................................16
1. MANAGING CARBON CREDIT RISKS ........................................................................................18
1.1 LEGAL FRAMEWORK........................................................................................................................19
a. UN Framework Convention on Climate Change (UNFCCC) ......................................................19 b. The EU paving the way for mandatory cap and trade schemes ....................................................21 c. Other carbon cap and trade schemes throughout the world ..........................................................24 d. Linking the schemes together .......................................................................................................29
1.2 STAKEHOLDERS AT RISK .................................................................................................................30
a. Installations currently subject to the ETS .....................................................................................30 b. Extension of the ETS to additional sectors ...................................................................................31 c. Gases covered by the ETS ............................................................................................................33 d. Carbon finance parties at risk in CDM/JI projects ........................................................................33 e. Risks raised by the ETS ................................................................................................................35
1.3 COMPANIES ARE AWARE OF THE COSTS AND RISKS OF THE ETS .................................................39
a. Reducing energy costs is a priority irrespective of the ETS .........................................................39 b. Carbon credits so far have made companies richer .......................................................................41 c. Carbon credits are now recognized as a production cost ..............................................................43 d. Hedging solutions available on the financial markets ...................................................................44
2. THE INSURANCE RESPONSE ........................................................................................................48
2.1 LIMITED PERCEIVED NEED FOR SPECIFIC CARBON INSURANCE ...................................................49
a. A risk companies will typically retain ..........................................................................................49 b. Increased cost of working already covered by conventional PD/BI coverage ..............................52
2.2 COVERAGE AVAILABLE FOR NON-DELIVERY RISKS ......................................................................54
a. Purpose of non-delivery insurance ................................................................................................54 b. Products available .........................................................................................................................56 c. Insurance markets .........................................................................................................................57

Cedric Wells - MBA ENASS 2009-2011 - Carbon credits and Insurance 3
2.3 WHY OFFER AND DEMAND FOR NON-DELIVERY INSURANCE HAVE NOT YET MET ......................60
a. CDM/JI projects mostly involve quite typical risks ......................................................................60 b. Regulatory risks a key issue ..........................................................................................................62 c. Room for improvement .................................................................................................................66 d. Prospects for the future .................................................................................................................69
3. UNDERWRITING CHALLENGES ..................................................................................................75
3.1 INSURABILITY ...................................................................................................................................76
a. Where are the limits? ....................................................................................................................76 b. How do carbon credit risks match essential characteristics of insurability? .................................76
3.2 RISK ASSESSMENT ............................................................................................................................79
a. Actuarial considerations (regulatory risk) .....................................................................................79 b. Alternative solutions .....................................................................................................................82 c. Underwriting information .............................................................................................................83 d. Assessing the quality of a project .................................................................................................85 e. Consideration of the specific identity and needs of an insured party ............................................86
3.3 DEALING WITH VOLATILITY ...........................................................................................................87
a. Carbon credit prices ......................................................................................................................87 b. Moderating volatility.....................................................................................................................91
3.4 CONTRACT CERTAINTY ...................................................................................................................93
a. Including CER cover in conventional PD/BI cover a risk in itself? .............................................93 b. Valuation of loss ...........................................................................................................................95 c. Due diligence and duty to mitigate losses .....................................................................................97 d. Salvage stemming from “outage credits” to be set-off claims ......................................................98
CONCLUSION .......................................................................................................................................101

Cedric Wells - MBA ENASS 2009-2011 - Carbon credits and Insurance 4
Executive Summary
Greenhouse gas (GHG) emissions regulation is expanding worldwide with the implementation of
new cap and trade systems and the development of existing ones.
The EU Emissions Trading Scheme (ETS) sets a cap on GHGs emitted by energy-intensive
industries in the EU. Emissions beyond that cap must be compensated for either by paying
penalties or by purchasing carbon credits in the form of EU Allowances or carbon “offsets”
obtained from Kyoto Protocol-based Clean Development Mechanism (CDM) or Joint
Implementation (JI) projects.
Until recently, companies have received more allowances than they needed. This will change with
Phase 3 of the ETS (starting in 2013): fewer allowances (a majority of which will be auctioned
rather than granted for free), fewer admissible types of offsets and new sectors involved. Carbon
credit prices are expected to rise as a result.
Carbon-related costs are treated as production costs which companies typically retain and reflect in
their business decisions. Volatility risk can be hedged through flexible price clauses in sales
agreements and through financial products available from the carbon markets. Companies have
therefore seldom sought to transfer any carbon risk to insurance.
Whilst increasing efforts and capital are dedicated to reducing energy costs, companies face new
risks with more restricting compliance requirements.
Firstly, industries can suffer a Business Interruption loss following the failure of (or damage to) a
production unit. Loss mitigation efforts may involve the temporary use of less energy efficient
spare units (and the fuel they use) which may trigger the need to purchase carbon credits to make-
up for the increased emissions so caused. Such additional costs are generally covered under the
Increased Cost of Working section of conventional PD/BI policies.
Secondly, companies involved either as owners, developers, financiers or investors in a CDM/JI
project all face the risk of non (or late) delivery of carbon offsets which can be due to a wide
spectrum of risks such as climatic, technologic, political, credit, insolvency and/or regulatory.
Coverage for “non-delivery” risks can be found with several insurers however sales, if any, have
been very limited to date. Insurers have also failed to attract the necessary levels of insurance
capacity that such projects require. Sales are expected to improve, albeit a at a slow pace, with the
economic recovery and more restrictive cap and trade rules.
Regulatory risks are a major area of uncertainty for CDM/JI stakeholders. Most insurers believe
there is no meaningful data to assess them. In 2010, the UN Emissions Board postponed the
delivery of more than half of the offsets generated by CDM projects worldwide. Price volatility is
also a sensitive risk. It can be covered subject to a cap (as is the case in other risks involving
commodities).
Current policy wordings must address the specificities of carbon credits (focusing particularly
relating to loss valuation and mitigation) failing which contractual disputes will undoubtedly arise.

Cedric Wells - MBA ENASS 2009-2011 - Carbon credits and Insurance 5
Key words
Business Interruption; Cap and Trade Scheme; Carbon Credit; Carbon Credit Non-Delivery
Insurance; Clean Development Mechanism; Increased Cost of Working (ICW); European Union
Emissions Trading Scheme (EU ETS); Greenhouse Gas Emissions (GHG emissions); Insurance;
Kyoto Protocol; Regulatory risks; Volatility risk.
Acknowledgment
The author wishes to address special thanks to:
- Grégory Soudan, Research Director at SCOR, for his guidance, expertise and stimulating
thoughts,
- Jillian Raw (Kennedys), Jan Holzapfel (Captive Mutual) and Jason Reeves (Zelle Hofman) for
their invaluable input, ideas and for proof reading this study,
- His wife and baby daughter for putting up with the constraints which this work has imposed on
their lives.
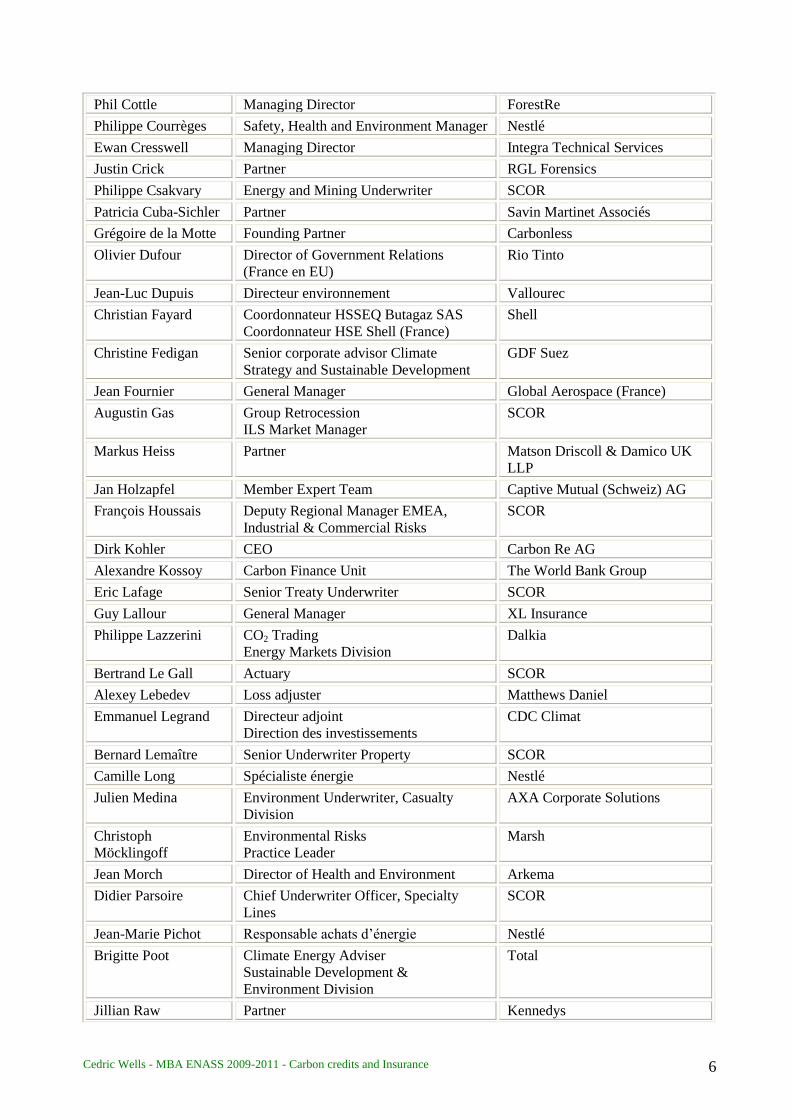
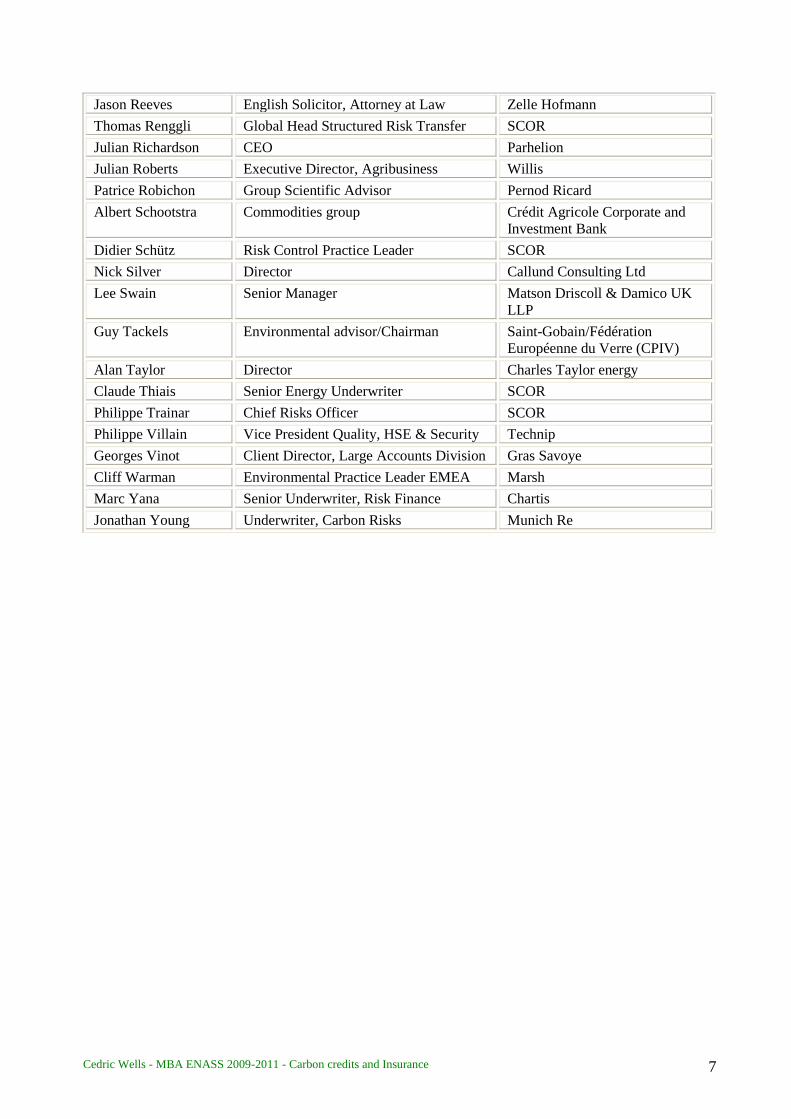
The author also wishes to thank the following individuals who were interviewed in connexion with
this survey:
Person Title Company
Pierre Albano Vice President Environment,
Environment and Sustainable
Development
Air France
Basak Beyazay Emissions Trading Manager Total
Eric Beyma
Energy consultant, Director of
Environment AMEA
France Telecom
Nicolas Boquet Directeur environnement AFEP
Mohamed Bouayad Actuary SCOR
Estelle Bouquet Energy and Mining Underwriter SCOR
Jamie Brache Vice President
Political Risk Insurance and Trade Credit
Zurich Financial Services
Marc Buker Treaty Underwriter SCOR
Gaëtan Cadero Climate Change Initiatives Manager Lafarge
Jean-Manuel Canet Senior Manager Orange Consulting Services
Joffrey Celestin-
Urbain
(at the time of the interview)
Head of carbon markets division
General Directorate for Energy
and Climate Change,
French Ministry of Ecology,
Energy, Sustainable
Development and the Sea
Julien Colas Carbon Project Manager Saint Gobain
Patricia Cortijo (at the time of the interview)
Environment Director
Sustainable Development Department
Accor
Cedric Wells - MBA ENASS 2009-2011 - Carbon credits and Insurance 6
Phil Cottle Managing Director ForestRe
Philippe Courrèges Safety, Health and Environment Manager Nestlé
Ewan Cresswell Managing Director Integra Technical Services
Justin Crick Partner RGL Forensics
Philippe Csakvary Energy and Mining Underwriter SCOR
Patricia Cuba-Sichler Partner Savin Martinet Associés
Grégoire de la Motte Founding Partner Carbonless
Olivier Dufour Director of Government Relations
(France en EU)
Rio Tinto
Jean-Luc Dupuis Directeur environnement Vallourec
Christian Fayard Coordonnateur HSSEQ Butagaz SAS
Coordonnateur HSE Shell (France)
Shell
Christine Fedigan Senior corporate advisor Climate
Strategy and Sustainable Development
GDF Suez
Jean Fournier General Manager Global Aerospace (France)
Augustin Gas Group Retrocession
ILS Market Manager
SCOR
Markus Heiss Partner Matson Driscoll & Damico UK
LLP
Jan Holzapfel Member Expert Team Captive Mutual (Schweiz) AG
François Houssais Deputy Regional Manager EMEA,
Industrial & Commercial Risks
SCOR
Dirk Kohler CEO Carbon Re AG
Alexandre Kossoy Carbon Finance Unit The World Bank Group
Eric Lafage Senior Treaty Underwriter SCOR
Guy Lallour General Manager XL Insurance
Philippe Lazzerini CO2 Trading
Energy Markets Division
Dalkia
Bertrand Le Gall Actuary SCOR
Alexey Lebedev Loss adjuster Matthews Daniel
Emmanuel Legrand Directeur adjoint
Direction des investissements
CDC Climat
Bernard Lemaître Senior Underwriter Property SCOR
Camille Long Spécialiste énergie Nestlé
Julien Medina Environment Underwriter, Casualty
Division
AXA Corporate Solutions
Christoph
Möcklingoff
Environmental Risks
Practice Leader
Marsh
Jean Morch Director of Health and Environment Arkema
Didier Parsoire Chief Underwriter Officer, Specialty
Lines
SCOR
Jean-Marie Pichot Responsable achats d’énergie Nestlé
Brigitte Poot Climate Energy Adviser
Sustainable Development &
Environment Division
Total
Jillian Raw Partner Kennedys
Cedric Wells - MBA ENASS 2009-2011 - Carbon credits and Insurance 7
Jason Reeves English Solicitor, Attorney at Law Zelle Hofmann
Thomas Renggli Global Head Structured Risk Transfer SCOR
Julian Richardson CEO Parhelion
Julian Roberts Executive Director, Agribusiness Willis
Patrice Robichon Group Scientific Advisor Pernod Ricard
Albert Schootstra Commodities group Crédit Agricole Corporate and
Investment Bank
Didier Schütz Risk Control Practice Leader SCOR
Nick Silver Director Callund Consulting Ltd
Lee Swain
Senior Manager Matson Driscoll & Damico UK
LLP
Guy Tackels Environmental advisor/Chairman Saint-Gobain/Fédération
Européenne du Verre (CPIV)
Alan Taylor Director Charles Taylor energy
Claude Thiais Senior Energy Underwriter SCOR
Philippe Trainar Chief Risks Officer SCOR
Philippe Villain Vice President Quality, HSE & Security Technip
Georges Vinot Client Director, Large Accounts Division Gras Savoye
Cliff Warman Environmental Practice Leader EMEA Marsh
Marc Yana Senior Underwriter, Risk Finance Chartis
Jonathan Young Underwriter, Carbon Risks Munich Re

Cedric Wells - MBA ENASS 2009-2011 - Carbon credits and Insurance 8
Reasons for choosing carbon credit insurance as a topic
The writer handles large insurance and reinsurance claims submitted by companies from various
industrial sectors inter alia energy, mining, onshore/offshore, space and construction. Claims are
typically made for Physical Damage (PD) and subsequent Business Interruption/Loss of Turnover
(BI) losses.
In the past years, the value of BI claims as compared to that of PD claims has risen significantly
(roughly from one third to two thirds). A major reason for this is the severe price spikes of the
various commodities which the affected productions involve (e.g. copper or coal).
A number of items may fall under the BI section of a policy. Carbon credits are one of them and
although today they tend to lead to savings which insurers deduct from the claims they pay, they
will result in sizeable losses when the (awaited) more restrictive ETS Phase 3 rules are
implemented. The carbon credit issue will also go global as other cap and trade schemes
throughout the world are established.
New risks have also emerged in connection with the so-called Kyoto Protocol “flexible
mechanisms” which enable companies, (a) to generate carbon offsets (or purchase them) for
compliance reasons, or (b) to trade them.
The topic is therefore of interest to claim handlers but also to underwriters and their clients when
negotiating the premium, scope, terms and conditions of a policy (or a reinsurance contract in the
presence of captive insurance companies) that involves carbon credits in some way or another.
Reinsurers will also be keen to examine how carbon credits are treated by their cedants’
underwriting policies.
New risks could mean new insurance needs if companies are willing to transfer them. Assuming
these can be met, wordings must adapt to reflect the specificities of carbon credits in a way to
prevent ambiguity and disputes.
Methodology
1. Research
Extensive research has been conducted with regards to the following topics:
EU ETS regulation
Other carbon credit schemes throughout the world
Energy costs to industries
Carbon credit trading
Existing solutions in terms of transfer of carbon-related risks to the insurance and financial
markets
The concept of insurability
The formation of carbon credit prices

Cedric Wells - MBA ENASS 2009-2011 - Carbon credits and Insurance 9
2. Interviews
Because literature pertaining to carbon credit insurance is so scarce (which is not the case of
carbon credit business and trading), this study relies predominantly on information provided by the
practitioners of the industries concerned with one or more cap and trade schemes.
Interviews have been conducted between July 2010 and February 2011 in French or in English
language with over 60 persons representing 45 institutions of the following sectors and
professions:
Energy-intensive industries
Industries not (yet) subject to the ETS
Insurance and Reinsurance companies
Insurance brokers
Law firms
Loss adjusters and forensic experts
Trading desks
Carbon credit funds
Consultants
Administration
When first contacted, prospect interviewees were presented with a five-page document which
included: (a) an abstract of the topics which this study aimed at discussing, (b) a description of the
methodology which the writer intended to use for his research and, (c) a draft executive summary
of the study itself. The latter was improved as progress was made in the author’s research and
interviews.
Interviewees were then sent a list of specific questions for discussion ahead of the meetings or
conference calls.
Meetings generally lasted between 45 and 90 minutes.
Every interviewee was asked to (a) approve minutes of a meeting or conference call, (b) advise
whether any of its contents should remain confidential, and (c) whether they wished not to be
quoted on any particular statement made. A very limited number of interviewees have in fact
requested that part or whole of the minutes be redacted or not attributable to them or to their
company.
3. Feedback
For practical reasons, a large majority of the interviews involved global companies with their
headquarters and/or activities in France. The writer believes that the feedback should provide a
meaningful sampling of the views of those companies that have a direct or an indirect interest in
the ETS.
Regrettably, no more than 1 in 3 persons contacted responded to the author’s request for an
interview. The response from the energy and utilities sector has been rather limited. It should be
noted however those that did respond have shown a high level of interest in the proposed research
and its conclusions. In most instances, the survey has been perceived by the industries as
prospective but timely given that Phase 3 of the ETS starts in 2013.

Cedric Wells - MBA ENASS 2009-2011 - Carbon credits and Insurance 10
Insurers that currently deliver carbon credit-related coverage have also been very open to
discussing the way they elaborated such specific and new products and their views on
opportunities for the insurance market in the years to come.
4. Key reports
The Carbon Disclosure Project (CDP). Requirements from investors and shareholders have
lead a vast majority of companies subject to the ETS to publish annually detailed
information pertaining to their carbon emissions and the way they manage risks associated
with climate change. Reports are available free of charge on www.cdpproject.net.
State and trends of the Carbon Market 2010, World Bank
(http://siteresources.worldbank.org/INTCARBONFINANCE/Resources/State_and_Trends
_of_the_Carbon_Market_2010_low_res.pdf)
Key figures on Climate, 2011, CDC Climat, MEDDTL (http://www.developpement-
durable.gouv.fr/IMG/pdf/Repclimat_anglais.pdf).
5. Web
A number of websites also provide very useful information and statistics. This study will on many
occasions refer to figures and data posted on the following websites:
UNFCCC (www.unfccc.int)
European Commission - Climate Action (www.ec.europa/clima/policiesets/index_en.htm)
UNEP (www.unep.org)
International Energy Agency (www.iea.org)
International missions Trading Association (www.ieta.org)
Point Carbon (www.pointcarbon.com)
UNEP Riso Centre (www.cdmpipeline.org)
Cedric Wells - MBA ENASS 2009-2011 - Carbon credits and Insurance 11
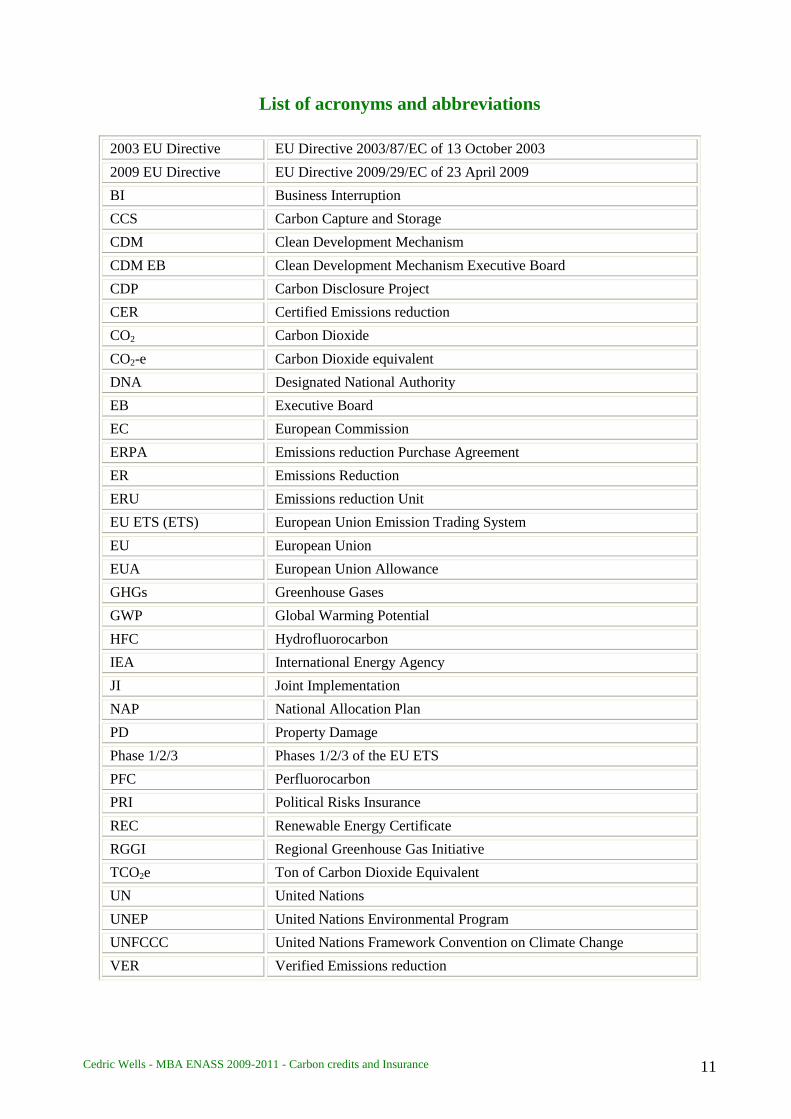
List of acronyms and abbreviations
2003 EU Directive EU Directive 2003/87/EC of 13 October 2003
2009 EU Directive EU Directive 2009/29/EC of 23 April 2009
BI Business Interruption
CCS Carbon Capture and Storage
CDM Clean Development Mechanism
CDM EB Clean Development Mechanism Executive Board
CDP Carbon Disclosure Project
CER Certified Emissions reduction
CO2 Carbon Dioxide
CO2-e Carbon Dioxide equivalent
DNA Designated National Authority
EB Executive Board
EC European Commission
ERPA Emissions reduction Purchase Agreement
ER Emissions Reduction
ERU Emissions reduction Unit
EU ETS (ETS) European Union Emission Trading System
EU European Union
EUA European Union Allowance
GHGs Greenhouse Gases
GWP Global Warming Potential
HFC Hydrofluorocarbon
IEA International Energy Agency
JI Joint Implementation
NAP National Allocation Plan
PD Property Damage
Phase 1/2/3 Phases 1/2/3 of the EU ETS
PFC Perfluorocarbon
PRI Political Risks Insurance
REC Renewable Energy Certificate
RGGI Regional Greenhouse Gas Initiative
TCO2e Ton of Carbon Dioxide Equivalent
UN United Nations
UNEP United Nations Environmental Program
UNFCCC United Nations Framework Convention on Climate Change
VER Verified Emissions reduction
Cedric Wells - MBA ENASS 2009-2011 - Carbon credits and Insurance 12
INTRODUCTION
(1) Insurance and climate change
There appears to be consensus that the insurance industry has a role to play and great opportunities
to seize with climate change.
a. Global initiatives and calls from insurers’ associations
On 6 September 2010, four leading insurance and climate change initiatives (ClimateWise1, The
Geneva Association2, the Munich Climate Insurance Initiative
3 and the UNEP Finance Initiative)
representing more than 100 of the world’s leading insurers called for greater action to adapt the
emerging countries to climate change through the use of insurance-linked products and risk
management mechanisms.
This is one of many positions taken by insurers towards assisting governments and NGOs in
preventing the risks associated with climatic changes and extreme weather conditions. Insurers
have volunteered to provide their expertise in risk engineering and loss prevention. They are
prepared to share the tools (natural climate and catastrophe database, extreme weather models,
etc.) and expertise necessary to assist vulnerable countries in assessing and managing the risks of
climate change4. They have also stressed the need for reliable regulatory and societal frameworks
as well as for governments’ cooperation with (re)insurers, particularly with regards to the critical
need for local weather information and high-quality historical data for underwriting purposes5.
A number of companies such as Zurich Financial Services6 have also individually highlighted the
role of insurance and public policy in managing the new risks arising out of climate change.
Insurers’ involvement in climate change is generally well perceived however there has been some
reaction, in particular from NGOs such as WWF, to the effect that insurers’ only motivation is to
generate new streams of revenue.
1 Climatewise was established in 2007 involving over 40 leading insurers and reinsurers which have agreed to abide
by a number of principles towards the reduction of climate change. 2 The Geneva Association is a think tank on insurance and risk management issues. In May 2008, it launched the
“Climate Change and its Economic Impact on Insurance (CC+I)”. On 29 May 2009, 50 CEOs from global insurance
and reinsurance companies signed the “Kyoto Statement” of the Geneva Association which aims at countering climate
risks through cooperation and the use of sustainable practices and sharing strategies of mitigation and adaptation. 3 The MCCI was founded in 2005 by representatives of Germanwatch, the IIASA, Munich Re, PIK, SLF, the Tyndall
Centre, the World Bank and independent experts. It focuses on providing insurance solutions for developing countries
by helping them manage the impacts of climate change. 4
“The insurance industry and climate change – Contribution to the global debate”, July 2009,
http://www.genevaassociation.org/PDF/Geneva_Reports/Geneva_report%5B2%5D.pdf. Retrieved on 21 December
2010. 5 “Climate change challenges are opportunities for industry to learn”, K. Ishihara, Geneva Association, Insurance
Day, 23 November 2010. 6
“The Climate Risk Challenge – The role of insurance in pricing climate-related risks”, http://www.zurich.com/NR/rdonlyres/E2B5B53E-11DB-47AF-91E4-01ED6A2BDCA3/0/ClimateRiskChallenge.pdf.
Retrieved on 9 November 2010.
Cedric Wells - MBA ENASS 2009-2011 - Carbon credits and Insurance 13
b. New business opportunities
Climate change exposes companies and their businesses to new or increased property and casualty
risks. In the current global economic system, this inevitably means that insurance needs will grow
thus providing opportunities for new insurance markets and products7. This has led a number of
established insurers and newcomers to insurance market to offer innovative and bespoke coverage
solutions. Solar and wind power generators are one of many examples of new technologies that
require specific solutions. Munich Re is recognised as a leader in the creation of renewable energy
insurance. In 2010, it entered into a 25-year agreement with LDK Solar to cover the photovoltaic
panels it manufactures. In March 2011, the company announced that it had agreed to insure 5-year
guarantees offered by Fuhrländer, a wind-turbine manufacturer, to its customers. On the liability
side, companies are increasingly exposed to regulation and pollution risks.
Insurers also play a role in climate change when they encourage their clients to “go green” through
premium differentiation. In the motor insurance industry, the “pay as you drive” experience in the
UK has proven particularly successful with low mileage drivers. A number of companies also offer
discounts for fuel efficient and hybrid vehicles.
In other lines of business such as building and home insurance, insurers have actively promoted
best available technology by offering lower premium rates and extended cover to companies that
use renewable energies and apply resource-efficient business models8. Further, a policy can also
provide for the rebuilding of damaged property using green material and complying with new
compulsory norms and/or higher optional standards9
. Demolition and Increased Cost of
Construction (DICC) and code upgrade are a particularly big issue in the USA.
(2) Basic terminology
The following terms will be used throughout this study.
a. Carbon emissions10
Greenhouses Gases (GHGs) are natural gases in the earth's atmosphere which allow infrared
radiation in to warm the earth’s surface. Excessive concentrations of these gases due to human
actions (anthropologic emissions) have resulted in preventing much of the heat brought by the sun
escaping from the earth into the atmosphere. It is widely believed that this is affecting the global
climate (greenhouse effect).
The Kyoto Protocol in its Annex B covers six major greenhouse gases emitted by the largest
industries:
7 “Advancing adaptation through climate information services”, UNEP and Sustainable Business Institute (SBI)
survey, January 2011. 8 “Global Change, Acts of God, Acts of Man, Acts of Nature and Systemic Risks”, Walter R. Stahel, Geneva
Association Information Newsletter, May 2010, pp.3-4. 9 By way of an example, FM Global recently launched its “Sustainability Select” product which includes the two
following optional additional coverage: (a) the “Risk Improvement” coverage by which the risk quality of a damaged
location can be improved by paying for the extra cost to satisfy current recommendations in FM Global’s Property
Loss Prevention Data Sheets, and (b) the “Green” coverage by which damaged property can be upgraded through the
use of green materials and practices in line with local environmental norms. See
www.fmglobal.com/page.aspx?id=03010102. Retrieved on 26/01/2011. 10
http://www.carbonoffsetguide.com.au/glossary. Retrieved on 08/08/2010.
Cedric Wells - MBA ENASS 2009-2011 - Carbon credits and Insurance 14
Carbon dioxide (CO2) is by far the most commonly produced GHG. It is generated as a
by-product of oil and gas production, burning fossil fuels and biomass, as well as from all
animals, plants and a number of other natural sources;
Methane (CH4) is emitted from landfills, oil and natural gas operations, coal mines and
agriculture (particularly livestock farming);
Nitrous oxide (N2O) is emitted from nitrogen fertilizers, burning fossil fuels and some
industrial and waste management processes;
Hydro fluorocarbons (HFCs) are mainly released from leakage from refrigeration
equipment during operation and its end-of-life destruction. They are also used in aerosols,
air conditioners and metered dose inhalers;
Perfluorocarbons (PFCs) ozone-depleting CFCs used in refrigeration systems;
Sulphur hexafluoride (SF6) is a man-made chemical that can be found in electrical
switchgear, magnesium smelting processes and semiconductors.
The Global Warming Potential (GWP) is the potency of GHGs, meaning their ability to trap heat
in the atmosphere, through the difference in time GHGs remain in the atmosphere, and their
effectiveness in absorbing outgoing infrared radiation.
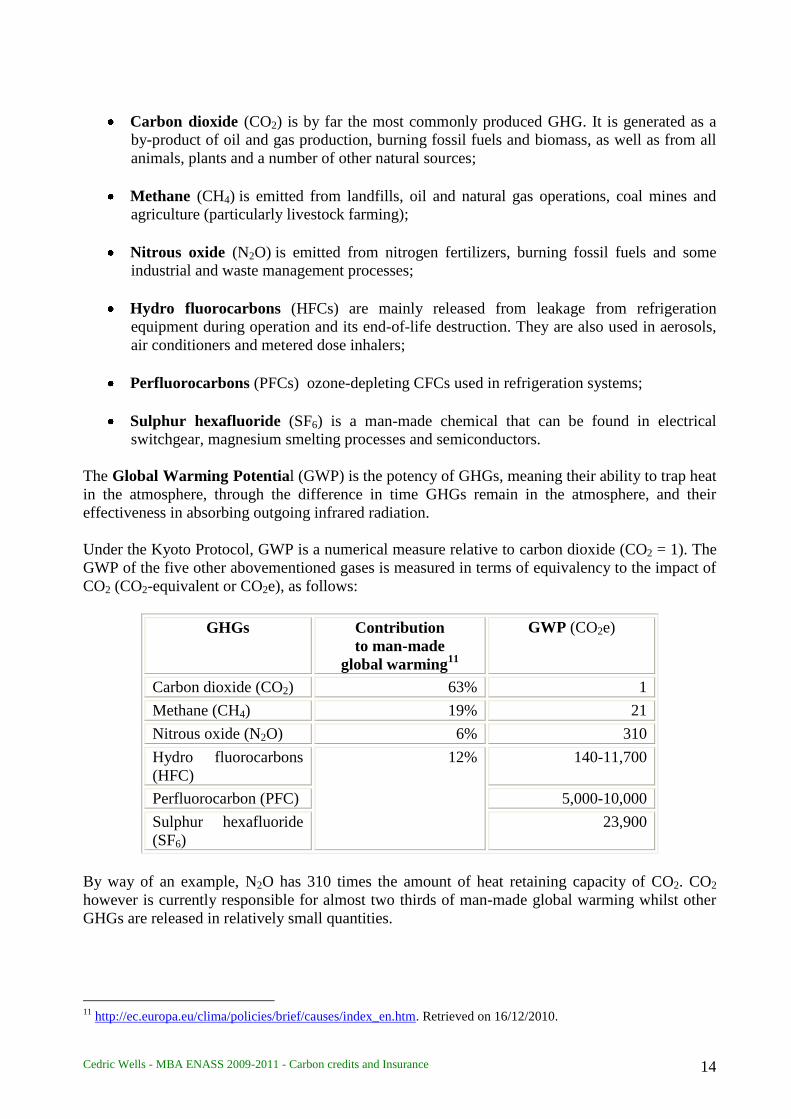
Under the Kyoto Protocol, GWP is a numerical measure relative to carbon dioxide (CO2 = 1). The
GWP of the five other abovementioned gases is measured in terms of equivalency to the impact of
CO2 (CO2-equivalent or CO2e), as follows:
GHGs Contribution
to man-made
global warming11
GWP (CO2e)
Carbon dioxide (CO2) 63% 1
Methane (CH4) 19% 21
Nitrous oxide (N2O) 6% 310
Hydro fluorocarbons
(HFC)
12% 140-11,700
Perfluorocarbon (PFC) 5,000-10,000
Sulphur hexafluoride
(SF6)
23,900
By way of an example, N2O has 310 times the amount of heat retaining capacity of CO2. CO2
however is currently responsible for almost two thirds of man-made global warming whilst other
GHGs are released in relatively small quantities.
11
http://ec.europa.eu/clima/policies/brief/causes/index_en.htm. Retrieved on 16/12/2010.
Cedric Wells - MBA ENASS 2009-2011 - Carbon credits and Insurance 15
Energy efficiency is all about “using less energy to provide the same service”12
. Its benefits to
industries can be multiple: lower fuel costs and reliance on fossil fuels, increased competitiveness
and good reputation.
Direct emissions (also called Scope 1 emissions) are emissions that are issued by sources that
belong to and are controlled by a company. In contrast, indirect emissions (also called Scope 2
emissions) are those that relate to the production of electricity, heat or steam that is either imported
or purchased. Indirect emissions can be the direct emissions of another company (e.g. a coal fired
turbine emits gas or steam to produce electricity). Scope 3 emissions are other indirect emissions
either upstream (e.g. raw materials and capital equipment used for the production of Scope 2
emissions) or downstream (e.g. distribution, use or disposal of a manufactured product, etc.). Some
emissions not part of the supply chain (out of stream) may also be considered as Scope 3 emissions.
Carbon capture and storage (CCS) or geo-sequestration involves the capture, transport, injection
and long-term storage of GHG emissions in underground geological formations for the primary
purpose of mitigating GHG emissions. CO2 is separated from the other exhaust gases generated in
the industrial combustion of fossil fuels.
b. Cap and trade schemes
Under a cap and trade scheme, a central authority sets a cap on the amount of GHGs that can be
emitted by specified businesses or industries. The cap is estimated by reference to an industry’s
emissions in a “business as usual” situation. That cap lowers over time so that companies are
encouraged to further reduce their emissions.
Allowances are either allocated or sold to companies in the form of carbon credits which give
them the right to emit a determined quantity of GHGs over a specified period (“Carbon Year”,
typically one year). In a sense, carbon credits can be viewed as a “license to pollute”.
At the end of the Carbon Year, companies must surrender carbon credits equal in number to the
CO2 emissions they release. If they emit more than they are allowed to, they can either pay a fine
or purchase surplus allowances (trade) from companies that manage to stay below their limit
during the Carbon Year.
The first cap and trade system involving gas emissions was implemented in the US under the 1990
Clean Air Act applying to SO2. Today, the EU Greenhouse Gas Emission Trading System (ETS)
is the most advanced cap and trade system in the world. The Regional Greenhouse Gas Initiative
(RGGI) in the USA follows and in December 2010, California adopted its own mandatory state
scheme which is expected to become the second largest in the world.
A carbon credit (also referred to as allowance or permit) is a generic term to assign a value to
the specific weight unit amount of an emission, reduction or offset of GHG emissions. One carbon
credit is set to be equivalent to one ton of CO2 or one ton of CO2-equivalent gases.
A carbon credit generally refers to an Assigned Amount Unit (AAU) under the Kyoto Protocol or
to a European Union Allowance (EUA) under the ETS however depending on the context this
might also (or instead) refer to carbon offsets.
12
http://eetd.lbl.gov/ee/ee-1.html.

Cedric Wells - MBA ENASS 2009-2011 - Carbon credits and Insurance 16
Carbon offsets (or project-based credits) are credits issued in return for investments in projects
that reduce GHG emissions (e.g. electricity generated by wind, solar or hydro power, ethanol
produced from biological fermentation of organic material used as fuel, etc.) or that sequester
carbon from the atmosphere (e.g. a forestation, etc.). Per the Kyoto Protocol, such reductions must
be “additional” to emissions reductions that would otherwise be obtained in a project13
.
GHG emissions
Additionality (reduced emissions)
Baseline emissions
Actual emissions
2 Start-up
GHG emissions
3
Offsets are the difference between business as usual and residual CO2 emissions. One offset credit
equates to an emissions reduction of one ton of CO2. By paying for such emission reducing
activities, companies can use the resulting credits to offset their own emissions, either voluntarily
or within emissions trading schemes. They can also bank their offset credits.
The most common form of carbon offsets is the Certified Emissions reductions (CERs,
generated in Clean Development Mechanism projects) and the Emissions Reduction Units (ERUs,
generated in Joint Implementation projects) as part of the Kyoto flexible mechanisms.
(3) Scope of this study
Whether they are granted for free by governments or purchased on the spot or auction markets,
carbon credits are valuable assets to companies. If a company needs more credits, it will have to
incur a cost. If it has surplus, it will expect to generate revenue from their sale.
Insurers and reinsurers are involved in cap and trade because the industries they (re)insure
contribute to climate change through their emissions.
This study will consider whether carbon credits may be considered an insurable interest and if so,
what conditions must be met. An insurable interest is a true, valid, determinable and direct
economic stake of a policyholder (or any designated beneficiary of a policy) in the continued
existence or safety of an insured property (or person). The policyholder must stand to suffer a
direct financial loss if an insured peril occurs14
.
13
Additionality is defined in 3/CMP.1, Annex, paragraph 43 as follows for CDM projects: “A CDM project activity
is additional if anthropogenic emissions of GHGs by sources are reduced below those that would have occurred in the
absence of the registered CDM project activity”. 14
http://www.businessdictionary.com/definition/insurable-interest.html. Retrieved on 11 February 2011.

Cedric Wells - MBA ENASS 2009-2011 - Carbon credits and Insurance 17
This study will focus on the ETS only although it should be recognised that the RGGI in the USA
is now a well advanced operating cap and trade scheme with allowances actually already being
auctioned. Notwithstanding, a number of generic insurance issues discussed will likely be of
relevance to other cap and trade schemes throughout the world i.e. not specific to the ETS.
The purpose of this study is to highlight one specific topic: carbon credits and the associated risks
which the energy-intensive industries that are (or will be) subject to the ETS face (or will face if
and when they become subject to the ETS).
The author will seek to offer answers to the following fundamental questions:
Which are the relevant local, national and international cap and trade schemes?
Who are the parties involved?
What are the implications (costs and risks) of such regulation?
Have they been identified and how are they currently managed by companies?
Which are the existing risk transfer solutions?
Why is the insurance industry’s response limited and how can it improve?
Are all carbon credit-related risks insurable?
The following topics will NOT be discussed:
Other climate change-related risks and solutions (e.g. climate derivatives, etc.)
Carbon trading by individuals
Carbon taxes15
.
This survey will first address the way companies that are subject to cap and trade schemes
(particularly in the EU ETS) manage the risks which they raise (section 1). Solutions available
from the insurance industry will then be presented (section 2). The final section will focus on those
risks (regulatory and price volatility) for which limited coverage only can be currently found
(section 3).
15
Although the debate as to whether a tax system might be a more appropriate and fair system than cap and trade is
still very much alive, this study will assume that the latter is the basis of all efforts being put towards fighting climate
change in line with the Kyoto Protocol mechanisms which a very large majority of States have ratified.
Cedric Wells - MBA ENASS 2009-2011 - Carbon credits and Insurance 18
1. MANAGING CARBON CREDIT RISKS
ABSTRACT
Legal framework
The Kyoto Protocol imposes binding reductions targets on 6 greenhouse gas emissions to its
signatory countries. They are to be achieved through the implementation of a cap and trade system
and so-called “flexible mechanisms” (Clean Development Mechanism and Joint Implementation)
which enable parties to offset their emissions via projects that contribute to reducing emissions (or
that sequestrate them) in foreign countries.
Fighting climate change is a key priority for the EU. The EU Emissions Trading Scheme was set
up in 2005 based on the Kyoto Protocol principles. It is staged process which imposes increasing
emissions restrictions to companies. Phase 3, which is due to start in 2013, will see major
developments as the scheme will apply to more sectors and gases and as a majority of allowances
will be auctioned (rather than granted).
Other cap and trade schemes are emerging across the world mainly in developed countries.
Regional initiatives, particularly in North America, are also very active.
Risk management
The EU ETS applies to energy-intensive installations in the EU and their GHG emissions.
Reducing energy costs has been a main concern for industries for many years. The ETS is
therefore perceived as a further incentive to switch to renewable energies and reduce emissions.
So far it has raised no major concern because, (a) allowances have been allocated at no cost and
have exceeded by far actual levels of emissions, (b) the sale of surplus allowances has actually
generated windfall profits and, (c) carbon market prices have remained low.
Industries see the cost of carbon regulation as an additional production cost which they now factor
into their key business and strategic decisions. Carbon credits are treated as a commodity (in the
same way as fuel or coal) which volatility risk can be mitigated through price index clauses in
sales agreements and derivatives on the carbon markets (futures, options, swaps).
Companies that are subject to the ETS face two main types of new risks.
1. An Increased Cost Of Working scenario. An industry would have to purchase additional
credits in order to compensate for increased emissions due to the switching of a failed (or
damaged) production unit to a less efficient one in order to mitigate a BI loss. Such risk is
currently covered by traditional PD/BI policies.
2. A risk of non-delivery of carbon credits (CERs or ERUs) expected from CDM and JI
projects. Such risk may involve a large number of stakeholders (financing, contractors and
clients). Partial coverage can be found via so-called “all risk” carbon credit non-delivery
policies.

Cedric Wells - MBA ENASS 2009-2011 - Carbon credits and Insurance 19
1.1 Legal framework
a. UN Framework Convention on Climate Change (UNFCCC)
A milestone in the decision to implement carbon cap and trade systems throughout the world is the
UNFCCC Earth summit which took place in Rio in May 1992. 189 states signed up to a text which
aimed at stabilizing “greenhouse gas concentrations in the atmosphere at a level that would
prevent dangerous anthropogenic interference with the climate system”16
. To achieve this, the
signatories agreed to set a non-binding cap on allowable GHG emissions and committed to
establishing national programmes for reducing GHG emissions and publishing regular reports.
Three key-principles have emerged from the agreement (which came into effect in 1994):
- “common but differentiated responsibilities” (the top 20 emitters emitted 80% of total
GHG emissions in 2005),
- an “equitable burden-sharing according to capacities”,
- a “possible joint implementation”.
The Kyoto Protocol to the UNFCCC was adopted on 11 December 1997 and entered into force on
16 February 2005. Its purpose was to supplement the UNFCCC in setting legally binding targets to
States on six GHG emissions (see Gases). As at February 2011, there were 193 parties (including
the EU) to the Protocol.
Per the terms of the agreement, Industrialized Countries (also known as the UNFCCC “Annex I
countries” having ratified the Kyoto Protocol) must reduce their collective GHG emissions by an
average of 5,2% below 1990 levels (when levels were particularly high) by 2012. EU countries
must reduce their emissions by 8% over the same period.
The Marrakech Accords in November 2001 established three market-based implementation
“mechanisms” for States to meet such targets.
The first is the International Emissions Trading (art. 17 of the Kyoto Protocol), a cap and trade
system which allows Annex I countries to trade carbon credits allocated to them (Assigned
Amount Units - AAUs). The cap reduces over time.
The two other mechanisms, “CDMs” and “JIs”, are known as “project-based mechanisms”.
Clean Development Mechanisms (CDM, art. 12 of the Kyoto Protocol) allow companies
from an Annex I country to offset some of their GHG emissions by helping to finance the
emergence of environmentally-friendly industries in Developing Countries (also known as
UNFCCC “Non-Annex I” countries having ratified the Kyoto Protocol).
16
Article 2, The United Nations Framework Convention on Climate Change.

Cedric Wells - MBA ENASS 2009-2011 - Carbon credits and Insurance 20
Carbon offsets generated by CDM projects are called Certified Emissions Reduction (CERs)
with one CER unit equating to a reduction of one metric ton of CO2. CERs can be used,
exchanged (for EUAs under the ETS) or sold in addition to allowances granted separately by
Member States. Local regulation may establish specific requirements for CERs to be
recognised.
CDM projects must also comply with a given non-Annex I country’s priorities in terms of
sustainable development. It must also be validated and registered by the UNFCCC. Once this
is achieved and the project is operational, independent auditors must verify that the targeted
emissions reductions are actually achieved.
Joint Implementation projects (art. 6 of the Kyoto Protocol) were introduced in 2008. They
allow companies from an Annex I country to be granted carbon offsets as a result of
investments in other Annex I countries when they are intended to reduce the net GHG
emissions in that other Annex I country.
Carbon offsets generated by JIs are called Emissions Reduction Units (ERUs). They can be
used, traded or exchanged (against EUAs under the ETS). Local regulation is due to establish
the requirements for ERUs to be recognised.
CDM and JI projects must result in real additional, measurable, verifiable and long-term climate
change benefits (see Additionality).
The International Transaction Log (ITL), held by the UNFCCC Secretary, is a centralized database
of all UN tradable credits (including CERs). It verifies that all international transactions comply
with the Kyoto Protocol rules and policies.
Verified Emissions reductions or Voluntary Emissions reduction (VERs) are alternative ways
of generating credits through emissions reduction activities when they cannot enter the scope of
ERUs
Annex 1 party
emissions cap
Annex 1 party
emissions
Technology, investment, know how

Cedric Wells - MBA ENASS 2009-2011 - Carbon credits and Insurance 21
CDM programs (e.g. when they are conducted in countries that are not signatories to the Kyoto
Protocol). Projects mainly involve agro forestry, methane reduction and renewable energies.
The Kyoto Protocol will expire in 2012 and Member States have yet to decide on whether it will
be extended or not. Policymakers failed in Copenhagen (2009) and Cancun (2010) to provide long-
term visibility on any post-Kyoto international framework. This has caused many investors to
postpone CDM and JI projects. COP 17 in Durban at the end of 2011 will attempt to address
unresolved issues and outline the future, if any, of an international legal binding cap and trade
system (or any alternative solution17
).
b. The EU paving the way for mandatory cap and trade schemes
The Kyoto Protocol was ratified by the EU and all its Member States on 31 March 200218
. All
accession countries that have since joined the EU have ratified the Protocol.
Under the Protocol, the EU15 committed itself to reduce its GHG emissions by 8% during the
2008-2012 period19
. Each Member State has its individual target to meet20
.
In December 2008, the European Parliament and Council adopted the “Climate and Energy
Package for 2020”. The text, which became law in June 2009, implements the following “20-20-
20” target:
- 20% of EU energy consumption to come from renewable sources
- +20% improvement in energetic efficiency within the EU
- -20% GHG emissions compared to 1990 levels (-30% in the event that a satisfactory
international convention can be ratified).
Such assignments and the Kyoto Protocol have motivated the launch of the EU Greenhouse Gas
Emission Trading System (ETS), a cornerstone in the EU’s fight against climate change. This
was achieved through the EU Directive 2003/87/EC21
of 13 October 2003 (hereafter the “2003
EU Directive”, in force on 25 October 2003 and subsequently amended).
In January 2005, the ETS started operation as the first and largest international, multi-sector
company-based cap and trade system for CO2 emissions. The system, which currently applies to
companies owning over 11,500 energy-intensive installations across Europe, is one which sets a
total volume (cap) of permitted emissions during a certain period. Companies subject to the
regulation are allocated carbon credit allowances (EUAs) by the EU Members States’ governments.
At the end of each yearly reconciliation period, companies must surrender to their government an
amount of allowances equivalent to their emissions during same period. Any savings which they
can achieve through emissions reduction efforts can be traded on a dedicated market. Emissions
17
It has been suggested that a bottom-up type of agreement based on countries making domestic commitments) might
be a way of gaining worldwide support. 18
The Kyoto Protocol is implemented as law in the individual EU states. Member States are required to transpose the
directive into their legislation. 19
Council Decision 2002/358/EC of 25 April 2002. 20
Targets assigned to EU Members are not uniform: -21% for Germany (where there are still a large number of coal
power stations), 0% for France (given the high proportion of electricity generated by nuclear power stations) and
+15% for Spain (accounting for the post 1990 increased industrialization). 21
http://eur-lex.europa.eu/LexUriServ/LexUriServ.do?uri=OJ:L:2003:275:0032:0046:en:PDF. Retrieved on 20
December 2010.

Cedric Wells - MBA ENASS 2009-2011 - Carbon credits and Insurance 22
exceeding the cap will be fined unless companies are able to surrender admitted carbon offsets
instead.
The EU Commission is the entity responsible for the allocation process and trade of carbon credits
in the EU. It approves the National Allocation Plans (NAPs) which are drawn up by each Member
State to set an overall cap on CO2 emissions and the corresponding allowances. NAPs must
comply with 12 criteria that are set out in Annex III to the 2003 EU Directive. A key criterion is
that the proposed total quantity of emissions permitted must be in line with the Kyoto Protocol
requirements. A corresponding number of EUAs is then granted per installation. Allocations are
made for a sequence of several years (“Trading Period”) with a view to neutralise unusual weather
conditions (cold winters and hot summers can mean more energy is required for production thus
increased pollution). Member States can issue additional allowances in cases of force majeure
such as extreme weather conditions.
Each EUA represents a permit to emit one metric ton of CO2-e or an amount of any other GHG
listed in Annex II to the 2003 EU Directive with an equivalent GWP. The EU Commission
adopted a proposal on 23 July 2003 which allowed22
companies to convert carbon offsets
generated by CDM and JI projects in order to meet their commitments under the ETS.
As part of their reporting obligations to their national regulators, companies must publish an
Annual Emissions Report every year which discloses their actual level of GHG emissions as well
as their balance (debit or credit) of carbon credits. The report must be submitted to the EU
Member State entity responsible for regulating carbon emissions and verified by an Independent
Accredited Verifier.
The ETS is defined by its overall cap (21% below 2005 levels by 2020 based on a linear annual
reduction factor). It works in phases.
Phase 1 ran from 1 January 2005 to 31 December 2007. During that period, also known as
the “trial period”, emissions in the EU decreased by 2-3%23
. The ETS covered CO2
emissions by a limited number of industrial sectors (mainly energy, metallurgy and mining).
The caps were set at national level.
Virtually all allowances were granted at no cost (up to 5% were auctioned). Allocations were
based on historical emissions at installation level. Companies could generate profit through
the sale of surplus allowances to companies emitting beyond authorised limits. Any surplus
in year Y had to be used or sold in year Y+1. Unless otherwise compensated by carbon
offsets or credits purchased on the spot market, companies exceeding allowances would be
fined EUR40 per ton of CO2 exceeded in addition to having to purchase the equivalent
shortfall for retirement the following year. Their name would also be published on a shame
list on the ETS website.
During Phase 1, companies received far more allowances than they actually needed (see
Oversupply) and carbon prices were very volatile, eventually collapsing at the end of the
period because credits could not be banked beyond Phase 1.
22
Up to a certain limit (up to 10% of the Member States’ total allowances under Phase 2). 23
Source: World Bank.
Cedric Wells - MBA ENASS 2009-2011 - Carbon credits and Insurance 23
Phase 2 started on 1 January 2008 and is due to end on 31 December 2012. It has also been
named the “commitment period” in line with the Kyoto Protocol target (an overall 2.1 bn
t/year cap for the EU during that period). Emissions fell by 11% in 2009 with the financial
turmoil. The caps are also national.
Allowances have been mostly granted at no cost (up to 10% auctioned) but the overall
number of allowances available has reduced. Allocations are based on historical emissions at
individual production installation level. Surplus carbon credits can be used at any moment
during Phases 2 and 3 to cover possible shortfall. Companies exceeding their individual
emission limit face a EUR100 fine per ton of CO2 exceeded.
As part of the 2008 EU Climate & Energy Package, Phase 2 saw the 2003 EU Directive
amended on 23 April 2009 (hereafter the “2009 EU Directive”) to improve and extend the
ETS as from 201324
.
Phase 3 will run from 1 January 2013 to 2020. Its rules were approved on 15 December 2010
by the EC Climate Change Committee and are due to be submitted to the EU Parliament and
Council within a three month timeframe.
Phase 3 will also see the EC granted with increased control and power on the scheme. The
quantity of overall yearly allowances will be set at EU level25
and shall decrease by a linear
factor of 1,74% compared to the average yearly total quantity of allowances issued by
Member States between 2008-201226
. All allowances will be registered at a national level
under EU supervision. NAPs will be abolished in favour of a special EC authority which will
decide on allocations of each individual installation. All national registries will have to be
connected to the EU Community Independent Transaction Log (CITL) that records the
issuance, sale, cancellation, retirement and banking of credits issued by the ETS. Preventing
Fraud is a top priority for the EC.
The Phase foresees fundamental changes in that the auctioning rather than allocation of
allowances will become the rule and new sectors including aviation will join the ETS. 60%
of permits will be auctioned. Auctioned permits will be time-limited and sold at costs
reflecting a sector’s carbon intensity and environmental impact. Costs will also account for
the potential for carbon leakage27
. 164 industrial sectors have been identified as sensitive to
carbon leakage risk out of a total of 258. They will each receive 100% of their benchmarked
allowances for free until the end of 2014. After 2014, the list of 164 will be revised. Auction
dates have not yet been published.
Benchmarks will be based on the average GHG performance of the 10 most CO2 efficient EU
installations for every sector, as calculated against the base year 2007-2008. The most
24
Directive 2009/29/EC modifying Directive 2003/87/EC of 13 October 2003 - http://eur-
lex.europa.eu/LexUriServ/LexUriServ.do?uri=OJ:L:2009:140:0063:0087:EN:PDF. Retrieved on 26 December 2010. 25
The EC decided on 22 October 2010 that there would be 2,039,152,882 allowances for 2013 (valued at circa
EUR100 bn). This includes all Phase 3 sectors except aviation which level of allowances have yet to be determined. 26
Article 9 of the 2009 EU Directive. 27
Carbon leakage risk stems from the alleged (see Leakage) competitive disadvantage which industries would suffer
against those that are not subject to the ETS restrictions. It is feared that the companies involved would have to
relocate production outside the EU where they would use less efficient installations, resulting in increased emissions
globally. Article 15 of the 2009 EU Directive sets out the relevant criteria for the determination of a carbon leakage
situation. The complete list of sectors and sub sectors appears in the 2010/2/EU Commission Decision of 24 December
2009.

Cedric Wells - MBA ENASS 2009-2011 - Carbon credits and Insurance 24
“climate friendly” installations will be granted free allowances during a transitional period.
The heavy industry (including cement, steel, aluminium and chemical) will obtain a higher
share of free allowances. By contrast, electricity producers, subject to some derogations, will
have to buy 100% of their allowances at auction (see windfall profits).
There will be quality restrictions on the use of carbon offsets. This follows notably the UN
Emissions Board’s decision to postpone the delivery of CERs for certain types of CDM
projects (see HFC23). Banking of permits from Phase 2 to Phase 3 will be permitted
A common auction platform will be created (at a location to be determined) however
Member States (who will be collecting the auctioning revenue) will have the right to opt-out
and hold their own auctions subject to meeting certain criteria (such as a minimum amount of
quotas being auctioned, identical access conditions to platforms, etc.) and subject to the EC’s
approval.
The EC has committed to continuing with its cap and trade scheme despite the limited cap and
trade initiatives on other continents. It recognises its cost to EU-based companies however is
convinced that efforts in terms of energy efficiency will give them a long-term comparative
advantage through lower costs and enhanced security.
c. Other carbon cap and trade schemes throughout the world
Although this study will focus on the EU scheme, the obligatory and voluntary schemes that are
emerging across the world at various levels (local, national and international) are mentioned
because EU insurers and reinsurers will insure policyholders involved in schemes worldwide.
Several signatory States to the Kyoto Protocol are setting up or planning to set up carbon cap and
trade schemes. Currently 5% of the worldwide GHG emissions are subject to such schemes. This
is expected to reach 35% by 202028
.
Source: Element Markets
29
28
Letter from C. Lagarde to M. Prada (President of Paris Europlace) dated 15 April 2010.

Cedric Wells - MBA ENASS 2009-2011 - Carbon credits and Insurance 25
United States of America
It is noteworthy that the ETS was actually preceded by the SO2 emissions cap and trade system
which was implemented in the USA as part of the Acid Rain Program (Title IV) of the 1990 Clean
Air Act.
If a federal carbon cap and trade system was established in the US, it is likely that the volume of
carbon credits exchanged would exceed that in the EU. Currently however, there is no such
scheme.
President Obama stated on 17 November 2008: “Cap and trade is the best way from my
perspective to achieve some of those gains because what it does is it starts pricing the pollution
that is being sent into the atmosphere”. His commitment to ratify the Kyoto Protocol and to set up
a federal scheme to limit global warming has since met strong resistance. The November 2010
mid-term elections may well have wrecked the prospects of the Congress implementing what
looked like a well advanced energy reform bill30
:
o The American Clean Energy and Security Act (Waxman-Markey HR 2454 bill) was
adopted by the House of Representatives in June 2009. It aims at reducing emissions by 17%
by 2020 using a 2005 baseline (83% by 2050). Per the bill, carbon offsets would be capped at 2
bn tons per year (compared to 350Mt under the ETS), 50% of which could be imported (75% if
there is insufficient domestic supply). Substantial offsets stemming from forestry, agriculture
and land uses would be accepted. The law sets a $10/ton CO2 permit price floor and a
“strategic reserve pool” would serve to stabilize prices if they exceeded 60% of the historical
price.
o The Clean Energy Jobs and American Power Act bipartisan bill is a proposal made by
senators Kerry, Liebermann and Graham in May 2010. It aims at reducing GHG emissions by
20% by 2020 based on 2005 levels (also 83% by 2050). To achieve this, it plans to set up of a
cap and trade system applying to the 7,500 plants which emissions exceed 25,000t/CO2
annually. This amounts to approximately 75% of GHG emissions in the US. The scheme
should apply to producers of electricity as from 2013 (as against 2016 for the industry). Carbon
offsets would also be capped at 2 bn tons per year with import offsets not to exceed 25%. The
draft bill proposes an $11/ton CO2 permit price floor and a “strategic reserve pool” to stabilize
prices if they exceed $28/ton in 2012 and increasing for the following years. The Republicans
blocked the Act in July 2010 after it had been adopted by the House of Representatives in 2009.
In Jason Reeves’ view (Zelle Hofman), the most realistic prospect for US cap and trade is the
Environmental Protection Agency (EPA) regulation using cap and trade following the 2 April
2007 Supreme Court determination31
. The Court ruled that GHGs were “air pollutants” causing
“air pollution” as defined under the Clean Air Act and that the EPA could therefore regulate GHG
emissions. In theory, the US judiciary should balance any legislation or governance failure.
29
http://www.elementmarkets.com/na_carbon_markets.html. Retrieved on 28 February 2011. 30
Paradoxically, the chances of adopting a federal cap and trade scheme had never been so high: a Democrat president,
a majority of Democrats at the Senate, major States taking concrete action against climate change and private
companies such as Wall-Mart and Coca-Cola imposing their “White Roof” policy on their chain suppliers. The
proposed reform however came at the worst possible time. Indeed, the recession hit Americans so badly that climate
change could no longer be considered as a priority in the general opinion. Another important reason for the reform not
passing is that the Senate (before which the Waxman-Markey bill was presented) was unwilling to take up a further
sensitive debate weeks only after the highly controversial one on Health Reform had ended. 31
Massachusetts v EPA et al, 549 US. 497; 127 S. Ct. 1438.
Cedric Wells - MBA ENASS 2009-2011 - Carbon credits and Insurance 26
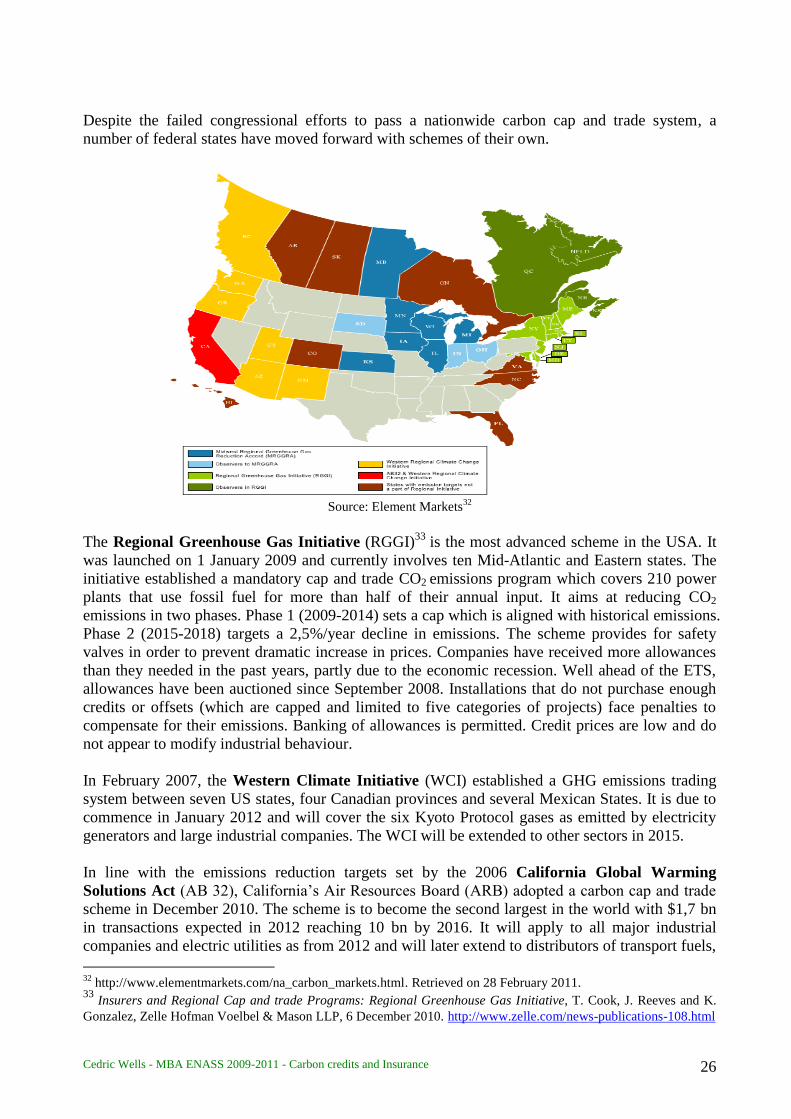
Despite the failed congressional efforts to pass a nationwide carbon cap and trade system, a
number of federal states have moved forward with schemes of their own.
Source: Element Markets
32
The Regional Greenhouse Gas Initiative (RGGI)33
is the most advanced scheme in the USA. It
was launched on 1 January 2009 and currently involves ten Mid-Atlantic and Eastern states. The
initiative established a mandatory cap and trade CO2 emissions program which covers 210 power
plants that use fossil fuel for more than half of their annual input. It aims at reducing CO2
emissions in two phases. Phase 1 (2009-2014) sets a cap which is aligned with historical emissions.
Phase 2 (2015-2018) targets a 2,5%/year decline in emissions. The scheme provides for safety
valves in order to prevent dramatic increase in prices. Companies have received more allowances
than they needed in the past years, partly due to the economic recession. Well ahead of the ETS,
allowances have been auctioned since September 2008. Installations that do not purchase enough
credits or offsets (which are capped and limited to five categories of projects) face penalties to
compensate for their emissions. Banking of allowances is permitted. Credit prices are low and do
not appear to modify industrial behaviour.
In February 2007, the Western Climate Initiative (WCI) established a GHG emissions trading
system between seven US states, four Canadian provinces and several Mexican States. It is due to
commence in January 2012 and will cover the six Kyoto Protocol gases as emitted by electricity
generators and large industrial companies. The WCI will be extended to other sectors in 2015.
In line with the emissions reduction targets set by the 2006 California Global Warming
Solutions Act (AB 32), California’s Air Resources Board (ARB) adopted a carbon cap and trade
scheme in December 2010. The scheme is to become the second largest in the world with $1,7 bn
in transactions expected in 2012 reaching 10 bn by 2016. It will apply to all major industrial
companies and electric utilities as from 2012 and will later extend to distributors of transport fuels,
32
http://www.elementmarkets.com/na_carbon_markets.html. Retrieved on 28 February 2011. 33
Insurers and Regional Cap and trade Programs: Regional Greenhouse Gas Initiative, T. Cook, J. Reeves and K.
Gonzalez, Zelle Hofman Voelbel & Mason LLP, 6 December 2010. http://www.zelle.com/news-publications-108.html

Cedric Wells - MBA ENASS 2009-2011 - Carbon credits and Insurance 27
natural gas and other fuels. The scheme will ultimately involve 360 businesses owning 600
facilities. Allowances are expected to be allocated in July 2011; they will be bankable from one
period to another. The Act includes forest carbon offsets and recognizes offset activities and
credits already generated (known as “early action”). Offsets are projected to exceed 200 million
tons through 2020. The operation phase of the scheme will start in 2012 with limited application
(electricity producers and certain industries). It will then extend to gas and fuel distributors in 2015.
Free allowances will be granted until 2012. Prices will then be $10/t CO2 reaching $18/t in 2016.
The Act does not set a maximum price.
Also due to incept in January 2012 and covering the six Kyoto Protocol gases is the Midwestern
Greenhouse Gas Reduction Accord (Assembly Bill 32) which involves nine US states and one
Canadian province. The agreement will apply widely across the industrial sectors.
The 1997 Emissions Reduction Market System trading credits, which commenced in 2000, relates
to over 100 sources of pollution in the State of Illinois.
New Zealand
As a follow-up to the Climate Change Response Act of 2002, the New Zealand Emissions
Trading Scheme (NZ ETS) was adopted in September 2008 (amended on 25 November 2009). It
is the first mandatory carbon cap and trade scheme outside of the EU. It applies to various sectors
with the following dates of implementation:
- Forestry, as from 1 January 2008,
- stationary energy, industrial processes and liquid fossil fuel emissions, as from 1 July 2010,
- agriculture, as from 1 January 2015.
The law provides for various methods of allocation of permits. The price of New Zealand
Emissions Units (NZUs) is capped at NZ$25 from 1 January 2010 to 31 December 2012 with only
one unit needing to be surrendered for two allocated (i.e. NZ$12,5 per unit).
Australia
The New South Wales Greenhouse Gas Abatement Scheme (GGAS) is a local mandatory GHG
emissions trading schemes which commenced on 1 January 2003 and aims at reducing emissions
associated with the production and use of electricity. Its targets have been set until 2012.
The Carbon Pollution Reduction Scheme (CPRS) was Australia's cap and trade scheme project
until it was rejected by the Senate. A fixed price on carbon was to be introduced in July 2012 and
the trading scheme would have followed three to five years later. It would have placed a cap on the
amount of carbon pollution industry can emit and allowed trading of carbon credits. It
concentrated on the biggest polluters during the first stages (circa 1,000 Australian companies
involved).
Japan
The Japanese Voluntary Emissions Trading System was established by the Japanese Ministry
of Environment in 2005. It involved 359 companies as from December 2010. The Japanese
government is considering implementing a mandatory nationwide program which could begin in

Cedric Wells - MBA ENASS 2009-2011 - Carbon credits and Insurance 28
2013. Municipal markets are also emerging in cities such as Saitama and Tokyo. The latter has
imposed a 7% reduction in emissions between 2011 and 2014.
Canada
The proposed federal Canadian Emissions Trading Scheme is a baseline-and-credit system
which aims at reducing GHG emissions by 20% by 2020 and by 2% annually thereafter. The
scheme, which is still debated and may not go forward, is intended to complement (rather than
duplicate) provincial markets. Several provinces are members of various schemes implemented in
North America. Alberta, which has a large oil sands industry, has set up its own emissions
intensity-based trading scheme.
China
China, where coal continues to be extensively used as a combustible, became the largest carbon
emitter several years ago. The country committed at the 2009 Copenhagen summit to reduce its
GHG emissions by 40-45% between 2005 and 2020 (i.e. twice more emissions than today
accounting for an 8% annual economic growth).
China has expressed interest and sees great business opportunities in climate change from the
energy efficiency standpoint. It is the host country to a vast majority of CDM projects. CO2 trading
platforms have also been operating in Shanghai and Beijing since 2008 and a test cap and trade
system was launched by the Chinese government in Tianjin in 2010.
Switzerland
The Swiss cap and trade system (Schweizer Emissionshandelssystem) started on 1 January 2008 as
a voluntary alternative to domestic CO2-tax. It involves around 400 companies and circa 6,5% of
the GHGs emitted in Switzerland.
South Korea
Korea’s Framework Act on Low Carbon, Green Growth of 13 January 2010 provides for the
establishment of an emissions trading scheme which will cover up to 480 installations (possibly
600 if it is extended to buildings and the electric power sector) and 70% of the country’s overall
GHG emissions. The scheme is still very much under construction with a pilot planned for the
2010-2012 period. Allocation, auction and offset issues have not yet been decided.
Others
Countries such as Mexico, Kazakhstan, Chile, India, Ukraine and Brazil have at some stage
publicly shown some interest in implementing a carbon cap and trade scheme.
There have also been calls for cap and trade at sectorial levels. Pierre Albano (Air France) said that
the International Air Transport Association (IATA) had formally asked the International Civil
Aviation Organization (ICAO) to regulate CO2 emissions and possibly set up a specific
international scheme within the aviation sector. On 15 October 2010, an ICAO resolution on
climate change set out a number of non-binding “aspirations” relative to fuel efficiency, a
collective capping of carbon emissions from 2020 onwards and a global CO2 standard for aircraft
engines.

Cedric Wells - MBA ENASS 2009-2011 - Carbon credits and Insurance 29
d. Linking the schemes together
A number of organisations have called for the various existing schemes to eventually link:
- The Washington Declaration of 16 February 2007 is an agreement in principle between
the heads of several governments (Canada, France, Germany, Italy, Japan, Russia, United
Kingdom, US, Brazil, China, India, Mexico and the Republic of South Africa) on the
outline of a global cap and trade system applying to both industrialized countries and
developing countries.
- The International Carbon Action Partnership34
was established on 29 October 2007. Its
goal is to pursue actively the development of carbon markets through the implementation
of mandatory cap and trade systems with absolute caps. The ICAP consisted of 29 Member
States and regional initiatives (RGGI and WCI) as of September 2009.
- In a communication dated 28 February 2009, the EC stated that the EU should seek to
build an OECD-wide carbon market by 2015 through the linking of the ETS with
comparable domestic cap and trade schemes in the USA, Australia and other developed
countries. It hoped that eventually the linking would be expanded to all major emitting
countries by 2020.
The ETS was actually designed in a way to allow EUAs to be identical (or “fungible”) to the
Kyoto Protocol AAUs. The EU Global Linking Directive (2004/101/EC)35
provides for
connection between the ETS and the flexible mechanisms of the Protocol which non-EU countries
will adopt. This enables companies in the EU to trade credits outside the EU. Liechtenstein,
Iceland and Norway have actually already joined the ETS (in 2008) and there are plans to discuss a
similar agreement between the EU and Switzerland.
Linking cap and trade schemes, however, is no straight-forward process. Although the various
existing and projected systems share many common features, they remain very different in their
scope and organisation. Some schemes do not even comply with the Kyoto Protocol (gases
involved not matching, carbon offsets not equally admitted, etc.). Quite different measurement
methodologies can be also be found.
In the background, policies that guide the schemes can be far apart. For example, the USA
approach tends to be driven by offsets (as opposed to abatements under the ETS) and to favour low
carbon prices (as opposed to high ones in the EU intended to drive change).
Significant concessions may be necessary for states to agree to a top-down international scheme:
some states such as China are openly against allowing an international body to govern climate
change. A more likely evolution would appear to be that schemes inter-connect through bilateral or
multilateral agreements.
34
www.icapcarbonaction.com. 35
http://eur-lex.europa.eu/LexUriServ/LexUriServ.do?uri=CELEX:32004L0101:EN:NOT. Retrieved on 20 December
2010.

Cedric Wells - MBA ENASS 2009-2011 - Carbon credits and Insurance 30
1.2 Stakeholders at risk
a. Installations currently subject to the ETS
Under its Phase 2, the ETS applies to energy-intensive installations across the EU27 (plus Norway,
Iceland and Liechtenstein) which emissions exceed a specified threshold. 11,359 installations36
owned by approximately 4,000 operators were subject to the regulation in 2008 with overall
emissions involved representing almost half of CO2 emissions in the EU. The operators in question
and their plants are the biggest insurance clients.
An installation37
is “a stationary unit where one or more activities listed in Annex I are carried out
and any other directly associated activities which have a technical connection with the activities
carried out on that site and which would have an effect on emissions and pollution”.
An operator38
is “any person who operates or controls an installation or, where this is provided
for in national legislation, to whom decisive economic power over the technical functioning of the
installation has been delegated”.
The ETS applies to the following industries subject to specific thresholds39
:
- Combustion installations40
- Refining of mineral oil
- Production of coke
- Production and processing of ferrous metals
- Metal ore
- Pig iron and steel plants (>2,5 tons per hour)
- Cement (>500 tons per day)
- Lime (>50 tons per day)
- Glass fibre (>20 tons per day)
- Ceramic products (>75 tons per day)
- Pulp
- Paper and cardboard (>20 tons per day)
In 2008, the 25 largest companies subject to the ETS accounted for 50% of EU25 emissions whilst
the smallest 80% of installations represented only 10%.
36
www.ec.europa.eu/clima/policies/ets.oversight_en.htm. Retrieved on 11 February 2011. 37
Art. 3 of the 2003 EU Directive. 38
Art. 3 of the 2003 EU Directive. 39
Annex I to the 2009 EU Directive. 40
The ETS applies to units which rated thermal input exceeds 20MW (aggregated) and that burn fuel for the purpose
of energy production (except in installations for the incineration of hazardous or municipal waste). Capacities of
different stationary units on a same site are aggregated even in the absence of any technical connection.
Combustion installations include electricity generators, boilers, combined heat and power (CHP) technologies, gas
turbines (including compressors) and the incineration of waste where the primary purpose is to produce energy. They
do not include ovens, dryers, fryers and incineration where the primary purpose is to dispose of municipal or
hazardous waste.

Cedric Wells - MBA ENASS 2009-2011 - Carbon credits and Insurance 31
By far and large, combustion is the primary source of emissions in the EU:
73
8
8
72
1 1
EU ETS emissions by sector in 2009
Combustion includingproduction of
electricityRefinery
Cement
Iron & steel
Ceramic & glass
Source: European Commission
The companies most exposed to the ETS appear to be those from the Utilities sector. Based on a
sampling exercise, the CDP Report Europe 30041
shows that 48% of direct emissions come from
utilities electricity & gas industries, independent power producers & energy traders and multi-
utilities.
Subject to strict conditions, Member States may exclude from the ETS installations which have
reported less than 25,000 tons of CO2 equivalent and, when they carry out combustion activities,
have a rated thermal input below 35MW. Hospitals may also be excluded if they undertake
equivalent measures42
.
b. Extension of the ETS to additional sectors
Phase 3 of the ETS will extend to additional industries as from 1 January 2013 (as listed in Annex
I to the 2009 EU Directive).
Aviation
Based on Directive 2008/101/EC (which came into force on 2 February 2009), all civil flights
operating within, arriving into and departing from airports in Member States will be subject to the
ETS as from 1 January 2012,
The emissions cap for the aviation sector during year 2012 and Phase 3 of the ETS will be based
on the overall emissions of the sector for the 2004-2006 period. Allowances will be distributed
among operators according to Revenue Ton-Kilometres (RTK) produced in 2010. Companies will
receive free allocations representing 85% of the allowed emissions and the remaining 15% (or in
fact more since actual emissions are expected to exceed allowances) will be auctioned. The market
is semi-open: companies from the aviation sector will be allowed to purchase credits from ground
41
https://www.cdproject.net/CDPResults/CDP-2010-Europe-300-Report.pdf. Retrieved on 21 December 2010. 42
Article 27 of the 2009 EU Directive.

Cedric Wells - MBA ENASS 2009-2011 - Carbon credits and Insurance 32
sector companies whilst aviation allowances cannot be used by other sectors for compliance. No
revisions of the scheme will be possible until 2014.
The cost of the ETS to airlines has been estimated at $55 bn for the period running from 2011 to
2022 (CDP 2010).
The lawfulness of the extension of the ETS to aviation has been challenged before the European
Court of Justice (as referred to by the High Court in London) by the Air Transport Association of
America (ATA) and by three US-based airlines (American, Continental and United). The
companies allege that the ETS violates national sovereignty over states’ airspace, the Chicago
convention and several international bilateral agreements.
Other activities
- Primary and secondary (>20MW) aluminium
- Production and processing of non-ferrous metals (> 20MW)
- Mineral wool insulation material
- Drying or calcination of gypsum or production of plaster boards and other gypsum
products (>20MW)
- Production of carbon black
- Nitric acid
- Adipic acid
- Glyoxylic acid
- Ammonia
- Bulk organic chemicals (>100 tons per day)
- Hydrogen and synthesis gas by reforming or partial oxidation (>25 tons per day)
- Soda ash
- Sodium bicarbonate
It is noteworthy that transport and buildings are not currently covered by the ETS despite their
representing the largest share of CO2 emissions after the energy-intensive and power-generation
industries.
41%
22%
20%
7%
10%
World CO2 emissions by sector in 2008
Electricity and heat
Transport
Industry
Residential
Others
Source: IEA, 2010
43
Also, neither agriculture nor forestry were included in the Kyoto Protocol’s scope of CDMs
(which is incorporated into EU law) due to the difficulties of accurately measuring emissions from
43 http://www.iea.org/CO2highlights/CO2highlights.pdf. Retrieved on 21 December 2010.

Cedric Wells - MBA ENASS 2009-2011 - Carbon credits and Insurance 33
these sectors. The Reducing Emissions from Deforestation and Forest Degradation (REDD) is a
UN scheme intended to enable countries to sell carbon credits linked to forestry preservation
schemes. Projects generate carbon certificates that can be traded on the voluntary carbon market.
c. Gases covered by the ETS
The scope of gases covered by the EU scheme is in line with that of the Kyoto Protocol (Gases)44
.
The 2009 EU Directive however has extended the GHGs definition to “other gaseous constituents
of the atmosphere, both natural and anthropogenic, that absorb and re-emit infrared radiation”45
.
It also allows Member States, from 2008 onwards, to apply emission allowance trading to
activities and to GHGs which are not listed in Annex I of the 2009 EU Directive (“Categories
subject to which this directive applies”46
) subject to the EU Commission’s prior approval47
.
It will be noted that nuclear energy is not on the EC’s list. This follows the current perception -
which is the subject of much controversy - that nuclear energy is CO2-free and that as such it
should enjoy a full exemption from the ETS.
Separately, the EC has launched a study concerning the possible development of an EU NOx and
SO2 emission trading scheme by July 2020 for the Intergovernmental Panel on Climate Change
(IPCC) installations.
d. Carbon finance parties at risk in CDM/JI projects
The industries listed in Annex I to the 2009 EU Directive as amended are not the only companies
which face carbon credit-related risks. A large number of other stakeholders have an interest in
CDM/JI projects:
44
Annex II to the 2003 EU Directive. 45
Article 2 of the 2009 EU Directive. 46
This Annex in fact limitatively refers to activities involving carbon dioxide, perfluorocarbons and nitrous oxide. It is
therefore unclear as to whether the “other gaseous constituents of the atmosphere” as in Article 2 of the 2009 EU
Directive extends beyond the 6 gases listed in Annex II to the Kyoto Protocol. 47
Article 25 of the 2009 EU Directive.

Cedric Wells - MBA ENASS 2009-2011 - Carbon credits and Insurance 34
Project
Companies
Design CDM/JI projects. May forward sell the CERs/ERUs which the projects are expected to
deliver.
Carbon
credit buyers
Purchase CERs/ERUs for compliance (companies subject to the ETS) or speculation purposes.
Suppliers
(contractors)
Provide advisory services and/or equipment necessary to run a project. The delivery of
CERs/ERUs may be offered as a form of payment in the supplying contracts.
Operators Deliver operational and maintenance services.
Carbon fund
managers
Private or public entities that receive money from investors (companies, trading desks, etc.) to
purchase CERs/ERUs.
Invest in a large number of CDM/JI projects in order to guarantee the delivery of CERs/ERUs to
the participants in the fund.
Project
financiers
Banks that lend money to finance CDM/JI projects. Carbon credits can be pledged in return. The
delivery of CERs/ERUs may be offered as a security by the Project Company (in addition to
cash flow and assets). Will want to on-sell CERs/ERUs.
Investors Companies or local authorities that invest equity in a project. The delivery of CERs/ERUs may
be offered as a security by the Project Company (in addition to cash flow and assets). Will want
to on-sell CERs/ERUs.
Stakeholders involved in CDM and JI projects
The main contractual relationships can be summarised as follows:
* net of CERs/ERUs retained for compliance purposes
SERVICE
EQUIPMENT
OPERATIONS
MAINTENANCE
LOANS
SALE
EQUITY
PROJECT COMPANY
SUBCONTRACTORS
SUPPLIERS
OPERATORS
FUNDING
Investors Banks
CLIENTS
ENERGY
SERVICES
CERs/ERUs*
COMPANY
INTERMEDIARY
CARBON FUND
An Emissions Reduction Purchase Agreement (ERPA) is a contract by which a seller (project
company, trader, Annex I or non-Annex I party, etc.) agrees to deliver carbon credits (whether
allowances or offsets) to a buyer (end-user, Annex I party, trader, etc.) at a specified price and date
(see Futures). Payment may be made upfront or on delivery (i.e. when the buyer’s registry account
has been credited with the credits).
Specifically in relation to CDM and JI projects, the ERPA may also provide the buyer with an
option to purchase additional credits/a right of first refusal. The entire legal and beneficial title of
the credits is passed onto the buyer on delivery. The buyer may also bear all costs and expenses
relating to the validation, registration and certification process of a project.

Cedric Wells - MBA ENASS 2009-2011 - Carbon credits and Insurance 35
Key risks associated with ERPAs involve:
- (for the seller): payment default or insolvency of the buyer
- (for the buyer): shortfall in delivery of the credits, late delivery or delivery failure. Delivery
failure may be due to non-compliance with the UNFCCC and/or local regulatory requirements
or for reasons beyond the seller’s reasonable control such as acts of God, of a government or
the UNFCCC.
The financial consequences are multiple:
- (for the seller): unsold carbon offsets
- (for the buyer): project-related costs and expenses incurred for no result, need to purchase
credits elsewhere at a possibly higher value in order to meet compliance obligations (if the
end-user) or meet a contractual obligation (if a trader).
ERPAs should provide for remedies available in such cases of default. They may include:
- (for both parties): right to terminate the contract (material breach of contract or
misrepresentation by a party, failure of the project to achieve milestones within the agreed
timeframe or dissolution or bankruptcy of the project, change in law such that the contract
becomes illegal or unenforceable, etc.), damages
- (for the buyer): price reduction (in the event of a production failure or a verification failure),
right to terminate the contract and reimbursement of all costs and damages (seller’s gross
negligence, fraud or wilful misconduct), damages, liquidated damages, duty to provide
replacement CERs or make-up
- (for the seller) right to terminate the ERPA (buyer’s failure to pay the contract price), damages.
The IETA and the Wold Bank have drafted standard ERPA terms which interested parties are free
to use (IETA ERPA® version 3.0.200648
to be read in conjunction with the Code of Terms®
version 1.0 200649
).
e. Risks raised by the ETS
At some point in time50
, companies that are subject to the ETS restrictions will cease to receive
sufficient allowances to match their actual and/or projected CO2 emissions. The only option will
therefore be to reduce emissions by investing in “clean” applications e.g. running on natural gas in
place or in addition to fossil fuels (such as coal, oil or petroleum coke). Cogeneration51
and
combined cycle gas turbine power52
plants can help achieve significant emissions reductions.
However even this may prove insufficient, leaving companies with the option either to purchase
carbon offsets (subject to there being enough available on the markets) or to pay a penalty.
48
http://www.ieta.org/assets/TradingDocs/cdmerpav.3.0final.doc 49
http://www.ieta.org/assets/TradingDocs/ietacodeofcdmtermsv%201%202.pdf 50
Which will vary from one sector to another depending on how sectors are treated by the ETS under Phase 3. Some
sectors such as the utilities were already faced with a shortage of emission allowances under Phase 2. 51
A cogeneration plant is a plant that simultaneously produces heat and electricity (otherwise known as Combined
Heat and Power - CHP). The waste heat from the combustion process is captured and processed through a heat
recovery steam generator which extracts energy from the waste heat and uses it to produce steam. Locating the plant
next to the point of use adds to the efficiency of cogeneration. 52
A combined cycle operation power plant is a plant consisting of gas turbine generator units, steam generators, a
steam turbine and a generator with a feedwater system and a condenser. Such plants offer a high degree of thermal
efficiency by capturing the heat exhaust expended by the gas turbine.

Cedric Wells - MBA ENASS 2009-2011 - Carbon credits and Insurance 36
Shortage situations may occur as a result of a foreseeable event (such as an expected increase in
consumers’ demand for a particular good or a drop in prices in the context of a recession period).
Although there can be some debate as to the “foreseeability” concept, this study will assume that
perils associated with market forces and economic projections do not meet the universally
admitted criteria for insurability notably by lack of fortuity.
This study will therefore focus on two particular types of risks:
- unforeseeable events that may result in a company not holding enough carbon credits to make
up for its GHG emissions,
- financial losses as a result of the non-delivery of carbon offsets (whether purchased or self-
produced).
Additional cost of purchasing carbon credits as a result of an industrial accident
Damage to “standard” property
A company may have to increase its CO2 emissions consequent to property damage, a
machinery breakdown or a lack of supply (e.g. gas shortage). In such circumstances, a
company may decide to use (or hire) spare or alternative (but more polluting) machinery in
order to maintain or restore production as soon as possible53
. A company will consider such an
option in order (a) to meet any contractual obligation it has to supply its clients and (b) to
mitigate a (supposedly covered) business interruption loss. Increased emissions will require
that the company uses any spare allowances or offsets it has and/or purchases the balance on
the spot market if its emissions cap is exceeded.
There are numerous precedents of such situations arising. For example, several years ago, one
of Pernod Ricard’s plants had to purchase 10,000t CO2 worth of carbon credits on the spot
market following the breakdown of fuel-fired boiler. By using a spare boiler running on coal,
emissions rose beyond the plant’s allocated allowances. The cost of purchasing additional
quotas turned out to be marginal due to low market prices at the time and to the limited volume
of credits involved (no insurance claim was made). However amounts at stake could have been
significantly greater for an installation emitting much higher levels of CO2.
Companies may also have to purchase alternative product (ore, gas, etc.) so as to comply with
its contractual obligations. The cost of the alternative product may incorporate higher carbon
costs if provided by a less efficient company.
Damage to “energy-efficient” property
In this case damage would affect a company’s “green” assets (e.g. a high efficiency natural gas
plant) which had been specifically purchased in order to reduce GHG emissions. In addition to
a partial or total loss of its asset, a company would lose the value of the carbon credits it could
have sold (or saved) but for the accident and would face increased production costs.
53
Such an option my not prove possible for very heavy production units. One energy underwriter noted that if an
insured electricity producer temporarily lost a boiler that was critical for production purposes, it would likely cost it
(therefore the insurers) less to have the machinery breakdown repaired and purchase MWts on the spot market to
honour its supply contracts than to wait until a spare is delivered and started-up on site. This survey however will
assume cases where switching to spare or alternative machinery makes economic sense.

Cedric Wells - MBA ENASS 2009-2011 - Carbon credits and Insurance 37
Markus Heiss (MD&D) gave an example of a pulp manufacturer which due to the technology
employed in pulp manufacturing was energy self-sufficient. However following an insured
incident the company had to start up a stand-by boiler that emitted CO2. The company as a
result had to purchase additional EUAs on the market and incur higher fuel costs.
Both risks of increased emissions above involve the notion of carbon intensity. Natural gas is
known to be the less polluting of all the fossil fuels (see EPA figures below). It is primarily
composed of methane and its main end products are carbon dioxide and water vapour when it is
combusted. Coal and oil contain a much higher carbon ratio (as well as higher nitrogen and
sulphur contents) and they release ash particles which do not burn thus contributing further to the
pollution of the atmosphere.
Fossil fuel emission levels
(pounds per bn Btu of energy input)
Pollutant Natural Gas Oil Coal
Carbon Dioxide 117,000 164,000 208,000
Carbon
Monoxyde 40 33 208
Nitrogen Oxides 92 448 457
Sulfur Dioxide 1 1,122 2,591
Particulates 7 84 2,744
Mercury 0.000 0.007 0.016
Source: IEA, Natural Gas Issues and Trends, 1998
By way of an example, the start-up of a spare or alternate generator fired by coal instead of natural
gas can more than double CO2 emissions (circa 0.4t vs. 1.0t of CO2/MWh). The difference in the
carbon factor gap is even greater with high efficiency natural gas fired power plants which can
produce up to 70% lower carbon emissions than coal fired plants.
The impact of carbon allowance price on a company’s operating profit as a result of a plant outage
and the subsequent need to switch to less efficient production can be significant – see some
examples provided by Marsh 54
.
Risk of non-delivery of carbon offsets (CDM/JI projects)
CDM and JI projects currently concern approximately 3,000 installations outside the EU that use
different renewable technologies including, but not limited to, hydro, wind and solar power,
efficiency projects, sequestration, methane recovery, bio fuels, reforestation projects, oil and gas
operations (such as avoiding leakage and fuel switching opportunities) and flare gas recovery.
54
Remodelling business interruption insurance in the power sector, Marsh, 2006 –
www.marsh.co.uk/media/Power_BII.pdf.
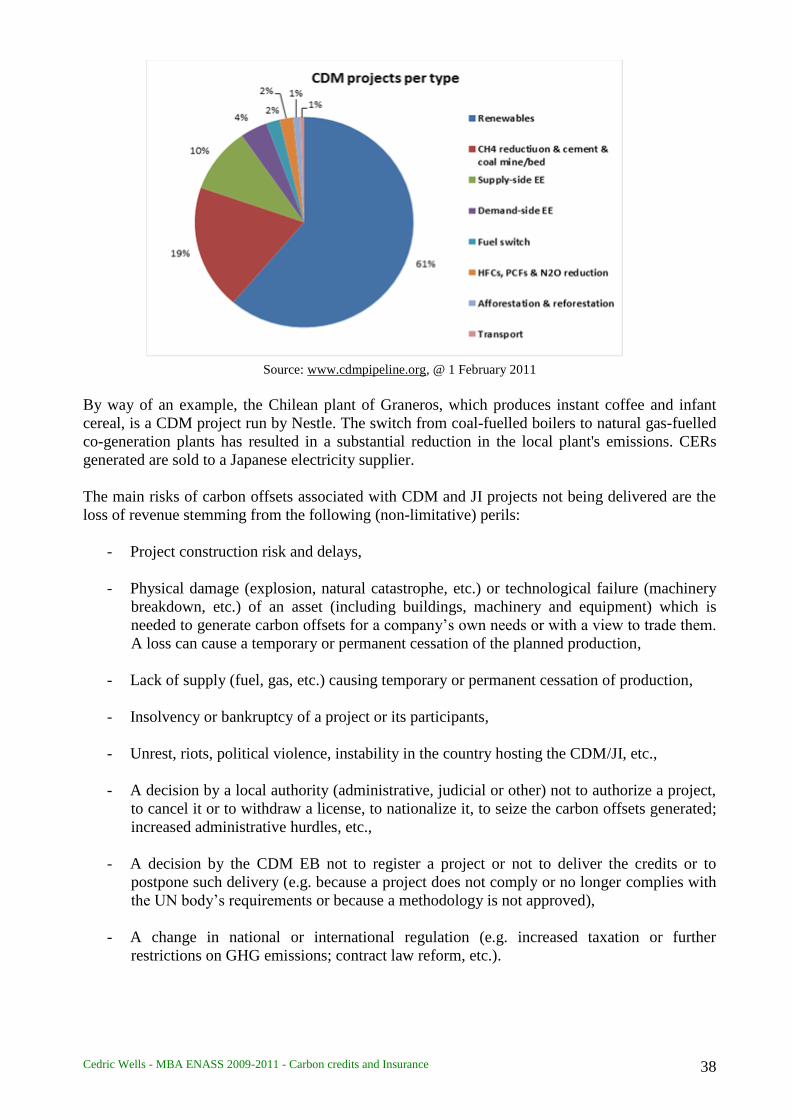
Cedric Wells - MBA ENASS 2009-2011 - Carbon credits and Insurance 38
Source: www.cdmpipeline.org, @ 1 February 2011
By way of an example, the Chilean plant of Graneros, which produces instant coffee and infant
cereal, is a CDM project run by Nestle. The switch from coal-fuelled boilers to natural gas-fuelled
co-generation plants has resulted in a substantial reduction in the local plant's emissions. CERs
generated are sold to a Japanese electricity supplier.
The main risks of carbon offsets associated with CDM and JI projects not being delivered are the
loss of revenue stemming from the following (non-limitative) perils:
- Project construction risk and delays,
- Physical damage (explosion, natural catastrophe, etc.) or technological failure (machinery
breakdown, etc.) of an asset (including buildings, machinery and equipment) which is
needed to generate carbon offsets for a company’s own needs or with a view to trade them.
A loss can cause a temporary or permanent cessation of the planned production,
- Lack of supply (fuel, gas, etc.) causing temporary or permanent cessation of production,
- Insolvency or bankruptcy of a project or its participants,
- Unrest, riots, political violence, instability in the country hosting the CDM/JI, etc.,
- A decision by a local authority (administrative, judicial or other) not to authorize a project,
to cancel it or to withdraw a license, to nationalize it, to seize the carbon offsets generated;
increased administrative hurdles, etc.,
- A decision by the CDM EB not to register a project or not to deliver the credits or to
postpone such delivery (e.g. because a project does not comply or no longer complies with
the UN body’s requirements or because a methodology is not approved),
- A change in national or international regulation (e.g. increased taxation or further
restrictions on GHG emissions; contract law reform, etc.).

Cedric Wells - MBA ENASS 2009-2011 - Carbon credits and Insurance 39
As illustrated below, other than those due by virtue of ERPAs to buyers of carbon offsets, CERs
and ERUs can be owed by the Project Company to a one or more parties as a form of payment or
security. All such parties are therefore potentially exposed to the risk of non-delivery.
CERs/ERU
s
CERs/ERUs
CERs/ERUs
CERs/ERUs
PROJECT COMPANY
SUBCONTRACTORS
SUPPLIERS
OPERATORS
FUNDING
Investors Banks
1.3 Companies are aware of the costs and risks of the ETS
Companies that are subject to the ETS are generally well aware of its implications and have been
very proactive on the lobbying front. They are generally supportive of the cap and trade system to
the extent that it does not distort competition. Efforts prompted by carbon leakage threats55
have
succeeded in obtaining a portion of free allowances for a large number of sectors beyond 2013.
a. Reducing energy costs is a priority irrespective of the ETS
Reducing emissions by switching to lower carbon energy sources (such as natural gas or biomass)
and means of production has become a primary concern for industries with energy costs
increasing56
. The International Energy Agency (IEA) has predicted that fossil-fuel prices will
continue to rise in the decades to come as a result of increased price pressures on international
markets (with primary energy expected to rise by 36% between 2008-2035) and more costly cap
and trade related penalties57
.
55
- The Grahame Institute for Climate Change actually concluded in a report published in 2010 that “most of the
sectors entitled to free emission permits are not facing an increased risk of closure or relocation outside of the EU as
a consequence of permit auctioning”. See Centre for Economic Performance, “Still time to reclaim the ETS for the
European tax payer”, 2010.
- Over 80% of respondents to a 2010 Point Carbon survey said that they did not intend to relocate production:
http://www.pointcarbon.com/research/promo/research/.
- In a 2008 report, the IEA concluded that the ETS “has not, so far, triggered observable carbon leakage in sectors
studied (steel, cement and primary aluminium)”. Issues behind competitiveness and carbon leakage, IEA, October
2008. http://www.iea.org/papers/2008/Competitiveness_and_Carbon_Leakage.pdf 56
“La finance carbone: en quoi le marché du CO2 peut-il être un outil au service de la performance des entreprises ?”,
2006, M. Diakhate, INSEEC dissertation.
http://www.developpementdurable.banquepopulaire.fr/ddfr/liblocal/docs/travaux-etudiants/memoire-finance-
carbone.pdf. Retrieved on 30 December 2010. 57
World Energy Outlook, IEA, http://www.worldenergyoutlook.org/. Retrieved on 22 December 2010.

Cedric Wells - MBA ENASS 2009-2011 - Carbon credits and Insurance 40
Energy costs currently account for a third of Rio Tinto Alcan’s average global aluminium smelting
production costs. They account for 40% of Lafarge’s cement production costs and the variations in
fuel costs have a significant financial impact on the group’s logistical costs.
Olivier Dufour (Rio Tinto) said that rising energy costs combined with the level of uncertainty
stemming from the EU environmental energy regulation were such that Rio Tinto had made no
major investment in Europe since the early 90s. The group instead had turned to countries with no
CO2 (or SO2) regulation. Dufour also emphasized that nuclear-generated electricity was key to Rio
Tinto’s European strategy. He said that France stood out in the EU because of its low energy
production costs: it is one of the only EU countries in which the company can contemplate the
long-term investments which aluminium production typically requires (circa EUR 2 bn for 25-40
years of production).
Higher energy prices will in some cases cause emissions to increase. Shell expects this to happen
in the future as higher oil prices offers the group opportunities to extract oil and gas at higher
production costs (e.g. oil sands in Alberta and a GTL project in Qatar).
There are various ways of mitigating the increase in energy prices.
One interviewee said that its company had developed a diversified and balanced energy production
mix consisting of nuclear, coal, natural gas (CCGT), combined heat and power (CHP), hydro
plants, wind farms and biomass fired plants. This enables the group to react to market price
fluctuation. The company is also developing CCS solutions.
Companies’ exposure to energy costs however is very much dependent upon their energy-mix
(high/low carbon thermal, nuclear, renewables & other) which may vary significantly as the
following chart shows:
Energy mixes of Utility companies in the EU- Source: CDP 2010
Pierre Albano (Air France) said that his group was totally dependent upon technology and the
quality of fuel in its struggle to reduce emissions. 99% of the company’s emissions are generated
by its planes which consume liquid fuel – which will not change until renewable sources are

Cedric Wells - MBA ENASS 2009-2011 - Carbon credits and Insurance 41
available. The way the group believes it can reduce its emissions is mainly by modernizing its fleet
and engines, by improving fuel efficiency, fuel management and operating procedures, and by
reducing the weight carried by aircrafts58
. The current ETS scheme also incentivizes the use of bio
fuels through a zero emissions factor. It is also noteworthy that an industry-wide effort initiated by
the IATA (International Air Transport Association), which represents more than 90% of airlines
worldwide as well as manufacturers, airports and air traffic control bodies, committed at the
Copenhagen Conference to reduce overall carbon emissions by 50% by 2050 compared to 2005
levels.
Dufour said that the aluminium sector had reduced its PFC emissions by 90% since the 1990s, i.e.
even before the Kyoto Protocol was adopted. In France, Rio Tinto voluntarily committed to reduce
its emissions as a member of the multi-sectorial Association des Entreprises pour la Réduction de
l’Effet de Serre (AERES) which was established in 2002. Energy efficiency and the reduction of
GHG emissions are pillars of the group’s Research & Development activity. Rio Tinto prides itself
on being the leader of energy efficient aluminium smelting technology which it believes will
become a competitive advantage.
Another example of an effort to protect oneself against energy price escalation is Exeltium.
Exeltium is a special purpose vehicle gathering a number of electro-intensive European industrials.
The company entered into a long-term partnership agreement with EDF on 31 July 2008. The
agreement, initiated by the French government within a specific legislative framework (and with
the EC DG Competition’s late blessing), will secure around 148Twh (13 Twh per year) over a
period of 24 years to 26 companies in France. The financing (EUR 3.7 bn) is based on an upfront
payment by the consortium reflecting the evolution of the development costs of new nuclear plants.
Dufour formed the view that the Exeltium agreement, albeit limited to the French territory,
amounted to a form of insurance against the volatility of energy prices but also against CO2
certificate market risk since the energy supplied is of nuclear origin i.e. CO2-free.
Companies’ efforts to reduce energy costs by using cleaner fossil fuels and renewable sources of
energy has already enabled most industries to achieve substantial emissions reduction levels over
the past years59
. The ETS and its penalties are therefore a further incentive to cut down emissions.
It is also perceived as an opportunity to develop alternative energies (such as bio fuels) and to
invest in new technologies (such as CCS projects).
CDM/JI projects are located in emerging economies due to those societies’ increasing demand for
energy and new industrial production plants. They present an ideal and timely opportunity to
introduce technical measures that reduce pollution emissions during planning phases. Indeed,
starting from Greenfield and applying a less polluting process at design stages will cost far less
and be a lot more efficient than upgrading and retrofitting existing production installations.
b. Carbon credits so far have made companies richer
During Phases 1 and 2 of the ETS, companies have in fact hardly been exposed to carbon credit
risks for two major reasons. The first is that they received allowances for free. The second is that
they received more than they actually needed.
58
CDP 2010. 59
Impact of the ETS on power sector investments: a survey of European utilities, New Energy Finance, 2009.

Cedric Wells - MBA ENASS 2009-2011 - Carbon credits and Insurance 42
It must be stressed that until recently companies subject to the ETS have broadly (some sectors
excepted) generated windfall profits from the allowances they were granted. A survey by Point
Carbon estimated that profits during Phase 2 had reached EUR23-63 bn in 5 countries60
. The
electricity sector alone benefited some EUR20 bn worth of free permits which it was able to trade.
The cement industry is also believed to have generated over EUR260 million in sales of
allowances in between January and September 2010 which according to calculations made by
Moody’s amounted to approximately 8% of the sector’s operational profit61
. Quotas received by
RWE were worth 5% of the company’s balance sheet and 7% of its capitalisation in 200762
.
The Europe 300 2010 CDP chart below shows the positive impact of emissions rights in 2009 on
10 companies representing the Materials sector.
Positive impact of surpluses of emissions rights (m) in 2009 - Source: CDP 2010
63
The still awaited ETS Phase 3 rules are intended to prevent profits other than those actually
generated through positive efforts to reduce emissions as from 2013.
In actual fact, some companies have seen their actual emissions exceeding permits for the first
time in 2008. Electricity producers were mostly affected with a 270Mt deficit i.e. circa 24% more
emissions than the allowances which they had received.
60
http://assets.panda.org/downloads/point_carbon_wwf_windfall_profits_mar08_final_report.pdf - ETS Phase II -
The potential and scale of windfall profits in the power sector, a report for WWF by Point Carbon Advisory Services,
March 2008. Retrieved on 22 December 2010. 61
La Tribune, 13 December 2010. 62
http://www.afte.com/files/afte/Let234_p18-19.pdf Retrieved on 27 August 2010. 63
https://www.cdproject.net/CDPResults/CDP-2010-Europe-300-Report.pdf. Retrieved on 22 December 2010.

Cedric Wells - MBA ENASS 2009-2011 - Carbon credits and Insurance 43
c. Carbon credits are now recognized as a production cost
The cost of reducing emissions and meeting compliance requirements is now part of companies’
underlying business operations. Carbon credits are viewed as assets (whether granted or
purchased) and a production cost (as are fuel costs).
Alexandre Kossoy (World Bank) agreed that offsetting carbon emissions was just an additional
cost in the production process for most industries subject to cap and trade schemes (several
European and Japanese industries and utilities participate in the World Bank’s carbon funds).
The Europe 300 2010 CDP chart below provides an interesting estimate of the potential CO2 costs
in 2010 under the ETS for 6 companies representing the energy sector. The chart assumes a 30%
shortage of allowances in Phase 3 and a CO2 price of EUR25/tCO2.
Estimates of potential CO2 costs (m EUR) in 2013 under the ETS - Source: CDP 2010
64
Total’s economic model and all its operational decisions account for the cost of CO2 to the
company (EUR25 per ton, rising with inflation). This price is higher than the current carbon price
but consistent for the future estimation of the assumptions and criteria which decisions on long-
term investments will require. Total estimates that CO2 could have a potential financial implication
on its business of EUR1.5 bn (based on 60Mt CO2-e times EUR25 per ton, gross of allowances)
(CDP 2010). Such estimate is notional however compared to the group’s EUR180 bn revenue in
2008 and aims at assisting in highlighting the potential cost of evolving carbon prices.
GDF Suez assumes a carbon credit market price of EUR20/t which would amount to an overall
cost of EUR1 bn per year (CDP 2010).
Shell also expects a growing share of its carbon emissions to be subject to regulation. The
company recognises that this will carry a cost. Shell has factored carbon costs in its financial
planning and investment decisions since 2000. It currently assumes a cost of $40 per ton in its
economic modelling (CDP 2010).
64
https://www.cdproject.net/CDPResults/CDP-2010-Europe-300-Report.pdf. Retrieved on 22 December 2010.

Cedric Wells - MBA ENASS 2009-2011 - Carbon credits and Insurance 44
Jean-Luc Dupuis said that Vallourec had estimated a confidential cost range projection for Phase 3
(subject to the evolution of the carbon credit price) with an expectation that more of the company’s
plants would be subject to the ETS.
Nestlé is expected to end up Phase 2 in a surplus position with profit (relating to carbon credits) in
the region of EUR5m. This will change in Phase 3 at which point in time Nestlé has calculated that
its 5 coffee factories that are subject to the ETS would cost EUR 6,5m per year (based on current
carbon prices) save for any regulatory exemption.
Olivier Dufour (Rio Tinto) said that measuring emissions was not a problem but assessing the
future cost of CO2 was. The post-2013 financial impact of the ETS to Rio Tinto has been assessed
to the extent possible (a lack of visibility remains) and factored into the group’s business plan and
operational decisions. Projections of worst, average and best case scenarios for the cost of CO2 in
Phase 3 are made based on a number of variables (spot prices of aluminium and petrol, inflation,
etc.) and a distinction is made between OECD and non-OECD states. More particularly, Rio Tinto
has estimated that the cost of the draft legislation recently introduced in the US, Australia and New
Zealand would be in the region of $1 bn (CDP 2010).
Carbon is becoming a paramount item of risk management and business/investment decisions in
carbon-intensive industries. When the risks are identified and a value is put on them, a high level
of uncertainty remains which is a major problem particularly for long-term projects which the
larger emitters typically invest in.
Companies know that they will be short of credits in Phase 3 of the ETS65
. As such, they are
already preparing to purchase quotas if energy savings are insufficient to cover emissions in the
future.
Many companies believe that carbon credit cost and volatility can be neutralised through price
index clauses. The risk is therefore transferred to its clients. Sales contracts are often on a cost plus
basis i.e. the price of the goods delivered includes the cost of the item itself but also the seller’s
expenses in producing it. Specifically, indexation clauses in a contract will allow sales to reflect
the volatility of the cost of the fuels used in the company’s production. Air France now factors the
fluctuation of oil prices in the price of the tickets it sells (fuel surcharge type). One representative
of a large energy company said that delivery contracts it entered into now tend to contain flexible
contract price provisions in order to factor the possible fluctuation of carbon prices
d. Hedging solutions available on the financial markets
Because carbon credits are commodities66
companies are inclined to turn to financial markets
when seeking some form of protection against the volatility risk. Just like any other commodity,
65
Over two thirds of respondents to a 2010 Point Carbon survey expect to be short in Phase 3 -
http://www.pointcarbon.com/research/promo/research/ 66
Carbon credits are a unique type of commodity in that they have evolved ex nihilo out of the idealism of states.
They have mainly been characterized as virtual and intangible because they have no underlying inherent value and
because there would be no natural demand for them but for state regulation. Some dissenting opinions consider that
carbon credits are hybrid assets (or “quasi-commodities”) somewhere between commodities (when traded in cash) and
financial instruments (derivatives).
Cedric Wells - MBA ENASS 2009-2011 - Carbon credits and Insurance 45
carbon credits can be exchanged privately between operators (over the counter or through forward
contracts) or traded on a dedicated spot market (exchange trading). As such, they can be managed
in the same way as currency risk, interest rates and raw materials prices are.
Carbon credits are considered good quality commodities because they are issued by governments
(or international institutions), what is more in a strong currency (euros or dollars). A further
advantage is that the CO2 metric measure is universal. Indeed, there is scientific consensus that 1
ton of CO2 emitted in China is equivalent to 1 ton of CO2 emitted in Chile67
. By contrast, 1 litre of
water captured at the Niagara Falls will not equate 1 litre of desalinised water produced in Qatar.
Is a carbon credit a good (as per the General Agreement on Tariffs and Trade definition) or a
service (as per the General Agreement on Trade in Services definition)? Should it be classified as a
governmental grant or a tradable asset? Is trading carbon credits and derivatives a financial
service?68
There are no clear answers to these questions in the ETS. This is a major concern
highlighted by the 19 April 2010 Prada report which was commissioned by the French
Government69
. The report notes that credits traded on exchanges are regulated (as financial
services) whereas over the counter and spot transaction are not. Determining which regulatory
entity should supervise activities pertaining to commodities such as carbon credits is a further
issue. It is not clear, in the USA for example, which of the bodies in Chicago (commodities) or
New York (financial instruments) should be competent.
Derivatives are financial instruments which value fluctuates according to the cost of an underlying
security such as a commodity. Although very much traded for speculation purposes, their primary
purpose is to cover financial risks of a company.
The derivatives most commonly used to hedge against risks are contracts on firm trading of an
underlying security between a seller and a buyer (including forwards70
, futures71
and swaps72
) or
contracts providing the buyer or the seller with an option73
to buy or sell same underlying security
(calls and puts).
Jean Fournier (Global Aerospace)’s view was that what people pay for when they purchase oil is exploration, refining,
distribution and sales costs - not the actual value of the resource which, in case of carbon energy, takes thousands of
years to reconstitute. In this context, carbon credits stand as a valuation of the consumption of fossil fuels. 67 According to Pierre Albano, VP Environment at Air France, measuring the GHG emissions generated by aircraft
engines raises no difficulty and there is a consensus on the methodology. Burning one ton of kerosene equates to
producing 3.15 tonnes of CO2. However, there is some debate as to how neutral biofuels, which airlines such as Air
France are calling for as a sustainable alternative to fossil kerosene, actually are neutral. On another matter, some
scientists assert that the water vapours which airplanes also emit contribute to the climate change. Their view is that in
the high atmosphere and under certain saturation conditions, water vapours can accelerate the formation of cirrus
clouds which, as is well established, prevent infra reds from escaping into the atmosphere thus provoking the
greenhouse effect. A number of NGOs have sought - to no avail so far - to have the EU lawmakers include a multiplier
factor for such situations. 68
http://www.iea.org/work/2010/et/Pauwelyn.pdf. Retrieved on 31 December 2010. 69
http://www.economie.gouv.fr/services/rap10/100419rap-prada.pdf (in French). Retrieved on 31 December 2010. 70
A forward contract on carbon credits is an over the counter contract between a buyer and a seller to buy or to sell a
specified quantity of carbon credits at a specified date and price. Payment of the forward price (or “rate”) is made by
the buyer before the asset changes hand. 71
A futures contract is similar to a forward contract except that it is traded on an organized and standardized market
(which clearance house provides protection against counterpart risks) at a market determined price (the futures price).
The holder of the futures must make or take delivery at the given date. Futures account for 90% of carbon trading. 72
Commodity swaps are arrangements by which one party exchanges a floating (or market or spot) price of a carbon
allowance or offset against a fixed price over a determined period of time. 73
Options on carbon credits (or offsets) are contracts between a buyer and a seller (or “writer”) which give the buyer
the right (but not the obligation) to buy (call) or to sell (put) carbon credit (or offsets) at a certain date (European
Cedric Wells - MBA ENASS 2009-2011 - Carbon credits and Insurance 46
Companies turn to options (on EUAs and CERs) in order to protect themselves against the risk of
being short of EUAs or CERs. By way of an example, companies that have committed to deliver a
specified volume of carbon credits at a given date (forward or future), purchase calls to hedge the
risk that they might not be able to comply with that obligation. To a large extent, options used for
hedging purposes can be compared to insurance mechanisms solutions. A put option can be
considered as insurance on the price of stock falling. Options therefore offer alternative ways for
companies to transfer risks that may or may not be otherwise insured.
The large profits which Air France posted in between 2005-2007 were partly due to its fuel
hedging policy (which later turned into potential losses when the fuel prices dropped during the
financial and economic crisis). By exercising the calls on fuel it had purchased, the company was
able to post profits when its competitors made losses as a result of the sharp increase in fuel prices.
According to the World Bank, the value of the options market for the carbon sector in 2009 was
$10.6 bn (8.9 bn for EUA options and 1.8 bn for CER options) with calls accounting for 59% of all
options.
Banks and financial institutions have created a large range of trading products involving
allowances and their derivatives. One of them was jointly set up by EcoSecurities and Crédit
Suisse and pertained to 5 million CERs delivered by several CDM projects. Such products enable
investors to choose their level of exposure to the risk of non-delivery of CERs which will depend
on how advanced such projects actually are.
Companies that have their own desks trading commodities (such as electricity, gas, oil, freight,
biomass or coal) typically use them to manage their stock of carbon allowances and carbon offsets.
In most cases, the task assigned to these desks is to manage the company’s portfolio of assets for
compliance purposes and to hedge carbon price volatility. An emission trader will typically have to
decide which is the best trading option (sell, buy, bank, do nothing; hedge now or later, etc.) for its
company’s EUAs and CERs based on actual and forecast exposure of the company’s entities to the
ETS (allowances vs. emissions). The trading of EUAs and CERs is performed over the counter,
through forward contracts, on exchanges with futures and options and on the spot market.
The main platforms trading carbon credits (AAUs, CERs and ERUs) are:
- The European Climate Exchange (for Derivatives) in London (ECX) which is part of the
Intercontinental Exchange group.
- BlueNext, a European carbon allowance and credit exchange platform co-owned by NYSE
Euronext (60%) and the Caisse des Dépôts et des Consignations (40%). The platform,
which covers more than EUR60 bn worth of transactions every year, was created by
Powernext in June 2005 and acquired by NYSE Euronext in December 2007. Its members
can trade both spot and derivative products.
option) or before a specified date (American option) for an agreed price (the strike or exercise price). In return for
granting the option, the seller receives a payment (premium) from the buyer. Options can be traded over the counter or
on exchange trading. The value of options varies on a number of factors, namely (a) the market price and the volatility
of the underlying security, (b) the strike price, (c) the remaining time before the expiry of the option period and (d) the
interest rate (which is necessary to evaluate the actual value of future cash flows).

Cedric Wells - MBA ENASS 2009-2011 - Carbon credits and Insurance 47
- Nord Pool (Nordic Power Exchange), based in Norway. It was acquired by Nasdaq OMX
in 2010.
- The European Energy Exchange (EEX), based in Germany.
There are a number of other emerging markets such as the Commodity Exchange Bratislava (CEB),
the TZ1 (New Zealand), Energy Exchange Austria (EXAA), Climex (The Netherlands),
SendeCO2 (Spain) and Green Exchange.
In the USA, the Chicago Climate Exchange (CCX) operates a voluntary legally binding carbon
trading market. Its members trade permits (VERs) for the six Kyoto Protocol GHGs. 26.3 million
metric tons of CO2 offsets were registered in 2009. Emitting members that reduce emissions
below target may sell surplus allowances or save them. Those who do not comply purchase CCX
Carbon Financial Instrument contracts. Some companies such as Veolia Environment decided to
enter in the CCX notably to prepare its US subsidiary to potential future federal binding emissions
reduction targets.
Selling excess allowances (so far mostly received for free) has proven very profitable (see
Oversupply) for the largest emitters in the EU. Clearly, many companies have also approached
markets with a view to speculate, particularly in anticipation for the expected rise in carbon credit
prices as a result of the economic recovery.
Joffrey Célestin-Urbain, former head of carbon markets division at the French General Directorate
for Energy and Climate74
, said that carbon markets had so far structured as an increasingly
standardized and liquid financial market with the predominant involvement of banks and trading
operated on exchange platforms. He referred to the various financial instruments that are available
on the financial markets to cover risks associated with carbon credits (including the volatility of
prices) and recognized that such products hardly involved insurers. Celestin-Urbain insisted that
carbon markets were young, that consolidation was very much in progress and that they were
bound to turn to insurance at some stage in search for additional or alternative risk transfer
solutions.
74
The General Directorate for Energy and Climate (GDECC) of the French Ministry of Ecology, Energy, Sustainable
Development and the Sea acts as the French DNA to the UNFCCC Secretariat. The GDECC represents France in
international negotiations pertaining to climate change along with other ministerial departments. It is the body that
manages and allocates the 2.8 bn Phase 1 Kyoto Protocol allowances delivered to France. It is granted with
responsibility to authorise and approve participation in CDM and JI projects. The GDEC is also in charge of
implementing the ETS rules in France and supervising the management of the national GHG emissions registry by the
Caisse des Dépôts (CDC).
Cedric Wells - MBA ENASS 2009-2011 - Carbon credits and Insurance 48
2. THE INSURANCE RESPONSE
ABSTRACT
Limited demand for specific insurance
There are various reasons for the limited demand for specific carbon credit insurance:
- Companies would not immediately look to transfer risks associated with production costs
(except where already covered under an ICW section): the volatility of carbon credits is a
business risk which a premium would probably not be worth paying for.
- Oversupply of credits until recently has meant that so far, companies virtually faced no
shortage risk. Surplus credits could be saved for unforeseeable events which insurance might
otherwise have covered. CDM/JI projects (most of which were frozen as a result of the
economic downturn) tend to be considered as optional business opportunities rather than for
compliance purposes.
- Carbon offset buyers are no longer paying for carbon offsets upfront but on delivery which
eliminates any non-delivery risk.
The insurance response (CDM/JI projects)
Niche markets have responded as early as 2005 to the potential needs of the industries. Today
however no more than five companies offer dedicated solutions for CDM/JI projects with
relatively diverse scope of cover offered (regulatory risks in particular may not be insured).
Policies are basically structured as traditional project policies with imperfect adaptation to the
specific risks associated with CDM and JI projects.
Limited sales (if any) to date appear to be due primarily to:
- the financial crisis, which caused some of the innovative insurance solutions to be withdrawn
from the market,
- the mismatches between the comprehensive cover sought by potential buyers (when there were
actually some) and the narrower insurance actually offered, and
- frontrunners being unable to convince timorous following markets to provide the insurance
capacity necessary to cover the large project values at risk.
Despite the high level of regulatory uncertainty (the Kyoto Protocol successor has yet to be agreed
and key details of the ETS Phase 3 rules are still awaited), insurers appear to be confident that
sales will take off, albeit at a low pace, with the economic recovery and increasing compliance
requirements under the ETS.
Key targets would appear to be:
- project companies (the sellers), and
- aggregators (with large portfolios of projects) and captives, both potentially seeking
catastrophic protection, on the buyers’ side.

Cedric Wells - MBA ENASS 2009-2011 - Carbon credits and Insurance 49
2.1 Limited perceived need for specific carbon insurance
Insurance enables a company to transfer a monetary risk to an insurer. Demand for insurance will
depend on:
- how adverse a company is to risk
- its ability to manage risks
- how willing it is to pay for its risks to be transferred.
Insurance solutions are a key element in decisions to invest in or to fund projects. They are
typically used to lower the cost of capital and to improve investors’ risk-return equation.
The CERES “Climate Change Risk Perception and Management” report75
published in April 2010
revealed that:
- climate change-related political and regulatory risks (and associated costs) are of highest
concern to risk managers;
- companies see such risks as imminent however the elaboration of climate risk management
strategies is still in its early stages; most companies do not currently anticipate the need for
specific insurance solutions (in particular, there appears to be very little interest in specialty
coverage for carbon credits/offsets) ; notwithstanding, companies do consider that
insurance is a tool for managing climate risk;
- opportunities for new or extended insurance coverage will not arise until there is greater
clarity in the regulatory environment and a better understanding by insurers of their clients’
needs.
a. A risk companies will typically retain
A business risk
Companies go uninsured for a number of business risks. Petrol companies trade in dangerous parts
of the world, pharmaceutical companies market new drugs without liability cover and industries
are exposed to the volatility of fuel spot prices.
Most if not all industries interviewed by the author considered that risks associated with carbon
credits were part of their normal business (see Business risk) therefore they failed to see the need
for specific coverage.
Companies generally believe that carbon credits raise a similar volatility to that of other
commodities which they trade. A common reaction to most interviewees was: if insurance isn’t
procured (because it cannot be found) to cover the volatility of fossil fuel prices (which values at
stake are considerably higher than for carbon), why should this be done for carbon?
Gaëtan Cadero (Lafarge) said that carbon was factored in the company’s business cases just like
any other cost parameter and that it was not the subject of any specific insurance cover.
75
http://www.ceres.org/Document.Doc?id=591. Retrieved on 21 December 2010.

Cedric Wells - MBA ENASS 2009-2011 - Carbon credits and Insurance 50
Brigitte Poot, Climate Energy Adviser at Total, said that the ETS was not currently considered as a
source of additional risks but rather as a flexible tool destined to help installations meet their
compliance obligations. Total views the ETS as one of many regulations (particularly in the
environmental field) which (a) it must comply with and (b) may affect its business, particularly in
Phase 3 due to the change of allocation rules (the estimated cost of CO2 assuming a EUR30/t
carbon market price is 20-40% of Total’s refinery margin76
). The only difference with other
environmental risks is that there happens to be a value/a market price - with their market’s
fundamentals - for emitting GHGs beyond the free allowances delivered. In Poot’s view there are
mainly three ways of mitigating ETS-related risks: (a) by carrying out emissions reduction projects,
(b) by trading allowances on the carbon market and (c) by launching CDM/JI projects.
Poot could not see prima facie any particular need for external carbon credit insurance. In general,
companies have seldom procured management solutions during Phases 1 and 2. Total’s response
has essentially been to self-prepare to the regulatory changes, to set up an internal steering
committee and to follow-up on compliance requirements. This has worked well, notably due to the
relatively low market price of permits and to the increasing number of surplus allowances resulting
from the reduction of industrial sites’ activities in the past years.
One person in charge of CDM projects for a large group said that he did not see the need or added
value of insurance to cover the various risks associated with CDM projects. His view was that such
risks were identified and factored in the price its company agrees to pay for the delivery of CERs.
He added that its company had the expertise to determine the quality of energy-related projects and
that its teams would typically conduct an in-depth review of the project specifications prior to
entering into a CER purchase agreement.
Two other interviewees said that a way to mitigate the risk of a catastrophic loss when purchasing
CERs could be found through dispersion in terms of technology (i.e. varied types of projects), size
and geography (i.e. spread over several continents). They accepted that the latter could not yet
satisfactorily be achieved because a large majority of CDM projects were based in China (which is
due to China offering a particularly attractive environment). In marked contrast, areas such as the
Middle East and Africa with promising possibilities to cut oil flaring regrettably do not have the
necessary regulatory framework or statistical data in place yet. In addition, companies can seek to
optimise the cost of authorised use of CERs in the scheme.
Low risk/amounts at stake for some
Jean Morch (Arkema) said that his company had not as of yet considered insurance (nor indeed
financial instruments) to mitigate its carbon credit-related risks. He couldn’t immediately think of
a situation whereby one of Arkema’s plants would need to purchase additional carbon permits on
the markets as a result of an accident. If this did happen, his view was that a loss of production
would actually lead to a saving of allowances (rather than additional costs) thus providing Arkema
with an opportunity to save or sell any surplus credits.
Some companies have already centralised the management of allowances and carbon offsets at
group level. This enables plants to pool their credits thus amounting to a form of self-insurance.
According to Grégoire de la Motte (Carbonless), by setting up an internal carbon credit cap and
76
Assessing the economic impact of the ETS, B. Poot, Conference on “carbon price”, Paris Dauphine, 10/02/2010.

Cedric Wells - MBA ENASS 2009-2011 - Carbon credits and Insurance 51
trade system to the group, British Petroleum achieved significant GHG emissions reductions as a
result of its teams improving the maintenance of their assets.
By contrast with companies that are heavily exposed to the ETS and therefore actively preparing
for Phase 3, other companies which installations’ emissions are comparatively lower are much
more on stand-by. They await Phase 3 rules to know whether the cost of CO2 will remain modest
and if this is not the case, what strategy they should implement.
Guy Tackels (Saint Gobain) said that although Phase 3 would mean extra costs to companies, he
did not believe that the cost of purchasing additional quotas as a consequence of an industrial
accident would have any material financial impact on a glass manufacturer’s balance sheet.
Eric Beyma said that if France Telecom was exposed to the risk of non-delivery of credits (which
is not expected), it would affect the company’s reputation and credibility (not meeting its targets)
far more than its balance sheet since amounts involved would likely be marginal. For this reason,
potential needs for insurance appeared to be slim.
Pierre Albano (Air France) could not see any situation in which his company would need to
purchase additional permits as a result of an accidental or unforeseeable event as required for
insurance to come into play. Situations such as air controller strikes or preventive immobilization
of aircraft as a result of anomalies detected would actually lead to a reduction in airlines’
emissions therefore a saving (or a lesser cost) of allowances. Using redundant and likely older
(therefore emitting more CO2) airplanes in order to reduce a business interruption period does not
appear to be a realistic scenario. By contrast, more flights (i.e. more emissions) as a result of an
increased demand would not be an unforeseeable event and additional revenue would in Albano’s
view largely outweigh the additional costs that an airline company would have to incur to
compensate for its emissions.
Nevertheless a relevant question
One representative of a large carbon offset seller drew a comparison between what he viewed as
two relatively different types of (registered) CDM projects from a risk management standpoint.
One CDM project involved generating heat and power from the combustion of biomass. The
supply of wood had been secured by a contract (with penalties in case of non-delivery of the
wood) and the heat so generated had been forward sold. The delivery of CERs had been
considered as 90% certain. The second CDM project provided for the combustion of biogas
produced by landfills but the delivery of only 30-40% CERs was considered uncertain because
there was no contractual certainty that the full stock of waste would actually be supplied. For the
first project, the company decided to retain the 10% potential shortfall risk. For the second project,
purchasing calls was contemplated but eventually the cost was considered too high. Insurance
solutions were also explored via an international broker however the company never obtained a
quote. At the end of the day, the company decided not to forward sell the projected CERs in order
to avoid the risk of non-delivery risk which it faced.
Olivier Dufour (Rio Tinto) said that risk management of carbon risks was a topic which Rio
Tinto’s controllership happened to be currently considering. He said that so far no extensive
mapping of carbon credit-related risks had been carried out by risk management and that procuring
insurance has not yet been contemplated.

Cedric Wells - MBA ENASS 2009-2011 - Carbon credits and Insurance 52
Philippe Courrèges (Nestlé) acknowledged that to date risks associated with carbon credits had not
been the subject of any significant attention. He said that this was essentially because in a worst
case scenario an incident affecting one of their plants, available surplus allowances would suffice
to cover the need for additional quotas. He agreed however that such a situation may change with
the implementation of Phase 3 and rising carbon prices.
A representative of an energy company that would not be named said that identifying and mapping
the various technical, political, regulatory and investment risks associated with schemes such as
the ETS and the RGGI had been relatively simple. A far greater challenge in his view was to
determine how such risks could affect the company’s market capitalization and results.
b. Increased cost of working already covered by conventional PD/BI coverage
This section refers to a situation whereby companies which production units have accidentally
failed use (or hire) spare/alternative but higher emitting assets in order to reinstate production as
soon as possible. In such circumstances, companies must compensate increased emissions by using
spare credits or by purchasing credits.
In practice, such additional costs are in most cases covered under the conventional Business
Interruption and Extra Expense insurance which the various sectors involved (energy, utilities,
etc.) typically procure. Indeed, they fall (subject to an overall cap and any applicable sub-limit)
under the Additional (or Increased) Costs of Working section (A/ICOW) of such policies as part of
an insured’s effort to mitigate a covered BI loss.
BI cover is intended to put a business back into the financial situation it would have been in but for
the occurrence of an insured peril. It is generally triggered in cases where an insured is prevented
wholly or partially from producing goods or from continuing business operations or services and is
unable to make up for lost production within a reasonable period of time, or to continue business
operations or services.
The financial loss must result from physical loss, destruction or damage to insured property caused
by any of the contingencies that are insured under the property section of a policy. In sectors such
as energy and mining, coverage is typically due for loss of gross profit resulting from77
:
- the reduction in net revenue [or a) loss of standing charges or b) loss of gross profit]
which is generally defined as the sum produced by applying the rate of net revenue [or a)
standing charges or b) gross profit] to the amount by which the gross revenue [or a) or b)
turnover] during the indemnity period shall, as a consequence of a physical damage, fall
short of the standard gross revenue [or a) or b) standard turnover)
less
any sum saved during the indemnity period in respect of such charges [or a) standard
charges or b) charges and expenses] of the business payable out of the net revenue [or b)
gross profit] as may cease or be reduced in consequence of the damage (other than
amortization),
77
The following wording and its alternatives are provided as an example. They should not be understood to be
standard wordings and many variations can be found in policies. Wordings will always seek to reflect the specific
requirements of an insured and scope of cover granted by an insurer.

Cedric Wells - MBA ENASS 2009-2011 - Carbon credits and Insurance 53
or
- the Increase of Cost in Working, which is generally defined as the additional expenditure
necessarily and reasonably incurred for the sole purpose of avoiding or diminishing the
reduction in gross revenue [or a) or b) turnover) which, but for that expenditure, would
have taken place during the indemnity period in consequence of the damage, but not
exceeding the sum produced by applying the rate of net revenue [or a) standing charges or
b) gross profit] to the amount of the reduction thereby avoided
less
any sum saved during the indemnity period in respect of such charges [or a) standard
charges or b) charges and expenses] of the business payable out of the net revenue [or b)
gross profit] as may cease or be reduced in consequence of the damage (other than
amortization).
Business interruption cover will also typically reimburse claim preparation expenses and fixed
charges (including pay roll) that would have been incurred but for the incident.
All loss adjusters and forensic experts interviewed agreed that additional costs stemming from the
need to purchase allowances on the market would typically be recoverable under the ICOW
section of an insurance policy (whether Delay In Start-Up, Construction All Risks, Erection All
Risks or PD/BI policies). This view was also shared by Julian Richardson, CEO of Parhelion.
Parhelion actually recommends to their clients that they verify that such type of coverage is
afforded by the ICOW and/or ALOP insurance they have purchased. He was clear that additional
costs in purchasing or using up saved carbon credits as a result of an effort to mitigate a business
loss should be covered as part of standard BI/EE coverage if so purchased.
Jason Reeves (Zelle Hofman) confirmed that the adjustment of EU-based energy claims regularly
involved carbon credit issues. He has acted as consultant for the insurance industry on such
matters. In his experience, in practice, carbon credits are: (a) used to mitigate losses as a variable
cost (with potentially negative commercial implications to insurers that compel mitigation), or (b)
a clear liability which was perhaps unanticipated.
Ewan Cresswell (Integra) drew a distinction between coverage provided by standard ICW and
Extra Expense clauses. ICW generally imposes an economic test to determine whether a cost is
recoverable or not (was the cost incurred to minimise a loss?) whereas costs claimed under an
Extra Expense section must simply be costs that would not have been incurred but for the loss.
Most companies find themselves (or have until recently found themselves) left with an oversupply
of allowances (see Oversupply). As a consequence, very few insurance claims made have been
made for costs incurred in purchasing additional credits under an ICOW section of a policy to date.
Actually, in most claims involving carbon credits, insurers have considered as Salvage (and
therefore deducted from indemnities paid out) the value of unused carbon credits during a
production interruption period affecting a company governed by the ETS.
Phase 3 of the ETS however is expected to result in carbon prices rising as a result of more
scarcity and the auctioning process. If this does indeed happen, companies will be increasingly
exposed to the risk of having to purchase additional credits including when attempting to mitigate
Cedric Wells - MBA ENASS 2009-2011 - Carbon credits and Insurance 54
a BI loss. They may also have to pay much higher prices on the spot market if they have no option
other than to purchase credits at the time of loss or thereafter.
In such circumstances, insureds may expect their coverage to reflect somewhat higher (potential)
monetary amounts (and therefore sums insured) at risk. Insurers in response may feel that the level
of premium they normally charge does not reflect such increased exposure and risks (which will
mechanically increase as allowances continue to be reduced). They might also consider that
specific terms and conditions should govern such specific risks.
Lee Swain and Markus Heiss (MD&D) expected that carbon credits would become a more
prevalent item as environmental issues become increasingly sensitive in business. Likely future
changes in legislation and regulations may also make this issue a more important cost issue for
businesses.
Ewan Cresswell (Integra) believed that carbon credit matters would gather momentum quickly and
become a significant factor in the operation of plants with carbon prices expected to rise in Phase 3.
This will have some bearing on BI claims. Cresswell foresaw as a very likely scenario that of a
plant able to re-start partial production but inefficiently from an emissions standpoint. In such
cases and assuming higher carbon prices in Phase 3, companies could be inclined not to resume
production simply to avoid the very high additional costs stemming from increased emissions.
This might conflict with an insured’s duty to mitigate a loss under the terms of an insurance policy.
2.2 Coverage available for non-delivery risks
This section refers to the risks associated with CDM/JI projects. Carbon credit delivery insurance
aims at securing financial loss stemming from the failure to generate carbon offsets.
a. Purpose of non-delivery insurance
CDM and JI projects are primarily designed to enable companies to meet their compliance
obligations whether based on a mandatory or voluntary emissions reduction scheme.
France Telecom, a global communications group, is not subject to any cap and trade system
and it does not expect this to change in the years to come. The company however
committed to reduce its CO2 emissions by 20% between 2006 and 2020. This followed a
voluntary decision aimed at anticipating the increase in energy prices, reducing the
company’s dependence to fossil fuels and showing its concern for climate change. Eric
Beyma said that to meet such targets, France Telecom would likely purchase credits
generated by CDM projects.
They can also be intended to generate profit.
Rhodia, a French chemicals company, publicly announced in 2006 that carbon trading had
become a core activity for the group. This was achieved through Orbeo, a joint venture
established in 2005 with French bank Société Générale to manage the CERs delivered by
two CDM projects in Brazil and South Korea that had cost Rhodia EUR 20 million. In
between 2007 and 2008, Rhodia cashed in a little less than EUR100 million after it sold

Cedric Wells - MBA ENASS 2009-2011 - Carbon credits and Insurance 55
just 10% of the CERs received from the CDM EB for its CDM projects78
. This boosted
Rhodia’s stock price and CERs were at one stage believed to represent up to 30% of the
company’s stock value. Same stock however later collapsed with Rhodia’s sales plunging
and a 70% drop on the quota spot market prices due to over allocation. Market analysts
were blamed for having improperly factored the volatility risk associated with carbon
credits.
According to Jan Holzapfel (Captive Mutual), non-delivery insurance is destined to both CER
buyers and sellers predominantly on the primary and the secondary circuit (mostly Greenfield
construction projects). The way insurance can be arranged will depend on each party’s nature and
level of involvement in a project and the specific risks it is exposed to. One of the specificities of
CDM projects is that their future owners sell forward the expected CERs before the installations
are actually built, commissioned and handed over. The proceeds of the forward sales are an
important source contributing to the financing of the projects themselves.
In Nick Silver’s (Callund Consulting) view79
, insurance, if available, can help provide greater
certainty as to the delivery of offsets therefore increasing the value of forward CERs/ERUs and
reducing the gap between current and forward prices80
. Insurance should attract more project
financiers and investors and enable them to hedge future cash-flows thereby reducing a project’s
cost of capital and improving its internal rate of return.
Project
Company
Insurance will assist in securing the funding of the Project Company’s project and will provide
higher value to CERs/ERUs.
Premium may be split between the Project Company (as lead under an ERPA Master Policy)
and named third party beneficiaries (e.g. traders).
Insurance certificates may be delivered to secondary buyers (that forward purchase CERs/ERUs
from the named beneficiaries).
Insurers will require Representations and Warranties from the Project Company and its owners.
Compliance
buyer
Insurance will ensure that it receives the CERs/ERUs it needs for compliance purposes (or what
it needs to purchase substitute credits).
Supplier
(contractor)
Insurance will ensure that it will receive the CERs/ERUs it is contractually due as a form of
payment (or their value in cash).
Carbon fund
manager
Insurance will cover the risk of shortfall in the delivery of CERs/ERUs at project portfolio level.
Insurers assess the insureds’ risk management procedures and controls, as well as their track
record. Only the largest projects might be reviewed on an individual basis.
Project
financier
Insurance will cover the risk that CERs/ERUs, a form of security, are not available.
Higher security brought by insurance should assist the Project Company in obtaining higher
funding.
Investor Higher security brought by insurance should assist the Project Company in obtaining higher
funding.
Insurance may cover a portfolio of projects.
Insurers will require Representations and Warranties from the Project Company.
Insurable interests of the various parties involved in CDM/JI projects.
Insurance is typically delivered as a specific coverage. CER-related risks however have been
included as part of standard property damage and business interruption policies with some limited
adaptations and a specific CER premium.
78
“La finance carbone: en quoi le marché du CO2 peut-il être un outil au service de la performance des entreprises ?”,
p. 50, 2006, M. Diakhate, INSEEC dissertation. 79
http://www.actuaries.org/ASTIN/Colloquia/Manchester/Papers/silver_paper_final.pdf. 80
CERs/ERUs are cheaper to buy than EUAs because they include a discount for the various risks that they might not
be delivered (see Spread).

Cedric Wells - MBA ENASS 2009-2011 - Carbon credits and Insurance 56
There is currently very limited insurance offer available to cover such risks. Insurance capacity is
provided by several global (re)insurers (generally with the involvement of their non-traditional
insurance or alternative risk transfer teams) and a couple of niche companies with specific
expertise.
b. Products available81
The scope of coverage provided varies significantly from one company to another. The following
table is an attempted comparison (strictly based on web marketing i.e. not approved by the relevant
companies) of the most comprehensive carbon credit non-delivery insurance82
sold and the key
terms and conditions attached to them.
Perils83
Examples Parhelion
Munich
Re
Zurich Chartis Carbon
Re
CAR/EAR84
DSU/ALOP85
OAR86
+ BI
Delay in Start-Up,
fire, failure,
machinery
Breakdown
Business
Interruption
Regulatory Revocation of
Letter of Approval
or licences, non-
approval of
methodology, etc.
Political Nationalisation,
expropriation, etc.
Counterparty Insolvency,
contract
frustration, pre-
payment, etc.
Available offer based on comparative study.
81
This survey looks only at comprehensive delivery-wraps only. Companies mentioned in this section may also
market conventional covers. 82
Only the offer of insurers allegedly marketing carbon delivery wraps has been reviewed. A number of other
companies offer cover for some (political, technological, credit, etc.) but not all carbon-credit related risks. For
example, the Multilateral Investment and Guarantee Agency (MIGA), a World Bank entity established in 1988, sells
PRI to foreign investors in Member countries. 83
Perils that are covered or that might be covered subject to certain conditions, restrictions and stages of the UNFCCC
process, as defined by each company separately. 84
Construction All Risks/Erection All Risks. 85
Delay in Start-Up/Advanced Loss of Profits. 86
Operational All Risks.
Cedric Wells - MBA ENASS 2009-2011 - Carbon credits and Insurance 57
c. Insurance markets
Traditional players
Munich Re
Munich Re was one of the first companies to sell carbon risks (re)insurance87
.
Jonathan Young (Munich Re) said that in early 2008, Munich Re had agreed to provide capacity to
Carbon Re, a broker which had the intention of establishing a fully-fledged “monoline” insurance
company to insure carbon credit non-delivery risks. However Carbon Re (like Parhelion, a
company with similar aspirations and for which Young worked prior to joining Munich Re) failed
at that time to attract sufficient funding to set itself up as an insurance company because of the
credit crunch.
Munich Re now currently markets a range of multi-peril policies available to the buyers and sellers
of carbon credits, offered both direct or as reinsurance of its insurance company clients in CDM
host countries. Coverage can be delivered in respect of: (a) non-registration by the CDM Executive
Board, where it covers the project development costs specifically associated with the CDM
process, and/or (b) any project assets owned by the insured, and/or (c) the non-delivery of carbon
credits caused by interruptions to the operation of CDM and JI projects.
Risks which a company may elect to purchase cover for include (but are not limited to)88
:
- Non-registration by the CDM Executive Board
- Marine cargo
- Physical Damage
- Machinery Breakdown
- Delay in Start-Up or Business Interruption (if assets are also insured)
- Political risks
- Insolvency of the project company, suppliers or buyers
- Weather risks and deficiency in resources
- Technical performance.
Additional risks might also be insured subject to Munich Re obtaining a satisfactory level of
underwriting information.
Indemnity is based on an agreed value calculation that accepts a capped level of carbon price
volatility (the insured chooses the maximum carbon price to be used in the loss calculation).
Munich Re does not otherwise insure the commodity risk associated with carbon credits.
Munich Re has different policy wordings for CER/ERU sellers and buyers. Both are tailor-made to
reflect the specific needs of a client and the characteristics of its project.
87
The first product was launched in September 2007. 88
Munich Re commercial hand-out “Carbon Risks Insurance – a commitment to climate change mitigation”, 2010.
Cedric Wells - MBA ENASS 2009-2011 - Carbon credits and Insurance 58
Zurich
Zurich (Trade Credit & Political Risk) sells traditional forms and of PRI and trade credit insurance
which scope extends to specifically tailor-made features relating to the underlying CDM or JI
project.
James Brache (Zurich) said that its company would consider providing cover for technological
risks when technologies involved are proven and/or have passed the UNFCCC validation and
registration tests. Another major criterion for Zurich is that the CDM or JI projects must be
financially viable. The weaker a company’s balance sheet is, the more challenging it will prove to
procure carbon credit delivery insurance.
Zurich can provide capacity for up to $175m on any given transaction ($50m for trade credit). It
has in some instances lead a syndication of insurers for carbon credit delivery risks.
So far no carbon credit related claims have been made to or paid by Zurich.
Chartis89
(in development90
)
Chartis (formerly AIG) designed a program to address the delivery risks of compliance
instruments generated by CDM and JI projects as early as 2005. The product was targeted to:
project developers as sellers of CERs, industrial companies as buyers and investment funds as
investors in CDM projects.
Chartis’ program was structured to address technological performance risks, political risks, credit
risks and/or pricing risks. The policy covered only the first Kyoto Protocol period. Only CERs
were insured under the policy (no ERUs or VERs). The coverage would be triggered by the non-
generation and non-delivery of the CERs due to technological performance, political and credit
risks and the loss amount would have been the amount by which the price paid in the spot market
to replace the undelivered credits exceeded the contracted price.
Niche players
Parhelion and Carbon Re are brokers with aspirations to become direct insurers for the carbon
credit market.
Carbon Re91
Carbon Re defines itself as a “pioneering insurance service provider” which aim is to offer
innovative insurance solutions for carbon, clean technologies and sustainability projects. Carbon
Re AG was established in 2006 in Zug (Switzerland) as the holding company and a reinsurance
broker. Carbon Re Aktiengesellschaft, established in Liechtenstein in 2007, is a licensed broker in
the EU and EEC for direct insurance. The company was set up by its founder Dirk Kohler (who
was formerly with the Gerling Group) and prides itself to have supported a number of insurance
groups including in emerging countries towards the creation of specific products.
89
www.chartisinsurance.com/Evolving-Risks_911_221594.html 90
Chartis is currently awaiting Phase 3 rules to redefine the scope of its proposed cover. 91
www.carbonre.eu
Cedric Wells - MBA ENASS 2009-2011 - Carbon credits and Insurance 59
Carbon Re has created several carbon credit-dedicated products, namely:
- Carbon Delivery Guarantee Insurance in 2005, destined to industries (compliance risk) and
project developers (delivery risk);
- Carbon Counterparty Credit Risk Insurance, protecting buyers against counterparty credit risk,
country and political risks and BI risks;
- Carbon All Risk Insurance in 2006, for sellers (including regulatory, political, physical damage,
technology performance and BI risks)
- Kyoto Multi-Risk Policy in 2008.
Dirk Kohler (CEO) said that 60% of Carbon Re’s business today involved consulting services and
40% placing insurance business. Most requests from Carbon Re’s clients come from brokers and
insurers worldwide.
Parhelion92
Parhelion Underwriting Limited is the most recent player on the carbon insurance market. Julian
Richardson’s (CEO) interest in carbon-related risks goes back to 2001 when he wrote an MBA
dissertation on carbon credit-related risks. His work developed some years later into theoretical
insurance solutions which Parhelion began marketing in 2010. Parhelion is now able to offer an
underwriting capacity of EUR50m any one transaction (per project or portfolio of risks) which is
provided by 5 Lloyd’s syndicates (which could not be named at the time this study was published).
Parhelion’s policies seldom include a vertical coinsurance (i.e. primary and excess reinsurance).
They typically contain deductibles instead (between 5-10%). The company has so far not had a
claim for non-delivery of CERs/ERUs.
Parhelion has also developed specific products destined to address the bankability and eligibility
issues which the Phase 3 rules will raise.
Insurance4renewables93
Insurance4renewables is an online portal which was developed in 2009 by Royal Sun & Alliance
(which sells renewable energy project insurance), Munich Re and Carbon Re. It was established
under the umbrella of the United Nations Environment Programme (UNEP) and the Global
Environment Facility (GEF). Its aim is to offer standard and customised insurance protection for
renewable energy projects in emerging countries. The offer includes coverage protecting carbon
credit sellers against risks such as insolvency, non-payment and country risks.
Non participants
Cliff Warman (Marsh) said that before the 2007 financial crisis had struck, Marsh was seeing
opportunities to place carbon credit delivery insurance every week for a large spectrum of
CDM/JI-type projects. Insurance markets were very prompt to react at the time however the
solutions they came up with lacked homogeneity and were seldom set in stone. Few insurers
actually issued policy forms and when they did, they were in fact not prepared to offer all risks
cover (in particular, no insurance for volatility and regulatory risks was available). Chartis singled
92
www.parhelion.co.uk 93
www.insurance4renewables.com

Cedric Wells - MBA ENASS 2009-2011 - Carbon credits and Insurance 60
itself out by offering to help its clients manage their risks through more ART-type risk sharing
programs.
Swiss Re was the first insurance company to implement, in 2006, a multi-perils product covering
risks associated with obtaining carbon credits issued for CDM and JI projects (“Contingent Cap
Forward for Emissions Reduction Trades”). The purpose of the coverage was to protect RNK, an
investor in CDM and JI projects, against the non-delivery of CERs/ERUs. Claims would be settled
either in cash or with in-kind CERs/ERUs. Swiss Re entered into a similar transaction in 2008 to
cover guaranteed and non-guaranteed CERs/ERUs generated from renewable energy projects in
China for the government of Luxemburg. The company decided to withdraw from the market for
strategic and restructuring reasons as from May 2009.
ACE Global Markets also launched a political risk and trade credit coverage in September 200894
.
A number of insurance and reinsurance companies believe that risks associated with carbon and
cap and trade schemes are not yet mature enough for insurance.
One global insurer said that it had identified the carbon credit risks as an opportunity to market
new products. Such area of development had not however been made a priority because so far
none of its clients had raised the need for that type of cover. The company was approached several
years ago by a US-based broker seeking to develop carbon credit insurance sales in Europe. The
underwriters from the environmental risks department concluded at the time that they lacked
statistics and other key material to assess a client’s exposure to carbon credit volumes and the
related costs (see Risk Assessment). As a result, they found that it was difficult to clearly identify
the risks involved and to delimit an acceptable scope of coverage. They also considered that the
regulation governing CDM and JI projects was too complex and raised too high a level of
uncertainty. In particular, they were uncomfortable with the methodologies used to measure
emissions and believed that reliable third party emissions-certifying organizations were required
before risks could be properly assessed. When asked whether it would sell carbon delivery
insurance if and when the above constraints disappeared, the company’s representative noted that
many of the largest energy industries in fact retained a large level of their risks which may mean
that they would not be interested in purchasing specifically carbon-credit focused insurance.
2.3 Why offer and demand for non-delivery insurance have not yet met
a. CDM/JI projects mostly involve quite typical risks
To a large extent the risk profile of a CDM or JI project is similar to other projects involving
innovative technologies and renewable energies.
If a technology is new, it may well be treated as experimental or prototype and therefore not be
insured by lack of actuarial data95
. The more history and statistics, the more likely a risk will be
deemed proven.
94
http://www.acegreen.com/products?productid=15®ionid=11. 95
Dirk Kohler (Carbon Re) said that prototype risks would not be insured under a policy delivered by Carbon Re.
Cedric Wells - MBA ENASS 2009-2011 - Carbon credits and Insurance 61
Perils such as fire, natural catastrophes or insolvency are risks which industrial projects and plants
have always faced and to which CDM and JI projects are no more exposed to. Actuaries have the
tools necessary to assess and price them. Such risks are therefore not addressed in greater detail in
this survey.
Business interruption losses may also be covered (generally on a named perils basis). The non-
delivery of carbon credits can theoretically be compared to a loss of revenue subsequent to a
physical damage as covered by conventional policies.
Political risks are generally excluded from standard property damage however special/buy-back
coverage can be found widely. Political Risks Insurance (PRI) requires an identifiable risk which
in most cases is not a problem as ample data to assess frequency and severity per country is
available from many research institutions. The effects of political risks must also be quantifiable:
in the case of carbon credits, this would be the maximum value of undelivered CERs and/or the
costs incurred in setting up and running the project up.
Applying specifically to CDM and JI projects, PRI might cover the following risks:
- Expropriation, confiscation, nationalization or breach of contract or letter of approval by a
host government,
- Non-payment by sovereign entities (e.g. governmental bonds not being paid out to bond
holders, tighter credit conditions, etc.),
- Supply chain interference,
- Inability to convert revenues into hard currencies and transfer back to home countries,
- War, civil war, civil commotion, riots, strikes, insurrection, terrorism.
James Brache (Zurich) mentioned two examples of non-delivery insurance driven by political
considerations which Zurich had sold. The first had to do with the rehabilitation by a private
company of gas pipelines in Eastern Europe. The insured had agreed to fix leaking pipes in
exchange for the carbon offsets that such project would generate. The risk was political in that the
pipelines were owned by governmental entities and that a sub-sovereign entity had issued a
guarantee that the insured would make a return on investment. Zurich provided coverage for
contract frustration by the government entity providing the guarantee. The second involved a trade
credit deal on a hydro plant project in South America also intended to generate CERs. The
policyholder was a broker of credits that provided advanced payment to owners of the project in
exchange for the delivery of CERs over an agreed period of time. Insurance was delivered to cover
the risk of non-delivery of the CERs. Any claim paid would entitle the insurer to subrogate against
the company generating the CERs.
Pricing political risks is not an exact science. The magic range seems to be 1-2% of sums insured
with significant increases following large losses and pay-back hoped over several years. Coverage
and sums insured are always capped. Accumulation is a matter which each insurer will address
based on the capacity it is able to bind per risk and per event. Julian Richardson (Parhelion) said
that accumulation was addressed in quite the same way as other lines of business. Parhelion has an
underwriting limit per country and per type of project/methodology.
Although insurers offering carbon credit non-delivery insurance market it as “all risks” or “wrap-
up”, they admit that not all perils are insurable for CDM/JI projects. Regulatory risks are a pivotal
feature of “full” coverage however they are very seldom covered by the markets (see Regulatory
risks).

Cedric Wells - MBA ENASS 2009-2011 - Carbon credits and Insurance 62
One increasingly worrying risk companies face is fraud. Between 19 January and 4 February 2011,
the European Commission temporarily suspended spot market transactions (i.e. about 20% of
overall transactions volume) in national ETS registries following recurring cyber-attacks in
national registries of five EU Member States. The attacks resulted in the theft of over 3 million
allowances. Suspected double counting of allowances in 2007 (which it was later proved did not
happen) and “phishing” on the German national registry in January 2010 (250,000 allowances
stolen on European trading platforms) have prompted calls for stricter regulation of carbon credits.
In 2010, the UK government decided to reinstate VAT on CO2 in order to prevent fraudsters from
purchasing VAT-free CO2 and selling them VAT included without refunding the tax authorities.
There are plans to implement similar changes in several other EU states. At EU level, security will
be one of the main tasks of the centralised registry which is due to take over from the national
registries in 2013. Currently, there are as many penal codes as there are Member States: this
should change in Phase 3.
Gaëtan Cadero (Lafarge) said that a major concern for his company was the risk of theft. He
believed that this was an area where insurance would make sense with millions of Euros worth of
allowances that can vanish in seconds. Dirk Kohler (Carbon Re) however advised that he was not
aware of any insurer selling cover for such type of risk or any claim having been made for stolen
carbon credits.
b. Regulatory risks a key issue
Companies see a great level of regulatory risk linked to climate change policies. This is
highlighted by the CDP Report Europe 30096
: risks identified include risks associated to cap and
trade systems, regulation and tax, product labelling and energy efficiency standards. As will be
discussed in section 3.2.a (Regulatory), insurers are generally not prepared to insure such risks.
Jean Fournier (Global Aerospace) insisted on placing the carbon issue back into its initial context
before addressing the way insurance might assist companies in dealing with regulatory risks. The
management of energy resources is of crucial importance. No new oil reserves have been found
since the 1970s (only the proportion of proven reserves has increased) and fossil fuels will
disappear at some (close) point in time. With global populations expected to reach 9 bn by 2050,
there is an urgent need to find and switch to renewable sources of energy. Governments must raise
public’s awareness by implementing coercive measures. Phased cap-and-trade schemes are a good
way to achieve this smoothly. However sudden and more restricting regulatory changes are
sometimes necessary to convey the message more strongly that parties must bite the bullet. The
EU Climate Change Committee’s decision in 2011 to ban offset credits from HFC23 and N2O
adipic acid production may well have been intended to leave a deep impression on companies that
the intent of the ETS is to allow no room to play with regulation. Fournier noted that in the same
way, new sets of rules such as Basel II and Solvency II had fundamentally been implemented to
maintain pressure on companies and to strengthen the regulators’ credibility as evidencing that
they take measures to limit the impact of possible crisis.
The ETS is not the only carbon emissions regulation that exposes companies to new risks.
Christian Fayard (Shell Butagaz France) referred to the French law of 13 June 200597
which
imposes constraints on companies selling energy to end-users. In addition to achieving energy
96
https://www.cdproject.net/CDPResults/CDP-2010-Europe-300-Report.pdf. Retrieved on 21 December 2010. 97
Loi d’orientation sur l’énergie n°2005-781.

Cedric Wells - MBA ENASS 2009-2011 - Carbon credits and Insurance 63
reductions themselves, companies must encourage their clients to do same. When they achieve this
they are entitled to certificates (“Certificats d’économie d’énergie”). Companies must pay fines if
they do not meet the assigned targets. With this in mind, Butagaz, a subsidiary of Shell that sells
butane and propane, pays out cheques to those of its clients that reduce their levels of
consumption. The CEE system in France is somewhat comparable, albeit at a national level and
with significantly lower values at stake98
, to the ETS.
Rigorous public registration and issuance process implemented by the UNFCCC
A number of interviewees involved in CDM/JI projects appeared to be troubled by the burdensome
and lengthy process which the UNFCCC imposes for projects to reach the critical registration
phase. Problems may be duplicated at a local level: every signatory to the Kyoto Protocol has
implemented its own national process chart and charts can vary significantly from one country to
another.
The key-stages in CDM projects include:
Project stages and documentation Entity
responsible
CDM specific Risks
1. Idea (Project Idea Note, PIN)
Pre-screening
PC
DNA99
2. Design (Project Design Document, PDD)
Concept note including:
- baseline emissions study
- proposed methodology
- stakeholders’ consultation
PC Methodology
- new ones must be approved
- existing ones can be withdrawn by the CDM
EB
3. Host country approval of the PDD
(Letter of Approval)
DNA Administrative delays
Rejection
4. Validation report
- compliance with UNFCCC requirements
- environmental impact analysis
- GHG ERs targeted
- baseline and monitoring methodologies
DOE100
Compliance (additionality, eligibility)
Methodology (id. PDD)
5. Registration - formal acceptance of the project
CDM EB Administrative delays
Rejection
6. Implementation - Monitoring report
(performance measurement)
PC Delay in start-up
Lower volume of ERs generated due to:
- lower than expected production or technology
efficacy, or
-improper monitoring of equipment
7. Verification and Certification report
- actual emissions v. emissions required per
PDD
- actual GHG ERs
DOE Compliance
Lower volume of ERs certified
8. Issuance of CERs
based on Verification and Certification report
CDM EB Rejection
9. Transfer of CERs ITL
98
Fayard clarified that the financial risks associated with the CEE regulation were not such that Shell would
contemplate transferring them to the financial or insurance markets. 99
The Designated National Authority is the CDM authority which is designated and registered by a signatory State
to the UNFCCC Secretariat. 100
The Designated Operational Entity is the entity designated based on the CDM EB’s recommendation to validate
proposed projects, to verify and certify that the expected emissions reductions are actually met.

Cedric Wells - MBA ENASS 2009-2011 - Carbon credits and Insurance 64
The following average time delays have been published by UNEP:
- 10.7 months to complete the validation stages (through to phase 4 above)
- 4.9 months for registration (from the request to the actual registration)
- 14.8 months from registration to the date of first issuance of CERs.
The point was made by one interviewed investor that a mere hurdle in the validation and
certification process of a project (such as the CDM EB withdrawing an independent auditor’s
accreditation) could “kill it”. Time is money: even delays of several weeks could have the
potential to jeopardize a project.
One of the two CDM projects conducted by Vallourec involves a steel mill in Brazil (V&M
Forestal) which uses wood charcoal rather than coke to fuel its steel production. Eucalyptus
plantations are cultivated such that as trees grow, CO2 is consumed and oxygen is released. The
trees provide the raw material for the charcoal and part of the gases emitted during the
transformation of wood into charcoal are used to produce energy on-site. Vallourec announced a
landmark deal in 2003 with the Dutch government and Toyota to secure CERs from the project.
Attempts so far to obtain CDM EB certification have failed.
Patricia Cuba-Sichler (Savin Martin Associés) mentioned one example of a company that had
made an upfront payment towards a CDM project several years ago. The project never generated
CERs because the UN Emissions Board decided that it did not meet the additionality test. Cuba-
Sichler’s client experienced difficulties in recovering the amounts it had paid to its contractor. Her
view was that today companies treat contractual matters with greater care and such type of
disputes are less likely to occur.
Potentially dramatic effects on projects including at advanced stages
Joffrey Celestin-Urbain (GDECC) stressed the critical importance of regulatory risks in the
conduct of projects. In his view they are a concern to all types of companies: (a) those strictly
seeking to comply with carbon credit regulation, (b) project developers (e.g. Rhodia, Arkema, etc.)
and (c) traders speculating on carbon markets. Celestin-Urbain said that regulatory risks might in
some cases be a real deterrent to investors (surprisingly, even hedge funds are hardly involved in
CDM projects and in ETS developments for these reasons).
Recent developments confirm the level of uncertainty which regulatory risks entail. The following
are examples of decisions that have caused prejudice to one or more CDM projects:
- In 2006, China fixed a floor price for carbon prices in order to prevent the excesses of
CDM/JI projects.
- An adverse decision from the CDM EB related to projects involving a Norwegian company
that had audited carbon emission certificates. The Board sanctioned its lack of expertise,
various dysfunctions in the auditing process, missing documents and inaccurate
methodologies used.
- The temporary suspension by the CDM EB of four Designated Operational Entities (DNV
in December 2008, SGS in September 2009, Tüv Süd in March 2010 and Kemco in March
2010) resulted in a significant volume of undelivered CDM offsets with investors needing
to buy CERs (at a loss) on the spot market to meet their contractual obligations.

Cedric Wells - MBA ENASS 2009-2011 - Carbon credits and Insurance 65
- On 18 August 2010, the International Emissions Trading Association (IETA) announced
that the UN Emissions Board would question all projects seeking emission credits for
reducing hydro fluorocarbon 23 gases101
.
Trifluoromethane (HFC-23) is produced as an unintended by-product of
chlorodifluoromethane (HFC-22) which is used as a refrigerant and as a polymer ingredient.
In 2010, it accounted for 52% of credits supplied under the CDM scheme.
The CDM EB’s decision to investigate such projects followed allegations from lobbying
group CDM Watch that the methods for delivering CERs for the destruction of HFC-23
gases were inadequate. According to CDM Watch, companies maintain HFC-23 production
at artificially high levels and destroy the gases (rather than sell them) with a view to be
granted a larger amount of CERs. Such activity is believed to have generated several
billion dollars’ worth revenues from sales of carbon credits to EU and US-based
companies102
.
The immediate effect of the UN decision was that four projects in China backed by EU-
based industries were halted pending the CDM EB’s review with CER issuance requests
being placed under the state of "request for review".
The UNFCC’s decision is a strong message (and a timely reminder at the eve of Phase 3) that if a
project is of questionable environmental integrity i.e. does not in fact make additional savings in
GHG emissions, CERs will not be delivered. However it begs the question as to how companies
can unexpectedly be deprived from a projected return on investment in circumstances where they -
allegedly - have complied with all relevant regulation and have invested significant sums of money.
Celestin-Urbain said that France had taken a clear position in international discussions towards
stable regulation. He believed that sudden decisions by the UNFCCC bodies to postpone the
delivery of CERs to CDM project runners would send the wrong signal to CDM investors when
projects had validly passed the many hurdles imposed by the strict regulation in place. In such
cases, a phasing out response would appear more appropriate in his view.
On 21 January 2011, the EU Climate Change Committee which gathers EU27 Member States
voted to ban from use on the ETS emission offset credits from HFC-23 produced as a by-product
of HFC-22 production and N2O from adipic acid production (which environmental integrity has
also been challenged). Companies will be entitled to use the offsets for compliance purposes until
30 April 2013 but not beyond that date. The Committee’s proposal has yet to be adopted by the EU
Parliament and Commission.
Julian Richardson (Parhelion) agreed that the CDM EB’s decision to postpone the delivery of
CERs in relation to HFC-23 projects would have caused a large market loss had such peril been
insured. In Richardson’s view, this type of event would enter the scope of regulatory risks as
covered by Parhelion (subject to any contractual limitation and unless specifically excluded for
any reason).
The current level of uncertainty surrounding the continuation of CDM projects beyond the date of
expiry of the Kyoto Protocol is no incentive to invest at the moment.
101
http://www.bloomberg.com/news/2010-08-18/un-emissions-board-will-question-all-hydrofluorocarbon-projects-
ieta-says.html; Retrieved on 21/08/2010. 102
According to the EU Commission, revenues from the sale of HFC-23 credits can represent up to 78 times the initial
capital investment and operational costs of the project.

Cedric Wells - MBA ENASS 2009-2011 - Carbon credits and Insurance 66
Regulatory risks partly considered as political risks?
Although in principle Zurich would not cover regulatory risks, Jamie Brache (Zurich) said that
there may be two exceptions to this. Firstly, some regulatory risks may be covered (albeit
narrowly) by PRI policies. By way of an example, if a government imposes a confiscating tax
regime, this might be viewed as expropriation (which is an insured peril under PRI). The same
conclusion might be reached if, as a further example, a government illegally revokes a mining
concession (which is key to the financial viability of an industrial project). Secondly, Brache said
that if an insured requested that specific coverage be provided for regulatory risks, Zurich would
probably consider such request (but not necessarily grant cover). Notwithstanding, Brache was
clear that Zurich would not insure a regulatory risk such as the CDM EB not registering a CDM or
JI project.
Jonathan Young (Munich Re) agreed that regulatory risks were not insurable however he accepted
that in certain instances the political risks definition may be altered to encompass some risks that
also have a regulatory connotation. Munich Re has made an exception for costs associated with the
pre-registration of projects, which could be covered on essentially an “all risks” basis, but an
arbitrary or retrospective decision or regulation by the UNFCCC that would affect the delivery of
ERs by a registered project would clearly not.
c. Room for improvement
Although no figures or estimates could be obtained from any of the companies interviewed, it
appears that so far sales of carbon credit delivery insurance, if any, have been very limited. It is
probably too early to draw lessons from sales that started only five years and which involve quite
diverse insurance products. There is however some feedback from parties that have, at least once,
shown some interest in carbon credit non-delivery insurance.
Better understanding the needs for insurance
The primary reason for limited sales might be that companies have in most cases received more
allowances than they needed i.e. did not prima facie face a risk of shortage. Also, as was discussed
in section 2.1, industries do not believe that carbon-related risks deserve any particularly special
treatment. In such circumstances, it is hardly surprising that CDM and JI projects are still very
much viewed as a “cherry-on-the-cake” (these very words were used by a number of the
companies interviewed) rather than as a means to avoid the penalties which industries will more
likely face in Phase 3 then Phase 2.
Jean Fournier (Global Aerospace) said that when insurers design new products they tend to focus
more on risks than on their clients’ actual needs. In his view, there are essentially two ways a risk
can be transferred to insurance. The first is when it is market practice to procure insurance such
that risk managers might be blamed by their directors (and shareholders) for not conforming to
such practice. It would be generally inconceivable for example not to buy insurance for a
commercial satellite about to be launched into space. The second way is when insurance helps a
client to materialize new business opportunities. So far, none of these two conditions above have
been fulfilled for carbon insurance, which is probably why companies retain carbon-related risks
as business risks rather than transferring them to a third party.

Cedric Wells - MBA ENASS 2009-2011 - Carbon credits and Insurance 67
Cliff Warman (Marsh) noted that companies interested in procuring insurance several years ago in
most cases had failed to properly map the risks associated with their projects. As a result, brokers
assisted their clients far more in articulating their needs than in placing insurance.
One investor said that it had recently, for its own investing activity in CDMs and more generally in
the interest of the industry, carried out an extensive review of existing solutions on the insurance
market for carbon-related risks. In his view, no insurance carrier offered the comprehensive
coverage that the industries needed. In particular, the proposed scope of coverage appeared to be
too narrow, policies contained too many exclusions and indemnity limits were too low.
Alexandre Kossoy (World Bank103
) said that the lack of adequate insurance supply in the past
probably explained the limited sales of carbon credit under-delivery insurance. He mentioned the
World Bank’s attempt several years ago to obtain insurance for the advanced payments to be
provided under its ERPAs. Although a number of CDM and JI projects had passed the validation
and registration stages, they were not getting off the ground by lack of further financing and
therefore not delivering CERs and ERUs. To unblock such a situation, the World Bank offered to
pay upfront up to 25% of ERPAs contractual value which the first CERs delivered would refund.
A condition was that stand-by letters of credit be established in favour of the Bank in the event
CERs were not delivered. This proved impossible as many project developers simply could not
access those instruments. Therefore plan B appeared to be to have the risk of the amount provided
in advance to be insured at a portfolio level. The cost related to the insurance premium could then
eventually be deducted from the payment for CERs to the sellers. The World Bank could not find
the insurance project expected because some risks were deemed uninsurable and because sufficient
capacity could not be provided by lack of appetite from the reinsurance markets.
Marketing efforts required
Dirk Kohler (Carbon Re) said that insurers that offer (or have offered) carbon insurance had
underestimated the stakeholders’ lack of knowledge of insurance and its merits. Insurers had
wrongly assumed that insurance was an obvious item of CDM/JI projects. Another factor - specific
to carbon traders - is that they were not prepared to further reduce their already small margins by
paying an insurance premium. Having realized this, Carbon Re embarked some years ago into a
vast educational campaign with a view to raise investors’ awareness of the added value of
insurance. In particular, it used auspices such as the UNEP and the Global Environment Facility
(GEF). Such efforts now seem to be bearing fruit: Kohler noted that banks and investors had
shown a growing interest in insurance solutions in 2010.
Warman agreed that premium ranges offered had been perceived as excessively high104
by
stakeholders whereas they were in fact typical of cases where little (if any) credible actuarial data
103
The World Bank (International Bank for Reconstruction and Development) is a relevant player in the development
of carbon finance and, as the Trustee of 11 carbon funds is a large buyer of project-based offsets under the Kyoto
Protocol. It currently manages carbon funds and facilities with an overall $2.5 bn value. The funds are public or
public-private partnerships comprised of public and private participants such as governments having ratified the Kyoto
Protocol and private companies with obligations under the ETS or voluntary schemes. The funds must deliver carbon
credits to their participants from CDM and JI projects so that they can meet their compliance obligations. 104
The writer is unable to provide any reliable estimate of how much more premium an insured would have to pay for
full non-delivery coverage as compared to standard industrial projects. Any estimate would in any event have to be
considered very cautiously: every project is unique and the scope of cover purchased can vary. Premium will reflect
the many specificities of a project (geographical location, technology involved, stage of UNFCCC process, etc.). The
various premiums that form the overall non-delivery premium would need to be analysed in detail. PRI premium
charged for CDM/JI projects may be in the range of 1,5-4% of amounts of coverage requested (which is much higher

Cedric Wells - MBA ENASS 2009-2011 - Carbon credits and Insurance 68
is available and there is not yet any economy of scale. Kossoy said that if any proposal close to the
World Bank’s needs was available, premium rates were so high that the revenues generated by the
CER projects would have been offset by the cost of the insurance and thus, it would not be of
sellers interest. He added that that companies’ interest for an insurance product would be
conditional to the cost of offsets plus the cost of the insurance resulting lower than the alternatives
(i.e. allowances or domestic reductions).
There are several possible reasons that may explain the imperfections and limits of coverage
currently available on the insurance markets. They may need to be better explained to insureds.
- The Volatility which commodities such as carbon credit prices can be exposed to is not
something insurers are comfortable with. The only way an insurer’s exposure to carbon credit
related losses can be limited is by setting a cap on the sum insured (possibly agreed as a
specific sub-limit in the policy).
- Carbon delivery coverage is not intended to insure the efficacy or the performance of a project
(e.g. a project not generating as many CERs as expected because the level of supply of waste it
is due to transform is lower than expected).
- There is a large consensus that regulatory risks are not insurable. More specifically in respect
of CDM and JI projects, regulation is so complex and subject to change that the level of
uncertainty is deemed unacceptably high. Although this appears to be well understood by risk
managers, some are particularly keen on obtaining at least some partial cover for regulatory
risks (including during for the pre-registration phases).
- Insurance companies from developed countries encounter major difficulties in accessing
markets of the emerging countries. Paradoxically, where industries bringing green technology
from developed countries are welcomed with open arms, insurance companies are at great
pains to obtain the necessary licences from authorities to sell insurance locally. Kohler
believed that this was at odds with the North-South philosophy promoted by the Kyoto
Protocol and that, more importantly, it prevented the development of a large number of
CDM/JI projects.
Need for more increased insurance capacity
A further reason for limited sales is the difficulties of gaining interest and support on the
(re)insurance markets for such new risks.
Kohler said that unexpectedly, only few (re)insurance companies had actually followed the way
paved by pioneers such as Carbon Re. Some companies have made a move forward but they are
still reluctant to providing coverage for the entire carbon credits value chain.
There are many reasons for markets not engaging into such new business. An obvious one is the
economic downturn which occurred only two years after Phase 2 started (2009 was a “big hole”).
However Kohler insisted on another important factor: few (re)insurers have ever shown any
interest or appetite for carbon risks and few have staff with the necessary expertise and training.
than premium charged for standard PRI). Prices could be much higher for non-payment coverage. It has been
suggested that delivery insurance overall may cost approximately 10% of the expected trading value of a carbon offset.
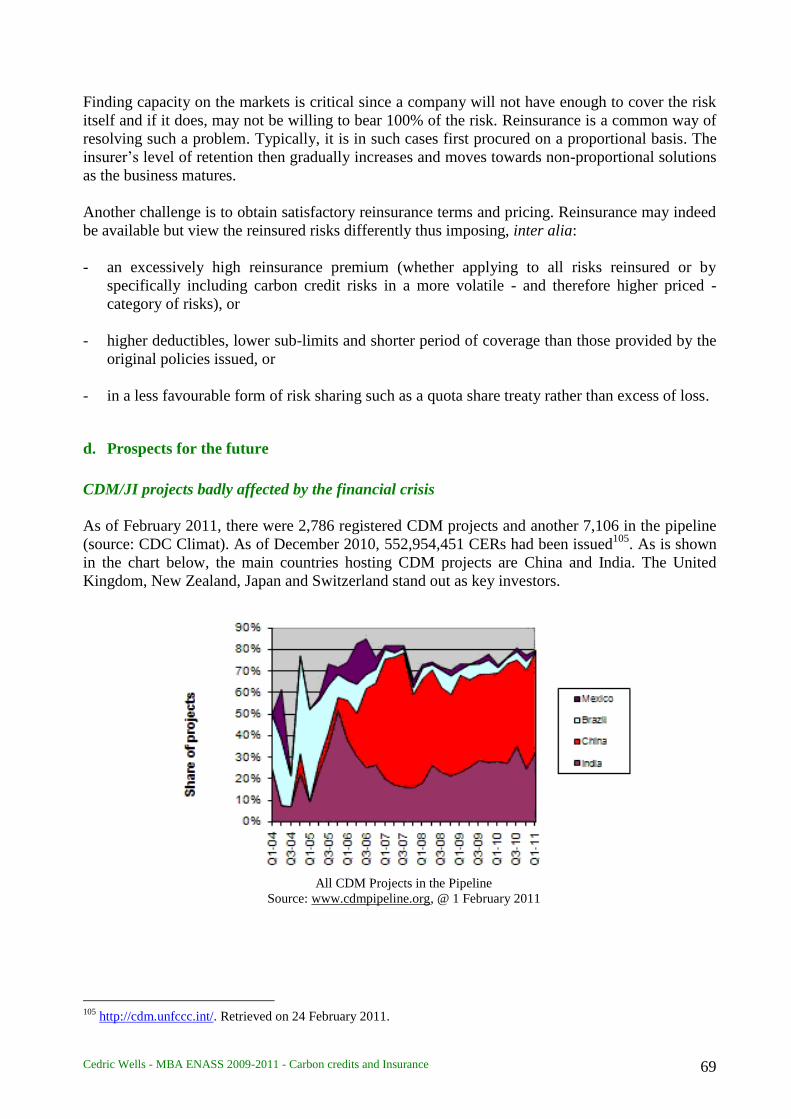
Cedric Wells - MBA ENASS 2009-2011 - Carbon credits and Insurance 69
Finding capacity on the markets is critical since a company will not have enough to cover the risk
itself and if it does, may not be willing to bear 100% of the risk. Reinsurance is a common way of
resolving such a problem. Typically, it is in such cases first procured on a proportional basis. The
insurer’s level of retention then gradually increases and moves towards non-proportional solutions
as the business matures.
Another challenge is to obtain satisfactory reinsurance terms and pricing. Reinsurance may indeed
be available but view the reinsured risks differently thus imposing, inter alia:
- an excessively high reinsurance premium (whether applying to all risks reinsured or by
specifically including carbon credit risks in a more volatile - and therefore higher priced -
category of risks), or
- higher deductibles, lower sub-limits and shorter period of coverage than those provided by the
original policies issued, or
- in a less favourable form of risk sharing such as a quota share treaty rather than excess of loss.
d. Prospects for the future
CDM/JI projects badly affected by the financial crisis
As of February 2011, there were 2,786 registered CDM projects and another 7,106 in the pipeline
(source: CDC Climat). As of December 2010, 552,954,451 CERs had been issued105
. As is shown
in the chart below, the main countries hosting CDM projects are China and India. The United
Kingdom, New Zealand, Japan and Switzerland stand out as key investors.
All CDM Projects in the Pipeline
Source: www.cdmpipeline.org, @ 1 February 2011
105
http://cdm.unfccc.int/. Retrieved on 24 February 2011.
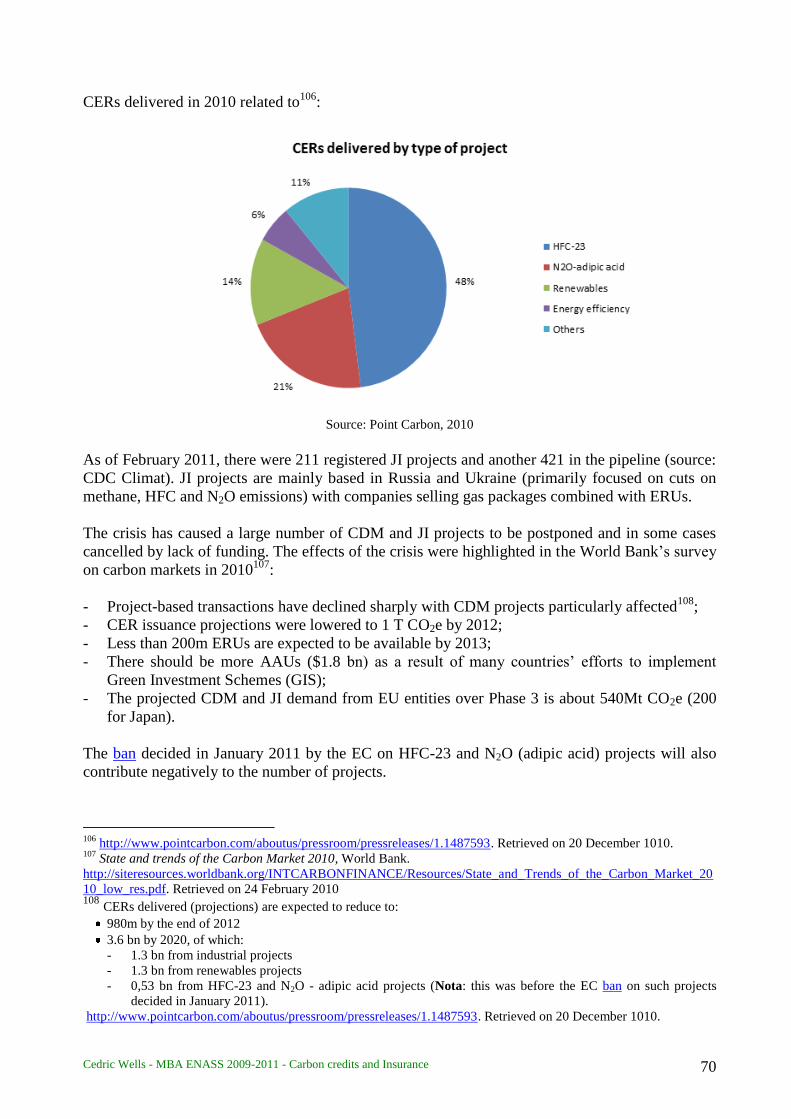
Cedric Wells - MBA ENASS 2009-2011 - Carbon credits and Insurance 70
CERs delivered in 2010 related to106
:
Source: Point Carbon, 2010
As of February 2011, there were 211 registered JI projects and another 421 in the pipeline (source:
CDC Climat). JI projects are mainly based in Russia and Ukraine (primarily focused on cuts on
methane, HFC and N2O emissions) with companies selling gas packages combined with ERUs.
The crisis has caused a large number of CDM and JI projects to be postponed and in some cases
cancelled by lack of funding. The effects of the crisis were highlighted in the World Bank’s survey
on carbon markets in 2010107
:
- Project-based transactions have declined sharply with CDM projects particularly affected108
;
- CER issuance projections were lowered to 1 T CO2e by 2012;
- Less than 200m ERUs are expected to be available by 2013;
- There should be more AAUs ($1.8 bn) as a result of many countries’ efforts to implement
Green Investment Schemes (GIS);
- The projected CDM and JI demand from EU entities over Phase 3 is about 540Mt CO2e (200
for Japan).
The ban decided in January 2011 by the EC on HFC-23 and N2O (adipic acid) projects will also
contribute negatively to the number of projects.
106
http://www.pointcarbon.com/aboutus/pressroom/pressreleases/1.1487593. Retrieved on 20 December 1010. 107
State and trends of the Carbon Market 2010, World Bank.
http://siteresources.worldbank.org/INTCARBONFINANCE/Resources/State_and_Trends_of_the_Carbon_Market_20
10_low_res.pdf. Retrieved on 24 February 2010 108
CERs delivered (projections) are expected to reduce to:
980m by the end of 2012
3.6 bn by 2020, of which:
- 1.3 bn from industrial projects
- 1.3 bn from renewables projects
- 0,53 bn from HFC-23 and N2O - adipic acid projects (Nota: this was before the EC ban on such projects
decided in January 2011).
http://www.pointcarbon.com/aboutus/pressroom/pressreleases/1.1487593. Retrieved on 20 December 1010.

Cedric Wells - MBA ENASS 2009-2011 - Carbon credits and Insurance 71
Exponential trading activity
Global carbon markets represented around $30 bn in 2006109
and $64 bn in 2007110
.
The World Bank’s survey on carbon markets in 2010111
revealed that:
- The total value of carbon transactions was $144 bn in 2009 (allowances and derivatives) i.e. a
6% increase compared to 2008 despite the financial crisis;
- $122 bn worth of transactions pertained to allowances markets (EUAs, AAUs, RGGI, etc.),
$17.5 bn to spot and secondary Kyoto offsets and $3.3 bn to project based transactions (CDM,
etc.);
- The ETS alone represented $119 bn in transactions with futures trades accounting for 73% and
spot and options markets growing;
In 2007, 2.9 bn tons of CO2 were traded of which 70% of the volume and 78% of the value
stemmed from the ETS. Orbeo has predicted the following market values for the future:
Magnitude of
market value
($ bn)
2012 2020
ETS 200 600
USA & Canada 30 1300
Australia & NZ 3 30
Japan - 150
South Korea - 40
Source: Orbeo, 2010112
Slow progression of insurance sales expected
Still today, carbon insurance markets are considered as a niche area with an embryonic activity
involving only the larger companies and some start-ups. However, it is believed that the market’s
potential is huge and that it will become one of the biggest commodity markets113
.
Despite the limited CDM/JI activity in recent years, insurers involved in carbon delivery insurance
appear to be confident that there is a future for their products. They see good prospects of sales
with the further regulation changes ahead and environmental issues becoming increasingly
sensitive in business114
. The assumption of course is that CDM/JI projects will not be affected by
Phase 3 rules and by the Kyoto Protocol expiring - which is very much an open question.
109
http://www.economywatch.com/energy-economy/carbon-market.html. Retrieved 15/08/2010. 110
World Bank. 111
State and trends of the Carbon Market 2010, World Bank.
http://siteresources.worldbank.org/INTCARBONFINANCE/Resources/State_and_Trends_of_the_Carbon_Market_20
10_low_res.pdf. Retrieved on 24 February 2010 112
http://www.iea.org/work/2010/et/Fages.pdf. Retrieved on 31 December 2010. 113
Full of promise, Tanya Havlicek, Best’s Review, August 2010. 114
70% of respondents to a 2010 Point Carbon survey believed it was “likely” or “very likely” that there would be
demand for CERs in Phase 3. The figure is lower for JI projects (52%).
(http://www.pointcarbon.com/research/promo/research/). Only 11% respondents believed that their involvement in
CDM projects as investors or traders of CERs would reduce.

Cedric Wells - MBA ENASS 2009-2011 - Carbon credits and Insurance 72
There are no publicly available projections of insurance sales, only internal ones which could not
be shared. According to Jonathan Young (Munich Re), the size of the potential market can be
derived from the number of registered or planned CDM and JI projects, available from the UNEP
Riso website and the insurable value of the carbon risks (but not the project assets) can be
estimated by applying an average premium to the number of ERs.
Young said that the credit crunch had changed the way ERPAs were structured. Instead of making
upfront payments, carbon credit buyers, with some exceptions, have decided to pay for CERs only
on delivery. The buyers’ risks associated with future delivery has therefore vanished and the need
for insurance shifted back to the project owners/developers’ side, i.e. the sellers, who are generally
located in CDM/JI host countries. In the absence of forward purchases, sellers must initially self-
fund their projects (which is a major problem) and rely on their standard PD/BI insurance to
include their CDM/JI activities. Although some advanced payments have been seen recently, they
are limited in number and in size. Young did not expect any material increase in demand on the
buyers’ side in the very near future.
Julian Richardson (Parhelion) agreed that overall, no significant increase in sales was immediately
expected. The only way this could change was if one or several major uninsured losses prompted
companies to purchase cover. The recent decision to postpone the delivery of CERs to China-
based HFC23 plants could set a precedent.
Targets
Richardson’s view was that carbon funds and investment banks were the main carbon finance
parties currently interested in carbon credit non-delivery insurance (as opposed to industries that
tend to retain risk and actually participate in carbon funds). This was also the view of Alexandre
Kossoy (World Bank) who believed that intermediaries and aggregators were another niche that
could benefit from comprehensive insurance products covering the catastrophic risk their portfolio
of projects might be exposed to (e.g. a decision from the Chinese government to nationalize 100%
CDM projects in China).
Dirk Kohler (Carbon Re) believed that the highest prospects of sales currently appear to be with
project developers, particularly those that face restrictions as a result of the financial crisis and are
seeking to make their projects more “waterproof”.
Kossoy believed that with new carbon markets emerging throughout the world, demand for credits
should increase and prices could make carbon credits valuable to the extent that the need for
insurance could rise.
Key to success?
Kossoy’s view was that insurers and their clients should be able to find common grounds despite
the large gap between the limited cover currently available and the comprehensive protection
required. This however can only happen if insurance is sold at a reasonable price and if regulatory
risks are included.
Julian Roberts (Willis) believed that a good way to evaluate the economics of non-delivery carbon
credit insurance might be to find out whether a buyer could access carbon assets with a reduced
cost of capital (or better price) with carbon insurance in place. Roberts doubted that a large carbon
Cedric Wells - MBA ENASS 2009-2011 - Carbon credits and Insurance 73
fund would want to dilute its margin when it is able to mitigate the risk itself by virtue of internal
spread of project risk and mitigated exposure to delivery risk.
Roberts also characterized the market for carbon credit insurance as still immature, and said that it
had yet to prove that it is viable – or, at least, in what form. The underlying market essentially
remains heterogeneous and diffuse. The question remains as to which part of the carbon “food
chain” such products are best directed. Buyers, Sellers or the makers of markets and capital
providers?
Interestingly, whereas insurers are competing to offer the wrap-up policies which they believe
industries need, Cliff Warman (Marsh) said that some clients were looking for more discrete and
partial coverage e.g. for technology and efficiency risks but not political risks (which they may
have covered elsewhere) or regulatory risks (which they may deem very low in a given country).
New horizons?
The vitality of carbon markets will very much depend upon how clear the awaited Phase 3 rules
are. Indeed, if companies are able to identify and assess the risks they face more accurately, they
will in a better position to determine whether insurance is an option they should consider or not.
Carbon markets also place their hopes in new growth drivers for carbon trading such as the cap
and trade schemes emerging throughout the world and the forestry sector. Both would undoubtedly
help boost insurance sales.
Although forestry does not currently enter the scope of the ETS, Forest Re115
has been working on
the design of specific forest carbon delivery insurance for several years. The cover focuses on the
catastrophic perils which forestry faces namely fire, hurricane and ice storm.
In practise, most carbon delivery projects are at early stages and although some companies have
expressed interest such type of insurance, none has actually purchased it. Phil Cottle (ForestRe)
however saw promising prospects of sales of carbon delivery insurance in the future for several
reasons. Firstly, fire and wind loss severity are on the rise; so is storm frequency. Secondly,
commitment levels through voluntary schemes are increasing. Thirdly, and more importantly,
mandatory cap-and-trade schemes appear to be prepared to accept forest carbon offsets. This has
actually happened recently, in December 2010, with the adoption by the California Air Resources
board (CAR) of its mandatory scheme. ForestRe has done some work for the CAR. In particular, it
has proposed and priced the buffer insurance pool protection which the CAR is keen on
implementing.
By contrast, Jean Fournier (Global Aerospace) could not foresee any specific insurance needs for
the aviation sector (which will enter the ETS scope in Phase 3). Fuel costs and their volatility have
115
ForestRe specialises in the design of insurance and reinsurance solutions for forestry and tree crop plantations
worldwide. The company entered into a line slip agreement with a group of Lloyd’s syndicates to underwrite a global
forestry portfolio. ForestRe can accept up to $7.5m sum insured any one risk and location. Additional capacity may be
arranged on a case by case basis through coinsurance and/or reinsurance. The company mainly provides FLEXA115
coverage extending to other catastrophic natural hazards such as wind, cyclone, tornado, hail, frost, snow, ice, drought,
land slide, earthquake and flood. It can also offer bundled risk cover to include enterprise risk such as credit, political
and liability risks through its insurance partners.
Insurance is primarily destined to forest investors (REITs115
, TIMOs115
, banks, corporations, aggregators, forest funds,
etc.), to owners and to managers from the private and public sector in activities such as conventional wood fibre
production, biomass, biofuels, industrial tree crops and projects delivering ecosystem services.
Cedric Wells - MBA ENASS 2009-2011 - Carbon credits and Insurance 74
been an issue for many years. Hedging mechanisms including options have largely been used by
airlines with mixed results. Today the simplest and most common way of dealing with the problem
appears to be to buy more efficient aircraft and to reflect fuel price volatility in sales prices. The
real concern with airlines that are subject to the ETS is its impact on competition.
Pierre Albano explained that although Air France was preparing for 2012, the group was awaiting
to know what the exact rules would be. In particular, Air France has stopped purchasing CERs
pending clarification as to what quantity will be allowed by the ETS scheme to compensate for
emissions.
Grégoire de la Motte (Carbonless) questioned whether business opportunities for insurers wouldn’t
more easily be found with individuals and small corporations. His point was that global
companies have adequate tools to manage carbon credit-related risks (internally or through
solutions on the carbon markets similar to those used for commodities). By contrast, individuals
and smaller size companies are not geared to face the risks which will stem from the carbon-credit
regulation throughout the world which they may one day be subject to.
Marc Yana’s view (Chartis) was that if and when small companies and individuals did become
subject to regulation, insuring them via an investment fund that pools their compliance
requirements would be an efficient methodology. Jillian Raw believed that some smaller
companies that become subject to the ETS because of aggregation of output might be the entities
that require insurance since unlike the large typical carbon emitters they may not have the
resources to carry a loss internally.

Cedric Wells - MBA ENASS 2009-2011 - Carbon credits and Insurance 75
3. UNDERWRITING CHALLENGES
ABSTRACT
Insurers are familiar with project-based risks. To a large extent, the risks which CDM and JI
projects raise are no different to other projects. Pricing carbon-related risks therefore causes no
new difficulty prima facie.
There are two notable exceptions however:
1. Price volatility: fluctuation of carbon market prices has been limited in Phase 2 but is
expected to increase in Phase 3. To a large extent supply and demand are driven by the
regulatory bodies and evolving emissions reduction policies. As in other insurance
delivered to industries trading the commodities they produce (such as mining), some level
of capped volatility should however be acceptable.
2. Regulatory risks: regulation is constantly changing and decisions are increasingly taken to
correct loopholes and prevent abuse (carbon fraud and theft, HFC 23 and adipic acid
projects in China). The validation and registration process for CDM/JI projects is
demanding and rejections by the CDM EB are frequent. Currently most insurers believe
that despite widely available data on projects generally, there is no meaningful material and
history from which reliable actuarial models can be derived.
Contract certainty must be a priority for policies that involve carbon credits in some way or
another failing which disputes will undoubtedly arise. Attention must urgently be focused on
sensitive issues such as the valuation of losses (in the absence of accounting norms), mitigation of
loss efforts and salvage.
The following developments predominantly refer to carbon delivery insurance however in some
instances (particularly section 3.1.c. Underwriting information) comments made will encompass
risks previously described as “ICW” risks.
Cedric Wells - MBA ENASS 2009-2011 - Carbon credits and Insurance 76
3.1 Insurability
a. Where are the limits?
Risk management literature proposes a risk matrix consisting of three main risk categories: Market
risk, Strategic risk and Carrying out risk. The three categories in turn subdivide in Systematic (or
Unsystematic) risk, Pure (or Speculative) risk and Insurable (or Uninsurable) risk. In essence,
Systematic (a loss than happens to all e.g. the fluctuation in the value of the Euro) and Speculative
risks (win or lose situation) are not insurable. In contrast, insurable risks are caused by sudden and
accidental events which are pure, unsystematic and for which one can only lose.
Insurable events are generally understood to be those that are fortuitous and not proscribed by law.
Determining the exact scope of insurability (for which there is no universal definition) is a matter
for each company to decide on based on its own underwriting policy and guidelines. A decision to
insure carbon credit risks will depend on a number of factors such as, for example, the lines of
business written by a company, the tools and expertise it has (or can outsource) or its level of
appetite for risk (and for high premium).
In an article published in Insurance Today116
, Munich Re explained the way it typically
contemplated new businesses and decided on insurability. Firstly, it gathers all its teams that have
an interest and skills in the subject matter (actuaries, insurers, experts, etc.). It then compares the
new risks with similar ones that exist (if any) and finally decides whether the risk is insurable or
not (which might change in the future). When a risk is deemed insurable, coverage will generally
at first be offered with small limits.
One global insurer that does not market carbon credit insurance assumed, for sake of discussion,
that if an insurable interest could be accurately identified, an insurer would, as is typical for other
lines of business, first ask its client to list the risks and related costs/values which it wishes to
transfer to insurance. Then the insurer would identify its own risks and seek ways of limiting them
(e.g. via contractual limitations and/or exclusions) in order to meet its company’s insurability
criteria. The final stage of the process would be to refine the product so that it meets its clients’
requirements to the extent possible.
b. How do carbon credit risks match essential characteristics of insurability?
Referring to CDM and JI projects, Julian Richardson’s (Parhelion) view was that they must satisfy
minimal risk underwriting needs such as a low probability of occurrence, a high degree of
randomness for losses, a small reduced average loss amount and a capped maximum loss. It must
also be possible to pool and diversify the risks involved. In order for a company to determine
whether it is appropriate to transfer a risk, it should answer the following questions: who has the
best opportunity to influence risk? Which is the most appropriate party to own the risk? Is the
CDM/JI a good project that was unlucky or was it just a bad project?
116
Munich details its approach to uninsurable risk, Insurance Day, 10/09/2010.

Cedric Wells - MBA ENASS 2009-2011 - Carbon credits and Insurance 77
The non-delivery (or late delivery) of carbon credits is in fact a consequence of an underlying peril
(that might or might not be insured). As such, premium for the non-delivery risk effectively
aggregates the premium charged for each peril insured under a policy. Insurability must therefore
be assessed on a risk per risk basis.
definite losses
Insurance must cover events that occur at a known time, at a known place and as a result of a
known cause.
Although such requirements can in some instances be relaxed (asbestosis has led to massive
insurance pay-outs without such criteria being met), they do not raise any issue for carbon credits
risks. Indeed, the causation (e.g. fire, nationalization, machinery breakdown, etc.) and the date of
loss (date of a technical incident or damage or date of discovery of such incident or damage; date
of a public decree; date of inception of riots, etc.) will be quite easily identifiable. And so will the
location (industrial plant; region, country, etc.).
fortuitous losses
A loss must be accidental or at least out of the insured’s control. Ordinary business risks are
generally not insurable. For example, an increase in pollution stemming from a company’s
decision to increase its production for any reason would not qualify as an unforeseeable situation
as required for there to be an insurable interest.
Julian Richardson explained why coverage for CDM/JI projects only incepts once they are
registered. In his view, investors in CDM/JI projects choose reputable project developers/providers
and insurers should not provide efficacy or performance cover. If an issue or technical failure
arises during the pre-registration phase, it would in any event cost far less to an investor to have its
contractor or an expert review the project design than to procure insurance for such a peril. To
cover such risks would also raise a moral hazard in that companies procuring such insurance might
be encouraged to relax the level of care and quality of their work.
a large number of similar exposure risks
Insurers appear to have a population large enough to pool some (but not all) of the underlying risks
of non-delivery. Also, as Richardson stressed, the level of information available with regards to
CDM/JI projects is actually higher than in other sectors. It will be seen however that they are at
pains to group risks of similar nature (see Pooling) such as types of projects, technologies involved
or sectors at stake. In such circumstances, it can prove difficult to establish the law of large
numbers in which predicted losses would match actual losses.
A further issue affecting homogeneity requirements stems from the way GHG emissions should be
measured. Annex IV to the 2003 EU Directive provides that they shall be monitored by calculation
or on the basis of measurement. Calculations of emissions must be performed using the following
formula: (Activity data x Emission factor x Oxidation factor). Measurement must be undertaken
by using “standardised or accepted methods, and shall be corroborated by a supporting
calculation of emissions”. Measurements have in fact caused some debate because they are
currently based on theoretical calculations whereas actual physical measurements through sensors
or flow meters in chimneys for example would also provide a relatively high degree of accuracy.

Cedric Wells - MBA ENASS 2009-2011 - Carbon credits and Insurance 78
As highlighted in the CDP Report Europe 300117
, companies from the energy sector use quite
different metrics when disclosing emissions (tons of throughput versus output, barrel of oil
equivalent versus ton) and different scopes (group versus division level, oil versus gas extraction
activities, etc.). Companies (and their insurers for purposes of comparing risks) clearly lack
reliable GHG emission and reduction measurement, reporting and verification tools. These could
be provided by way of international standards created by organisations such as the ISO.
large losses
A loss under a policy must be of meaningful size to an insured company failing which there will
be little value in such company incurring insurance costs. As previously discussed, carbon credit
losses are expected to represent high costs, possibly in tens of million Euros to the largest
companies. Such amounts are in fact significantly lower compared to the costs which same
companies are exposed to when purchasing the other commodities they need for production
purposes.
Insurers’ businesses do not seem to be more exposed to carbon credit risks than they are to the
more conventional risks that they write (including natural catastrophic risks). Accumulation
scenarios are conceivable such as, for example, (a) a decision from the Chinese government to
cancel all CDM projects on its territory that involve methane or, (b) a generic failure affecting a
worldwide population of CCS plants. The CDM EB’s decision on HFC23 provides a real example
of a potentially catastrophically large loss to industries involved. Such situations should normally
be factored by insurers in their determination of a probable maximum loss and accumulation
scenarios. In addition, insurers may have specific reinsurance programs covering peak claims of
the type.
affordable premium
Premium charged specifically for carbon credit risks must not be too large relative to the sums
insured.
The feedback from companies interested in procuring carbon credit delivery insurance included a
comment on premium being too high. Price ranges today necessarily reflect the fact that insurers
are not able to properly calculate the losses by lack of empirical evidence and statistical data. They
will drop (and scope of cover will probably broaden) with insured populations rising and increased
dispersion of risk.
calculable losses
An insurer must be able to calculate (or at least estimate) the probability of loss (actuarially fair
price) and the attendant cost (an objective evaluation of the amount an insurer might have to pay in
case of a claim). As discussed in section 2.3, insurers can do this with certain exceptions.
Parhelion, Carbon Re and Munich Re have taken the unique stance that regulatory risks can be
covered based on historical efficiency as derived from UNFCCC data. This is discussed in further
detail in section 3.2.a (Regulatory).
117
https://www.cdproject.net/CDPResults/CDP-2010-Europe-300-Report.pdf. Retrieved on 21 December 2010.

Cedric Wells - MBA ENASS 2009-2011 - Carbon credits and Insurance 79
3.2 Risk assessment
Measuring risk is generally done in the following way: (a) by identifying the risk, (b) by
identifying the various parameters affecting the risk, (c) by ascertaining the correlation of each of
those parameters and (d) by assessing the probability of the risk analytically118
.
Nick Silver (Callund Consulting) has identified the following biggest risks for carbon credit non-
delivery insurance:
Source: Parhelion/Callund Consulting Limited119
a. Actuarial considerations (regulatory risk)
In contrast with perils such as fire, natural catastrophes, delay in start-up or confiscation by a
governmental entity, regulatory and price risks for CDM/JI projects are difficult (if at all possible)
to assess. This subsection will focus on regulatory risks (Volatility is discussed under section 3.3),
where there is no experience or claim history available for purposes of assessing and pricing risks
(except in Parhelion, Carbon Re and Munich Re’s view). Actuaries currently do not have a loss
database from which they can generate exposure curves and models. Also, little risk dispersion is
possible because projects are essentially concentrated in China, India and Brazil.
118
Management of Risk Due to Climate Change, 10th
Global Conference of Actuaries, D. Basu -
http://www.actuariesindia.org/GCA/10th%20GCA/Papers/General%20Actuarial%20Topics/15_Management%20of%
20Risk%20Due%20to%20Climate%20Change_D%20Basu_10th%20GCA.pdf 119
http://www.actuaries.org/ASTIN/Colloquia/Manchester/Presentations/Silver.pdf.
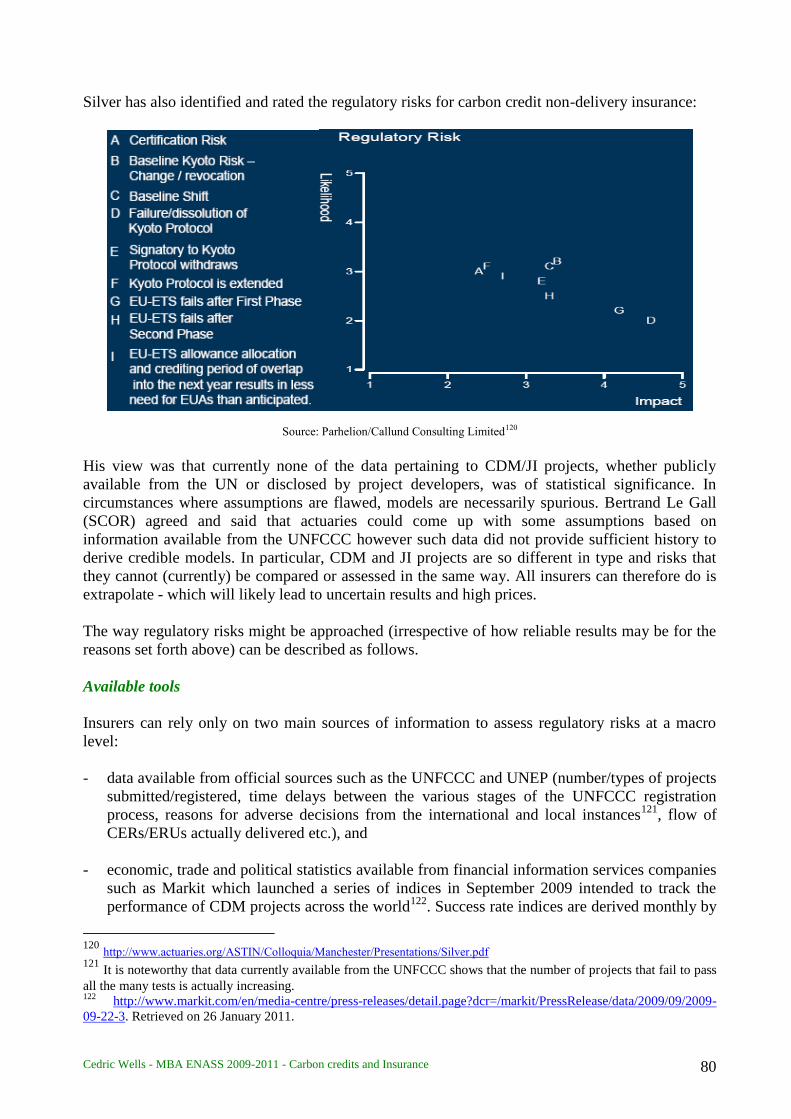
Cedric Wells - MBA ENASS 2009-2011 - Carbon credits and Insurance 80
Silver has also identified and rated the regulatory risks for carbon credit non-delivery insurance:
Source: Parhelion/Callund Consulting Limited120
His view was that currently none of the data pertaining to CDM/JI projects, whether publicly
available from the UN or disclosed by project developers, was of statistical significance. In
circumstances where assumptions are flawed, models are necessarily spurious. Bertrand Le Gall
(SCOR) agreed and said that actuaries could come up with some assumptions based on
information available from the UNFCCC however such data did not provide sufficient history to
derive credible models. In particular, CDM and JI projects are so different in type and risks that
they cannot (currently) be compared or assessed in the same way. All insurers can therefore do is
extrapolate - which will likely lead to uncertain results and high prices.
The way regulatory risks might be approached (irrespective of how reliable results may be for the
reasons set forth above) can be described as follows.
Available tools
Insurers can rely only on two main sources of information to assess regulatory risks at a macro
level:
- data available from official sources such as the UNFCCC and UNEP (number/types of projects
submitted/registered, time delays between the various stages of the UNFCCC registration
process, reasons for adverse decisions from the international and local instances121
, flow of
CERs/ERUs actually delivered etc.), and
- economic, trade and political statistics available from financial information services companies
such as Markit which launched a series of indices in September 2009 intended to track the
performance of CDM projects across the world122
. Success rate indices are derived monthly by
120
http://www.actuaries.org/ASTIN/Colloquia/Manchester/Presentations/Silver.pdf 121
It is noteworthy that data currently available from the UNFCCC shows that the number of projects that fail to pass
all the many tests is actually increasing. 122
http://www.markit.com/en/media-centre/press-releases/detail.page?dcr=/markit/PressRelease/data/2009/09/2009-
09-22-3. Retrieved on 26 January 2011.

Cedric Wells - MBA ENASS 2009-2011 - Carbon credits and Insurance 81
comparing CERs actually produced (per type of project, sector or region) to volumes targeted
in PDDs over a 24-month rolling period. Measurements are based on an interpretation of
UNFCCC data.
Despite the limited history of CDM/JI projects, Dirk Kohler (Carbon Re) considered that there was
ample data available from the UNFCCC from which acceptable models could be derived. A
strictly actuarial approach of regulatory risks however is not sufficient. An insurer could not afford
to sell such coverage without some form of “political” involvement. Indeed, a company must be
fully aware of ongoing discussions within the regulatory bodies so as to better identify areas of
potential legislative changes. With this in mind, Carbon Re has obtained seats at the UNFCCC
negotiations and various other international instances.
Possible methodology
Stage 1: establishing a “standard” model
Irrespective of the specificities of a particular CDM/JI project, a “standard” regulatory risk model
could be determined on the basis of observed/known frequency and severity at a macro level.
If samples used to derive models are too small in number, credibility adjustments may be used in
order to include them in a larger selection of risks (e.g. aggregating adverse national and
international regulatory decisions). This will require applying an acceptable level of weighted
average. Some form of segmentation may be possible.
-> a “standard” regulatory risk evaluation rate is available
Stage 2: applying the “standard” regulatory model to the specificities of a CDM/JI project
For each individual CDM/JI project it is asked to quote, an insurer will then look at its specific
features and data (design, construction and operation of the project and technologies involved,
country, project funding, loss mitigation items, ERPA conditions, etc.).
This will lead him to apply further credibility adjustments thus to either increase its standard
regulatory per risk evaluation rate or to decrease it. China for example is known to be a
particularly attractive host country for CDM/JI projects which should mean a lower premium for
the regulatory risk. By contrast, a higher weight will be given on projects/countries for which little
data is available and/or no particular efforts have been made to facilitate the implementation of
CDM/JI projects.
-> a “project-based” regulatory risk evaluation rate is available
Stage 3: aggregating the “project-based” regulatory model with all other “project-based”
models
The “project based” evaluation rate charged for a project will be based on the aggregation of rates
calculated for every risk involved in same project (political, technological, insolvency, etc.)..
-> an “all risks project-based” evaluation rate is available

Cedric Wells - MBA ENASS 2009-2011 - Carbon credits and Insurance 82
Stage 4: aggregating the “all risks project-based” model with other “all risks project-based
models” in a portfolio
Once all projects and their associated risks have each been assessed individually, an insurer will
seek to assess the overall risk at portfolio level in order to come up with a “portfolio-based”
evaluation rate. Aggregating risks of quite different type and nature will require some weighted
average. A critical point not to miss is that certain types of risk are correlated. By way of an
example, a decision by the Indian government to seize all projects of a certain type on its territory
may is likely to affect a very large number of projects. Companies must therefore determine their
level of maximum overall exposure to such a loss when writing a large portfolio of projects.
-> a “portfolio-based” evaluation rate is available
Final stage: distribution curve
The final result (distribution curve) should tell an insurance company what the overall chances are
(accounting for all risks involved) that a project or a portfolio of projects will deliver less (or
more) than 100% of the expected credits. It will determine the company’s acceptable level of value
at risk i.e. which maximum amount it is ready to expose to a centenary loss probability.
b. Alternative solutions
New regulations, market volatility and political risks are commonly referred to as sources of
special risks. Special risks are risks which are difficult to quantify (e.g. because they are unique or
limited in number or they involve qualitative aspects which cannot accurately be measured or there
are too many variables involved) and which can lead to large losses. As such, they are not
generally covered by the classic forms of insurance. Some insurers however have developed
alternative methods of mutualising risks.
One way to achieve this is to depart from traditional risk categorization and to insure a portfolio of
risks which have similar properties and are therefore fairly homogeneous in nature. Another is to
adopt a contra-cyclical approach: if for any reason a given risk cannot or is very unlikely to occur
simultaneously with another then this may allow an overall balanced exposure to risks.
When statistics are not available (an earthquake risk might for example only be 1 in 1,000 years),
risks may be transferred to insurance if a frequency risk and severity can be derived from a model.
A model can be calculated based on either:
- proxy statistics (e.g. terrorism risks in Paris calculated using data available for other locations
such as New York or Madrid), or
- purely theoretical scenarios (absent any real data but possibly referring to scientific surveys).
Thomas Renggli (SCOR) insisted that a model cannot be used without the regulators’ prior
approval. Companies also need the blessing of rating agencies which own models will treat any
excessive volatility negatively.
Situations where actuaries have no meaningful data to rely on typically occur when insurance
markets seek to cover new risks. There are many examples of insurance delivered in situations
where pooling would be difficult if not impossible such as the risk of a batsman hitting six sixes in

Cedric Wells - MBA ENASS 2009-2011 - Carbon credits and Insurance 83
a row at the cricket World Cup in 2000. This actually happened, triggering a $1m indemnity which
was paid out to charity.
When commercial satellite launch flights were first insured in the late 70s, space technologies
were new to insurance carriers. There were a very small number of launches per year and values at
stake were already considerably high. Notwithstanding, operators were able to procure insurance -
albeit at a high cost and subject to deductibles and limits -. Today, the market is a mature one, with
an average 20 insured launches per year and an overall insured fleet of around 150 satellites.
Whereas it involved around 15 carriers in the 90s, there are about twice as many on the market
today.
Guy Lallour (XL) was involved in space insurance when it was still a new line of business. He
explained how easy it had been at the time to insure satellite launches despite very limited
statistics and virtually no mutualisation possibilities. Insurers quite simply charged premium based
on the launchers’ success rates which were disclosed to them: if one launch vehicle in ten had
failed, a 10% premium (of the overall sum insured) would be applied. Levels of premium only
started to decrease when what became a profitable market attracted more capacity and an
experience curve could be derived from a larger number of launches. They increased again and
market hardened with claims badly affecting market performance in the late 90s/early 00s.
Lallour’s point in comparing carbon credit insurance to space insurance, now a mature market,
was that insurance can be procured even when some of the fundamental underwriting criteria
cannot be met. An insurer’s major concern in Lallour’s view is that a premium must be able to pay
for the maximum loss under a policy. Therefore whether this is achieved through no mutualisation
or through mutualisation of a small or a large number of risks is not so much of an issue.
Terrorism risk provides another good example of a risk that was once difficult to insure and has
now become ripe. After the 9/11 events in the USA, the TRIA made it compulsory for insurance
companies selling insurance in the country to offer specific terrorism cover (subject to the payment
of a separate specific premium). Most companies responded reluctantly however others saw an
opportunity to charge high premium which proved very profitable. Today many players can be
found on the terrorism market and levels of premium have dropped accordingly.
Although this does not ever appear to have been suggested, governmental environmental policies
might one day decide that companies must procure carbon non-delivery policies (in the same way
as third party motor insurance is compulsory in most countries), particularly for medium range
emitters that couldn’t afford to retain the risks. This is probably wishful thinking.
c. Underwriting information
A company seeking to procure insurance involving carbon credits (whether allowances or offsets)
should expect to be asked a number of specific questions (in addition to those normally raised with
respect to the industrial risks insured) pertaining to the company and its project, e.g. to:
- Its location (country, urban or rural area, etc.)
- Its ownership and management
- The schedule of works, start-up and operations
- The actual and expected number of installations that are subject to ETS scheme
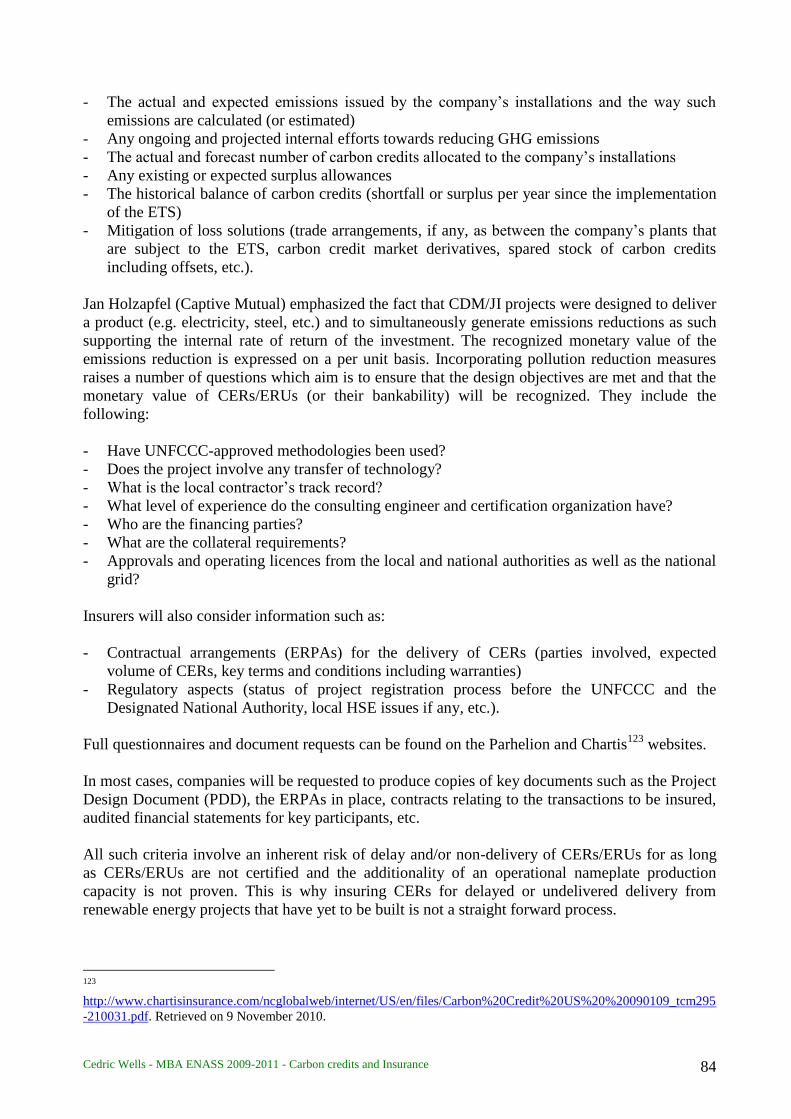
Cedric Wells - MBA ENASS 2009-2011 - Carbon credits and Insurance 84
- The actual and expected emissions issued by the company’s installations and the way such
emissions are calculated (or estimated)
- Any ongoing and projected internal efforts towards reducing GHG emissions
- The actual and forecast number of carbon credits allocated to the company’s installations
- Any existing or expected surplus allowances
- The historical balance of carbon credits (shortfall or surplus per year since the implementation
of the ETS)
- Mitigation of loss solutions (trade arrangements, if any, as between the company’s plants that
are subject to the ETS, carbon credit market derivatives, spared stock of carbon credits
including offsets, etc.).
Jan Holzapfel (Captive Mutual) emphasized the fact that CDM/JI projects were designed to deliver
a product (e.g. electricity, steel, etc.) and to simultaneously generate emissions reductions as such
supporting the internal rate of return of the investment. The recognized monetary value of the
emissions reduction is expressed on a per unit basis. Incorporating pollution reduction measures
raises a number of questions which aim is to ensure that the design objectives are met and that the
monetary value of CERs/ERUs (or their bankability) will be recognized. They include the
following:
- Have UNFCCC-approved methodologies been used?
- Does the project involve any transfer of technology?
- What is the local contractor’s track record?
- What level of experience do the consulting engineer and certification organization have?
- Who are the financing parties?
- What are the collateral requirements?
- Approvals and operating licences from the local and national authorities as well as the national
grid?
Insurers will also consider information such as:
- Contractual arrangements (ERPAs) for the delivery of CERs (parties involved, expected
volume of CERs, key terms and conditions including warranties)
- Regulatory aspects (status of project registration process before the UNFCCC and the
Designated National Authority, local HSE issues if any, etc.).
Full questionnaires and document requests can be found on the Parhelion and Chartis123
websites.
In most cases, companies will be requested to produce copies of key documents such as the Project
Design Document (PDD), the ERPAs in place, contracts relating to the transactions to be insured,
audited financial statements for key participants, etc.
All such criteria involve an inherent risk of delay and/or non-delivery of CERs/ERUs for as long
as CERs/ERUs are not certified and the additionality of an operational nameplate production
capacity is not proven. This is why insuring CERs for delayed or undelivered delivery from
renewable energy projects that have yet to be built is not a straight forward process.
123
http://www.chartisinsurance.com/ncglobalweb/internet/US/en/files/Carbon%20Credit%20US%20%20090109_tcm295
-210031.pdf. Retrieved on 9 November 2010.
Cedric Wells - MBA ENASS 2009-2011 - Carbon credits and Insurance 85
d. Assessing the quality of a project
The quality of CDM/JI projects can vary significantly. The numerous bogus offset projects (see
HFC23 and adipic acid projects in China) have prompted the EC to call for a reform of the CDM
mechanism, recognising only those projects that genuinely generate additional emission savings
and that go beyond the cheapest options124
.
Quality - which should translate into lower exposure to risk from an insurance standpoint - can be
assessed based notably on the following key characteristics of offset projects:
The quality of the underwriting information and supporting documents.
The decision by a company to develop or participate in a CDM or JI project involving a
technology it is familiar with.
The results of feasibility studies covering financial, technical, geographical, political and
regulatory aspects (including the level of the country risk, exchange rates and prospects of
changes in law). Pre-validation assessment reports and credit standing of the project sponsor
will be valuable elements for an insurer.
Gaëtan Cadero said that the feasibility surveys which Lafarge carries out prior to investing in a
CDM project are based on an extensive review of operational data. They cover features such as
actual emissions reduction, additionality and prospects of effectively being delivered CERs based
on UNFCCC criteria. Surveys also include a comprehensive analysis of all risks (including
technical, political and regulatory) associated with a project. The technical, quality and
performance characteristics of a CDM project are reviewed and assessed in the same way as any
other industrial project.
The stage reached in the UNFCCC and local administrative process. The more advanced a
project the lower the regulatory risk. Being granted the registration status at the CDM EB and
meeting the Measurement, Reporting and Verification (MRV) criteria under the Kyoto Protocol
should in principle mean that the project has met high quality standards.
Local monitoring. Jan Holzapfel (Captive Mutual) mentioned EcoSecurities, a project
developer and aggregator that produces and purchases primary and secondary carbon credits.
EcoSecurities employs teams locally to monitor CDM/JI projects and verify that they are pursued
according to plan. The company’s goal is to improve the prospects of delivery being achieved
within the contractually agreed timeframe. EcoSecurities’ business model calls for the purchase of
a large volume of CERs/ERUs from various sources and projects it undertakes across the world in
order to mitigate the risk of delayed and/or undelivered carbon credits. Any unexpected delays in
the delivery of CERs will impact price volatility on carbon markets, increase the level of
uncertainty, reduce credibility and may seriously affect the company’s shareholders’ value as
previous experience as shown. Holzapfel also referred to the Gold Standard Foundation as one of
several Non-Governmental Organizations that work with local stakeholders in order to provide a
higher degree of control and quality of projects (in all their phases) and therefore enhanced
probability of delivery of CERs. Gold Standard has entered into an agreement with companies
such as Carbon Re and Munich Re.
124
Questions and Answers on the Communication Towards a comprehensive climate change agreement in
Copenhagen, European Commission, 28 January 2009, MEMO/09/34.

Cedric Wells - MBA ENASS 2009-2011 - Carbon credits and Insurance 86
Independent certification. Insurers will seek to know which organization will be measuring the
offsets and how often this will happen. Asking an independent accredited auditor to provide a
report validating offsets to the accrediting body will help. So will asking a second auditor to
perform an independent post-start audit comparing actual CO2 emissions reductions achieved to
emissions but for the offsets, whether the emissions are calculated based on design models or in
field assessments of similar projects using similar technology.
Fungibility. Insurers need to know which schemes CDM/JI project accredit is under and which
use can be made on the offsets (compliance, trading, voluntary schemes, etc.).
Mitigating effect of the large portfolio of projects owned by aggregators. Alexandre Kossoy
(World Bank) said that ERPAs could mitigate some of the delivery risks through seniority, right of
first refusal, call options and sweeping clauses which allow buyers to receive additional annual
CERs generated by a project. In addition, delivery risk is naturally mitigated through the
diversification (regional and/or sectorial) in the funds’ portfolio of investments in carbon projects.
Funds can also limit the contractual volume to be purchased (i.e. to 80% of the expected
CERs/ERUs generated) to create a cushion in the case of unexpected reduction in the annual
generation of CERs/ERUs (i.e. in the case of a hydro project during a draught season).
e. Consideration of the specific identity and needs of an insured party
Jan Holzapfel (Captive Mutual) said that the way an insurer assesses a risk depends on whether the
policyholder is a CER/ERU buyer or a CER/ERU seller (and potentially its contractor). One has to
contemplate the specific project risk landscape and determine which party(ies) will carry what risk.
He added that the manner in which insurance could be arranged depended on a party’s type and
level of contractual involvement in a project and the specific risks it is exposed to (see
Stakeholders). Insuring a buyer implies increased exposure to issues including, but not limited to,
moral hazard, risk of a third party (credit) default or political risks. A buyer does not own the asset
nor does it have any physical, operational, risk management or loss mitigation control over it. By
contrast, it is easier to deliver insurance to a seller, which is the future owner of an asset, because it
will have control over the entire process of a project i.e. from design to operational stages. It will
also have access to a high level of information from all parties and contractors involved. It will
therefore typically procure project insurance covering its assets (including contractor’s liability)
against material damage and any subsequent financial losses which will secure its financial “debt”
and other obligations in the event of a loss occurrence.
Holzapfel said that in some cases, insuring a CER/ERU buyer’s risks may reach the limits of
insurability because of same buyer’s specific situation in the overall risk landscape. Insurers that
have no local outlets providing them with access to specific knowledge of local habits, ways of
conducting business and the handling of compliance issues may need to factor in specific
constraints and hurdles when selling insurance products for renewable projects. Issues notably
include the lower level of transparency, restricted access to key data, less reliable contractors, lack
of track record, potential bribery and contract uncertainty. The language barrier alone can seriously
interfere with an accurate assessment of a risk. A further issue relates to some countries
prohibiting foreign companies from owning a share or majority share in a company (such as
China), meaning reduced stakeholder control. Depending on the parties involved, this can deprive
an insured CER/ERU buyer as well as its insurers from exercising any control over a project,
leaving a local joint-venturer’s hands free to take decisions (possibly under a government’s
guidance) which could interfere with (or even jeopardize) the delivery of CERs/ERUs. It could
Cedric Wells - MBA ENASS 2009-2011 - Carbon credits and Insurance 87
also mean greater difficulties for insurers in recovering paid losses from the party which fault has
been established. Holzapfel insisted on how important it was for a project insurer to have local
expertise for CDM projects.
Julian Richardson (Parhelion) agreed that local insurance markets were able to provide the more
traditional insurance which local companies need for their CDM/JI projects. However for a
company such as Parhelion, to sell insurance locally would require an international network which
would not economical.
3.3 Dealing with volatility
a. Carbon credit prices
One of the achievements of the Kyoto Protocol and the ETS is to have put a price - albeit subject
to volatility - on GHG emissions.
In a cap and trade system such as the ETS, prices are driven by supply and demand.
Supply is essentially controlled by the EU. In deciding on a cap and allocating allowances, the EU
seeks to meet the international commitments in terms of emissions reductions. However it also has
to prevent its industries from shutting or relocating as a result of the additional costs the ETS
imposes on them. To a lesser extent, supply is also driven by the volume of offsets generated from
CDM and JI projects therefore dependent upon the level of investment in such a field. Each
jurisdiction caps the number of CERs that can be used for annual emissions accounting.
The EU also has an impact on demand since the companies that are subject to the ETS receive
limited allowances and are subject to penalties if they are unable to comply with caps set. Demand
increases as the volume of allowances reduces. Reversely, it increases when companies have been
granted an excessive amount of allowances, as was the case in Phases 1 and 2. Speculation which
carbon markets have attracted just like any other spot market can also contribute to scarcity thus
higher levels of demand.
Market history
EUAs and CERs have been traded for over five years now and the following can be said about the
way prices have fluctuated.
Source: CDC Climat (based on Bluenext and ECX data)

Cedric Wells - MBA ENASS 2009-2011 - Carbon credits and Insurance 88
Spot price represents the price for immediate delivery of EUAs/CERs and forward prices the
current price of EUAs or CERs delivered at a later date.
- Phase 1 of the ETS (2005-2007) has been described as the “learning by doing phase”. 2,52 bn
allowances were traded during that period with peak levels of EUA prices reaching the EUR20-
30/t mark in 2005-2006. Prices then dropped to EUR10/t when first verified emissions reports
published by the EU in April-May 2006 revealed that actual emissions were in fact lower than
expected for Phase 1 and that a group of countries were left with significant amounts of unused
CO2 quotas. The consensus was that emissions projections at the time the reduction targets were
made had been calculated on the basis of insufficient data (in the absence of actual measured
emissions). In addition to the abovementioned EU reports, the global economic collapse in
2007 severely impacted production levels therefore reducing emissions and the demand for
carbon credits. Prices crashed to levels close to EUR0 (which was also bound to happen
because allowances could not be carried forward to Phase 2).
A.D. Ellerman, C. de Perthuis and F.J. Convery125
commented that overall, Phase 1 had had no
restricting effects on EU companies nor did it have any impact on competition as it turned out
to be cheaper to buy allowances than to invest in clean technology. Despite this, GHG
emissions in the EU actually reduced by 2-3% during Phase 1.
- Phase 2 (2008-2012) involves the trading of 2,68 bn allowances. According to CDC Climat,
1,908Mt were allocated as against 2,072 Mt actually emitted (all sectors combined), resulting in
a deficit of 0,387 Mt.
Cash constraints associated with the financial crisis caused a number of companies to sell their
carbon credit surpluses on the market. The demand for carbon also dropped as financial
institutions and private investors turned to safer business. This contributed to EUA prices
dropping to a lowest of EUR8/t in February 2009. Prices then went up again during the second
quarter of 2009 notably as a result of a strong increase in share of forward contracts for delivery
in December 2009. They dropped again after the Copenhagen summit.
2010 has seen prices driven up slightly by companies’ anticipation that they would be short of
EUAs in Phase 3 and that prices would rise as a result. Between January 2010 and January 2011,
the price of EUAs has ranged between EUR13-17, CERs between EUR11-14 and the spread
between EUAs and CERs has increased from EUR2 to EUR3,5.
Source CDC Climat
126
125
Pricing Carbon: The European Union Emissions Trading Scheme, Cambridge University Press, 2010. 126
http://www.cdcclimat.com/IMG/pdf/tendances_carbone_cdc_climat_research_no55_eng_.pdf

Cedric Wells - MBA ENASS 2009-2011 - Carbon credits and Insurance 89
There has always been a gap (Spread) between the price of EUAs and CERs. CERs should quite
normally be cheaper than EUAs because of the limited eligibility of CERs under the ETS. Quality
of CERs also affects the price of CERs downwards127
. The lack of homogeneity between CERs
and varying validating risk can also lead to differences in terms of pricing as between CERs.
Market fundamentals
Economists have determined that since Phase 1 had incepted, carbon credit prices at a macro level
(i.e. irrespective of the quality of a CDM or JI project) had been sensitive to several types of
fundamentals.
The first is a physical fundamental including events such as extreme weather conditions, the
increase in fossil fuel prices, technical progress or the switch to cleaner fuels. An economic
recession (to the extent it affects usual levels of production) will also affect emissions and
therefore spot carbon market prices.
The World Bank noted that the price volatility in Phase 2 had correctly reflected macro-economic
fundamentals (in particular, carbon markets had reacted in the exact same way as other energy
commodities during the recession) and that prices during the same phase had reflected the demand
for carbon assets in line with the levels of emissions cap and the actual level of emissions128
.
Source: World Bank
The second fundamental is informational: surveys, data (e.g. evidence that excessive level of
allowances have been allocated to companies) and rumour.
127
The less risk a CER will bear (all risk, validation risk, registration risk or volume risk) the higher the price. The
involvement of institutions such as Gold Standard, contractual warranties from sellers and the procurement of
insurance will also affect prices positively. 128
State and trends of the Carbon Market 2010, World Bank.
http://siteresources.worldbank.org/INTCARBONFINANCE/Resources/State_and_Trends_of_the_Carbon_Market_20
10_low_res.pdf. Retrieved on 24 February 2011.

Cedric Wells - MBA ENASS 2009-2011 - Carbon credits and Insurance 90
The third is institutional. High levels of allowances will push prices down; low levels will push
them up. Auctioning may push prices higher up than low levels of allowances would. The ability
to bank allowances should sustain prices for a longer period of time. Levels of admissibility of
CERs and ERUs will also affect levels of demand for EUAs. The linking of carbon markets should
make it possible to achieve emissions reductions at a lower cost.
Projections
Although market prices for permits have been relatively stable since mid-2009, there is
considerable uncertainty as to what prices will be post 2013.
Phase 3 (2013-2020) foresees a major change as the auctioning of allowances will become the rule
rather than the exception. The third trading period will also see free allowances decreasing in
number, new sectors entering the scope of the regulation (including aviation). Further changes will
be implemented such as tighter limits on the use of offsets and unlimited banking of permits
between Phases 2 and 3.
With such changes, carbon prices are expected to rise which will probably stimulate demand for
carbon credits. The consensus among market commentators appears to be that the average price of
EUAs will be around or below EUR30/t during Phase 3129
. They foresee some degree of stability
in carbon spot market prices and believe that this will continue in Phase 3 with auctioning actually
strengthening price signals and reducing EUA volatility130
. As for traders, they tend to anticipate
EUR10-EUR25/t as a credible price for EUAs.
The industries are generally less optimistic (or more prudent). They expect carbon credit prices to
escalate due to increased scarcity and to the auctioning system. One however should bear in mind
that this is exactly what was expected for Phases 1 and 2. Quite to the contrary, prices crashed.
Julian Richardson (Parhelion) did not believe that carbon prices could crash again in that way
because allocations are now based on actual emissions measured rather than estimates.
The price of carbon credits and the volatility risk which inevitably stems from uncertainty as to
future supply and demand conditions are central questions for companies (and indeed in turn for
their insurers). They require stronger long-term signals on carbon credit pricing in order to meet
future requirements and purchase appropriate protection.
A business group formed at the January 2005 World Economic Forum called for “clear,
transparent, and consistent price signals” through the “creation of a long-term policy framework”
that would include all major producers of GHG emissions. 150 companies were part of that group
as from December 2007. In May 2009, the Institutional Investors Group on Climate Change,
representing $5.5 trillion in assets, regretted that carbon markets had not provided the “strong,
long-term price signals that are necessary to support large investments in low-carbon solutions”.
Companies are not pleading for a fixed price. Rather, they request reliable assumptions and
variables so that the risk of volatility of carbon credit prices can be properly accounted for in their
investment plans. The governments’ response has been generally supportive. Putting a price on
129
The modelling of the EC Commission predicts that carbon prices will be around EUR20 in 2030: SEC (2010) – 650,
p.30, pp. 33-34. 130
State and trends of the Carbon Market 2010, World Bank.
http://siteresources.worldbank.org/INTCARBONFINANCE/Resources/State_and_Trends_of_the_Carbon_Market_20
10_low_res.pdf. Retrieved on 24 February 2010.

Cedric Wells - MBA ENASS 2009-2011 - Carbon credits and Insurance 91
carbon emissions now appears to be an integral part of climate and energy policies. The 2009 EU
Directive actually introduced an article (29a) that provides for measures in the event that price
evolution does not correspond to changing market fundamentals. In 2010, Christine Lagarde,
French Minister of Economy, publicly committed to set the ground necessary for a sound price as
well as a certain degree of certainty and reduced volatility. The EC, which believes that
EUR30/ton would encourage investments in low-carbon technologies, has also expressed some
sympathy towards the industries’ call however no proposals have as of yet been put forward.
It has been suggested that the price signal might come from insurers based on the premium they
would charge for carbon credit-related risks. Unfortunately, there is no such premium to refer to as
of yet.
b. Moderating volatility
Jean Morch (Arkema) said that investors saw the volatility of CER prices as a great risk. He
stressed the fact that the EC today only allows companies to partially convert their CERs into
EUAs and that this was expected to get worse in Phase 3. He wondered whether CERs might
actually still have any value at all after 2012 considering the uncertainties regarding the regime
that will succeed the current Kyoto Protocol.
There appears to be a general understanding that insurance typically covers costs (stemming from
PD and subsequent BI) whereas risks associated with the fluctuation of prices are a matter for the
financial markets because they cannot be pooled. Jean Fournier (Global Aerospace) took a
different view: he believed that there was nothing to prevent an insurer from covering price
volatility so long as there is fortuity.
Julian Roberts’ (Willis) view was that insurance generically (regardless of carbon) is very poorly
suited to address price risks. Roberts believed however that insurers were broadly obliged to keep
such price volatility on their balance sheets, as appropriate contingent hedging is seldom feasible.
In contrast, financial instruments such as options and futures which are available on traded markets
are far more efficient mechanisms to cover the price risk. As Fournier noted, the financial market
is better option in short term trading provided that there is a financial counterpart, as it arbitrates
risks (this can be done instantaneously thanks to the highly sophisticated financial trading tools
that are available).
In Christoph Möcklingoff’s (Marsh) view, the risks associated with carbon price and the
smoothing of same are dealt with by bank models however those relating to project certification
and the delivery of carbon credits can be handled by insurance.
Julian Richardson (Parhelion) agreed that volatility preventing insurers from offering cover was a
distraction. Indeed, volatility is part of standard business interruption coverage in many lines of
business involving commodities.
By way of an example, a number of very large insurance claims in the mining industry have been
made for loss of sales of ore at a time when market prices for such ore were at their peak.
Typically, lost production is valued on the basis of a commodity’s average price on a market such
as the London Market Exchange (LME) several months (generally three) prior to the date of loss131
.
131
Example of a Commodity Price Cap provision:

Cedric Wells - MBA ENASS 2009-2011 - Carbon credits and Insurance 92
This way an increase of international market prices attributable to the insured’s loss (assuming the
insured’s worldwide market share is sizeable) will not be indemnified. In addition, the very
substantial business losses claimed in the recent years (and in some cases underinsurance
situations) have lead insurers to cap their exposure to the fluctuation of the market indices.
Coverage would not however be unlimited. Roberts said that generally, if at all covered, insurance
provides a “put” option on pre-agreed, fixed prices.
Based on his own experience of a number of BI claims involving commodities, Jason Reeves
(Zelle Hofman) agreed that insurers may sometimes unintentionally cover the volatility of carbon
prices.
The ways insurers can limit their exposure to volatility are multiple.
- It would seem that a maximum loss per ton of CO2 would not in the worst case exceed the
price of the penalties (for which insurance is generally prohibited) which are imposed by the
ETS (currently EUR100/t) because that is the highest price a company can be required to pay
(per ton) for increased costs or loss of credits. Such penalties may of course be higher in Phase
3.
- Most insurance policies set a monetary limit on their exposure (one notable exception is motor
liability insurance in France). In some cases, sub-limits apply for specific risks covered under
the policy.
- Policies can include a provision which states specifically in relation to carbon credits that the
premium will be renegotiated (upwards or downwards) at a policy anniversary date (in case of
multi-year coverage) or in the event spot market prices fluctuate beyond a certain spread or
average during a certain period (typically one year). Same spread should be established based
on a stochastic model accounting for the variables (and their respective average weight overall)
that can affect market prices (see the variables identified by Economists).
Carbon allowances are allocated on a yearly basis. Quite logically, the closer to the year end
(whether the end of a calendar year or that of the cap and trade which is April under the ETS), the
more accurately a company will know whether it will be short or have surplus credits available.
Market prices are therefore likely to rise or drop more sharply towards the end of a year than at the
beginning. This however should not necessarily increase insurers’ risk. It would actually reduce it
if prices drop at year end and this is when an insured loss arises. Also, as will be discussed in the
valuation of loss section, if a BI loss, as is quite typical, lasts several months, indemnities paid out
will be based on the average market value of credits over that same period. That way fluctuation
will be spread over the period.
“This Policy is subject to the following memorandum: for the purpose of calculating any BI loss hereunder any
calculation of the loss of Gross Revenue and/or Turnover, as defined in the Policy Wording, shall be made using the
lesser of the spot price prevailing during the period of such interruption or the commodity price caps as below:
- Copper at wUS$ per lb
- Zinc at xUS$ per lb
- Gold at yUS$ per oz
- Silver at zUS$ per oz”.

Cedric Wells - MBA ENASS 2009-2011 - Carbon credits and Insurance 93
3.4 Contract certainty
Wordings must account for the specificities of carbon credit risks.
This is the message Jason Reeves (Zelle Hofman) publicly raised in respect of conventional PD/BI
policies five years ago when he first stated that appropriate wordings were required to avoid
disputes on potential multi-million $/EUR claims. There has been little reaction from markets
since and Reeves was unaware of any insurer having implemented any specific wordings and/or
underwriting and claims guidelines addressing carbon credit-related risks. Lee Swain and Markus
Heiss (MD&D) confirmed that they had never seen any specific wording addressing carbon credit
related issues in the claims they had handled.
In Reeves’ view, this appears to be due to the lack of carbon transparency, to the lack of
knowledge in the insurance industry and to the fact that most insurers still perceive carbon credits
risks as modest in the overall cover provided for BI and Extra Expense.
Ewan Cresswell (Integra) agreed that if parties intended to include carbon credits in coverage this
should be spelt out clearly in policies. He added that adjusters and experts needed to be aware of
the whole concept of carbon credits and how policies - most of which are currently silent on the
matter - should respond.
The writer’s comments on wordings that are agreed in specific carbon credit non-delivery policies
are limited since only one sample (hereafter Policy “X”, which may not be representative of all)
was made available.
Julian Richardson (Parhelion) advised that specific policies used standard industrial and political
risk language with some adaptations reflecting the features of carbon credit related risks. The main
difficulties he said pertained to the definition of losses and the basis of indemnity (which in most
cases is in the form of an agreed value rather than physical replacement of credits132
).
The comments to follow apply to relatively standard Property Damage and BI policies. Christoph
Möcklingoff (Marsh) confirmed that including CDM/JI projects in a traditional PD/BI cover
required some tweaking of standard wordings, particularly with regards to the valuation of loss.
Delimiting the scope of cover is also key (e.g. is there any supply chain risk and if so, should it be
insured under the supplier’s policy or that of its client?).
a. Including CER cover in conventional PD/BI cover a risk in itself?
At least one traditional policy (hereafter “Policy Y”) has been seen to consider (fortuitous) carbon
credit-related losses as indemnifiable BI losses in circumstances where they affected the profits
expected by a company from a CDM project.
The Policy Y wording contained special sub-limits (EURx per CER) applying to CERs acquired
by two CDM projects. This included an overall monetary sub-limit (per claim and in the
aggregate) as well as a sub-limit per ton (up to EUR15). The maximum indemnifiable period was
12 months (as is standard under conventional BI coverage).
132
Policy “X” provided for indemnity to be paid in cash or in replacement CERs.
Cedric Wells - MBA ENASS 2009-2011 - Carbon credits and Insurance 94
Deductibles are included in most insurance contracts as a means of reducing moral hazard
(precautionary behaviour tends to relax when companies know they have insurance protection).
Specifically in respect of CERs, Policy Y included a 20-business days deductible, which is lower
than the average 30 to 45 days waiting period which BI policies delivered to global corporations
usually contain.
Policy Y also contained two exclusions that specifically referred to CERs. The purpose of the first
was in fact purely technical (as was that of other exclusions in the policy pertaining to various
installations). The second exclusion expressly applied to financial losses relating to the trading of
CERs as a result of negligence from a supplier or customers not within the insured company.
Justin Crick (RGL Forensics) said that the only way an insurer’s exposure to carbon credit related
losses can be limited is by setting a cap on the sum insured. General average/coinsurance clauses
in cases of underinsurance may also reduce an indemnifiable loss but in practice, this is often
excluded by policies written by companies established in developed countries.
The following key provisions appeared in Policy X:
- Failure to deliver is any event not excluded under the policy;
- Cover is subject to successful completion of UNFCCC stages (e.g. no BI claim without the
CDM EB’s green light on project commissioning, etc.);
- The insured must notify to the insurer any material change that may affect the production of
CERs.
One international broker said that he had placed one CAR/EAR policy for a company that had
launched two CDM activities in Asia and South America thanks to the efficient technologies it had
developed. Placing the risk involved educating the insurance markets to the mechanisms of the
Kyoto Protocol. Although at first reluctant to consider the specific features of CDM programs and
the high values at stake (several tens of million EUR exposure), markets (mainly continental) were
eventually happy to follow the lead on the proposed program and wording. The policy is a
standard all risks project coverage which includes indemnity payable in the event of non-delivery
of CERs as a result of a physical damage (e.g. machinery breakdown, natural catastrophes, etc.)
including interdependency effects on the insured units. Political and regulatory risks are not
insured. The insured’s main interest in procuring such cover was to ensure that some (albeit not
100% in view of the capped carbon prices in the policy) certainty as to the expected revenue in the
event of a fortuitous peril occurring. The broker said that the risk manager he had dealt with was
particularly well aware of carbon regulation and its mechanics which made it easy for him to
determine the scope of insurance so requested. The policy was the subject of one claim to which
the wording had responded adequately.
In Jonathan Young’s (Munich Re) view, insurers do not realize that certain carbon credit risks are
covered under conventional PD/BI cover and wordings that he has seen are not adapted to such
risks. Young also said that on one notable occasion, even when a broker and insurer had attempted
to clarify cover for carbon credits under a standard PD/BI cover, the result had been worse than
doing nothing, because of a lack of knowledge of even the basic terminology and mechanics of the
carbon market. This is why Munich Re’s approach has been to separate out the carbon element
from standard PD/BI cover and to offer more appropriate, broader cover.

Cedric Wells - MBA ENASS 2009-2011 - Carbon credits and Insurance 95
b. Valuation of loss
What wordings should state
Valuation of loss is a very sensitive aspect of carbon credit coverage. There are many ways in
which a loss can be adjusted and many variables to be considered. Wordings must address this
situation in identifying the correct way to value a loss, i.e. by providing answers to the following
questions:
Which variables should be used in calculating a loss:
- expected, actual and/or saved emissions?
- average allowances over a specified period of time?
- spot market carbon price?
Which price should be used to calculate the value of lost carbon credits?
- pre-agreed price/carbon credit forward sales prices?
- spot market price?
At which date should losses be valued?
- at a particular date (date of loss, date of expiry of a contract, date of purchase/sale
of additional carbon credits, when the insured loss is settled, when a production
interruption starts, etc.)?
- based on a (daily or monthly) average price over a specified period of time?
The Policy Y wording specifically provided that the relevant price of a ton of CO2 should be the
price at which same ton of CO2 had been sold forward or, by default, the average spot price during
the entire interruption period (subject to applicable sub-limits).
In Policy X, losses should be valued on the following basis:
- if CERs are paid on delivery (i.e. no cash actually paid out yet): insurer will reimburse the
difference between the CER spot price at the time of the failure delivery (assuming it is higher
than the contract price) and the contractually agreed CER price multiplied by the overall
number of undelivered CERs;
- if CERs have been paid upfront: insurer will reimburse an agreed amount per undelivered CER
(which may be a fixed EUR amount, a percentage of the CER spot price or any other agreed
formula).
Justin Crick (RGL Forensics) said that in practice, the value of saved carbon credits and additional
carbon credits required as a result of a loss was often calculated on the basis of the weighted
average carbon market price across the loss period. However, consideration needs to be given to
how each individual business trades carbon.
The questions which MD&D (forensic experts) will typically ask when adjusting a carbon credit
claim include the following: what does the company’s business model factor in terms of carbon? Is
it supported by historical data? What quantity of physical emissions has actually been saved as a
result of the loss? In addition, clear documentary evidence such as invoices for the purchase of
additional allowances will be requested to support claims.
Justin Crick, Lee Swain and Markus Heiss (MD&D) confirmed that there were no universal
accounting rules governing carbon credits. The IASB IFRIC 3 rules adopted in 2003 were

Cedric Wells - MBA ENASS 2009-2011 - Carbon credits and Insurance 96
eventually deemed inappropriate due to many dissensions and therefore retracted. One key
problem is that companies receive allowances at no cost (nil reported in balance sheets) and that
sales price when they are traded must be booked. In the circumstances, companies generally record
the sale as a cost of sale at the end of the relevant accounting year.
Need for accounting harmonization
The absence of a legal definition and classification of carbon credits raises serious accounting
issues for the assessment of insurance losses. A number of companies have called for a standard
framework to be incorporated in investment-related information and to comply with international
accounting standards.
Alan Taylor (Charles Taylor Adjusting) noted that in practice, carbon credits were treated as
variable costs and therefore credits should be used to mitigate a loss.
The IASB rules appear to treat (free) allowances as a governmental grant recorded as intangible
assets at fair value and amortised during a yearly period (with a corresponding entry as deferred
credit).
In a market presentation in 2005133
, Erik Saether, former head of Vattenfall Trading Services,
explained that his company booked allowances (whether granted or purchased) as inventories in its
balance sheet. If such allowances were received or purchased at a value lower than fair value, the
inventory asset would be reported at fair value and as a deferred income. A governmental grant
would be carried over the year as income and that both a cost and a liability would be reported to
reflect the company’s obligation to provide rights to compensate for its CO2 emissions.
Under French law134
, allowances granted and carbon offsets must be booked as intangible assets
(rather than stock or financial instruments). Allowances must be valued at the date they are
received based on spot prices. They can be booked as a governmental grant (since allowances must
eventually be surrended) or as deferred revenue in the liabilities part of a balance sheet. By
contrast with the above companies, trading companies must book carbon credits as stock or as
securities.
Swain and Heiss said that valuating carbon credit-related losses had been relatively simple in the
claims they had adjusted so far. Calculations are primarily made based on market value during the
outage period. Swain and Heiss agreed however that matters could get complex in other
circumstances. Swain gave one example of a claim made at a time when carbon credit spot prices
were at their highest but resolved much later when prices had dropped to nearly zero. Absent
international standards, parties must turn to national laws to find answers (if there are any clear
ones). Swain added that free allowances were a key accounting issue because they created a lot of
potential variations to profitability. This problem however could be resolved with auctioning
becoming the rule by default (however only up to 60% of allowances only) in phase 3 of the ETS
(buying allowances would take away at least some of the uncertainty).
Specifically with regards to forestry (which is not covered by the ETS), Phil Cottle (ForestRe) said
that one difficulty from an insurance standpoint had to do with the valuation of a “forest” carbon
loss. Indeed, when a tree dies for any reason, it releases carbon over a certain period of time (say 5
years within the California Air Resources protocol). If insurance for the moment assumes that the
133
http://www.vattenfall.com/en/file/Erik_Saether_8458322.pdf slide 21. Retrieved on 29 December 2010. 134
Avis n°2004-C adopté par le Comité d’urgence du Conseil National de la Comptabilité, 23 March 2004.
Cedric Wells - MBA ENASS 2009-2011 - Carbon credits and Insurance 97
tree releases 100% carbon on the date of loss, an insured might be compensated in effect in
advance of the actual loss of carbon under the protocol which should be attractive in terms of cash
flow, and for the management of the claim is administratively easier for insurers (compared with
say 5 annual loss payments).
c. Due diligence and duty to mitigate losses
A fundamental principle in insurance law is that an insured should at all times act as a prudent
uninsured. This is otherwise known as acting in due diligence and can be set out expressly in a
policy wording or considered as an implied term.
To act diligently requires that an insured does and concurs in doing all things reasonably practical
to avoid or diminish any loss of or damage to an insured property.
Ewan Cresswell (Integra) noted that carbon credits were assets of growing financial importance to
companies such that a number of them actually dedicated personnel on that front. He wondered
whether managers at plant level (as opposed to corporate) were aware of the implications of
carbon regulation. Local managers in the event of a loss could innocently be guided strictly by
operational considerations ignoring those pertaining to carbon regulation.
A question arises as to what an insured might be actually expected to do in the event of a loss
involving carbon credits.
A Resumption of Operations clause in a business interruption cover may require that the insured
makes use, inter alia, of other property (which might include spare credits) at the location(s)
owned by the insured to reduce the claim. Such reduction should then be taken into account in
arriving at the amount of loss.
As was discussed, many companies hedge their exposure to commodities costs (including carbon
credits) through financial instruments. Companies have also in large part been able to save
allowances from Phases 1 and 2. They may also be losing credits on the affected plant but still
have surplus allowances at other installations such that overall the company would not have to
purchase credits as a result of the loss.
In such circumstances, should an insured first have to use any spare credits (including those that it
was granted at no cost) and/or financial instruments in order to mitigate its loss prior to making an
insurance claim? If so, should corresponding values be deducted from an insurance claim? If for
example an insured company owns calls (options) that can be exercised at a price lower than the
price which an insurer would have to pay to make up for the company’s lost credits, does he have
a duty to exercise the calls in order to reduce the insurer’s loss? If this is the case, the insured
would lose the benefit of exercising its options at a later (and perhaps more favourable) moment in
time.
Jason Reeves’ (Zelle Hofman) view on this was straight forward: there is no legal basis to compel
mitigation though it might be done in practice. Without adequate statutory provisions or
accounting standards it is unclear how carbon credits should be treated. Reeves’ view was that
carbon credits may be considered assets that belong to a company. As such, it is difficult to compel
an insured to sell any of its credits, albeit granted at no cost (as is the case in Phase 2), in order to

Cedric Wells - MBA ENASS 2009-2011 - Carbon credits and Insurance 98
mitigate a loss. Reeves’s conclusion was that a clear stipulation in insurance contracts would avoid
parties disagreeing on a matter with such potential value. In his view, it should be abundantly clear
to insurers when rating a policy that unused carbon credits will or will not constitute a saving.
Reeves warned that there were potential negative commercial consequences for compelling
mitigation in a loss scenario. Indeed, policyholders may want less insurance and if the profit from
freely allocated credits was included in the rating then the cost of carbon comes in and goes out of
a loss adjustment i.e. there is no net effect.
Justin Crick (RGL) agreed that it would be unfair for an insurer to request that the insured
exercises its options (assuming this would be cheaper than to indemnify the company for the
purchase of quotas at actual market prices) for any other reason (e.g. increased demand meaning
more production thus more pollution). In other words, the insured would not be put back in the
position it would have been in but for the loss. An exception to this would be if the insurer could
establish that the options in question had been purchased specifically to mitigate a loss insured
under the policy.
Lee Swain and Markus Heiss (MD&D) agreed that mitigation of loss was another source of
complexity. In principle, they expected that the operating entities of a company and a trading
department would be two separate legal entities. As such, by way of an example, an insured having
suffered an operational loss should not be expected to exercise calls which its trading department
would have purchased for entirely different reasons with a view to reduce the amount of loss. In
practise however many other items have to be factored into and there is no certainty as to the exact
scope of an insured’s duty to mitigate a loss.
d. Salvage stemming from “outage credits” to be set-off claims
The cessation or reduction of production can lead to savings in fuel consumption, operations and
maintenance. It would cut a company’s emissions as a consequence, as would the reinstatement (or
reconstruction) of cleaner production units. Such type of salvage should normally, where legally
permitted, reduce a loss accordingly.
The 2003 EU Directive states that no free allocation will be given to installations that have ceased
their operations except if their operators can demonstrate that they will resume production within a
reasonable and specified time135
. The legislation does not clarify however whether in the event of a
temporary cessation of production resulting from a fortuitous physical damage an operator would
continue to receive allowances (or have to purchase credits in order to comply with despite the
drop in emissions).
In practice, savings have already been taken by insurers for the value of unused carbon credits that
companies have been able to save or trade. Amounts at stake in several industrial losses that
occurred in between 2006 and 2009 ranged from EUR25,000 to over EUR7,000,000 representing
from as little as 0,1-0,5% to as much as 5-13% of the overall claim.
Justin Crick (RGL Forensics), Lee Swain and Markus Heiss (MD&D) attested that most of the
(few) claims involving carbon credits that they had adjusted had resulted in savings rather than
additional costs to insured companies. Crick said that companies did not instinctively think of
135
Article 19 of the 2009 EU Directive.
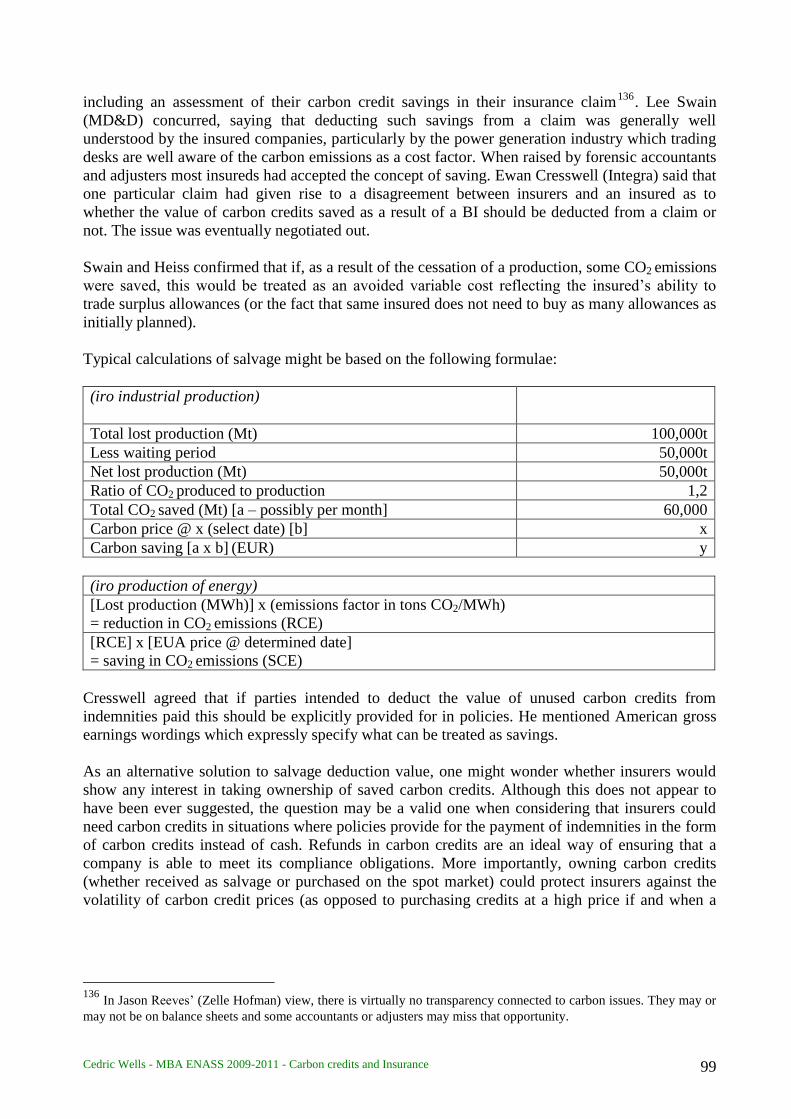
Cedric Wells - MBA ENASS 2009-2011 - Carbon credits and Insurance 99
including an assessment of their carbon credit savings in their insurance claim136
. Lee Swain
(MD&D) concurred, saying that deducting such savings from a claim was generally well
understood by the insured companies, particularly by the power generation industry which trading
desks are well aware of the carbon emissions as a cost factor. When raised by forensic accountants
and adjusters most insureds had accepted the concept of saving. Ewan Cresswell (Integra) said that
one particular claim had given rise to a disagreement between insurers and an insured as to
whether the value of carbon credits saved as a result of a BI should be deducted from a claim or
not. The issue was eventually negotiated out.
Swain and Heiss confirmed that if, as a result of the cessation of a production, some CO2 emissions
were saved, this would be treated as an avoided variable cost reflecting the insured’s ability to
trade surplus allowances (or the fact that same insured does not need to buy as many allowances as
initially planned).
Typical calculations of salvage might be based on the following formulae:
(iro industrial production)
Total lost production (Mt) 100,000t
Less waiting period 50,000t
Net lost production (Mt) 50,000t
Ratio of CO2 produced to production 1,2
Total CO2 saved (Mt) [a – possibly per month] 60,000
Carbon price @ x (select date) [b] x
Carbon saving [a x b] (EUR) y
(iro production of energy)
[Lost production (MWh)] x (emissions factor in tons CO2/MWh)
= reduction in CO2 emissions (RCE)
[RCE] x [EUA price @ determined date]
= saving in CO2 emissions (SCE)
Cresswell agreed that if parties intended to deduct the value of unused carbon credits from
indemnities paid this should be explicitly provided for in policies. He mentioned American gross
earnings wordings which expressly specify what can be treated as savings.
As an alternative solution to salvage deduction value, one might wonder whether insurers would
show any interest in taking ownership of saved carbon credits. Although this does not appear to
have been ever suggested, the question may be a valid one when considering that insurers could
need carbon credits in situations where policies provide for the payment of indemnities in the form
of carbon credits instead of cash. Refunds in carbon credits are an ideal way of ensuring that a
company is able to meet its compliance obligations. More importantly, owning carbon credits
(whether received as salvage or purchased on the spot market) could protect insurers against the
volatility of carbon credit prices (as opposed to purchasing credits at a high price if and when a
136
In Jason Reeves’ (Zelle Hofman) view, there is virtually no transparency connected to carbon issues. They may or
may not be on balance sheets and some accountants or adjusters may miss that opportunity.

Cedric Wells - MBA ENASS 2009-2011 - Carbon credits and Insurance 100
loss occurs). However there is no visibility today as to the potential needs of assureds137
therefore
investing in carbon credits may be premature and a risky bet.
Another open question is whether insurers should be entitled to some form of salvage in case of
betterment. One could see a failed production unit being replaced by a greener one - i.e. emitting
less GHGs – which would result in surplus credits to the insured (or less credits to buy) possibly
for several years. Article 7 of the 2009 EU Directive provides that an operator must inform the
competent authority of any planned changes to the functioning of its installation or any significant
reduction of its capacity. The authority will in such case update the permit and possibly affect the
level of allowances the insured would enjoy post-loss. If this were the case, it would not appear to
allocate any salvage or discount value to betterment.
137
One interviewee potentially interested non-delivery insurance did mention that an issue might arise if indemnities
could not be paid out in the form of carbon credits (which will be scarce) rather than cash.

Cedric Wells - MBA ENASS 2009-2011 - Carbon credits and Insurance 101
CONCLUSION
The success of carbon credit insurance will very much depend on the way regulation evolves. This
is a great source of concern:
- The Kyoto Protocol is due to expire in 2012 and there is currently no certainty that its
binding mechanisms will survive beyond that date;
- In the EU, the Phase 3 rules of the ETS will impose further emissions reduction on
companies and tighter regulation (auctioning, more restrictions on offsets).
There are some positive signs however:
- The EC has made it very clear that the binding EU emissions reductions were on target and
that they should be met by applying the Kyoto Protocol mechanisms. In addition to
fighting climate change, the EU sees a long-term comparative advantage for EU industries
in terms of energy efficiency and security.
- In further limiting the admissibility of CDM/JI projects and taking steps to eliminate fraud,
the EC seeks to reinforce its credibility and that of its policy
- Carbon markets already have a global reach: new cap and trade schemes, albeit not all
Kyoto Protocol-based and largely due to regional initiatives, are emerging throughout the
world; some of them extend to promising sectors such as forestry
- The economic recovery should see investments in CDM/JI projects increase
- There has been limited volatility on the carbon market prices since mid-2009.
Companies subject to the ETS generally have a good understanding of the legal and financial
implications of carbon regulation for their businesses. They are inclined to retain risks associated
with the scheme (in the same way as for other production costs) and in most cases have not even
thought of insurance as a risk transfer solution. The only exception to this is coverage for
Increased Cost of Working typically provided by conventional Business Interruption policies -
which insurers may wish to reconsider if massive claims for costs of purchasing additional credits
(to meet their compliance obligations) start flowing in.
Demand for specific carbon credit non-delivery insurance is embryonic. It will probably not rise
significantly in the very next years and will have to compete with conventional policies allowing
for the specific inclusion of CER/ERU coverage. Only a sharp increase in carbon prices or a very
large uninsured loss might play in favour of higher interest in insurance.
Due to the recession and investors not paying for carbon offsets upfront, the insurance market is
currently more on the sellers’ side. As investments on carbon markets resume, the main targets on
the buyers’ side would appear to be parties interested in procuring catastrophic risk protection (in
excess of a relatively high of self-insurance in view of internal pooling of risks) such as (a)
captives of global corporations and (b) aggregators with large portfolios of CDM/JI projects.

Cedric Wells - MBA ENASS 2009-2011 - Carbon credits and Insurance 102
Carbon insurance will remain a niche market and sales limited for some time. Although
Parhelion’s recent success in signing up capacity from the Lloyd’s may suggest a growing interest
in the carbon business, markets are still very much on stand-by and rather looking into other new
products such as solar, wind and CCS technologies.
Insurers have yet to prove to their clients why they should transfer risks that they currently retain
and why insurance is more attractive than hedging solutions on carbon markets.
The main challenge however is that when they are asked to provide comprehensive insurance,
most insurers will not cover regulatory risks by lack of reliable actuarial data, particularly in a
context where public policy is so heavily involved and subject to change. Appetite could grow for
such risks if the regulatory entities provided more clarity and more foreseeability with regards to
compliance and additionality requirements.
So, when will insurers and their clients meet?
Guy Lallour’s (XL) view was that the success of specific carbon credit insurance would probably
depend on three key factors. Firstly, demand for such cover must be high. Secondly, there must be
sufficient market insurance capacity available to cover amounts at stake. Thirdly, clients must
accept to be charged a premium reflecting the cost of insurers “discovering” such risks i.e. with no
statistics.
Contract certainty is a paramount issue that cannot wait. Poor wordings will inevitably cause
disputes between contracting parties. Although parties appear to be keen to include coverage
pertaining to carbon offsets within conventional industrial risks policies, these should ideally be
the subject of a separate policy (or at the very least a separate section in the contract).
Thèse soutenue en mars 2011
pour l’obtention du MBA
Manager d’entreprise
d’assurances
Sous la direction de :Grégory SOUDAN
Président du Jury : François EWALD
Une école est un lieu de production et de diffusion de connaissances.
L’Ecole nationale d’assurances s’organise pour répondre le mieux possible à cette mission en direction de ses élèves d’abord, mais aussi de la profession de l’assurance et de ses partenaires :
• les « séminaires innovation » animés par les auditeurs du Centre des Hautes Etudes d’Assurance (CHEA), permettent aux professionnels de suivre les grandes innovations en assurance telles qu’on peut les observer à l’étranger ;
• les « dialogues de l’Enass » éclairent l’actualité par le débat avec une personnalité remarquable ;
• « les travaux de l’Enass », que nous lançons aujourd’hui, sont destinés à faire bénéficier la profession des travaux menés au sein de l’Enass par ses professeurs et ses élèves, à tous les niveaux, dans la mesure où les jurys qui les ont évalués ont noté leur qualité et leur originalité. Ces travaux vous seront adressés par Internet, certains d’entre eux pouvant faire l’objet d’un tirage sur papier ou même, être édités.
Nous souhaitons que toutes ces initiatives vous soient profitables.
François Ewald Directeur de l’Ecole nationale d’assurances