Carbon Creation in the World of Global Warming Abatement
29
Carbon Creation in the World of Global Warming Abatement Ed Heslop, CEO Environmental Credit Corp. for NYSERDA, March 29 2006
Transcript of Carbon Creation in the World of Global Warming Abatement

Carbon Creation in the World of Global WarmingAbatement
Ed Heslop, CEOEnvironmental Credit Corp.
for
NYSERDA, March 29 2006

2
OutlineOutline
• Environmental Credit Corp.– Who we are, What we do
• Background on Global Warming• “Cap and trade” Regulations
– Overview, Chicago Climate Exchange• Carbon Credits
– What are carbon credits?– Markets for carbon credits
• ECC Carbon Credit Programs– Examples, case studies
• Mechanics of Trading• Economic/Policy Considerations

3
Environmental Credit Corp.Environmental Credit Corp.
• Environmental Credit Corp. is a leading supplier of high quality environmental credits to emerging global financial markets.
• We are establishing a large and reliable source of carbon credits through cost-effective, long-term projects that reduce greenhouse gases.
• By creating economic value from environmental benefits, we are demonstrating our commitment to a sustainable balance between profitability and environmental stewardship - for us, our partners, our world.

4
ECC Carbon Credit ProgramECC Carbon Credit Program
Greenhouse GasEmission Reductions
ECC Carbon Credit Program• Eligibility Assessment • Protocol Development• Monitoring• Reporting• Verification• Registration
Carbon Credits(certified, tradable, $$)
Chicago ClimateExchange, EPA, state or UN (Kyoto) Protocols
Achieved viaqualifying GHGemission reduction projects
Trade, bank, orsell through CCX,ECX, or direct

5
Global WarmingGlobal Warming
• Anthropogenic emissions of carbon dioxide
• Historical trends in global temperatures

6
Greenhouse GasesGreenhouse Gases
• Carbon Dioxide (CO2)• Methane (CH4)• Nitrous Oxide (N2O)• Sulfur Hexafluoride (SF6)• Perfluorocarbons (PFCs)• Hydrofluorocarbons (HFCs)
• 6.9 billion metric tons CO2e total• 545 million metric tons from CH4• ~40 million metric tons from
manure management alone

7
““Cap and TradeCap and Trade”” RegulationsRegulations
• Cap-and-trade regulations employ market forces to efficiently and cost-effectively reach emission reduction goals
1. Regulated Emissions• Regulated Sectors (“Large Emitters”)
– Energy, Manufacturing, Transportation• Emission Allowances (“cap”)
– Established “baseline” emissions– Scheduled reductions
2. Trading• Allowances can be purchased and used for compliance• Surplus allowances (credits) occur when reduction goals are surpassed
3. Emission “Offsets”• Tradable credits for out-of-sector emission reductions• Less expensive way of achieving early stage reduction goals• Real, quantified, verified, certified emission reductions

8
Cap and Trade Cap and Trade –– Chicago Climate ExchangeChicago Climate Exchange
• Pilot Phase, 2003-2006: Reduce emissions to 4% below 1998-2001 baseline
• Phase II, 2007-2010: Additional reductions to 6% below baseline by 2010
• Chicago Climate Exchange® is a voluntary, legally binding pilot greenhouse gas reduction and trading program for emission sources and offset projects in North America and offset projects in Brazil.
• Includes major direct emissions (all GHGs); sources small sources (e.g. fleets) and electricity purchases can be opted-in
• Annual true-up and verification
90
92
94
96
98
100
1998-2001
2003 2004 2005 2006 2007 2008 2009 2010
CCX Emission Reduction Schedule
Phase I
Phase II

9
CCX MembershipCCX MembershipAerospace and EquipmentRolls-RoyceAutomotiveFord Motor CompanyBeverage ManufacturingNew Belgium Brewing CompanyChemicalsDow CorningDupontElectric Power GenerationAmerican Electric PowerCentral Vermont Public ServiceGreen Mountain PowerManitoba HydroTECO Energy, Inc.ElectronicsMotorola, Inc.Environmental ServicesWaste Management, Inc.
Food ProcessingPremium Standard FarmsForest Products CompaniesAbitibi-Consolidated Aracruz Celulose S.A.International PaperKlabin S.A.MeadWestvaco Corp.Stora Enso North AmericaTemple-Inland Inc Information TechnologyIBMManufacturingBayer CorporationInterface, Inc.Ozinga Bros., Inc.MunicipalitiesCity of BerkeleyCity of BoulderCity of ChicagoCity of OaklandCity of Portland (2006)
PharmaceuticalsBaxter International, Inc. Private UniversityTufts UniversityPublic UniversityThe University of IowaThe University of MinnesotaThe University of OklahomaRecreationAspen Skiing CompanySemiconductorsFreescale SemiconductorST MicroelectronicsSteelRoanoke Electric Steel Corp.TransportationAmtrakSan Joaquin Regional Rail Commission

10
What are carbon credits?What are carbon credits?
• Certified reductions in greenhouse gas emissions– Real, quantified, verified, certified emission reductions– Expressed as metric tons of CO2 equivalents
• “Cap and trade” framework– Emissions reductions goals (“cap”)– Credits allow overall goals to be reached efficiently (“trade”)
• Regulations requiring emissions reductions– Kyoto Protocol– McCain/Lieberman, Hagel, Bush Administration approach– California Climate Action Registry, Western Governor’s Initiative, RGGI
(Northeastern states)– Voluntary regulatory programs: Chicago Climate Exchange, EPA
Climate Leaders

11
How are carbon credits issued?How are carbon credits issued?
• United Nations Framework (Kyoto)• Canadian scheme• Chicago Climate Exchange• State/private programs
• ALL require a Specific Project Orientation– Project delineation– Protocol development– Validation/Registration– Monitoring– Verification/Certification– Credit issuance

12
Market SummaryMarket Summary
• Global market for carbon emission reductions (credits)– 2003: $125 million (37 million tons CO2e)1
– 2004: $500 million (>100 million tons CO2e)1
– 2005: >$5 billion (twice the expected forecast in Feb, 2005)2
– 2010: >$44 billion (not including US)2
1 Carbon Market Analyst. October 14, 20042 Point Carbon, Feb 16, 2005

13
Market SummaryMarket Summary
• US market for carbon credits– $15–30 billion by 20121
1 Burtraw et al. 2002. Effect on Asset Values on Allocation of CO2 Emission Allowances. Resources for the Future Discussion Paper 02-15

14
Price forecasts for US carbon creditsPrice forecasts for US carbon credits
Figure 1. Projected price curves for US carbon credits ($US per metric ton).
$0
$5
$10
$15
$20
$25
$30
$35
2004 2006 2008 2010 2012 2014 2016
hi
low
med
$0
$5
$10
$15
$20
$25
$30
$35
2004 2006 2008 2010 2012 2014 2016
hi
low
med
Sources: Carbon Finance, August 2004; EIA/DOE 2004. Analysis of S. 1844, the Clear Skies Act of 2003; S. 843, the Clean Air Planning Act of 2003; and S. 366, the Clean Power Act of 2003. Energy Information Administration, USDOE, SR/OIAF/2004-05, May 2004; EIA/DOE 2005. Impacts of Modeled Recommendations of the National Commission on Energy Policy. Energy Information Administration, USDOE, SR/OIAF/2005-02, April 2005; AEP 2004. An assessment of AEP’s actions to mitigate the economic impacts of emissions policies. American Electric Power, August 31 2004

15
ECC Program: Agricultural Methane CaptureECC Program: Agricultural Methane Capture
Who is eligibile?• Farms with anaerobic digesters placed into service after January 1, 1999.• Facilities not required by law to control GHG emissions from manure.• Facilities that have not already committed or sold rights to project emission
reductions to any other entity.
Annual revenue potential• Carbon credit potential = ~5 credits per animal unit (~7 per milk cow)• Typical farm size = 1000 animal units (~5,000 credits)• Est. value of carbon credits = $1 - $2+/credit• Total credit value = $5,000 - $10,000+ per year• Considerably higher potential in the event of a market upswing

16
ECC Program: Renewable Energy ProductionECC Program: Renewable Energy Production
Who is eligibile?• Generators of electricity (and thermal energy) from renewable sources
(hydro, wind, solar, biomass)• Placed into service after January 1, 2005• CCX membership requirement for eligible large emitters• Facilities that have not already committed or sold rights to project emission
reductions to any other entity
Annual revenue potential• Carbon credit potential = 0.4 credits per MWh (or thermal equiv.)• Typical project size = 1 MW (8,760 MWh), ~3,500 credits/year• Est. value of carbon credits = $1 - $2+/credit• Total credit value = $3,500 - $7,000+ per year• Considerably higher potential in the event of a market upswing

17
Carbon Credits vs. Carbon Credits vs. RECsRECs
RECs Carbon CreditsFrameworks State regulations CCX, non-profits
Environmental attributes
Broadly inclusive, qualitative Discrete, quantitative
Bankable? no? yes
Current value Very low to very high Modest, increasing
Annual “vintages” yes yes
Markets State/regional, spotty, inconsistent
Developing national, international markets
Market drivers State/Federal RPS (regulation)
Global financial activity, regulation
18
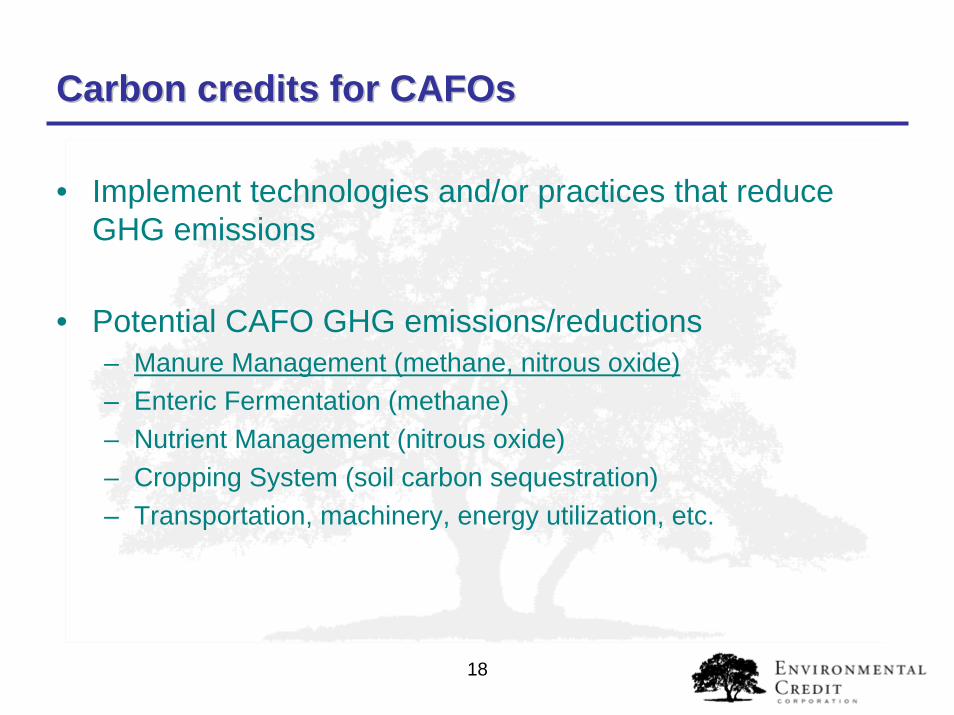
Carbon credits for Carbon credits for CAFOsCAFOs
• Implement technologies and/or practices that reduce GHG emissions
• Potential CAFO GHG emissions/reductions– Manure Management (methane, nitrous oxide)– Enteric Fermentation (methane)– Nutrient Management (nitrous oxide)– Cropping System (soil carbon sequestration)– Transportation, machinery, energy utilization, etc.

19
OpenOpen--air manure lagoons (air manure lagoons (““baseline scenariobaseline scenario””))
VOC, NH3, H2S, N2O, CO2, CH4
anaerobic decomposition(bacteria)
Odor Greenhouse gasesDairy/hog barn
Lagoon
Liquid manure
Air Quality Concerns:• Odor• Ammonia• Greenhouse gas emissions

20
Covered manure lagoons (emission reductions)Covered manure lagoons (emission reductions)
CO2
anaerobic digestion
Dairy/hog barn
Lagoon
Liquid manureBiogas (CH4)
Generator/flare
Result:• Reduced odor• Reduced greenhouse gases
Air-tight membrane cover
CH4
CH4
CH4
Electricity

21
New York Credits New York Credits –– ItIt’’s Happening Heres Happening Here
• Pioneer• Connie Patterson 1st NY registered and verified through
CCX• ECC’s Million Credit• POOL OPTION

22
Case Study Case Study –– Vander Haak Dairy (Lynden, WA)Vander Haak Dairy (Lynden, WA)
• Dairy manure from three neighboring dairies (trucked and piped)
• Plug flow anaerobic digester (1,500 cow capacity)• On-site electrical generation (350kW), waste heat for
AD, buildings, drying digester solids• ~10,000 credits annually

23

24 Vander Haak Dairy (Lynden, WA)Vander Haak Dairy (Lynden, WA)

25
Case Study Case Study –– Inland Empire Utilities AgencyInland Empire Utilities Agency
• Dairy manure from Chino region• 2 anaerobic digesters (6,000+ cow capacity)• Biogas is piped to desalting facility for renewable energy
generation• ~20,000 - 25,000 carbon credits annually

26

27
Mechanics of TradingMechanics of Trading
• CCX Registry
• CCX Trading Floor
28
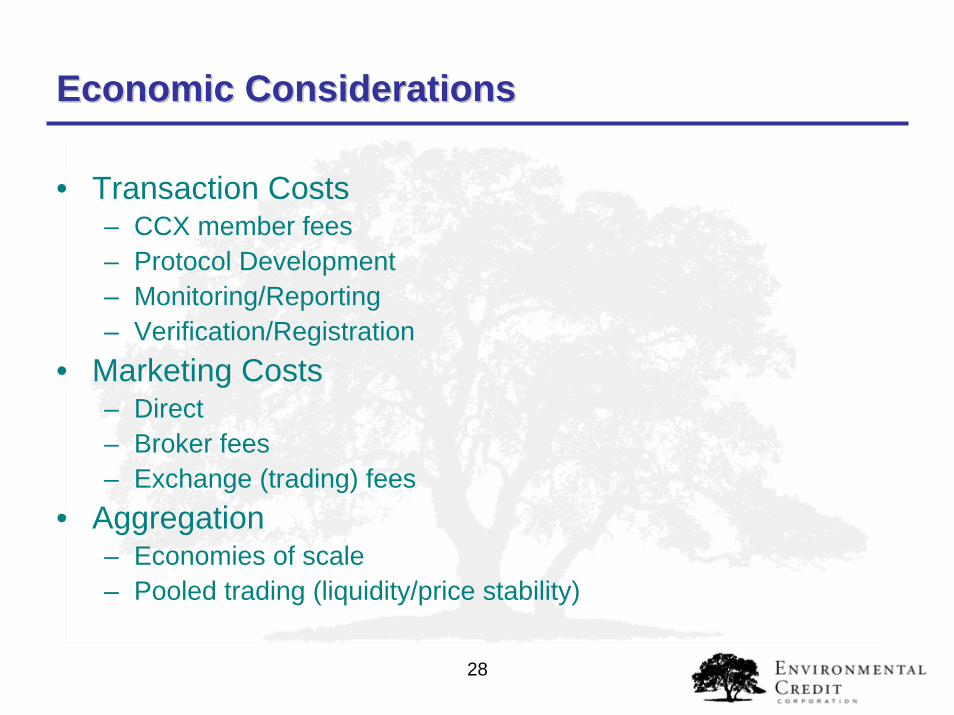
Economic ConsiderationsEconomic Considerations
• Transaction Costs– CCX member fees– Protocol Development– Monitoring/Reporting– Verification/Registration
• Marketing Costs– Direct– Broker fees– Exchange (trading) fees
• Aggregation– Economies of scale– Pooled trading (liquidity/price stability)

29
Policy ConsiderationsPolicy Considerations
• GHG regulations are inevitable– Added cost of compliance?, or…– Provide significant incentives for projects with multiple
environmental benefits?
• Regulatory overlap/confusion– There are no credits without voluntary adoption– Discrete, well defined attributes avoid “bundle wars”
• View environmental benefits as salable by-products– Promote financial integration (regional, national, global)– Encourage economic opportunity (market forces)
• Early action should be rewarded