
Carbon Capture Approaches for Natural Gas Combined … - C...carbon capture and sequestration...
130
Carbon Capture Approaches for Natural Gas Combined Cycle Systems December 20, 2010 Revision 2 DOE/NETL-2011/1470
Transcript of Carbon Capture Approaches for Natural Gas Combined … - C...carbon capture and sequestration...
Carbon Capture Approaches for Natural Gas Combined Cycle Systems December 20, 2010 Revision 2
DOE/NETL-2011/1470

Disclaimer This report was prepared as an account of work sponsored by an agency of the United States Government. Neither the United States Government nor any agency thereof, nor any of their employees, makes any warranty, express or implied, or assumes any legal liability or responsibility for the accuracy, completeness, or usefulness of any information, apparatus, product, or process disclosed, or represents that its use would not infringe privately owned rights. Reference therein to any specific commercial product, process, or service by trade name, trademark, manufacturer, or otherwise does not necessarily constitute or imply its endorsement, recommendation, or favoring by the United States Government or any agency thereof. The views and opinions of authors expressed therein do not necessarily state or reflect those of the United States Government or any agency thereof.

CARBON CAPTURE AND SEQUESTRATION
APPROACHES FOR NATURAL GAS COMBINED CYCLE SYSTEMS
DOE/NETL-2011/1470
FINAL REPORT December 20, 2010
NETL Contact: Walter Shelton
Office of Program Planning & Analysis, Performance Division
National Energy Technology Laboratory www.netl.doe.gov

This page intentionally left blank

Carbon Capture and Sequestration Approaches for NGCC Systems, 12/20/10
I 12/20/2010
Table of Contents TABLE OF CONTENTS .............................................................................................................. I LIST OF EXHIBITS................................................................................................................... III PREPARED BY ............................................................................................................................ V ACKNOWLEDGMENTS .......................................................................................................... VI LIST OF ACRONYMS AND ABBREVIATIONS .................................................................VII EXECUTIVE SUMMARY ...........................................................................................................1
PERFORMANCE ..............................................................................................................................5 ENERGY EFFICIENCY ..................................................................................................................5 WATER USE................................................................................................................................6
COST RESULTS ..............................................................................................................................8 TOTAL OVERNIGHT COST ............................................................................................................8 COST OF ELECTRICITY ..............................................................................................................11 COST OF CO2 AVOIDED ............................................................................................................14
1. INTRODUCTION............................................................................................................17 2. GENERAL EVALUATION BASIS ...............................................................................19
2.1 SITE CHARACTERISTICS ................................................................................................19 2.2 NATURAL GAS CHARACTERISTICS ...............................................................................20
3. NATURAL GAS COMBINED CYCLE CASE PERFORMANCE RESULTS .........21 3.1 NGCC CASES .................................................................................................................21
3.1.1 CASE REF1-NGCC REFERENCE CASE WITHOUT CO2 CAPTURE ....................................21 3.1.2 CASE REF2–NGCC REFERENCE CASE WITH CO2 CAPTURE ..........................................26
3.2 CASE 1-POST-COMBUSTION FLUE GAS RECYCLE AND AMINE ABSORPTION CASES .......34 3.3 CASE 2-PRE-COMBUSTION AUTO-THERMAL REFORMING WITH AMINE ABSORPTION CO2
SEPARATION ...................................................................................................................46 3.4 CASE 3-PRE-COMBUSTION PARTIAL OXIDATION WITH AMINE ABSORPTION CO2
SEPARATION ...................................................................................................................55 3.5 CASE 4 OXY-COMBUSTION WITH CO2 RECYCLE .............................................................64 3.6 CASE 5- OXY-COMBUSTION TURBINE WITH WATER/STEAM RECYCLE ...........................70
4. COST RESULTS .............................................................................................................79 4.1 EQUIPMENT CAPITAL COSTING .......................................................................................79
4.1.1 SCALING METHODOLOGY .............................................................................................81 4.1.2 PURCHASED EQUIPMENT COSTS ...................................................................................82 4.1.3 EVALUATION OF PRESSURE CORRECTION FACTORS .......................................................82 4.1.4 EVALUATION OF MATERIAL CORRECTION FACTORS .......................................................83
4.2 ENGINEERING, PROCUREMENT, AND CONSTRUCTION COSTS ..........................................83 4.3 PROCESS AND PROJECT CONTINGENCIES ........................................................................83 4.4 OWNER’S COSTS AND TOTAL CAPITAL COSTS ................................................................84 4.5 EVALUATION OF O&M COSTS ........................................................................................85 4.6 CO2 TRANSPORT STORAGE AND MONITORING ...............................................................86 4.7 FINANCE STRUCTURE, DISCOUNTED CASH FLOW ANALYSIS, AND COE ........................86
4.7.1 ESTIMATING COE WITH CAPITAL CHARGE FACTORS .....................................................88 4.7.2 ESTIMATING LCOE FROM COE ...................................................................................89 4.7.3 ESTIMATING COST OF CO2 AVOIDED FROM COE ..........................................................90
4.8 FINAL COST ESTIMATING RESULTS ................................................................................90

Carbon Capture and Sequestration Approaches for NGCC Systems, 12/20/10
II 12/20/2010
4.9 EVALUATION OF KEY EQUIPMENT COSTS IN CASES 1 THROUGH 5 AND SENSITIVITY ANALYSES ......................................................................................................................96
4.9.1 CASE 1A, CASE 1B, AND CASE 1C ..................................................................................96 4.9.2 CASE 2 .........................................................................................................................98 4.9.3 CASE 3 .........................................................................................................................99 4.9.4 CASE 4 .......................................................................................................................100 4.9.5 CASE 5 .......................................................................................................................101
5. CONCLUSIONS ............................................................................................................103 APPENDIX A - ACCOUNT BY ACCOUNT COMPARISON OF COSTS FOR ALL
CASES .............................................................................................................................109 6. REFERENCES ...............................................................................................................115

Carbon Capture and Sequestration Approaches for NGCC Systems, 12/20/10
III 12/20/2010
List of Exhibits Exhibit ES-1 Case Descriptions ..................................................................................................... 3Exhibit ES-2 Cost and Performance Summary and Environmental Profile for All Cases ............ 4Exhibit ES-3 Net Plant Efficiency (HHV Basis) ........................................................................... 5Exhibit ES-4 Water Usage ............................................................................................................. 7Exhibit ES-5 Plant Capital Costs ................................................................................................. 10Exhibit ES-6 Economic Parameters Used to Calculate COE ...................................................... 11Exhibit ES-7 COE Component Details (mills/kWh or $/MWh) for All Cases ........................... 12Exhibit ES-8 COE Components for All Cases ............................................................................ 13Exhibit ES-9 Summary and Comparison of CO2 Avoided Costs for All Cases .......................... 15Exhibit 1-1 Case Descriptions ..................................................................................................... 18Exhibit 2-1 Site Ambient Conditions ........................................................................................... 19Exhibit 2-2 Site Characteristics ................................................................................................... 19Exhibit 2-3 Natural Gas Composition .......................................................................................... 20Exhibit 3-1 Case Ref1 Block Flow Diagram, NGCC Reference Case without CO2 Capture ..... 22Exhibit 3-2 Case Ref1 Stream Table, NGCC Reference Case without CO2 Capture .................. 23Exhibit 3-3 Case Ref1 Plant Performance Summary ................................................................... 24Exhibit 3-4 Case Ref1 Estimated Air Emissions ......................................................................... 25Exhibit 3-5 Case Ref1 Carbon Balance ....................................................................................... 25Exhibit 3-6 Case Ref1 Water Balance ......................................................................................... 26Exhibit 3-7 Case Ref1 Overall Energy Balance .......................................................................... 26Exhibit 3-8 Fluor Econamine FG Plus Typical Flow Diagram ................................................... 28Exhibit 3-9 Case Ref2 Block Flow Diagram, NGCC Reference Case with CO2 Capture .......... 29Exhibit 3-10 Case Ref2 Stream Table, NGCC Reference Case with CO2 Capture ..................... 30Exhibit 3-11 Case Ref2 Plant Performance Summary ................................................................. 31Exhibit 3-12 Case Ref2 Estimated Air Emissions ....................................................................... 32Exhibit 3-13 Case Ref2 Carbon Balance ..................................................................................... 32Exhibit 3-14 Case Ref2 Water Balance ....................................................................................... 33Exhibit 3-15 Case Ref2 Overall Energy Balance ........................................................................ 33Exhibit 3-16 Cases Ref2, 1a, 1b, and 1c Comparison ................................................................. 35Exhibit 3-17 Cases 1a, 1b, and 1c Block Flow Diagram, Exhaust Gas Recycle and Amine
Absorption ............................................................................................................................. 37Exhibit 3-18 Case 1a Stream Table, 35% Exhaust gas recycle and amine absorption ................ 38Exhibit 3-19 Case 1b Stream Table, 50% Exhaust Gas Recycle and Amine Absorption ........... 39Exhibit 3-20 Case 1c Stream Table, 35% Exhaust Gas Recycle, Lower Amine Steam
Requirement, & Amine Absorption ...................................................................................... 40Exhibit 3-21 Case 1a, 1b, and 1c Plant Performance Summary .................................................. 42Exhibit 3-22 Cases 1a, 1b, and 1c Estimated Air Emissions ....................................................... 43Exhibit 3-23 Cases 1a, 1b, and 1c Carbon Balances .................................................................... 43Exhibit 3-24 Cases 1a, 1b, and 1c Water Balances ...................................................................... 44Exhibit 3-25 Cases 1a, 1b, and 1c Overall Energy Balances ....................................................... 45Exhibit 3-26 Case 2 Comparison with Other Studies .................................................................. 47Exhibit 3-27 Case 2 Block Flow Diagram, Auto-Thermal Reforming and Amine CO2 Separation
............................................................................................................................................... 49Exhibit 3-28 Case 2 Stream Table, Auto-Thermal Reforming and Amine CO2 Separation ........ 50

Carbon Capture and Sequestration Approaches for NGCC Systems, 12/20/10
IV 12/20/2010
Exhibit 3-29 Case 2 Plant Performance Summary ...................................................................... 52Exhibit 3-30 Case 2 Estimated Air Emissions ............................................................................. 53Exhibit 3-31 Case 2 Carbon Balance ........................................................................................... 53Exhibit 3-32 Case 2 Water Balance ............................................................................................. 54Exhibit 3-33 Case 2 Overall Energy Balance .............................................................................. 54Exhibit 3-34 Case 3 Block Flow Diagram, Partial Oxidation and Amine CO2 Separation ......... 58Exhibit 3-35 Case 3 Stream Tables, Partial Oxidation and Amine CO2 Separation .................... 59Exhibit 3-36 Case 3 Plant Performance Summary ...................................................................... 61Exhibit 3-37 Case 3 Estimated Air Emissions ............................................................................. 62Exhibit 3-38 Case 3 Carbon Balance ........................................................................................... 62Exhibit 3-39 Case 3 Water Balance ............................................................................................. 63Exhibit 3-40 Case 3 Overall Energy Balance ............................................................................... 63Exhibit 3-41 Case 4 Block Flow Diagram, Oxy-combustion with CO2 Recycle ........................ 66Exhibit 3-42 Case 4 Stream Tables, Oxy-combustion with CO2 Recycle .................................... 67Exhibit 3-43 Case 4 Plant Performance Summary ...................................................................... 68Exhibit 3-44 Case 4 Carbon Balance ........................................................................................... 69Exhibit 3-45 Case 4 Water Balance ............................................................................................. 69Exhibit 3-46 Case 4 Overall Energy Balance ............................................................................... 70Exhibit 3-47 Case 5 Block Flow Diagram, Oxy-combustion Turbine ........................................ 72Exhibit 3-48 Case 5 Stream Tables, CES-Based Oxy-combustion Turbine ................................. 73Exhibit 3-49 Case 5 Plant Performance Summary ...................................................................... 75Exhibit 3-50 Case 5 Carbon Balance ........................................................................................... 76Exhibit 3-51 Case 5 Water Balance ............................................................................................. 76Exhibit 3-52 Case 5 Overall Energy Balance ............................................................................... 77Exhibit 4-1 Owner’s Costs Included in TOC ............................................................................... 85Exhibit 4-2 Operating and Maintenance Labor ........................................................................... 85Exhibit 4-3 CO2 Pipeline Specification ....................................................................................... 86Exhibit 4-4 Global Economic Assumptions ................................................................................ 87Exhibit 4-5 Financial Structure for Investor Owned Utility High and Low Risk Projects .......... 88Exhibit 4-6 TASC/TOC Factor .................................................................................................... 88Exhibit 4-7 Capital Charge Factors for COE Equation ............................................................... 89Exhibit 4-8 Plant Capital Cost ..................................................................................................... 91Exhibit 4-9 COE Component Details (mills/kWh or $/MWh) for All Cases .............................. 92Exhibit 4-10 COE Components for All Cases ............................................................................. 94Exhibit 4-11 Summary and Comparison of CO2 Avoided Costs for All Cases ........................... 95Exhibit 4-12 Sensitivity Analysis for Case 1a ............................................................................. 97Exhibit 4-13 Sensitivity Analysis of Case 1b .............................................................................. 97Exhibit 4-14 Sensitivity Analysis of Case 2 ................................................................................ 98Exhibit 4-15 Sensitivity Analysis of Case 3 ................................................................................ 99Exhibit 4-16 Sensitivity Analysis of Case 4 .............................................................................. 100Exhibit 4-17 Sensitivity Analysis of Case 5 .............................................................................. 102Exhibit 5-1 Summary Performance Table ................................................................................. 105Exhibit 5-2 Summary Cost Results ............................................................................................ 107Exhibit A-1 Comparison of Total Plant Costs ........................................................................... 109

Carbon Capture and Sequestration Approaches for NGCC Systems, 12/20/10
V 12/20/2010
PREPARED BYEnergy Sector Planning and Analysis (ESPA)
:
Norma Kuehn Booz Allen Hamilton
Allison Kyle Booz Allen Hamilton
Mark Woods Booz Allen Hamilton
Wen-Ching Yang Booz Allen Hamilton
DOE Contract DE-FE0004001 Task 04001.410.01, Activity 023

Carbon Capture and Sequestration Approaches for NGCC Systems, 12/20/10
VI 12/20/2010
Acknowledgments This report was prepared by Booz Allen Hamilton Inc. under DOE NETL Contract Number DE-FE0004001, Energy Sector Planning and Analysis, Task 04001.410.01, Activity 023. The authors wish to acknowledge the excellent guidance, contributions, and cooperation of the NETL OPPA Performance Division Staff, particularly:
Walter Shelton, Technical Monitor James Black
John Wimer, Director

Carbon Capture and Sequestration Approaches for NGCC Systems, 12/20/10
VII 12/20/2010
$/MMkJ Dollars per million kilojoules (also shown as 10 6kJ) List of Acronyms and Abbreviations
$/MMBtu Dollars per million British thermal units (also shown as 106 Btu) $MM/yr Million dollars per year $/ton Dollars per ton $/MWhnet Dollars per megawatt hour net °C Degrees Centigrade °F Degrees Fahrenheit AACE Association for the Advancement of Cost Engineering abs Absolute AEO Annual Energy Outlook AFUDC Allowance for funds used during construction AGR Acid gas removal Ar Argon ASME American Society of Mechanical Engineers ASU Air separation unit ATR Auto Thermal Reformer/Auto Thermal Reforming barg bar gauge BB Bituminous Baseline BEC Bare erected cost BFD Block flow diagram BFW Boiler feed water Btu British thermal unit Btu/hr British thermal unit per hour Btu/kWh British thermal unit per kilowatt hour Btu/lb British thermal unit per pound Btu/scf British thermal unit per standard cubic foot CCF Capital charge factor CCS Carbon capture and sequestration CDR Carbon Dioxide Recovery CES Clean Energy Systems CF Capacity Factor C2H6 Ethane C3H8 Propane C4H10 n-Butane CH4 Methane CMB Combustor CMU Carnegie Mellon University CO Carbon monoxide CO2 Carbon dioxide CoP ConocoPhillips CT Combustion turbine CTG Combustion Turbine-Generator DEA Diethanolamine DLN Dry low NOx
Carbon Capture and Sequestration Approaches for NGCC Systems, 12/20/10
VIII 12/20/2010
DOE Department of Energy EGR Exhaust gas recycle EIA Energy Information Administration EPC Engineering Procurement and Construction EPCM Engineering/Procurement/Construction Management EPRI Electric Power Research Institute ESPA Energy Sector Planning and Analysis Services FEED Front-end engineering design FGD Flue gas desulfurization FOAK First-of-a-kind ft Foot, Feet GE General Electric GJ/hr Gigajoules per hour gpm Gallons per minute gpm/MWnet Gallons per minute per megawatt net GT Gas turbine H2O Water HGCU Hot gas cleanup HHV Higher heating value HP High pressure HRSG Heat recovery steam generator HTHP High temperature, high pressure HVAC Heating, ventilating, and air conditioning HVAP Heat of vaporization HX Heat exchanger IEA International Energy Agency IGCC Integrated Gasification Combined Cycle IOU Investor owned utilities IP Intermediate pressure IRROE Internal rate of return on equity ISO International Standards Organization kg/hr Kilogram per hour kg/MWh Kilograms per megawatt hour kJ Kilojoules kJ/hr Kilojoules per hour kJ/kg Kilojoules per kilogram kWe Kilowatts electric kWh Kilowatt-hour kWth Kilowatt-thermal lb Pound lb/hr Pounds per hour lb/MWh Pound per megawatt hour LCOE Levelized cost of electricity LF Levelization factor LHV Lower heating value LNB Low NOx burner

Carbon Capture and Sequestration Approaches for NGCC Systems, 12/20/10
IX 12/20/2010
LP Low pressure m3/min Cubic meter per minute µm Micrometer MAC Multi-stage air Compressor md millidarcy MFC Multi-stage fuel compressor MOC Multi-stage oxygen compressor MDEA Methyldiethanolamine MEA Monoethanolamine MMBtu Million British thermal units (also shown as 106 Btu) MMBtu/hr Million British thermal units (also shown as 106 Btu) per hour MMkJ Million kilojoules (also shown as 106 kJ) MJ/scm Megajoules per standard cubic meter MPa Megapascals MW Megawatts MWe Megawatts Electric N/A Not applicable N2 Nitrogen NETL National Energy Technology Laboratory NGCC Natural gas combined cycle Ni Nickel NOx Oxides of nitrogen O2 Oxygen O&M Operating and maintenance costs O&GJ Oil and gas journal OGT Optimized Gas Treating P Pressure PC Pulverized coal PM Particulate matter PSFM Power Systems Financial Model ppmv Parts per million volume ppmvd Parts per million volume dry POX Partial Oxidation psia Pounds per square inch absolute psig Pounds per square inch gage SC Supercritical SCR Selective catalytic reduction SNG Substitute natural gas SO2 Sulfur dioxide STG Steam turbine generator T Temperature TAG Technical Assessment Guide TASC Total As-Spent Cost Ti Titanium TIT Turbine inlet temperature TOC Total overnight cost

Carbon Capture and Sequestration Approaches for NGCC Systems, 12/20/10
X 12/20/2010
Ton/MWhnet Ton per megawatt hour net Tonne Metric ton (1000 kg) TPC Total plant cost TS&M Transport, storage, and monitoring U.S. United States V-L Vapor Liquid portion of stream (excluding solids) WGS Water gas shift yr Year ZnO Zinc Oxide

Carbon Capture and Sequestration Approaches for NGCC Systems, 12/20/10
1 12/20/2010
Executive Summary The purpose of this study is to present the cost and performance of advanced natural gas combined cycle (NGCC) plants with CO2 capture, using a consistent technical and economic approach that accurately reflects current market conditions for future developmental technologies. For this study, there were three types of carbon capture approaches examined: pre-combustion, post-combustion and oxy-combustion. In pre-combustion carbon capture, the carbon in the fuel is converted to CO2 and removed before the combustion process, whereas in post-combustion, the more dilute CO2 is separated from the flue gas at a lower pressure. Oxy-combustion technologies use nearly pure oxygen as the oxidant so that the flue gas consists primarily of CO2 and water vapor. Seven different plant design configurations were analyzed as listed in Exhibit ES-1. Two cases are NGCC reference cases without carbon capture (Ref1) and with carbon capture (Ref2). These cases are taken from the Bituminous Baseline (BB) study [1
The methodology included performing steady-state simulations of the various technologies using the Aspen Plus (Aspen) modeling program. The resulting mass and energy balance data from the Aspen models were used to size major pieces of equipment. The cost estimating methodology for Cases 1 through 5 uses reference costs established in the BB study. Performance and process limits were based upon published reports and/or best engineering judgment. Capital and operating costs for the reference cases were estimated by WorleyParsons based on simulation results and using vendor quotes/discussions, costing software, or a combination of the two. All costs are in June 2007 dollars, matching the cost basis of the BB study, to facilitate comparison. Note that, according to the Chemical Engineering Plant Cost Index, June-2007 dollars are nearly equivalent to January-2010 dollars. Owner’s costs are included in the present estimates as they were in the BB study estimates. Baseline fuel cost for the reference cases was determined using data from the Energy Information Administration’s (EIA) Annual Energy Outlook (AEO) 2008. The first year of capital expenditure (2007) cost used for natural gas is $6.21/MMkJ ($6.55/MMBtu), both on a HHV basis and in 2007 United States (U.S.) dollars.
]. The Ref2 case includes a modification to the amine auxiliary load calculation from the BB study NGCC with capture case. Since the comparable NGCC cases in this study also use the modified approach, case Ref2 is used as the baseline with capture reference case throughout the study.
All plant configurations are evaluated based on installation at a Greenfield site. The capacity factor was chosen to be consistent with the reference cases, or 85 percent for all cases. Since this study includes some one-of-a-kind equipment, the sensitivity of the cost of electricity (COE) to equipment cost was evaluated and is presented in the body of the report. The net outputs of the cases in this study range from 406 to 650 MW. Exhibit ES-2 shows the cost, performance, and environmental summary for all cases. A brief description of each study case follows:
• Case 1 includes a series of three post-combustion capture cases that examine the effect of exhaust gas recycle (EGR) on the combustion turbine performance and on the monoethanolamine (MEA)-based carbon capture process. Case 1a recycles 35 percent of the exhaust gas and Case 1b 50 percent. Case 1c combines 35 percent EGR with reduced reboiler duty in the MEA process.

Carbon Capture and Sequestration Approaches for NGCC Systems, 12/20/10
2 12/20/2010
• Case 2 is a pre-combustion capture case that uses an autothermal reactor to convert the feed methane to primarily hydrogen (H2), carbon monoxide (CO), carbon dioxide (CO2) and water (H2O). The reformed gas is then shifted to primarily H2 and CO2, and the CO2 is removed in a methyldiethanolamine (MDEA) acid gas removal process. The high hydrogen content fuel is utilized in the combustion turbine.
• Case 3 is another pre-combustion CO2 control process and is similar to Case 2. In Case 3 a high pressure partial oxidation reactor is used to convert the natural gas feed to primarily H2, CO, CO2 and H2O. The gas is shifted to primarily H2 and CO2 and the CO2 is removed using the MDEA process. The high hydrogen content gas stream is fed to the combustion turbine.
• Case 4 is an oxy-combustion based process. Natural gas is combusted in the combustion turbine using high purity oxygen as the oxidant. The flue gas exiting the heat recovery steam generator (HRSG) is recycled to the combustion turbine to act as a diluent. Most of the water is condensed in the HRSG prior to recycle, and the portion of the stream not recycled is sent to CO2 compression for sequestration.
• Case 5 is another oxy-combustion process based on the technology being developed by Clean Energy Systems (CES). Using high purity oxygen, natural gas is combusted in a high pressure gas generator with recycled water/steam acting as diluents. Power is recovered in a high pressure expander. The exhaust enters a reheat combustor where additional natural gas and oxygen are combusted. Additional power is recovered in subsequent turbine expanders before the working fluid enters a partial condenser that recovers water for recycling. The remaining gas is sent to CO2 compression where additional water is recovered and recycled.
The results are discussed below in the following order: • Performance (efficiency and water usage)
• Cost (total overnight cost (TOC), cost of electricity (COE), and First Year Cost of CO2 Avoided)

Carbon Capture and Sequestration Approaches for NGCC Systems, 12/20/10
3 12/20/2010
Exhibit ES-1 Case Descriptions
Case Unit Cycle Description Steam Cycle,
psig/°F/°F Combustion
Turbine Gasifier/
Boiler Technology
Oxidant NOx Control
Exhaust Gas
Recycle CO2
Separation CO2
Capture Target
Ref1 NGCC Without capture 2400/1050/1050 Advanced F Class HRSG Air LNB and
SCR N/A N/A 0%
Ref2 NGCC Post-Combustion with capture 2400/1050/1050 Advanced F
Class HRSG Air LNB and SCR N/A MEA 90%
1a NGCC Post-Combustion with exhaust gas
recycle 2400/1050/1050 Advanced F
Class HRSG Air SCR 35% MEA 90%
1b NGCC Post-Combustion with exhaust gas
recycle 2400/1050/1050 Advanced F
Class HRSG Air SCR 50% MEA 90%
1c NGCC Post-Combustion with exhaust gas
recycle 2400/1050/1050 Advanced F
Class HRSG Air SCR 35% Enhanced
MEA 90%
2 NGCC Pre-Combustion with autothermal
reactor 2400/1050/1050 Advanced F
Class HRSG Air SCR N/A MDEA 90%
3 NGCC
Pre-Combustion with high
pressure Partial oxidizer
2400/1050/1050 Advanced F Class
HRSG Air SCR N/A MDEA 90%
4 NGCC Oxy-combustion with CO2 recycle 2400/1200/1200 High Pressure
Ratio HRSG O2 N/A N/A Oxy-fuel >99%
5 NGCC Oxy-combustion with water/steam
recycle
CES - Based Design
CES - Based Design N/A O2 N/A N/A Oxy-fuel >99%

Carbon Capture and Sequestration Approaches for NGCC Systems, 12/20/10
4 12/20/2010
Exhibit ES-2 Cost and Performance Summary and Environmental Profile for All Cases Case Ref1 Ref2 1a 1b 1c 2 3 4 5
CO2 Capture No Yes Yes Yes Yes Yes Yes Yes Yes Gross Power Output (kW) 564,700 511,00 513,000 515,500 521,800 645,200 727,148 585,900 528,700 Auxiliary Power Requirement (kW) 9,620 44,214 38,197 35,942 38,577 59,200 77,450 136,480 122,272
Net Power Output (kW) 555,080 466,786 474,803 479,558 483,223 586,000 649,698 449,420 405,928 Natural Gas Flowrate, kg/hr (lb/hr)
75,901 (167,333)
75,901 (167,333)
75,374 (166,172)
75,648 (166,774)
75,374 (166,172)
94,971 (209,375)
108,022 (238,148)
74,083 (163,325)
62,272 (137,285)
HHV Thermal Input (kWth) 1,105,812 1,105,812 1,098,140 1,102,121 1,098,140 1,383,644 1,573,791 1,079,327 907,255 Net Plant HHV Efficiency (%) 50.2% 42.2% 43.2% 43.5% 44.0% 42.4% 41.3% 41.6% 44.7% Net Plant HHV Heat Rate, kJ/kWh (Btu/kWh)
7,172 (6,798)
8,528 (8,083)
8,326 (7,892)
8,274 (7,842)
8,181 (7,754)
8,500 (8,057)
8,720 (8,265)
8,646 (8,195)
8,046 (7,626)
Raw Water Withdrawal, m3/min (gpm)
8.9 (2,362)
15.1 (3,980)
14.2 (3,741)
14.1 (3,729)
14.9 (3,944)
16.8 (4,430)
14.2 (3,762)
12.7 (3,444)
10.6 (2,801)
Raw Water Consumption, m3/min (gpm)
6.9 (1,831)
11.3 (2,985)
10.6 (2,802)
10.5 (2,781)
11.2 (2,959)
13.8 (3,638)
11.7 (3,091)
9.3 (2,454)
7.8 (2,056)
Total Overnight Cost ($ x 1,000) 398,290 709,039 618,008 649.113 622,441 904,522 998,934 891,165 1,184,515 COE, total including TS & M costs (mills/kWh)1 58.90 87.17 81.22 82.02 80.01 87.44 88.08 96.69 112.24
LCOE, total including TS & M costs (mills/kWh)1 74.66 110.50 102.96 103.97 101.42 110.84 111.66 122.57 142.28
CO2 emissions, tonne/yr (tons/yr)1
1,507,427 (1,661,654)
141,875 (156,391)
149,285 (164,558)
149,654 (164,966)
149,285 (164,558)
204,492 (225,414)
247,961 (273,331) Negligible Negligible
CO2 emissions, kg/MWh (lb/MWh)2 359 (790) 40 (87) 39 (86) 39 (86) 38 (85) 43 (94) 46 (101) Negligible Negligible
CO2 emissions, kg/MWh (lb/MWh)3 365 (804) 43 (96) 42 (93) 42 (92) 41 (91) 47 (103) 51 (113) Negligible Negligible
NOX emissions, tonne/yr (ton/yr)1 115 (127) 98 (109) 102 (112) 102 102 (112) 770 (848) 874 (964) Negligible Negligible
NOX emissions, kg/MWh (lb/MWh)2
0.027 (0.060)
0.027 (0.061)
0.027 (0.059)
0.027 (0.059)
0.026 (0.058)
0.160 (0.35)
0.161 (0.356) Negligible Negligible
1 Capacity Factor is 85%
2 Value is based on gross output 3 Value is based on net output

Carbon Capture and Sequestration Approaches for NGCC Systems, 12/20/10
5 12/20/2010
PERFORMANCE
The net plant efficiency (HHV basis) for all cases is shown in Energy Efficiency
Exhibit ES-3. The following conclusions can be drawn:
• As expected, the NGCC with no CO2 capture (Ref1) has the highest net efficiency of the technologies modeled in this study with an efficiency of 50.2 percent.
• The NGCC case based on the Clean Energy Systems technology (case 5) results in the highest efficiency (44.7 percent) among all of the capture cases.
• The post-combustion-based NGCC cases have a slightly higher net efficiency than the pre-combustion or conventional oxy-combustion (CO2 recycle – case 4) cases.
• The efficiency spread is only 3.5 percentage points between the highest and lowest efficiency capture technologies.
Exhibit ES-3 Net Plant Efficiency (HHV Basis)
50.2%
42.2%43.2% 43.5% 44.0%
42.4%41.3% 41.6%
44.7%
0%
10%
20%
30%
40%
50%
60%
Ref1 Ref2 1a 1b 1c 2 3 4 5
No Capture Post-Combustion Pre-Combustion Oxy-Combustion
% E
ffic
ienc
y (b
ased
on
HH
V)

Carbon Capture and Sequestration Approaches for NGCC Systems, 12/20/10
6 12/20/2010
Five water values are presented for each technology in Water Use
Exhibit ES-4: water demand, internal recycle, raw water withdrawal, process water discharge, and raw water consumption. Each value is normalized by the net output. The total water demand for each subsystem was determined and internal recycle water available from various sources like boiler feed water (BFW) blowdown and condensate was applied to offset the water demand. The difference between demand and recycle is raw water withdrawal. Raw water withdrawal is the water removed from the ground or diverted from a surface-water source for use in the plant. Raw water consumption is also accounted for as the portion of the raw water withdrawn that is evaporated, transpired, incorporated into products or otherwise not returned to the water source it was withdrawn from. Thus the difference between withdrawal and process water returned to the source is consumption. Consumption represents the net impact of the process on the water source. Raw water is obtained from groundwater (50 percent) and from municipal sources (50 percent). The following conclusions can be drawn:
• In all cases, the primary water consumer is the cooling tower makeup, which ranges from 70-100 percent of the total raw water withdrawal.
• The normalized water demand for the CO2 capture cases is on average twice as great as the reference non-capture case. Additional water demand comes from the large cooling loads in the post-combustion cases using the Econamine process, from water gas shift and humidification requirements in the pre-combustion cases, and from lower net power output in the oxy-combustion cases.
• The normalized water demand varies from 6.5 to 9.6 gpm/MWnet for the capture cases. At the low end of the range is case 3, high pressure partial oxidation with amine CO2 separation, primarily because the additional power recovered in the syngas expander results in the highest net output of all the cases as opposed to a significant reduction in water demand. At the high end of the range is the post-combustion capture reference case (Ref2), which has a relatively high water demand because of the Econamine process and relatively low net output.
• Raw water consumption for the capture cases varies over a narrower range than demand, 4.8 to 6.4 gpm/MWnet, primarily because the technologies with high demand also had high process water discharge which serves to reduce consumption.

Carbon Capture and Sequestration Approaches for NGCC Systems, 12/20/10
7 12/20/2010
Exhibit ES-4 Water Usage
4.3
9.6
8.9 8.99.2
8.2
6.5
8.9
8.2
0.0
1.1 1.1 1.2 1.1
0.6 0.7
1.4 1.3
4.3
8.5
7.9 7.88.2
7.6
5.8
7.4
6.9
1.0
2.22.0 2.0 2.1
1.41.0
2.01.8
3.3
6.4
5.9 5.86.1 6.2
4.8
5.5
5.1
0.0
2.0
4.0
6.0
8.0
10.0
12.0
Ref1 Ref2 1a 1b 1c 2 3 4 5
No Capture Post-Combustion Pre-Combustion Oxy-Combustion
Nor
mal
ized
Wat
er F
low
, gpm
/MW
net
Water Demand
Internal Recycle
Raw Water Withdrawal
Process Water Discharge
Raw Water Consumption

Carbon Capture and Sequestration Approaches for NGCC Systems, 12/20/10
8 12/20/2010
COST RESULTS
The Total Overnight Cost (TOC) for each plant was calculated by adding owner’s costs to the Total Plant Cost (TPC). The TPC for two reference cases was determined through a combination of vendor quotes, scaled estimates from previous design/build projects, or a combination of the two. The TPC for the new cases in this study were scaled from the reference estimates with certain unique equipment items estimated by WorleyParsons or scaled from other technology estimates. TPC includes all equipment (complete with initial chemical and catalyst loadings), materials, labor (direct and indirect), engineering and construction management, and contingencies (process and project). Escalation and interest on debt during the capital expenditure period were estimated and added to the TOC to provide the Total As-Spent Cost (TASC).
Total Overnight Cost
The normalized TOC and TASC components for each technology are shown in Exhibit ES-5. The cost estimates carry an accuracy of -15%/+30%, consistent with a “feasibility study” level of design engineering applied to the various cases in this study. The value of the study lies not in the absolute accuracy of the individual case results but in the fact that all cases were evaluated under the same set of technical and economic assumptions. This consistency of approach allows meaningful comparisons among the cases evaluated. Project contingencies were added to the Engineering/Procurement/Construction Management (EPCM) capital accounts to cover project uncertainty and the cost of any additional equipment that would result from a detailed design. The contingencies represent costs that are expected to occur. Each bare erected cost (BEC) account was evaluated against the level of estimate detail and field experience to determine project contingency. Process contingency was added to cost account items that were deemed to be first-of-a-kind (FOAK) or posed significant risk due to lack of operating experience. The cost accounts that received a process contingency include:
• Combustion Turbine Generator - five percent contingency on Cases 1a and 1c for modifications required to the inlet air system (material, static mixer) and the compressor. A 40 percent contingency is used in Case 1b since major design modifications would be required to accommodate the low combustor oxygen concentration, and 40 percent was also used for Case 4 because of the oxy-combustion configuration and the high pressure ratio.
• MEA-based carbon capture processes - 20 percent contingency on Cases Ref2, 1a, 1b, and 1c because it is considered unproven at commercial scale for power plant applications.
• Gas Generator and Reheat Combustor – 15 percent contingency for high-pressure oxy-combustion reactors.
All cases except Cases 1a, 1b, and 1c, deviate substantially from the reference Case Ref2 in cycle configuration and in operating condition of key pieces of equipment. The severe operating temperatures and pressures required for some of this equipment pushes the envelope of existing material metallurgy and design practices. Because of the uncertainty associated with equipment cost in these instances, a sensitivity analysis was performed to show the impact of both higher and lower than estimated costs. The equipment items included in the sensitivity analysis include: the HRSG and Econamine process in the EGR cases, the high temperature, high pressure gas-gas

Carbon Capture and Sequestration Approaches for NGCC Systems, 12/20/10
9 12/20/2010
heat exchanger and autothermal reactor in Case 2, and the partial oxidation reactor and high temperature, high pressure expander in Case 3, the high pressure ratio oxy-combustion turbine in Case 4, and the gas generators, air separation unit, and high temperature turboexpander in Case 5.

Carbon Capture and Sequestration Approaches for NGCC Systems, 12/20/10
10 12/20/2010
Exhibit ES-5 Plant Capital Costs
482
940819 810 811
996 997
1,266
1,861
40
79
69 65 68
88 89
105
168
62
164
134 125 133
172 167
152
317
0
61
43 108 42
1 1
106
55
133
275
236 245234
286 284
354
517
718
1,519
1,302 1,3541,288
1,544 1,538
1,983
2,918
771
1,637
1,403 1,459 1,468
1,664 1,657
2,138
3,146
0
500
1,000
1,500
2,000
2,500
3,000
3,500
TOC TASC TOC TASC TOC TASC TOC TASC TOC TASC TOC TASC TOC TASC TOC TASC TOC TASC
Ref1 Ref2 1a 1b 1c 2 3 4 5
No Capture Post-Combustion Pre-Combustion Oxy-Combustion
Capi
tal C
osts
, 200
7$/k
W
Total As Spent CapitalOwner's CostProcess ContingencyProject ContingencyHome Office ExpenseBare Erected CostTOCTASC
Carbon Capture and Sequestration Approaches for NGCC Systems, 12/20/10
11 12/20/2010
The following conclusions can be drawn:
• The post-combustion processes using EGR have the lowest normalized capital cost of any of the capture technologies, including the reference case.
• The pre-combustion capture cases have normalized TPC values that are 17 percent greater than the average of the post-combustion EGR cases, and the conventional oxy-combustion case is 51 percent more costly than the post-combustion cases.
• The oxy-combustion (CES-based) system is the most capital intensive of the systems studied with a normalized TPC more than double the post-combustion cases.
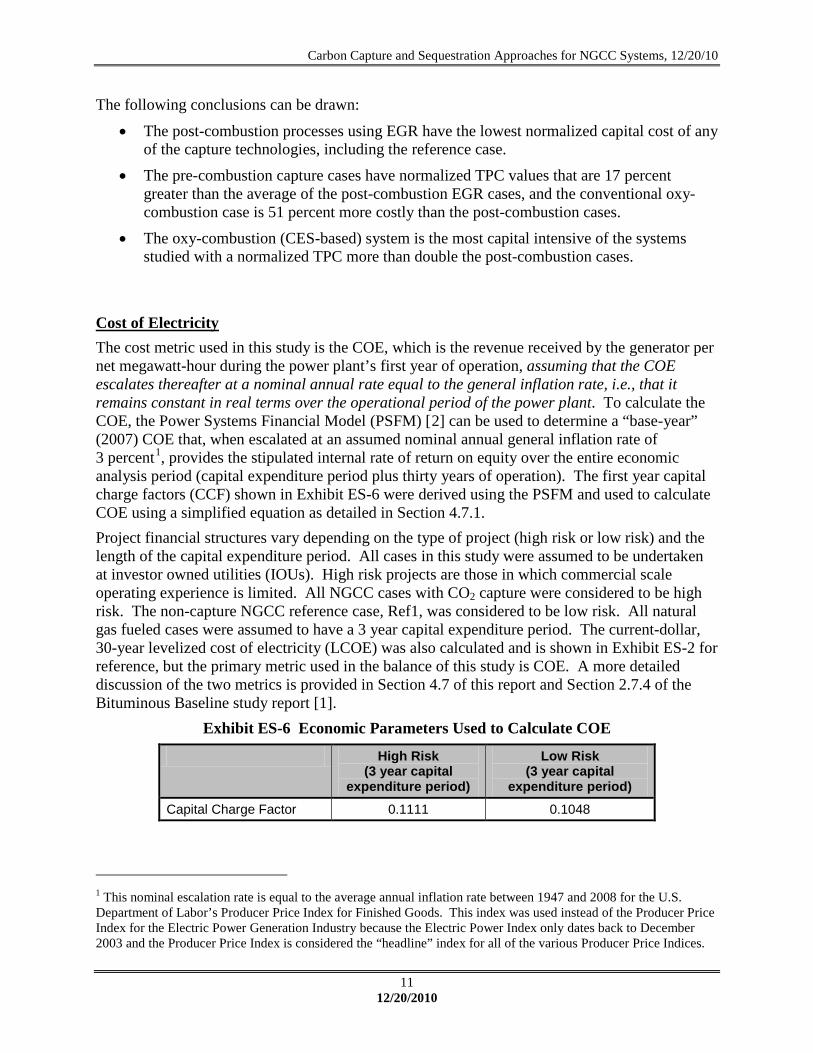
The cost metric used in this study is the COE, which is the revenue received by the generator per net megawatt-hour during the power plant’s first year of operation, assuming that the COE escalates thereafter at a nominal annual rate equal to the general inflation rate, i.e., that it remains constant in real terms over the operational period of the power plant. To calculate the COE, the Power Systems Financial Model (PSFM) [
Cost of Electricity
2] can be used to determine a “base-year” (2007) COE that, when escalated at an assumed nominal annual general inflation rate of 3 percent1
Exhibit ES-6
, provides the stipulated internal rate of return on equity over the entire economic analysis period (capital expenditure period plus thirty years of operation). The first year capital charge factors (CCF) shown in were derived using the PSFM and used to calculate COE using a simplified equation as detailed in Section 4.7.1. Project financial structures vary depending on the type of project (high risk or low risk) and the length of the capital expenditure period. All cases in this study were assumed to be undertaken at investor owned utilities (IOUs). High risk projects are those in which commercial scale operating experience is limited. All NGCC cases with CO2 capture were considered to be high risk. The non-capture NGCC reference case, Ref1, was considered to be low risk. All natural gas fueled cases were assumed to have a 3 year capital expenditure period. The current-dollar, 30-year levelized cost of electricity (LCOE) was also calculated and is shown in Exhibit ES-2 for reference, but the primary metric used in the balance of this study is COE. A more detailed discussion of the two metrics is provided in Section 4.7 of this report and Section 2.7.4 of the Bituminous Baseline study report [1].
Exhibit ES-6 Economic Parameters Used to Calculate COE
High Risk (3 year capital
expenditure period)
Low Risk (3 year capital
expenditure period) Capital Charge Factor 0.1111 0.1048
1 This nominal escalation rate is equal to the average annual inflation rate between 1947 and 2008 for the U.S. Department of Labor’s Producer Price Index for Finished Goods. This index was used instead of the Producer Price Index for the Electric Power Generation Industry because the Electric Power Index only dates back to December 2003 and the Producer Price Index is considered the “headline” index for all of the various Producer Price Indices.

Carbon Capture and Sequestration Approaches for NGCC Systems, 12/20/10
12 12/20/2010
The COE results are listed in Exhibit ES-7 and shown graphically in Exhibit ES-8. The capital cost, fixed operating cost, variable operating cost, and fuel cost are shown separately. In the capture cases, the CO2 transport, storage, and monitoring (TS&M) costs are also shown as a separate bar segment.
Exhibit ES-7 COE Component Details (mills/kWh or $/MWh) for All Cases
Case Ref1 Ref2 1a 1b 1c 2 3 4 5
Capital 10.10 22.66 19.41 20.19 19.21 23.02 22.93 29.58 43.52
Fixed O&M 2.96 5.74 5.04 5.31 4.99 6.00 5.89 7.34 11.17
Variable O&M 1.32 2.60 1.89 2.04 1.89 2.74 2.41 2.74 3.90
Fuel 44.51 52.93 51.79 51.46 50.89 52.87 54.24 53.78 50.05
CO2 TS&M total 0.0 3.25 3.08 3.03 3.03 2.80 2.61 3.25 3.60
Transport 0.0 1.95 1.92 1.88 1.89 1.73 1.56 2.03 2.25
Storage 0.0 0.90 0.83 0.82 0.81 0.74 0.71 0.87 0.97
Monitoring 0.0 0.40 0.33 0.33 0.33 0.33 0.34 0.35 0.39
COE Total 58.90 87.17 81.22 82.02 80.01 87.44 88.08 96.69 112.24
LCOE, total (including TS&M) 74.66 110.50 102.96 103.97 101.42 110.84 111.66 122.57 142.28
1 CF is 85 percent for NGCC cases The following conclusions can be drawn:
• Of the capture cases, the post-combustion cases utilizing EGR have the lowest COE by at least six percent. The next least expensive technologies are the reference case, which also uses post-combustion amine-based CO2 capture but without EGR, and the pre-combustion cases, which are approximately equal.
• The COE of the conventional oxy-combustion case is approximately 11 percent higher than the reference case and 17 percent greater than the EGR cases.
• The CES-based process has the highest COE out of all the cases at 112 mills/kWh, primarily due to the very high capital cost.
• CO2 transport, storage, and monitoring add approximately 3 mills/kWh to the COE, which is less than 3 percent of the total COE for all cases.

Carbon Capture and Sequestration Approaches for NGCC Systems, 12/20/10
13 12/20/2010
Exhibit ES-8 COE Components for All Cases
10.10
22.6619.41 20.19 19.21
23.02 22.9329.58
43.52
2.96
5.745.04 5.31 4.99
6.00 5.89
7.34
11.17
1.32
2.60
1.89 2.04 1.89
2.74 2.41
2.74
3.90
44.51
52.93
51.79 51.4650.89
52.87 54.24
53.78
50.053.25
3.08 3.033.03
2.80 2.61
3.25
3.60
58.90
87.17
81.22 82.0280.01
87.44 88.08
96.69
112.24
0.00
20.00
40.00
60.00
80.00
100.00
120.00
Ref1 Ref2 1a 1b 1c 2 3 4 5
No Capture Post-Combustion Pre-Combustion Oxy-Combustion
Cost
of E
lect
rici
ty, m
ills/
kWh
CO2 TS&MFuelVariableFixedCapitalTotal

Carbon Capture and Sequestration Approaches for NGCC Systems, 12/20/10
14 12/20/2010
The cost of CO2 avoided was calculated using Equation ES-1: Cost of CO2 Avoided
MWhtonneEmissionsCOEmissionsCO
MWhCOECOECostAvoided
removalwithreference
referenceremovalwith
/}{/$}{
22 −
−= (ES-1)
The COE with CO2 removal includes the costs of capture and compression as well as TS&M costs. The resulting avoided costs are shown in Exhibit ES-9 for each of the cases in this study. The avoided costs for each capture case are calculated using the NGCC non-capture case (Ref1) as the reference and again with Bituminous Baseline Supercritical Pulverized Coal without CO2 capture as the reference [1]. The following conclusions can be drawn:
• The post-combustion capture cases using EGR have the smallest CO2 avoided cost ($65.32/tonne).
• The CO2 avoided cost of the conventional oxy-combustion case is approximately 1.5 times the EGR-based cases.
• The CO2 avoided cost of the pre-combustion cases is approximately 1.3 times the EGR-based cases and approximately equal to the reference capture case.
• The CO2 avoided cost of the CES based system is approximately twice as great as the EGR cases.

Carbon Capture and Sequestration Approaches for NGCC Systems, 12/20/10
15 12/20/2010
Exhibit ES-9 Summary and Comparison of CO2 Avoided Costs for All Cases
87.31
69.2471.64
65.32
89.8093.12
103.63
146.27
37.14
29.38 30.4227.75
37.79 38.87
47.12
66.51
0
20
40
60
80
100
120
140
160
Ref2 1a 1b 1c 2 3 4 5
Post-Combustion Pre-Combustion Oxy-Combustion
Firs
t Yea
r CO
2A
void
ed C
ost,
$/t
onne
Avoided Cost (NGCC w/o Capture Reference)
Avoided Cost (SC PC w/o Capture Reference)

Carbon Capture and Sequestration Approaches for NGCC Systems, 12/20/10
16 12/20/2010
This page intentionally left blank

Carbon Capture and Sequestration Approaches for NGCC Systems, 12/20/10
17 12/20/2010
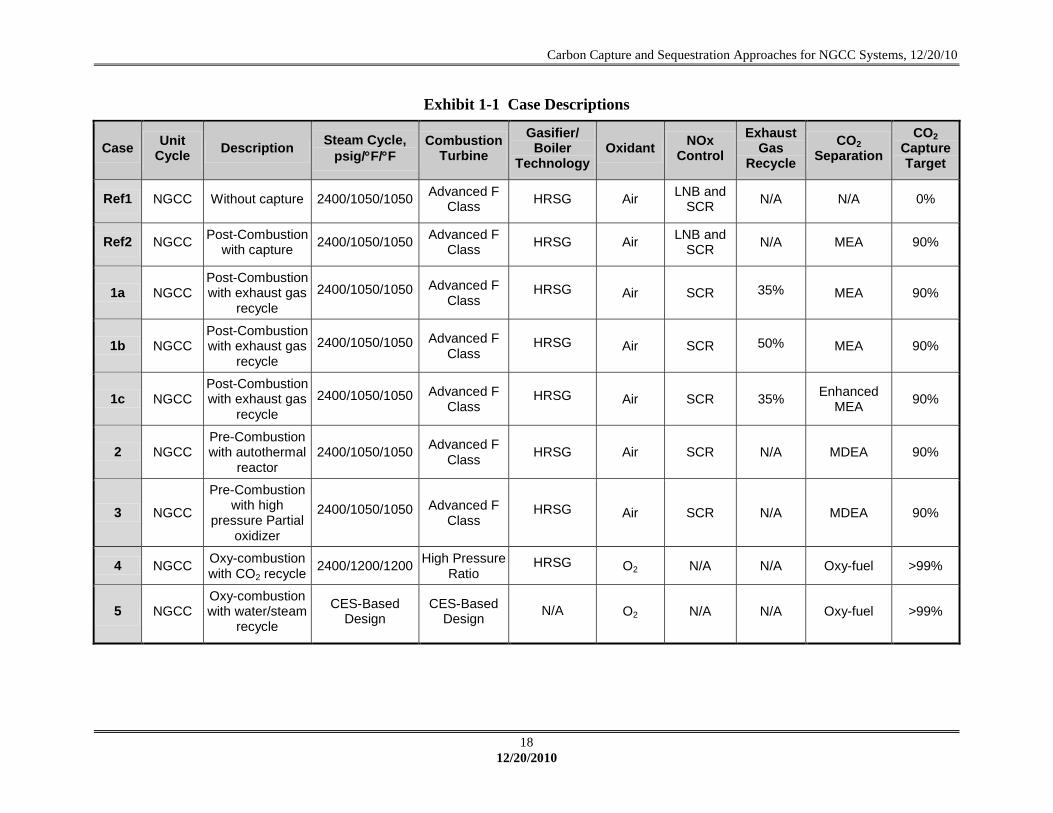
1. Introduction Despite its recent price volatility, natural gas has historically been a relatively inexpensive fuel. As carbon regulations become more likely, natural gas is the favored fossil fuel because of its lower carbon intensity relative to coal. The use of carbon capture and sequestration (CCS) can further reduce the carbon emissions from a natural gas fueled power plant. There are potential sources of renewable natural gas, including landfills and biomass-derived substitute natural gas (SNG). Landfill gas is currently being tapped at many locations, and gasification-based processes can be used to convert biomass into syngas, which can then be used to produce SNG. The quantity of available landfill gas is relatively small compared to the requirements of large scale electricity generation. Biomass-derived SNG is not currently cost competitive, and is still many years away from commercialization. Until clean coal plants and other alternative energy sources become more feasible, conventional natural gas will continue to be used as a means of reducing emissions and generating electricity. The objective of this report is to present a case study of the performance of advanced natural gas combined cycle (NGCC) plants with CCS, in a consistent technical manner that accurately reflects current market conditions for future developmental technologies. Five different plant configurations were analyzed and compared to two reference cases from the Bituminous Baseline (BB) study [1]. The reference cases are NGCC plants without and with carbon capture. For consistency and writing purposes, these cases will be called Ref1 (Case 13 from the BB study) and Ref2 (Case 14 from the BB study with a modification to the amine auxiliary load calculation), respectively. The configurations are listed in Exhibit 1-1. Components of each plant configuration are described in more detail in the corresponding case description sections. All plants include CO2 capture except Case Ref1.
Carbon Capture and Sequestration Approaches for NGCC Systems, 12/20/10
18 12/20/2010
Exhibit 1-1 Case Descriptions
Case Unit Cycle Description Steam Cycle,
psig/°F/°F Combustion
Turbine Gasifier/
Boiler Technology
Oxidant NOx Control
Exhaust Gas
Recycle CO2
Separation CO2
Capture Target
Ref1 NGCC Without capture 2400/1050/1050 Advanced F Class HRSG Air LNB and
SCR N/A N/A 0%
Ref2 NGCC Post-Combustion with capture 2400/1050/1050 Advanced F
Class HRSG Air LNB and SCR N/A MEA 90%
1a NGCC Post-Combustion with exhaust gas
recycle 2400/1050/1050 Advanced F
Class HRSG Air SCR 35% MEA 90%
1b NGCC Post-Combustion with exhaust gas
recycle 2400/1050/1050 Advanced F
Class HRSG Air SCR 50% MEA 90%
1c NGCC Post-Combustion with exhaust gas
recycle 2400/1050/1050 Advanced F
Class HRSG Air SCR 35% Enhanced
MEA 90%
2 NGCC Pre-Combustion with autothermal
reactor 2400/1050/1050 Advanced F
Class HRSG Air SCR N/A MDEA 90%
3 NGCC
Pre-Combustion with high
pressure Partial oxidizer
2400/1050/1050 Advanced F Class
HRSG Air SCR N/A MDEA 90%
4 NGCC Oxy-combustion with CO2 recycle 2400/1200/1200 High Pressure
Ratio HRSG O2 N/A N/A Oxy-fuel >99%
5 NGCC Oxy-combustion with water/steam
recycle
CES-Based Design
CES-Based Design N/A O2 N/A N/A Oxy-fuel >99%

Carbon Capture and Sequestration Approaches for NGCC Systems, 12/20/10
19 12/20/2010
2. General Evaluation Basis For each of the plant configurations in this study an AspenPlus model was developed and used to generate material and energy balances. Performance and process limits were based upon published reports, information obtained from vendors and users of the technology, performance data from design/build utility projects, and/or best engineering judgment.
2.1 Site Character istics All plants in this study are assumed to be located at a generic plant site in Midwestern USA, with ambient conditions and site characteristics as presented in Exhibit 2-1 and Exhibit 2-2. The ambient conditions are the same as ISO conditions.
Exhibit 2-1 Site Ambient Conditions
Elevation, ft 0 Barometric Pressure, psia 14.696
Design Ambient Temperature, Dry Bulb, °F 59
Design Ambient Temperature, Wet Bulb, °F 51.5 Design Ambient Relative Humidity, % 60
Exhibit 2-2 Site Characteristics
Location Greenfield, Midwestern USA Topography Level Size, acres 100 Transportation Rail Ash/Slag Disposal Off Site Water Municipal (50%) / Groundwater (50%) Access Land locked, having access by rail and highway
CO2 Storage Compressed to 15.3 MPa (2,215 psia), transported 80 kilometers (km) (50 miles), and sequestered in a saline formation at a depth of 1,239 m (4,055 ft)
The following design parameters are considered site-specific, and are not quantified for this study. Flood plain considerations
• Flood plain considerations • Existing soil/site conditions • Water discharges and reuse • Rainfall/snowfall criteria • Seismic design • Buildings/enclosures • Fire protection • Local code height requirements • Noise regulations – Impact on site and surrounding area

Carbon Capture and Sequestration Approaches for NGCC Systems, 12/20/10
20 12/20/2010
2.2 Natural Gas Character istics Natural gas is utilized as the main fuel, and its composition is presented in Exhibit 2-3 [3
Exhibit 2-3 Natural Gas Composition ].
Component Volume Percentage
Methane CH4 93.1
Ethane C2H6 3.2
Propane C3H8 0.7
n-Butane C4H10 0.4
Carbon Dioxide CO2 1.0
Nitrogen N2 1.6
Total 100.0
LHV HHV kJ/kg 47,454 52,581 MJ/scm 34.71 38.46
Btu/lb 20,410 22,600 Btu/scf 932 1,032
Note: Fuel composition is normalized and heating values are calculated
The first year cost of natural gas used in this study is $6.21/MMkJ ($6.55/MMBtu) (2007 cost of natural gas in 2007 dollars). The cost was determined using the following information from the EIA’s 2008 AEO:
• The 2007 East North Central region delivered cost of natural gas to electric utilities in 2006 dollars, $231.47/1000 m3 ($6.55/1000 ft3), was obtained from the AEO 2008 reference case Table 108 and converted to an energy basis, $6.02/MMkJ ($6.35/MMBtu).
• The 2007 cost was escalated to 2007 dollars using the GDP chain-type price index from AEO 2008, resulting in a delivered 2007 price in 2007 dollars of $6.21/MMkJ ($6.55/MMBtu).[4] (Note: The natural gas cost of $6.5478/MMBtu was used in calculations, but only two decimal places are shown in the report.)

Carbon Capture and Sequestration Approaches for NGCC Systems, 12/20/10
21 12/20/2010
3. Natural Gas Combined Cycle Case Per formance Results Five natural gas combined cycle (NGCC) power plant configurations were evaluated and are presented in this section. Each design is based on future developmental technologies, and all except Case 5 consist of two Advanced F-class combustion turbine generators (CTGs), two heat recovery system generators (HRSGs) and one steam turbine generator (STG) in a multi-shaft 2x2x1 configuration. Case 5 is based on Clean Energy System’s (CES) oxy-combustion turbine. However, the case is a modified version because it recycles liquid H2O and steam while the typical CES system recycles only liquid H2O. Also included in this study are NGCC Reference Cases Ref1 and Ref2. Case Ref1 is Case 13 of the Bituminous Baseline (BB) study, while Case Ref2 is Case 14 from the same study [1] using an alternative method to estimate the auxiliary loads for the amine capture plant. The study cases are evaluated with carbon capture, while Cases Ref1 and Ref2 are evaluated without and with carbon capture. Case Ref2 uses an Econamine FG Plus system to capture CO2, while NGCC Cases 1a, 1b, and 1c also use the Econamine process, and Cases 2 and 3 use an MDEA system. Cases 4 and 5 are oxy-combustion cases. The NGCC designs that include Carbon Dioxide Recovery (CDR) have a smaller plant net output resulting from the additional CDR facility auxiliary loads. The sizes of the NGCC designs were determined by the output of the commercially available combustion turbine.
3.1 NGCC CASES This section contains an evaluation of plant designs for NGCC Reference Cases (Ref1 and Ref2) and for new NGCC Cases 1 through 5. Cases Ref1 and Ref2 are similar in design and based on an NGCC plant with a constant thermal input. Both plants use an advanced 7F gas turbine and a single reheat steam cycle of 16.5 MPa/566°C/566°C (2400 psig/1050°F/1050°F). The only difference between the plants is that Case Ref2 includes CO2 capture, while Case Ref1 does not. Case s 1a, 1b, and 1c use exhaust gas recycle to increase the CO2 concentration entering the post-combustion capture process. Case 2 and Case 3 are based on pre-combustion CO2 removal. Case 2 uses an AutoThermal Reformer (ATR) and Case 3 uses a Partial Oxidation Reactor (POX) to generate syngas. Cases 1, 2 and 3 use a steam cycle based on the reference cases. Case 4 is an oxy-combustion process based on using CO2 recycle. This design requires a unique turbine design (compressor pressure ratio = 45) to obtain a similar temperature profile as a 7F frame gas combustion turbine. Due to a higher gas turbine exhaust temperature, a single reheat steam cycle of 16.5 MPa/649°C/649°C (2400pisg/1200°F/1200°F) is used. Case 5 is an oxy-combustion process based on the Clean Energy Systems (CES) design. The working fluid is a mixture CO2/Steam used in a series of turboexpanders for power generation. The working fluid in this design is a mixture of steam and carbon dioxide. For both oxy-combustion cases the CO2 capture is > 99 percent. All new plants cases in the study capture and sequester CO2.
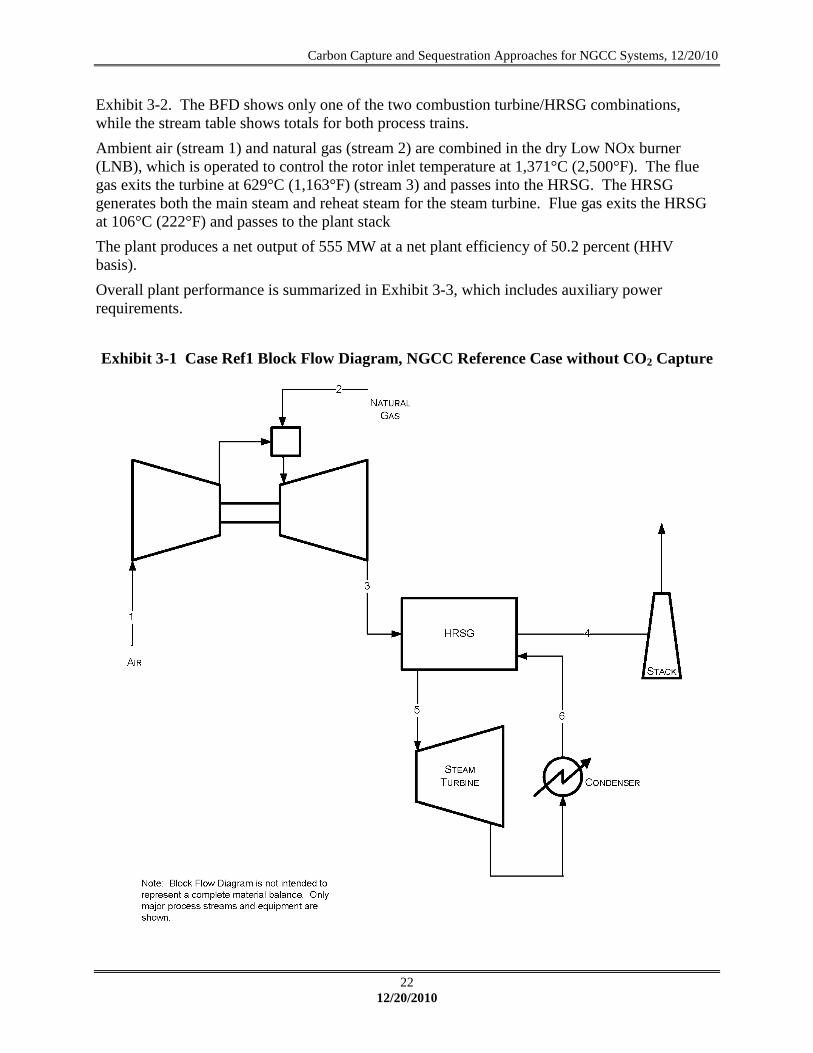
3.1.1 Case Ref1-NGCC Reference Case without CO2 Capture In this section, the NGCC process without CO2 capture is described and represents the non-capture reference case. The system description follows the block flow diagram (BFD) in Exhibit 3-1. A stream table, corresponding to the numbers listed on the BFD, is shown in
Carbon Capture and Sequestration Approaches for NGCC Systems, 12/20/10
22 12/20/2010
Exhibit 3-2. The BFD shows only one of the two combustion turbine/HRSG combinations, while the stream table shows totals for both process trains. Ambient air (stream 1) and natural gas (stream 2) are combined in the dry Low NOx burner (LNB), which is operated to control the rotor inlet temperature at 1,371°C (2,500°F). The flue gas exits the turbine at 629°C (1,163°F) (stream 3) and passes into the HRSG. The HRSG generates both the main steam and reheat steam for the steam turbine. Flue gas exits the HRSG at 106°C (222°F) and passes to the plant stack The plant produces a net output of 555 MW at a net plant efficiency of 50.2 percent (HHV basis). Overall plant performance is summarized in Exhibit 3-3, which includes auxiliary power requirements. Exhibit 3-1 Case Ref1 Block Flow Diagram, NGCC Reference Case without CO2 Capture

Carbon Capture and Sequestration Approaches for NGCC Systems, 12/20/10
23 12/20/2010
Exhibit 3-2 Case Ref1 Stream Table, NGCC Reference Case without CO2 Capture 1 2 3 4 5 6
V-L Mole FractionAr 0.0092 0.0000 0.0089 0.0089 0.0000 0.0000CH4 0.0000 0.9310 0.0000 0.0000 0.0000 0.0000C2H6 0.0000 0.0320 0.0000 0.0000 0.0000 0.0000C3H8 0.0000 0.0070 0.0000 0.0000 0.0000 0.0000C4H10 0.0000 0.0040 0.0000 0.0000 0.0000 0.0000CO 0.0000 0.0000 0.0000 0.0000 0.0000 0.0000CO2 0.0003 0.0100 0.0404 0.0404 0.0000 0.0000H2O 0.0099 0.0000 0.0867 0.0867 1.0000 1.0000N2 0.7732 0.0160 0.7432 0.7432 0.0000 0.0000O2 0.2074 0.0000 0.1209 0.1209 0.0000 0.0000SO2 0.0000 0.0000 0.0000 0.0000 0.0000 0.0000
Total 1.0000 1.0000 1.0000 1.0000 1.0000 1.0000
V-L Flowrate (kgmol/hr) 109,323 4,380 113,831 113,831 21,589 28,545V-L Flowrate (kg/hr) 3,154,735 75,901 3,230,636 3,230,636 388,927 514,240Solids Flowrate (kg/hr) 0 0 0 0 0 0
Temperature (°C) 15 38 629 106 566 38Pressure (MPa, abs) 0.10 3.10 0.11 0.10 16.65 0.01Enthalpy (kJ/kg)A 30.23 46.30 835.81 248.81 3,472.36 160.61Density (kg/m3) 1.2 22.2 0.4 0.9 47.7 992.9V-L Molecular Weight 28.857 17.328 28.381 28.381 18.015 18.015
V-L Flowrate (lbmol/hr) 241,016 9,657 250,954 250,954 47,595 62,930V-L Flowrate (lb/hr) 6,955,000 167,333 7,122,333 7,122,333 857,437 1,133,706Solids Flowrate (lb/hr) 0 0 0 0 0 0
Temperature (°F) 59 100 1,163 222 1,050 101Pressure (psia) 14.7 450.0 15.2 14.7 2,414.7 1.0Enthalpy (Btu/lb)A 13.0 19.9 359.3 107.0 1,492.8 69.1Density (lb/ft3) 0.076 1.384 0.025 0.057 2.977 61.982
Carbon Capture and Sequestration Approaches for NGCC Systems, 12/20/10
24 12/20/2010
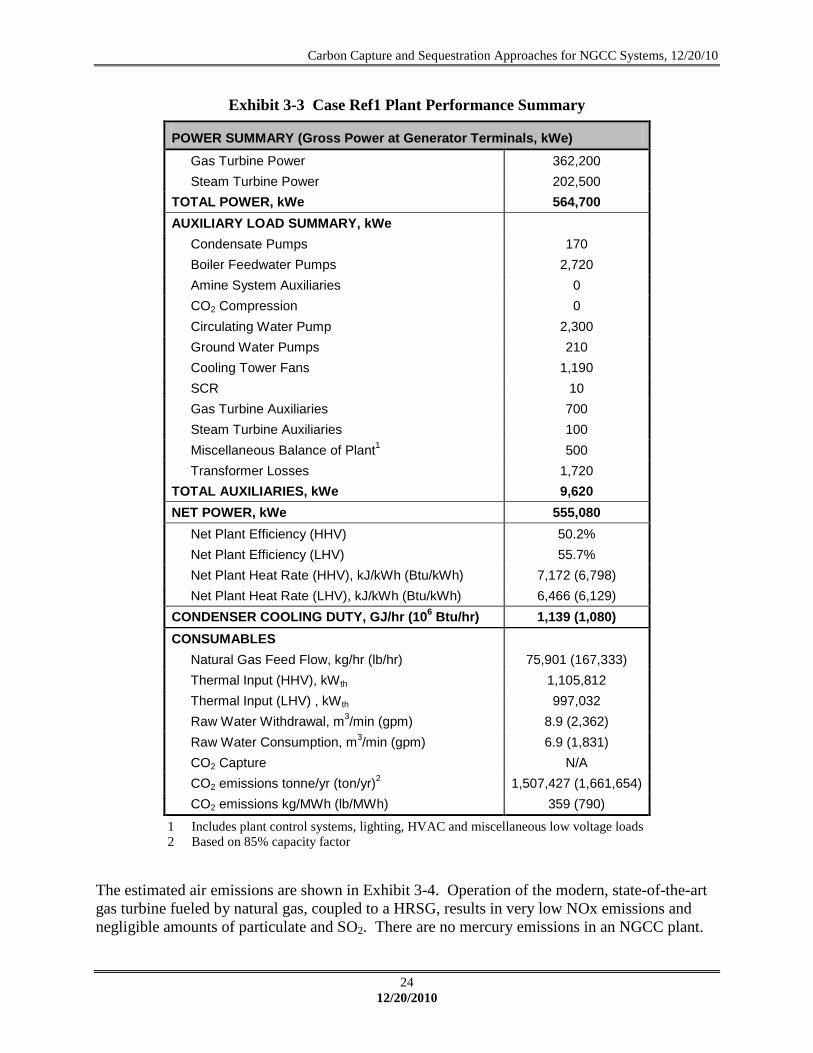
Exhibit 3-3 Case Ref1 Plant Performance Summary
POWER SUMMARY (Gross Power at Generator Terminals, kWe) Gas Turbine Power 362,200 Steam Turbine Power 202,500
TOTAL POWER, kWe 564,700 AUXILIARY LOAD SUMMARY, kWe
Condensate Pumps 170 Boiler Feedwater Pumps 2,720 Amine System Auxiliaries 0 CO2 Compression 0 Circulating Water Pump 2,300 Ground Water Pumps 210 Cooling Tower Fans 1,190 SCR 10 Gas Turbine Auxiliaries 700 Steam Turbine Auxiliaries 100 Miscellaneous Balance of Plant1 500 Transformer Losses 1,720
TOTAL AUXILIARIES, kWe 9,620 NET POWER, kWe 555,080
Net Plant Efficiency (HHV) 50.2% Net Plant Efficiency (LHV) 55.7% Net Plant Heat Rate (HHV), kJ/kWh (Btu/kWh) 7,172 (6,798) Net Plant Heat Rate (LHV), kJ/kWh (Btu/kWh) 6,466 (6,129)
CONDENSER COOLING DUTY, GJ/hr (106 Btu/hr) 1,139 (1,080) CONSUMABLES
Natural Gas Feed Flow, kg/hr (lb/hr) 75,901 (167,333) Thermal Input (HHV), kWth 1,105,812 Thermal Input (LHV) , kWth 997,032 Raw Water Withdrawal, m3/min (gpm) 8.9 (2,362) Raw Water Consumption, m3/min (gpm) 6.9 (1,831) CO2 Capture N/A CO2 emissions tonne/yr (ton/yr)2 1,507,427 (1,661,654) CO2 emissions kg/MWh (lb/MWh) 359 (790)
1 Includes plant control systems, lighting, HVAC and miscellaneous low voltage loads 2 Based on 85% capacity factor
The estimated air emissions are shown in Exhibit 3-4. Operation of the modern, state-of-the-art gas turbine fueled by natural gas, coupled to a HRSG, results in very low NOx emissions and negligible amounts of particulate and SO2. There are no mercury emissions in an NGCC plant.

Carbon Capture and Sequestration Approaches for NGCC Systems, 12/20/10
25 12/20/2010
The low level of NOx production (2.5 ppmvd at 15 percent O2) is achieved by utilizing Selective Catalytic Reduction (SCR).
Exhibit 3-4 Case Ref1 Estimated Air Emissions
kg/GJ (lb/106 Btu)
Tonne/year (ton/year)
85% capacity factor kg/MWh (lb/MWh)
SO2 Negligible Negligible Negligible NOx 0.004 (0.009) 115 (127) 0.027 (0.060) Particulate Negligible Negligible Negligible Hg Negligible Negligible Negligible CO2 50.9 (118.3) 1,507,427 (1,661,654) 359 (790) CO2 net1
365 (804)
1 CO2 emissions based on net power instead of gross power The carbon balance is shown in Exhibit 3-5. The carbon input to the plant consists of carbon in the air and the carbon in the natural gas. Carbon leaves the plant as CO2 through the stack. The percent of total carbon sequestered is defined as the amount of carbon product produced divided by the carbon in the natural gas feedstock, expressed as a percentage.
% Captured = Carbon in Product for Sequestration / Carbon in the Natural gas or
0/54,822 *100 = 0% Exhibit 3-5 Case Ref1 Carbon Balance
Carbon In, kg/hr (lb/hr) Carbon Out, kg/hr (lb/hr) Natural Gas 54,822 (120,863) Stack Gas 55,251 (121,808) Air (CO2) 429 (946) Total 55,251 (121,808) Total 55,251 (121,808)
An overall water balance for the plant is shown in Exhibit 3-6. Raw water is obtained from groundwater (50 percent) and from municipal sources (50 percent). Water demand represents the total amount of water required for a particular process. Some water is recovered within the process and is re-used as internal recycle. Raw water withdrawal is the difference between water demand and internal recycle. The difference between water withdrawal and process water discharge is defined as water consumption and can be represented by the portion of the raw water withdrawn that is evaporated, transpired, incorporated into products or otherwise not returned to the water source from which it was withdrawn. Water consumption represents the net impact of the plant process on the water source balance.

Carbon Capture and Sequestration Approaches for NGCC Systems, 12/20/10
26 12/20/2010
Exhibit 3-6 Case Ref1 Water Balance
Water Use
Water Demand, m3/min (gpm)
Internal Recycle, m3/min (gpm)
Raw Water Withdrawal,
m3/min (gpm)
Process Water
Discharge, m3/min (gpm)
Raw Water Consumption, m3/min (gpm)
Condenser Makeup BFW Makeup
0.1 (23) 0.1 (23)
0.0 (0) 0.1 (23) 0.1 (23)
0.0 (0)
0.1 (23)
Cooling Tower BFW Blowdown
8.9 (2,362) 0.0 (0)
0.1 (23) 0.1 (23)
8.9 (2,339) -0.1 (-23)
2.0 (531)
6.8 (1,808)
Total 9.0 (2,385) 0.1 (23) 8.9 (2,362) 2.0 (531) 6.9 (1,831)
An overall plant energy balance is provided in tabular form in Exhibit 3-7. The power out is the combined combustion turbine and steam turbine power after generator losses.
Exhibit 3-7 Case Ref1 Overall Energy Balance
HHV Sensible + Latent Power Total Heat In GJ/hr (MMBtu/hr)
Natural Gas 3,981 (3,773) 2.7 (2.5) 0 (0) 3,984 (3,776) GT Air 0 (0) 95.4 (90.4) 0 (0) 95 (90) Raw Water Makeup 0 (0) 33.6 (31.9) 0 (0) 34 (32) Auxiliary Power 0 (0) 0 (0) 35 (33) 35 (33) TOTAL 3,981 (3,773) 131.6 (124.8) 35 (33) 4,147 (3,931)
Heat Out GJ/hr (MMBtu/hr) Cooling Tower Blowdown 0 (0) 14.9 (14.2) 0 (0) 15 (14) Stack Gas 0 (0) 804 (762) 0 (0) 804 (762) Condenser 0 (0) 1,141 (1,082) 0 (0) 1,141 (1,082) Process Losses* 0 (0) 154 (146) 0 (0) 154 (146) Power 0 (0) 0.0 (0.0) 2,033 (1,927) 2,033 (1,927) TOTAL 0 (0) 2,114 (2,004) 2,033 (1,927) 4,147 (3,931)
*Process losses including steam turbine, combustion reactions, HRSG, gas turbine, and gas cooling are estimated to match the heat input to the plant.
3.1.2 As previously mentioned, Case Ref2 is a modified version of BB Case 14. The plant configuration for BB Case 14 is the same as Case Ref1 with the exception that a Carbon Dioxide Recovery (CDR) facility was added based on the Fluor Econamine FG PlusSM technology [
Case Ref2–NGCC Reference Case with CO2 Capture
5, 6Exhibit 3-8
]. A typical flow diagram is shown in . The BB Case 14 nominal net output decreased to 474 MW because the combustion turbine output was constant, and the CDR facility significantly increased the auxiliary power load. This auxiliary power load and the reboiler

Carbon Capture and Sequestration Approaches for NGCC Systems, 12/20/10
27 12/20/2010
steam requirement, 1,598 Btu/lbCO2, were estimated by scaling from a Fluor quote provided for an earlier study [7The Case Ref2 modified version of BB Case 14 was developed to include a change to the amine system auxiliary load calculation. The modified amine system auxiliaries were determined by using Thermoflow’s GT Pro software. The auxiliary load increased from 9,600 kW in the BB Case 14 to 16,364 kW for Case Ref2 based on the revised estimate. This modification only affected the performance. No changes were made in the modeling.
].
The process description for Case Ref2 is essentially the same as Case Ref1 with one notable exception, the addition of CO2 capture. A BFD and stream tables are shown in Exhibit 3-9 and Exhibit 3-10 , respectively. Case Ref2 produces a net output of 467 MW and a net plant efficiency of 42.2 percent (HHV basis). Overall performance is summarized in Exhibit 3-11, which includes auxiliary power requirements. For Case Ref2, the CDR facility, including CO2 compression, accounts for over 71 percent of the auxiliary plant load. The circulating water system (circulating water pumps and cooling tower fan) accounts for nearly 15 percent of the auxiliary load, largely due to the high cooling water demand of the CDR facility. High pressure (HP), intermediate pressure (IP), and low pressure (LP) steam streams are produced from their appropriate sections in the HRSG. The temperature and pressure for each steam level are the following:
• HP: 1050°F and 2,415 psia, • IP: 1055°F and 360 psia, and • LP: 537°F and 80 psia
Back pressure on the CT was maintained by an ID fan that is part of the amine unit, refer to Exhibit 3-8. This fan is a significant part of the amine auxiliaries accounting for more than 75 percent of the power.

Carbon Capture and Sequestration Approaches for NGCC Systems, 12/20/10
28 12/20/2010
Exhibit 3-8 Fluor Econamine FG Plus Typical Flow Diagram

Carbon Capture and Sequestration Approaches for NGCC Systems, 12/20/10
29 12/20/2010
Exhibit 3-9 Case Ref2 Block Flow Diagram, NGCC Reference Case with CO2 Capture

Carbon Capture and Sequestration Approaches for NGCC Systems, 12/20/10
30 12/20/2010
Exhibit 3-10 Case Ref2 Stream Table, NGCC Reference Case with CO2 Capture 1 2 3 4 5 6 7 8 9 10 11
V-L Mole FractionAr 0.0092 0.0000 0.0089 0.0089 0.0098 0.0000 0.0000 0.0000 0.0000 0.0000 0.0000CH4 0.0000 0.9310 0.0000 0.0000 0.0000 0.0000 0.0000 0.0000 0.0000 0.0000 0.0000C2H6 0.0000 0.0320 0.0000 0.0000 0.0000 0.0000 0.0000 0.0000 0.0000 0.0000 0.0000C3H8 0.0000 0.0070 0.0000 0.0000 0.0000 0.0000 0.0000 0.0000 0.0000 0.0000 0.0000C4H10 0.0000 0.0040 0.0000 0.0000 0.0000 0.0000 0.0000 0.0000 0.0000 0.0000 0.0000CO 0.0000 0.0000 0.0000 0.0000 0.0000 0.0000 0.0000 0.0000 0.0000 0.0000 0.0000CO2 0.0003 0.0100 0.0404 0.0404 0.0045 0.9893 1.0000 0.0000 0.0000 0.0000 0.0000H2O 0.0099 0.0000 0.0867 0.0867 0.0339 0.0107 0.0000 1.0000 1.0000 1.0000 1.0000N2 0.7732 0.0160 0.7432 0.7432 0.8187 0.0000 0.0000 0.0000 0.0000 0.0000 0.0000O2 0.2074 0.0000 0.1209 0.1209 0.1332 0.0000 0.0000 0.0000 0.0000 0.0000 0.0000SO2 0.0000 0.0000 0.0000 0.0000 0.0000 0.0000 0.0000 0.0000 0.0000 0.0000 0.0000
Total 1.0000 1.0000 1.0000 1.0000 1.0000 1.0000 1.0000 1.0000 1.0000 1.0000 1.0000
V-L Flowrate (kgmol/hr) 109,323 4,380 113,831 113,831 103,333 4,185 4,140 17,887 17,887 21,589 13,482V-L Flowrate (kg/hr) 3,154,735 75,901 3,230,636 3,230,636 2,933,892 183,013 182,203 322,243 322,243 388,927 242,889Solids Flowrate (kg/hr) 0 0 0 0 0 0 0 0 0 0 0
Temperature (°C) 15 38 629 143 30 21 51 152 151 566 38Pressure (MPa, abs) 0.10 3.10 0.11 0.10 0.10 0.16 15.27 0.51 0.49 16.65 0.01Enthalpy (kJ/kg)A 30.23 46.30 835.81 288.61 83.96 26.65 -164.90 2,746.79 635.72 3,472.36 160.61Density (kg/m3) 1.2 22.2 0.4 0.8 1.1 2.9 653.5 2.7 915.8 47.7 992.9V-L Molecular Weight 28.857 17.328 28.381 28.381 28.393 43.731 44.010 18.015 18.015 18.015 18.015
V-L Flowrate (lbmol/hr) 241,016 9,657 250,954 250,954 227,809 9,226 9,127 39,435 39,435 47,595 29,724V-L Flowrate (lb/hr) 6,955,000 167,333 7,122,333 7,122,333 6,468,125 403,474 401,689 710,425 710,425 857,437 535,480Solids Flowrate (lb/hr) 0 0 0 0 0 0 0 0 0 0 0
Temperature (°F) 59 100 1,163 290 85 69 124 306 304 1,050 101Pressure (psia) 14.7 450.0 15.2 14.7 14.7 23.5 2,214.7 73.5 71.0 2,414.7 1.0Enthalpy (Btu/lb)A 13.0 19.9 359.3 124.1 36.1 11.5 -70.9 1,180.9 273.3 1,492.8 69.1Density (lb/ft3) 0.076 1.384 0.025 0.052 0.071 0.183 40.800 0.169 57.172 2.977 61.982

Carbon Capture and Sequestration Approaches for NGCC Systems, 12/20/10
31 12/20/2010
Exhibit 3-11 Case Ref2 Plant Performance Summary
POWER SUMMARY (Gross Power at Generator Terminals, kWe) Gas Turbine Power 362,200 Steam Turbine Power 148,800
TOTAL POWER, kWe 511,000 AUXILIARY LOAD SUMMARY, kWe
Condensate Pumps 80 Boiler Feedwater Pumps 2,710 Amine System Auxiliaries 16,364 CO2 Compression 15,200 Circulating Water Pump 4,360 Ground Water Pumps 360 Cooling Tower Fans 2,250 SCR 10 Gas Turbine Auxiliaries 700 Steam Turbine Auxiliaries 100 Miscellaneous Balance of Plant1 500 Transformer Losses 1,580
TOTAL AUXILIARIES, kWe 44,214 NET POWER, kWe 466,786
Net Plant Efficiency (HHV) 42.2% Net Plant Efficiency (LHV) 46.8% Net Plant Heat Rate (HHV), kJ/kWh (Btu/kWh) 8,528 (8,083) Net Plant Heat Rate (LHV), kJ/kWh (Btu/kWh) 7,689 (7,288)
CONDENSER COOLING DUTY, GJ/hr (106 Btu/hr) 528 (500) CONSUMABLES
Natural Gas Feed Flow, kg/hr (lb/hr) 75,901 (167,333) Thermal Input (HHV), kWth 1,105,812 Thermal Input (LHV) , kWth 997,032 Raw Water Withdrawal, m3/min (gpm) 15.1 (3,980) Raw Water Consumption, m3/min (gpm) 11.3 (2,985) CO2 Capture 90.7% CO2 emissions tonne/yr (ton/yr)2 141,875 (156,391) CO2 emissions kg/MWh (lb/MWh) 40 (87)
1 Includes plant control systems, lighting, HVAC and miscellaneous low voltage loads 2 Based on 85% capacity factor
The estimated air emissions for both plants are shown in Exhibit 3-12. Operation of the modern, state-of-the-art gas turbine fueled by natural gas, coupled to a HRSG, results in very low NOx emissions and negligible amounts of particulate and SO2. There are no mercury emissions in an NGCC plant.

Carbon Capture and Sequestration Approaches for NGCC Systems, 12/20/10
32 12/20/2010
The low level of NOx production (2.5 ppmvd at 15 percent O2) is achieved by utilizing a Selective Catalytic Reduction (SCR). The Econamine FG+ system is assumed to remove 90 percent of the CO2 in the flue gas.
Exhibit 3-12 Case Ref2 Estimated Air Emissions
kg/GJ (lb/106 Btu)
Tonne/year (ton/year)
85% capacity factor kg/MWh (lb/MWh)
SO2 Negligible Negligible Negligible NOx 0.004 (0.008) 115 (127) 0.027 (0.060) Particulate Negligible Negligible Negligible Hg Negligible Negligible Negligible CO2 5.1 (11.8) 141,875 (156,391) 40 (87) CO2 net1
43 (96)
1 CO2 emissions based on net power instead of gross power For both plants, the carbon balance is shown in Exhibit 3-13. The carbon input to the plant consists of carbon in the air and the carbon in the natural gas. Carbon leaves the plant as CO2 in the stack gas and CO2 product. The percent of total carbon sequestered is defined as the amount of carbon product produced divided by the carbon in the natural gas feedstock, expressed as a percentage.
% Captured = Carbon in Product for Sequestration / Carbon in the Natural gas or
49,726/54,822 *100 = 90.7% Exhibit 3-13 Case Ref2 Carbon Balance
Carbon In, kg/hr (lb/hr) Carbon Out, kg/hr (lb/hr) Natural Gas 54,822 (120,863) Stack Gas 5,525 (12,808) Air (CO2) 429 (946) CO2 Product 49,726 (109,628) Total 55,251 (121,808) Total 55,251 (121,808)
An overall water balance for both plants is shown in Exhibit 3-14. Raw water is obtained from groundwater (50 percent) and from municipal sources (50 percent). Water demand represents the total amount of water required for a particular process. Some water is recovered within the process and is re-used as internal recycle. Raw water withdrawal is the difference between water demand and internal recycle. The difference between water withdrawal and process water discharge is defined as water consumption and can be represented by the portion of the raw water withdrawn that is evaporated, transpired, incorporated into products or otherwise not returned to the water source from which it was withdrawn. Water consumption represents the net impact of the plant process on the water source balance.

Carbon Capture and Sequestration Approaches for NGCC Systems, 12/20/10
33 12/20/2010
Exhibit 3-14 Case Ref2 Water Balance
Water Use
Water Demand, m3/min (gpm)
Internal Recycle, m3/min (gpm)
Raw Water Withdrawal,
m3/min (gpm)
Process Water
Discharge, m3/min (gpm)
Raw Water Consumption, m3/min (gpm)
Econamine 0.04 (12) 0.0 (0) 0.04 (12) 0.0 (0) 0.04 (12) Condenser Makeup
BFW Makeup 0.1 (23) 0.1 (23)
0.0 (0) 0.1 (23) 0.1 (23)
0.0 (0)
0.1 (23)
Cooling Tower BFW Blowdown Flue Gas Condensate
17.0 (4,477)
2.0 (520) 0.1 (23) 1.9 (497)
15.0 (3,958) -0.1 (-23) -1.9 (-497)
3.8 (1,007)
11.2 (2,951)
CO2 Product Condensate 0.03 (8) -0.03 (-8)
Total 17.1 (4,512) 2.0 (528) 15.1 (3,992) 3.8 (1,007) 11.3 (2,985)
An overall plant energy balance is provided in tabular form in Exhibit 3-15. The power out is the combined combustion turbine and steam turbine power after generator losses.
Exhibit 3-15 Case Ref2 Overall Energy Balance
HHV Sensible + Latent Power Total Heat In GJ/hr (MMBtu/hr)
Natural Gas 3,981 (3,773) 2.7 (2.5) 0 (0) 3,984 (3,776) GT Air 0 (0) 95.4 (90.4) 0 (0) 95 (90) Raw Water Makeup 0 (0) 56.7 (53.7) 0 (0) 57 (54) Auxiliary Power 0 (0) 0 (0) 159 (151) 159 (151) TOTAL 3,981 (3,773) 154.7 (146.6) 159 (151) 4,295 (4,071)
Heat Out GJ/hr (MMBtu/hr) CO2 0 (0) -30.0 (-28.5) 0 (0) -30.0 (-28.5) Cooling Tower Blowdown 0 (0) 28.3 (26.8) 0 (0) 28.3 (26.8) Econamine Losses 0 (0) 1,010.1 (957.4) 0 (0) 1,010.1 (957.4) CO2 Compression Intercooling 0 (0) 84.9 (80.5) 0 (0) 84.9 (80.5)
Stack Gas 0 (0) 246 (233) 0 (0) 246 (233) Condenser 0 (0) 532 (504) 0 (0) 532 (504) Process Losses* 0 (0) 584 (553) 0 (0) 584 (553) Power 0 (0) 0.0 (0.0) 1,840 (1,744) 2,033 (1,927) TOTAL 0 (0) 2,455 (2,327) 1,840 (1,744) 4,295 (4,071)
*Process losses including steam turbine, combustion reactions, HRSG, gas turbine, and gas cooling are estimated to match the heat input to the plant.

Carbon Capture and Sequestration Approaches for NGCC Systems, 12/20/10
34 12/20/2010
3.2 CASE 1-POST-COMBUSTION FLUE GAS RECYCLE AND AMINE ABSORPTION CASES This case includes NGCC plants with 35 percent exhaust gas recycle (EGR) and amine absorption (Case 1a); 50 percent EGR and amine absorption (Case 1b); and 35 percent EGR, amine absorption, and a lower amine system reboiler steam requirement (Case 1c). The systems consist of two gas turbines, one steam turbine, and two HRSGs. The amine system used is monoethanolamine (MEA). Performance of the MEA system is based on in house performance estimates obtained from Fluor in 2005 [7]. A block flow diagram and stream tables for Cases 1a, 1b, and 1c are shown in Exhibit 3-17, Exhibit 3-18, Exhibit 3-19, and Exhibit 3-20, respectively. These cases were modeled after Case Ref2. The only addition was the EGR back to the combustion turbine (CT). The amine system auxiliaries were calculated using Thermoflow’s GT Pro software in the same manner as for Case Ref2. This notion will be discussed further in the performance section. The objective of this plant configuration is to decrease the volume and increase the CO2 concentration of the flue gas treated by the amine CO2 capture system. This task is accomplished using EGR from downstream of the HRSG to the CT compressor suction. CO2 concentrations of 6.7 and 8.8 volume percent are achieved by recycling 35 and 50 percent of the flue gas, respectively. The CO2 concentration in the reference case without EGR was 4.0 volume percent. A constant CT compressor volumetric flow rate was maintained by reducing the ambient air intake as required.
Since 2005, Fluor has made process improvements that reduce the reboiler steam requirements and possibly the auxiliary electrical requirement. Case 1c uses an improved version of the process with the reboiler steam requirement reduced to 1,310 Btu/lbCO2 [8
For a conventional NGCC system, the EGR will reduce the oxygen concentration of the flue gas from about 12 percent to about 8 and 4 volume percent for EGRs of 35 and 50 percent, respectively.
]. In all other respects Case 1c is identical to Case 1a.
The oxygen content of the gas stream exiting the CT combustor will be lower than the flue gas because additional air is added downstream of the combustor. Modeling for this study does not include detailed modeling of the CT combustor. However, the oxygen concentration of the gas exiting the combustor is calculated in Aspen and results in oxygen concentrations of approximately 5 and 2 percent for EGRs of 35 and 50 percent, respectively. A combustor study conducted by General Electric (GE) [9
Comparing overall plant efficiencies of this study to Case Ref2 reveals a slight improvement. The efficiencies for Cases 1a, 1b, and 1c are 43.2%, 43.5%, and 44.0% (HHV) respectively, compared to 42.2% % (HHV) for Case Ref2. The differences are the addition of the EGR (Cases
] indicates a minimum combustor exhaust oxygen concentration of about 4 percent without a negative impact on the combustor efficiency or CO emissions. Consequently, the 50 percent EGR configuration would not be acceptable, but was retained in this study to see what the impact would be if a combustor could be designed to operate with the lower oxygen concentration. The CO2 capture achieved through the process is 90.5 percent for Cases 1a and 1c and 90.4 percent for Case 1b.

Carbon Capture and Sequestration Approaches for NGCC Systems, 12/20/10
35 12/20/2010
1a, 1b and 1c) and the lower amine system steam requirement (Case 1c only). Exhibit 3-16 shows a comparison between Ref2 and the three configurations of Case 1.
Exhibit 3-16 Cases Ref2, 1a, 1b, and 1c Comparison
Case Efficiency, % HHV
Amine System Inlet
Amine System Auxiliary Power
(kWe)
Reboiler Duty
(Btu/lbCO2)
Steam Turbine Power (kWe) %O2 %CO2
Ref2 42.2% 12.1 4 16,364 1,605 148,800
1a 43.2% 8.3 6.7 10,637 1,577 151,400
1b 43.5% 4.5 8.8 8,182 1,561 155,700
1c 44.0% 8.3 6.7 10,367 1,310 160,200
The results show that increasing the amount of EGR and reducing the Econamine reboiler duty both increase the system efficiency. Case 1a produces a net output of 475 MW at a net plant efficiency of 43.2 percent (HHV), while Case 1b produces a net output of 480 MW at a net plant efficiency of 43.5 percent (HHV). Case 1c’s net output is 483 MW at a net plant efficiency of 44.0 percent (HHV). Overall plant performance for all cases is summarized in Exhibit 3-21. The summary includes auxiliary power requirements. Back pressure on the CT was maintained by an ID fan that is part of the amine unit, refer to Exhibit 3-8. The amine system auxiliaries for all cases (1a, 1b, and 1c) were determined using the results obtained from Case Ref2. Case Ref2’s amine system auxiliaries were estimated using Thermoflow’s GT Pro. The result for Case Ref2 was scaled to obtain the amine system auxiliaries for Cases 1a, 1b, and 1c. The auxiliary loads were determined by the following calculation which accounts for a reduced gas flow rate entering the amine system with EGR: Amine System Auxiliaries (kWe) = Case Ref2 Amine System Auxiliaries*((1-EGR)/100) Therefore, using 35 percent EGR (Cases 1a and 1c): Amine System Auxiliaries = 16,364*((1-35)/100) = 10,637 kWe
For Case 1b, the scaled amine system auxiliaries were 8,182 kW. The gas turbine (GT) power for Cases 1a, 1b, and 1c ranges from 360,000-362,000 kW compared to 362,200 kW for Ref2. The difference between the cases is minimal (approximately one percent), and several possibilities may account for this:
• Working fluid For Case Ref2, there was no recycle returned to the CT. Therefore, the working fluid was combusted fuel and air. For all other cases (1a, 1b, and 1c), the EGR (35 percent or 50 percent) is returned to the CT and mixed with the air. In these cases, the working fluid is a combination of the EGR, combusted fuel and air, therefore producing more CO2 and H2O, but less O2. This new working fluid would have slightly different thermal and physical properties than the working fluid of Case Ref2.

Carbon Capture and Sequestration Approaches for NGCC Systems, 12/20/10
36 12/20/2010
• Modeling anomalies Design specification tolerances may not be sufficiently tight to distinguish the magnitude of difference between the reference case and the EGR cases.

Carbon Capture and Sequestration Approaches for NGCC Systems, 12/20/10
37 12/20/2010
Exhibit 3-17 Cases 1a, 1b, and 1c Block Flow Diagram, Exhaust Gas Recycle and Amine Absorption
Note: Actual process consists of 2 Advanced F-class CTGs, 2 HRSGs, and 1 STG in a multi-shaft 2x2x1 configuration

Carbon Capture and Sequestration Approaches for NGCC Systems, 12/20/10
38 12/20/2010
Exhibit 3-18 Case 1a Stream Table, 35% Exhaust gas recycle and amine absorption 1 2 3 4 5 6 7 8 9 10 11 12 13
V-L Mole FractionAr 0.0092 0.0000 0.0089 0.0089 0.0095 0.0095 0.0102 0.0000 0.0000 0.0000 0.0000 0.0000 0.0000CH4 0.0000 0.9310 0.0000 0.0000 0.0000 0.0000 0.0000 0.0000 0.0000 0.0000 0.0000 0.0000 0.0000C2H6 0.0000 0.0320 0.0000 0.0000 0.0000 0.0000 0.0000 0.0000 0.0000 0.0000 0.0000 0.0000 0.0000C3H8 0.0000 0.0070 0.0000 0.0000 0.0000 0.0000 0.0000 0.0000 0.0000 0.0000 0.0000 0.0000 0.0000C4H10 0.0000 0.0040 0.0000 0.0000 0.0000 0.0000 0.0000 0.0000 0.0000 0.0000 0.0000 0.0000 0.0000CO 0.0000 0.0000 0.0000 0.0000 0.0000 0.0000 0.0000 0.0000 0.0000 0.0000 0.0000 0.0000 0.0000CO2 0.0003 0.0100 0.0631 0.0631 0.0668 0.0668 0.0072 0.9921 1.0000 0.0000 0.0000 0.0000 0.0000H2O 0.0099 0.0000 0.1006 0.1006 0.0480 0.0480 0.0383 0.0079 0.0000 1.0000 1.0000 1.0000 1.0000N2 0.7732 0.0160 0.7492 0.7492 0.7930 0.7930 0.8551 0.0000 0.0000 0.0000 0.0000 0.0000 0.0000O2 0.2074 0.0000 0.0782 0.0782 0.0827 0.0827 0.0892 0.0000 0.0000 0.0000 0.0000 0.0000 0.0000SO2 0.0000 0.0000 0.0000 0.0000 0.0000 0.0000 0.0000 0.0000 0.0000 0.0000 0.0000 0.0000 0.0000
Total 1.0000 1.0000 1.0000 1.0000 1.0000 1.0000 1.0000 1.0000 1.0000 1.0000 1.0000 1.0000 1.0000
V-L Flowrate (kgmol/hr) 69,898 4,350 111,116 111,116 68,236 36,742 63,284 4,133 4,100 17,404 17,404 21,984 13,910V-L Flowrate (kg/hr) 2,017,037 75,374 3,159,551 3,159,551 1,981,833 1,067,140 1,786,041 181,031 180,441 313,543 313,543 396,053 250,589Solids Flowrate (kg/hr) 0 0 0 0 0 0 0 0 0 0 0 0 0
Temperature (°C) 15 38 635 141 32 32 32 21 51 152 151 566 38Pressure (MPa, abs) 0.10 3.10 0.11 0.10 0.10 0.10 0.10 0.16 15.27 0.51 0.49 16.65 0.01Enthalpy (kJ/kg)A 30.22 46.30 871.89 309.68 107.20 107.20 93.61 23.68 -164.90 2,746.79 635.72 3,472.36 160.61Density (kg/m3) 1.2 22.2 0.4 0.8 1.2 1.2 1.1 2.9 653.5 2.7 915.8 47.7 992.9V-L Molecular Weight 28.857 17.328 28.435 28.435 29.044 29.044 28.223 43.804 44.010 18.015 18.015 18.015 18.015
V-L Flowrate (lbmol/hr) 154,098 9,590 244,969 244,969 150,434 81,003 139,517 9,111 9,039 38,370 38,370 48,467 30,666V-L Flowrate (lb/hr) 4,446,805 166,172 6,965,618 6,965,618 4,369,193 2,352,641 3,937,546 399,105 397,804 691,243 691,243 873,147 552,453Solids Flowrate (lb/hr) 0 0 0 0 0 0 0 0 0 0 0 0 0
Temperature (°F) 59 100 1,174 287 90 90 89 69 124 306 304 1,050 101Pressure (psia) 14.7 450.0 15.2 14.7 14.6 14.6 14.7 23.5 2,214.7 73.5 71.0 2,414.7 1.0Enthalpy (Btu/lb)A 13.0 19.9 374.8 133.1 46.1 46.1 40.2 10.2 -70.9 1,180.9 273.3 1,492.8 69.1Density (lb/ft3) 0.076 1.384 0.025 0.052 0.072 0.072 0.071 0.183 40.800 0.169 57.172 2.977 61.982 Note: Flows shown are totals for all process trains

Carbon Capture and Sequestration Approaches for NGCC Systems, 12/20/10
39 12/20/2010
Exhibit 3-19 Case 1b Stream Table, 50% Exhaust Gas Recycle and Amine Absorption 1 2 3 4 5 6 7 8 9 10 11 12 13
V-L Mole FractionAr 0.0092 0.0000 0.0091 0.0091 0.0097 0.0097 0.0106 0.0000 0.0000 0.0000 0.0000 0.0000 0.0000CH4 0.0000 0.9310 0.0000 0.0000 0.0000 0.0000 0.0000 0.0000 0.0000 0.0000 0.0000 0.0000 0.0000C2H6 0.0000 0.0320 0.0000 0.0000 0.0000 0.0000 0.0000 0.0000 0.0000 0.0000 0.0000 0.0000 0.0000C3H8 0.0000 0.0070 0.0000 0.0000 0.0000 0.0000 0.0000 0.0000 0.0000 0.0000 0.0000 0.0000 0.0000C4H10 0.0000 0.0040 0.0000 0.0000 0.0000 0.0000 0.0000 0.0000 0.0000 0.0000 0.0000 0.0000 0.0000CO 0.0000 0.0000 0.0000 0.0000 0.0000 0.0000 0.0000 0.0000 0.0000 0.0000 0.0000 0.0000 0.0000CO2 0.0003 0.0100 0.0829 0.0829 0.0883 0.0883 0.0097 0.9940 1.0000 0.0000 0.0000 0.0000 0.0000H2O 0.0099 0.0000 0.1068 0.1068 0.0480 0.0480 0.0383 0.0060 0.0000 1.0000 1.0000 1.0000 1.0000N2 0.7732 0.0160 0.7591 0.7591 0.8091 0.8091 0.8918 0.0000 0.0000 0.0000 0.0000 0.0000 0.0000O2 0.2074 0.0000 0.0421 0.0421 0.0449 0.0449 0.0495 0.0000 0.0000 0.0000 0.0000 0.0000 0.0000SO2 0.0000 0.0000 0.0000 0.0000 0.0000 0.0000 0.0000 0.0000 0.0000 0.0000 0.0000 0.0000 0.0000
Total 1.0000 1.0000 1.0000 1.0000 1.0000 1.0000 1.0000 1.0000 1.0000 1.0000 1.0000 1.0000 1.0000
V-L Flowrate (kgmol/hr) 54,030 4,366 110,239 110,239 51,716 51,716 46,920 4,135 4,110 17,273 17,273 22,709 14,415V-L Flowrate (kg/hr) 1,559,150 75,648 3,146,979 3,146,979 1,512,180 1,512,182 1,318,934 181,335 180,888 311,175 311,175 409,105 259,682Solids Flowrate (kg/hr) 0 0 0 0 0 0 0 0 0 0 0 0 0
Temperature (°C) 15 38 641 140 32 32 32 21 51 152 151 566 38Pressure (MPa, abs) 0.10 3.10 0.11 0.10 0.10 0.10 0.10 0.16 15.27 0.51 0.49 16.65 0.01Enthalpy (kJ/kg)A 30.22 46.30 892.51 318.02 106.64 106.64 93.99 21.68 -164.90 2,746.79 635.72 3,472.36 160.61Density (kg/m3) 1.2 22.2 0.4 0.8 1.2 1.2 1.1 2.9 653.5 2.7 915.8 47.7 992.9V-L Molecular Weight 28.857 17.328 28.547 28.547 29.240 29.240 28.110 43.854 44.010 18.015 18.015 18.015 18.015
V-L Flowrate (lbmol/hr) 119,116 9,625 243,035 243,035 114,015 114,015 103,441 9,116 9,061 38,080 38,080 50,064 31,779V-L Flowrate (lb/hr) 3,437,337 166,774 6,937,902 6,937,902 3,333,786 3,333,791 2,907,751 399,776 398,789 686,022 686,022 901,922 572,500Solids Flowrate (lb/hr) 0 0 0 0 0 0 0 0 0 0 0 0 0
Temperature (°F) 59 100 1,186 284 90 90 89 69 124 306 304 1,050 101Pressure (psia) 14.7 450.0 15.2 14.7 14.6 14.6 14.7 23.5 2,214.7 73.5 71.0 2,414.7 1.0Enthalpy (Btu/lb)A 13.0 19.9 383.7 136.7 45.8 45.8 40.4 9.3 -70.9 1,180.9 273.3 1,492.8 69.1Density (lb/ft3) 0.076 1.384 0.025 0.053 0.073 0.073 0.070 0.184 40.800 0.169 57.172 2.977 61.982 Note: Flows shown are totals for all process trains

Carbon Capture and Sequestration Approaches for NGCC Systems, 12/20/10
40 12/20/2010
Exhibit 3-20 Case 1c Stream Table, 35% Exhaust Gas Recycle, Lower Amine Steam Requirement, & Amine Absorption 1 2 3 4 5 6 7 8 9 10 11 12 13
V-L Mole FractionAr 0.0092 0.0000 0.0089 0.0089 0.0095 0.0095 0.0102 0.0000 0.0000 0.0000 0.0000 0.0000 0.0000CH4 0.0000 0.9310 0.0000 0.0000 0.0000 0.0000 0.0000 0.0000 0.0000 0.0000 0.0000 0.0000 0.0000C2H6 0.0000 0.0320 0.0000 0.0000 0.0000 0.0000 0.0000 0.0000 0.0000 0.0000 0.0000 0.0000 0.0000C3H8 0.0000 0.0070 0.0000 0.0000 0.0000 0.0000 0.0000 0.0000 0.0000 0.0000 0.0000 0.0000 0.0000C4H10 0.0000 0.0040 0.0000 0.0000 0.0000 0.0000 0.0000 0.0000 0.0000 0.0000 0.0000 0.0000 0.0000CO 0.0000 0.0000 0.0000 0.0000 0.0000 0.0000 0.0000 0.0000 0.0000 0.0000 0.0000 0.0000 0.0000CO2 0.0003 0.0100 0.0631 0.0631 0.0668 0.0668 0.0072 0.9921 1.0000 0.0000 0.0000 0.0000 0.0000H2O 0.0099 0.0000 0.1006 0.1006 0.0480 0.0480 0.0383 0.0079 0.0000 1.0000 1.0000 1.0000 1.0000N2 0.7732 0.0160 0.7492 0.7492 0.7930 0.7930 0.8551 0.0000 0.0000 0.0000 0.0000 0.0000 0.0000O2 0.2074 0.0000 0.0782 0.0782 0.0827 0.0827 0.0892 0.0000 0.0000 0.0000 0.0000 0.0000 0.0000SO2 0.0000 0.0000 0.0000 0.0000 0.0000 0.0000 0.0000 0.0000 0.0000 0.0000 0.0000 0.0000 0.0000
Total 1.0000 1.0000 1.0000 1.0000 1.0000 1.0000 1.0000 1.0000 1.0000 1.0000 1.0000 1.0000 1.0000
V-L Flowrate (kgmol/hr) 69,898 4,350 111,116 111,116 68,236 36,742 63,284 4,133 4,100 14,461 14,461 21,984 16,388V-L Flowrate (kg/hr) 2,017,037 75,374 3,159,551 3,159,551 1,981,833 1,067,140 1,786,041 181,031 180,441 260,516 260,516 396,053 295,240Solids Flowrate (kg/hr) 0 0 0 0 0 0 0 0 0 0 0 0 0
Temperature (°C) 15 38 635 135 32 32 32 21 51 152 151 566 38Pressure (MPa, abs) 0.10 3.10 0.11 0.10 0.10 0.10 0.10 0.16 15.27 0.51 0.49 16.65 0.01Enthalpy (kJ/kg)A 30.22 46.30 871.89 302.98 107.20 107.20 93.61 23.68 -164.90 2,746.79 635.72 3,472.36 160.61Density (kg/m3) 1.2 22.2 0.4 0.9 1.2 1.2 1.1 2.9 653.5 2.7 915.8 47.7 992.9V-L Molecular Weight 28.857 17.328 28.435 28.435 29.044 29.044 28.223 43.804 44.010 18.015 18.015 18.015 18.015
V-L Flowrate (lbmol/hr) 154,098 9,590 244,969 244,969 150,434 81,003 139,517 9,111 9,039 31,881 31,881 48,467 36,130V-L Flowrate (lb/hr) 4,446,805 166,172 6,965,618 6,965,618 4,369,193 2,352,641 3,937,546 399,105 397,804 574,340 574,340 873,147 650,893Solids Flowrate (lb/hr) 0 0 0 0 0 0 0 0 0 0 0 0 0
Temperature (°F) 59 100 1,174 275 90 90 89 69 124 306 304 1,050 101Pressure (psia) 14.7 450.0 15.2 14.7 14.6 14.6 14.7 23.5 2,214.7 73.5 71.0 2,414.7 1.0Enthalpy (Btu/lb)A 13.0 19.9 374.8 130.3 46.1 46.1 40.2 10.2 -70.9 1,180.9 273.3 1,492.8 69.1Density (lb/ft3) 0.076 1.384 0.025 0.053 0.072 0.072 0.071 0.183 40.800 0.169 57.172 2.977 61.982 Note: Flows shown are totals for all process trains

Carbon Capture and Sequestration Approaches for NGCC Systems, 12/20/10
41 12/20/2010
The estimated air emissions are shown in Exhibit 3-22. Operation of the modern, state-of-the-art gas turbine fueled by natural gas, coupled to a HRSG, results in very low NOx emissions and negligible amounts of particulate and SO2. There are no mercury emissions in an NGCC plant. The low level of NOx production (2.5 ppmvd at 15 percent O2) is achieved by utilizing Selective Catalytic Reduction (SCR). The Econamine FG+ system removed 90 percent of the CO2 in the flue gas. The carbon balance is shown in Exhibit 3-23. The carbon input to the plant consists of carbon in the air and the carbon in the natural gas. Carbon leaves the plant as CO2 in the stack gas and CO2 product. The percent of total carbon sequestered is defined as the amount of carbon product produced divided by the carbon in the natural gas feedstock, expressed as a percentage.
% Captured = Carbon in Product for Sequestration / Carbon in the Natural gas or
49,245/54,442 *100 = 90.5% (1a) 49,367/54,639 *100 = 90.4% (1b) 49,245/54,442 *100 = 90.5% (1c)
An overall water balance for the plant is shown in Exhibit 3-24. Raw water is obtained from groundwater (50 percent) and from municipal sources (50 percent). Water demand represents the total amount of water required for a particular process. Some water is recovered within the process and is re-used as internal recycle. Raw water withdrawal is the difference between water demand and internal recycle. The difference between water withdrawal and process water discharge is defined as water consumption and can be represented by the portion of the raw water withdrawn that is evaporated, transpired, incorporated into products or otherwise not returned to the water source from which it was withdrawn. Water consumption represents the net impact of the plant process on the water source balance. An overall plant energy balance is provided in tabular form in Exhibit 3-25. The power out is the combined combustion turbine and steam turbine power after generator losses.

Carbon Capture and Sequestration Approaches for NGCC Systems, 12/20/10
42 12/20/2010
Exhibit 3-21 Case 1a, 1b, and 1c Plant Performance Summary POWER SUMMARY (Gross Power at Generator Terminals, kWe) Case 1a 1b 1c
Gas Turbine Power 361,600 359,800 361,600 Steam Turbine Power 151,400 155,700 160,200
TOTAL POWER, kWe 513,000 515,500 521,800 AUXILIARY LOAD SUMMARY, kWe
Condensate Pumps 80 90 100 Boiler Feedwater Pumps 2,750 2,840 2,750 Amine System (MEA) Auxiliaries 10,637 8,182 10,637 CO2 Compression 14,910 14,950 14,910 Circulating Water Pump 4,110 4,150 4,310 Ground Water Pumps 340 340 360 Cooling Tower Fans 2,120 2,140 2,230 SCR 10 10 10 Gas Turbine Auxiliaries 1,000 1,000 1,000 Steam Turbine Auxiliaries 100 100 100 Miscellaneous Balance of Plant1 500 500 500 Transformer Losses 1,640 1,640 1,670
TOTAL AUXILIARIES, kWe 38,197 35,942 38,577 Plant Performance NET POWER, kWe 474,803 479,558 483,223
Net Plant Efficiency (HHV) 43.2% 43.5% 44.0% Net Plant Efficiency (LHV) 48.0% 48.3% 48.8% Net Plant Heat Rate (HHV), kJ/kWh (Btu/kWh)
8,326 (7,892)
8,274 7,842)
8,181 (7,754)
Net Plant Heat Rate (LHV), kJ/kWh (Btu/kWh)
7,507 (7,115)
7,460 (7,070)
7,376 (6,991)
CONDENSER COOLING DUTY, GJ/hr (106 Btu/hr) 549 (520) 570 (540) 654 (620)
CONSUMABLES Natural Gas Feed Flow, kg/hr (lb/hr)
75,374 (166,172)
75,648 (166,774)
75,374 (166,172)
Thermal Input (HHV), kWth 1,098,140 1,102,121 1,098,140 Thermal Input (LHV) , kWth 990,114 993,704 990,114 Raw Water Withdrawal, m3/min (gpm) 14.2 (3,743) 14.1 (3,731) 14.9 (3,946) Raw Water Consumption, m3/min (gpm) 10.6 (2,804) 10.5 (2,783) 11.2 (2,961) CO2 Capture 90.5% 90.4% 90.5% CO2 emissions tonne/yr (ton/yr)2
149,285 (164,558)
149,654 (164,966)
149,285 (164,558)
CO2 emissions kg/MWh (lb/MWh) 39 (86) 39 (86) 38 (85) 1 Includes plant control systems, lighting, HVAC and miscellaneous low voltage loads 2 Based on 85% capacity factor

Carbon Capture and Sequestration Approaches for NGCC Systems, 12/20/10
43 12/20/2010
Exhibit 3-22 Cases 1a, 1b, and 1c Estimated Air Emissions
kg/GJ
(lb/106 Btu) Tonne/year (ton/year) 85% capacity factor
kg/MWh (lb/MWh)
Case 1a 1b 1c 1a 1b 1c 1a 1b 1c SO2 Negligible Negligible Negligible Negligible Negligible Negligible Negligible Negligible Negligible
NOx 0.003 (0.008)
0.003 (0.008)
0.003 (0.008) 102 (112) 102 (113) 102 (112) 0.027
(0.059) 0.027
(0.059) 0.026
(0.058) Particulate Negligible Negligible Negligible Negligible Negligible Negligible Negligible Negligible Negligible Hg Negligible Negligible Negligible Negligible Negligible Negligible Negligible Negligible Negligible
CO2 5.1 (11.8) 5.1 (11.8) 5.1 (11.8) 149,285 (164,558)
149,654 (164,966)
149,285 (164,558) 39 (86) 39 (86) 38 (85)
CO2 net1
42 (93) 42 (92) 41 (91)
1 CO2 emissions based on net power instead of gross power
Exhibit 3-23 Cases 1a, 1b, and 1c Carbon Balances Carbon In, kg/hr (lb/hr) Carbon Out, kg/hr (lb/hr)
Case 1a 1b 1c 1a 1b 1c
Natural Gas 54,442 (120,024)
54,639 (120,459)
54,442 (120,024) Stack Gas 5,472
(12,063) 5,485
(12,093) 5,472
(12,063)
Air (CO2) 275 (607) 213 (469) 275 (607) CO2 Product 49,245 (108,567)
49,367 (108,836)
49,245 (108,567)
Total 54,717 (120,631)
54,852 (120,928)
54,717 (120,631) Total 54,717
(120,631) 54,852
(120,928) 54,717
(120,631)

Carbon Capture and Sequestration Approaches for NGCC Systems, 12/20/10
44 12/20/2010
Exhibit 3-24 Cases 1a, 1b, and 1c Water Balances
Water Use Water Demand, m3/min (gpm)
Internal Recycle, m3/min (gpm)
Raw Water Withdrawal, m3/min (gpm)
Process Water Discharge,
m3/min (gpm)
Raw Water Consumption, m3/min (gpm)
1a 1b 1c 1a 1b 1c 1a 1b 1c 1a 1b 1c 1a 1b 1c Econamine 0.04
(12) 0.04 (12)
0.04 (12)
0 (0) 0 (0) 0 (0) 0.04 (12)
0.04 (12)
0.04 (12)
0 (0) 0 (0) 0 (0) 0.04 (12)
0.04 (12)
0.04 (12)
Condenser Makeup
0.09 (23)
0.09 (23)
0.09 (23)
0 (0) 0 (0) 0 (0) 0.09 (23)
0.09 (23)
0.09 (23)
0 (0) 0 (0) 0 (0) 0.09 (23)
0.09 (23)
0.09 (23)
BFW Makeup
0.09 (23)
0.09 (23)
0.09 (23)
0 (0) 0 (0) 0 (0) 0.09 (23)
0.09 (23)
0.09 (23)
0 (0) 0 (0) 0 (0)
Cooling Tower
16.01 (4,229)
16.16 (4,270)
16.78 (4,432)
1.9 (510)
2.1 (564)
1.9 (510)
14.08 (3,719)
14.0 (3,706)
14.84 (3,921)
3.6 (951)
3.6 (960)
3.8 (997)
10.48 (2,767)
10.4 (2,746)
11.07 (2,925)
BFW Blowdown
0 (0) 0 (0) 0 (0) 0.1 (23)
0.09 (23)
0.1 (23)
-0.09 (-23)
-0.09 (-23)
-0.09 (-23)
0 (0) 0 (0) 0 (0)
Flue Gas Condensate
0 (0) 0 (0) 0 (0) 1.8 (488)
2.0 (541)
1.8 (488)
-1.85 (-488)
-2.0 (-541)
-1.85 (-488)
0 (0) 0 (0) 0 (0)
CO2 Product Condensate
0 (0) 0 (0) 0 (0) 0 (3) 0 (2) 0 (3) -0.01 (-3)
-0 (-2)
-0.01 (-3)
0 (0) 0 (0) 0 (0)
Total 16.1 (4,251)
16.3 (4,293)
16.9 (4,454)
1.93 (510)
2.13 (564)
1.93 (510)
14.2 (3,741)
14.1 (3,729)
14.9 (3,944)
3.6 (951)
3.6 (960)
3.8 (997)
10.61 (2,802)
10.5 (2,781)
11.20 (2,959)

Carbon Capture and Sequestration Approaches for NGCC Systems, 12/20/10
45 12/20/2010
Exhibit 3-25 Cases 1a, 1b, and 1c Overall Energy Balances HHV Sensible + Latent Power Total Case 1a 1b 1c 1a 1b 1c 1a 1b 1c 1a 1b 1c
Heat In GJ/hr (MMBtu/hr) Natural Gas 3,953
(3,747) 3,968
(3,761) 3,953
(3,747) 2.6
(2.5) 2.7
(2.5) 2.6
(2.5) 3,956
(3,750) 3,970
(3,763) 3,956
(3,750) GT Air 61.0
(57.8) 47.1
(44.7) 61.0
(57.8) 61
(58) 47
(45) 61
(58) Raw Water Makeup 53.3
(50.5) 53.1
(50.3) 56.1
(53.2) 53
(50) 53
(50) 56
(53) Auxiliary Power 138
(130) 129
(123) 139
(132) 138
(130) 129
(123) 139
(132) TOTAL 3,953
(3,747) 3,968
(3,761) 3,953
(3,747) 116.9
(110.8) 102.9 (97.5)
119.7 (113.5)
138 (130)
129 (123)
139 (132)
4,208 (3,988)
4,200 (3,981)
4,212 (3,992)
Heat Out GJ/hr (MMBtu/hr) CO2 -29.8
(-28.2) -29.8
(-28.3) -29.8
(-28.2) -30
(-28) -30
(-28) -30
(-28) Cooling Tower Blowdown
26.7 (25.4)
27.0 (25.6)
28.0 (26.6)
27 (25)
27 (26)
28 (27)
Combustion Turbine Heat Loss
54.9 (52.0)
54.9 (52.0)
54.9 (52.0)
55 (52)
55 (52)
55 (52)
Recycle/Econamine Precooler
636.6 (603.3)
661.6 (627.1)
615.4 (583.3)
637 (603)
662 (627)
615 (583)
Econamine Losses 726.2 (688.3)
712.0 (674.9)
614.2 (582.2)
726 (688)
712 (675)
614 (582)
CO2 Compression Intercooling
83.6 (79.2)
83.8 (79.4)
83.6 (79.2)
84 (79)
84 (79)
84 (79)
Stack Gas 167 (158)
124 (118)
167 (158)
167 (158)
124 (118)
167 (158)
Condenser 549 (520)
569 (540)
649 (615)
549 (520)
569 (540)
649 (615)
Process Losses* 147 (139)
141 (134)
151 (143)
147 (139)
141 (134)
151 (143)
Power 1,847 (1,750)
1,856 (1,759)
1,878 (1,780)
1,847 (1,750)
1,856 (1,759)
1,878 (1,780)
TOTAL 2,361 (2,238)
2,344 (2,222)
2,333 (2,212)
1,847 (1,750)
1,856 (1,759)
1,878 (1,780)
4,208 (3,988)
4,200 (3,981)
4,212 (3,992)
*Process losses including steam turbine, combustion reactions, HRSG, gas turbine, and gas cooling are estimated to match the heat input to the plant.

Carbon Capture and Sequestration Approaches for NGCC Systems, 12/20/10
46 12/20/2010
3.3 CASE 2-PRE-COMBUSTION AUTO-THERMAL REFORMING WITH AMINE ABSORPTION CO2 SEPARATION This case is an NGCC plant with an auto-thermal reformer and pre-combustion CO2 capture via amine absorption. Auto thermal reforming is partial oxidation followed by thermal and catalytic-steam reforming. The process is shown by the following reactions: [10,11Partial oxidation:
]
CH4 + ½ O2 ↔ CO + 2H2
CnH2n+2 + 2n O2 ↔ nCO + (n+1)H2
Reforming process: CH4 + H2O ↔ CO + 3H2 CnH2n+2 + nH2O ↔ nCO + (2n+1)H2 CnH2n+2 + 2nH2O ↔ nCO2 + (2n+2)H2
Water Gas Shift (WGS):
CO + H2O ↔ CO2 + H2 (CO shift reaction) Where n = an integer The system consists of two gas turbines, two HRSGs, and one steam turbine. It was modeled after an air-fired Integrated Gasification Combined Cycle (IGCC) system because the ATR acts like a gasifier in an IGCC system. The amine system used is methyl diethanolamine (MDEA). To improve the kinetics of the CO2 reaction with MDEA, activators, such as piperazine, are mixed with the MDEA. To predict the performance of an MDEA system, use of Optimized Gas Treating’s (OGT) ProTreat software was attempted, but found to be inadequate. Performance predictions using ProTreat with MDEA alone were not in line with published results. After several attempts to get OGT to resolve the problem, the MDEA system performance based on an IEA publication was used [12
For this case, two published studies were used as a point of reference: Kvamsdal, et al. [
]. Values used include CO2 removal of 91.7 percent, reboiler steam of 198 Btu/lb acid gas, cooling water of 8.30 lb H2O/lb acid gas, and auxiliary load of 16.5 kWh/ton acid gas.
11] and Corradetti, et al. [10]. Corradetti, et al. investigated three different plant variations. The difference between the three is the way the streams entering the reformer are preheated. The “Reference Case” is provided with only one heat exchanger. GT exhaust gases are used to preheat the natural gas and the steam. In the supplementary firing configuration, exhaust gas temperature is increased by supplementary firing and two heat exchangers are employed. For the gas-gas configuration, the heat exchangers utilize the hot syngas leaving the reformer. Therefore, this hot syngas preheats the natural gas and steam instead of the exhaust gas. Also they ran each variation at two different temperatures: 1,562°F and 1,742°F. The system described in their study consisted of no extra pressurization of the air to the ATR and a
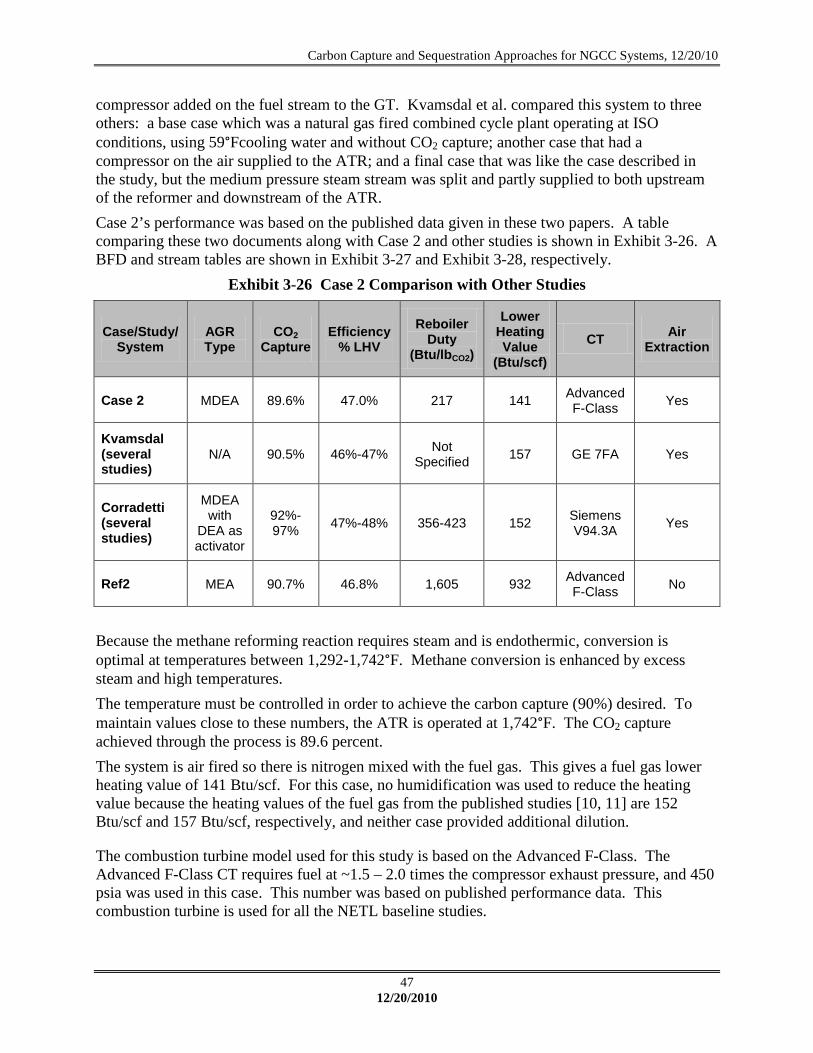
Carbon Capture and Sequestration Approaches for NGCC Systems, 12/20/10
47 12/20/2010
compressor added on the fuel stream to the GT. Kvamsdal et al. compared this system to three others: a base case which was a natural gas fired combined cycle plant operating at ISO conditions, using 59°Fcooling water and without CO2 capture; another case that had a compressor on the air supplied to the ATR; and a final case that was like the case described in the study, but the medium pressure steam stream was split and partly supplied to both upstream of the reformer and downstream of the ATR. Case 2’s performance was based on the published data given in these two papers. A table comparing these two documents along with Case 2 and other studies is shown in Exhibit 3-26. A BFD and stream tables are shown in Exhibit 3-27 and Exhibit 3-28, respectively.
Exhibit 3-26 Case 2 Comparison with Other Studies
Case/Study/System
AGR Type
CO2 Capture
Efficiency % LHV
Reboiler Duty
(Btu/lbCO2)
Lower Heating Value
(Btu/scf)
CT Air Extraction
Case 2 MDEA 89.6% 47.0% 217 141 Advanced F-Class Yes
Kvamsdal (several studies)
N/A 90.5% 46%-47% Not Specified 157 GE 7FA Yes
Corradetti (several studies)
MDEA with
DEA as activator
92%-97% 47%-48% 356-423 152 Siemens
V94.3A Yes
Ref2 MEA 90.7% 46.8% 1,605 932 Advanced F-Class No
Because the methane reforming reaction requires steam and is endothermic, conversion is optimal at temperatures between 1,292-1,742°F. Methane conversion is enhanced by excess steam and high temperatures. The temperature must be controlled in order to achieve the carbon capture (90%) desired. To maintain values close to these numbers, the ATR is operated at 1,742°F. The CO2 capture achieved through the process is 89.6 percent. The system is air fired so there is nitrogen mixed with the fuel gas. This gives a fuel gas lower heating value of 141 Btu/scf. For this case, no humidification was used to reduce the heating value because the heating values of the fuel gas from the published studies [10, 11] are 152 Btu/scf and 157 Btu/scf, respectively, and neither case provided additional dilution.
The combustion turbine model used for this study is based on the Advanced F-Class. The Advanced F-Class CT requires fuel at ~1.5 – 2.0 times the compressor exhaust pressure, and 450 psia was used in this case. This number was based on published performance data. This combustion turbine is used for all the NETL baseline studies.

Carbon Capture and Sequestration Approaches for NGCC Systems, 12/20/10
48 12/20/2010
The study by Kvamsdal, et al. [11] is based on a GE 7FA which is older and smaller than the Advanced F-Class and requires a fuel pressure of only 300 psia. The study by Corradetti, et al. [10] uses a Siemens V94.3A combustion turbine but no fuel pressure is listed. For this study, extraction air for the ATR is 16 percent of the CT compressor capacity. This amount is somewhat higher when compared to the maximum normally allowed for a 7F combustion turbine but was assumed to be within possible limits for advanced turbines operating with hydrogen rich fuels. The ATR outlet stream is at a pressure of 253 psia. After the water gas shift and the MDEA carbon dioxide removal sections, the clean hydrogen rich fuel gas stream is at a pressure of 178 psia. In order to provide fuel gas at the necessary pressure for the CT combustor, a fuel compressor was added to the fuel gas entering the CT to increase the pressure to 450 psia.
It is worth noting that the two published studies obtained all of the ATR air from CT compressor extraction. Corradetti [10] pressurized the fuel gas to achieve the required pressure while Kvamsdal [11] looked at both boosting the air pressure to the ATR and boosting the fuel gas pressure. Boosting the fuel gas pressure resulted in an efficiency of 1.2 absolute percentage points higher efficiency than boosting the extraction air for combustion. Kvamsdal used 13.2 percent extraction, which is close to the design value used in this study. Comparing the overall plant efficiency of this study to the published studies reveals similar results. The efficiency in this study is 47.0 percent (LHV basis), whereas published data ranges from 46-48 percent.

Carbon Capture and Sequestration Approaches for NGCC Systems, 12/20/10
49 12/20/2010
Exhibit 3-27 Case 2 Block Flow Diagram, Auto-Thermal Reforming and Amine CO2 Separation
Note: Actual process consists of 2 Advanced F-class CTGs, 2 HRSGs, and 1 STG in a multi-shaft 2x2x1 configuration

Carbon Capture and Sequestration Approaches for NGCC Systems, 12/20/10
50 12/20/2010
Exhibit 3-28 Case 2 Stream Table, Auto-Thermal Reforming and Amine CO2 Separation 1 2 3 4 5 6 7 8 9 10
V-L Mole FractionH2O 0.0099 0.0000 0.0099 1.0000 0.1389 0.1389 0.5494 0.5494 0.4766 0.1846Ar 0.0092 0.0000 0.0092 0.0000 0.0089 0.0089 0.0000 0.0000 0.0000 0.0044CO2 0.0003 0.0100 0.0003 0.0000 0.0055 0.0055 0.0045 0.0045 0.0275 0.0461O2 0.2074 0.0000 0.2074 0.0000 0.1016 0.1016 0.0000 0.0000 0.0000 0.0000N2 0.7732 0.0160 0.7732 0.0000 0.7451 0.7451 0.0072 0.0072 0.0067 0.3673CH4 0.0000 0.9310 0.0000 0.0000 0.0000 0.0000 0.4195 0.4195 0.4194 0.0011CO 0.0000 0.0000 0.0000 0.0000 0.0000 0.0000 0.0000 0.0000 0.0004 0.1057H2 0.0000 0.0000 0.0000 0.0000 0.0000 0.0000 0.0000 0.0000 0.0690 0.2904NH3 0.0000 0.0000 0.0000 0.0000 0.0000 0.0000 0.0000 0.0000 0.0003 0.0003C2H6 0.0000 0.0320 0.0000 0.0000 0.0000 0.0000 0.0144 0.0144 0.0000 0.0000C3H8 0.0000 0.0070 0.0000 0.0000 0.0000 0.0000 0.0032 0.0032 0.0000 0.0000C4H10 0.0000 0.0040 0.0000 0.0000 0.0000 0.0000 0.0018 0.0018 0.0000 0.0000Total 1.0000 1.0000 1.0000 1.0000 1.0000 1.0000 1.0000 1.0000 1.0000 1.0000
V-L Flowrate (kgmol/hr) 109,323 5,481 17,647 6,682 113,477 113,477 12,163 12,163 12,764 37,367V-L Flowrate (kg/hr) 3,154,735 94,971 509,228 120,377 3,089,303 3,089,303 215,348 215,348 215,348 724,576Solids Flowrate (kg/hr) 0 0 0 0 0 0 0 0 0 0
Temperature (°C) 15 38 417 515 632 105 278 482 425 950Pressure (MPa, abs) 0.10 3.10 1.84 1.84 0.11 0.10 1.84 1.84 1.81 1.74Enthalpy (kJ/kg)A 30.23 46.30 447.65 3,499.49 955.35 344.04 1,977.17 2,519.40 2,255.58 2,043.22Density (kg/m3) 1.2 22.2 9.2 5.2 0.4 0.9 7.3 5.2 5.3 3.3V-L Molecular Weight 28.857 17.328 28.857 18.015 27.224 27.224 17.705 17.705 16.872 19.391
V-L Flowrate (lbmol/hr) 241,016 12,083 38,904 14,731 250,175 250,175 26,815 26,815 28,140 82,379V-L Flowrate (lb/hr) 6,955,000 209,375 1,122,656 265,386 6,810,747 6,810,747 474,760 474,760 474,760 1,597,416Solids Flowrate (lb/hr) 0 0 0 0 0 0 0 0 0 0
Temperature (°F) 59 100 783 959 1,169 220 532 900 797 1,742Pressure (psia) 14.7 450.0 267.5 267.5 15.2 14.7 267.5 267.5 262.5 252.5Enthalpy (Btu/lb)A 13.0 19.9 192.5 1,504.5 410.7 147.9 850.0 1,083.1 969.7 878.4Density (lb/ft3) 0.076 1.384 0.576 0.322 0.024 0.055 0.456 0.327 0.330 0.207 Note: Flows shown are totals for all process trains

Carbon Capture and Sequestration Approaches for NGCC Systems, 12/20/10
51 12/20/2010
Exhibit 3-28 Case 2 Stream Table, Auto-Thermal Reforming and Amine CO2 Separation (continued) 11 12 13 14 15 16 17 18 19 20 21 22
V-L Mole FractionH2O 0.1846 0.1846 1.0000 0.1065 0.0047 0.0044 0.0036 0.0036 1.0000 1.0000 0.0062 0.0000Ar 0.0044 0.0044 0.0000 0.0043 0.0047 0.0055 0.0055 0.0055 0.0000 0.0000 0.0004 0.0000CO2 0.0461 0.0461 0.0000 0.1444 0.1609 0.0144 0.0144 0.0144 0.0000 0.0000 0.9821 1.0000O2 0.0000 0.0000 0.0000 0.0000 0.0000 0.0000 0.0000 0.0000 0.0000 0.0000 0.0000 0.0000N2 0.3673 0.3673 0.0000 0.3577 0.3986 0.4678 0.4682 0.4682 0.0000 0.0000 0.0104 0.0000CH4 0.0011 0.0011 0.0000 0.0011 0.0012 0.0014 0.0014 0.0014 0.0000 0.0000 0.0002 0.0000CO 0.1057 0.1057 0.0000 0.0035 0.0039 0.0045 0.0045 0.0045 0.0000 0.0000 0.0004 0.0000H2 0.2904 0.2904 0.0000 0.3823 0.4260 0.5019 0.5023 0.5023 0.0000 0.0000 0.0003 0.0000NH3 0.0003 0.0003 0.0000 0.0003 0.0000 0.0000 0.0000 0.0000 0.0000 0.0000 0.0000 0.0000C2H6 0.0000 0.0000 0.0000 0.0000 0.0000 0.0000 0.0000 0.0000 0.0000 0.0000 0.0000 0.0000C3H8 0.0000 0.0000 0.0000 0.0000 0.0000 0.0000 0.0000 0.0000 0.0000 0.0000 0.0000 0.0000C4H10 0.0000 0.0000 0.0000 0.0000 0.0000 0.0000 0.0000 0.0000 0.0000 0.0000 0.0000 0.0000Total 1.0000 1.0000 1.0000 1.0000 1.0000 1.0000 1.0000 1.0000 1.0000 1.0000 1.0000 1.0000
V-L Flowrate (kgmol/hr) 37,367 37,367 1,003 38,370 34,436 29,223 29,200 29,200 34,254 41,630 5,213 5,120V-L Flowrate (kg/hr) 724,576 724,576 18,069 742,645 671,783 444,216 443,796 443,796 617,098 749,975 227,567 225,312Solids Flowrate (kg/hr) 0 0 0 0 0 0 0 0 0 0 0 0
Temperature (°C) 863 232 515 222 36 31 134 302 566 38 16 50Pressure (MPa, abs) 1.71 1.60 1.84 1.43 1.29 1.22 3.10 3.07 16.65 0.01 0.14 15.27Enthalpy (kJ/kg)A 1,882.06 792.92 3,499.49 604.82 61.44 65.80 267.81 596.89 3,472.33 160.62 17.96 -169.59Density (kg/m3) 3.5 7.4 5.2 6.7 9.8 7.4 13.8 9.7 47.7 992.9 2.5 667.3V-L Molecular Weight 19.391 19.391 18.015 19.355 19.508 15.201 15.198 15.198 18.015 18.015 43.657 44.010
V-L Flowrate (lbmol/hr) 82,379 82,379 2,211 84,591 75,918 64,426 64,375 64,375 75,518 91,778 11,492 11,287V-L Flowrate (lb/hr) 1,597,416 1,597,416 39,836 1,637,253 1,481,028 979,329 978,403 978,403 1,360,469 1,653,412 501,699 496,727Solids Flowrate (lb/hr) 0 0 0 0 0 0 0 0 0 0 0 0
Temperature (°F) 1,585 450 959 431 96 87 274 575 1,050 101 60 121Pressure (psia) 247.5 232.5 267.5 207.5 187.5 177.5 450.0 445.0 2,415.0 1.0 20.0 2,214.7Enthalpy (Btu/lb)A 809.1 340.9 1,504.5 260.0 26.4 28.3 115.1 256.6 1,492.8 69.1 7.7 -72.9Density (lb/ft3) 0.218 0.462 0.322 0.419 0.614 0.459 0.859 0.603 2.977 61.982 0.158 41.660 Note: Flows shown are totals for all process trains

Carbon Capture and Sequestration Approaches for NGCC Systems, 12/20/10
52 12/20/2010
The auto thermal reformer plant produces a net output of 586 MW at a net plant efficiency of 42.4 percent (HHV basis). Overall plant performance is summarized in Exhibit 3-29. The summary includes auxiliary power requirements. The steam turbine power is higher than the reference case due to additional steam available from the shift reactors (interstage heat recovery) and other sources.
Exhibit 3-29 Case 2 Plant Performance Summary POWER SUMMARY (Gross Power at Generator Terminals, kWe)
Gas Turbine Power 384,227 Steam Turbine Power 260,973
TOTAL POWER, kWe 645,200 AUXILIARY LOAD SUMMARY, kWe
Fuel Gas Compression 25,680 CO2 Compression 19,110 Condensate Pumps 250 Boiler Feedwater Pumps 4,220 Amine System (MDEA) Auxiliaries 1,000 Circulating Water Pump 3,430 Ground Water Pumps 400 Cooling Tower Fans 1,770 SCR 10 Gas Turbine Auxiliaries 700 Steam Turbine Auxiliaries 100 Miscellaneous Balance of Plant1 500 Transformer Losses 2,030
TOTAL AUXILIARIES, kWe 59,200 Plant Performance NET POWER, kWe 586,000
Net Plant Efficiency (HHV) 42.4% Net Plant Efficiency (LHV) 47.0% Net Plant Heat Rate (HHV), kJ/kWh (Btu/kWh) 8,500 (8,057) Net Plant Heat Rate (LHV), kJ/kWh (Btu/kWh) 7,664 (7,264)
CONDENSER COOLING DUTY, GJ/hr (106 Btu/hr) 1,340 (1,270) CONSUMABLES
Natural Gas Feed Flow, kg/hr (lb/hr) 94,971 (209,375) Thermal Input (HHV), kWth 1,383,644 Thermal Input (LHV) , kWth 1,247,533 Raw Water Withdrawal, m3/min (gpm) 16.8 (4,430) Raw Water Consumption, m3/min (gpm) 13.8 (3,638) CO2 Capture 89.6% CO2 emissions tonne/yr (ton/yr)2 204,492 (225,414) CO2 emissions kg/MWh (lb/MWh) 43 (94)
1 Includes plant control systems, lighting, HVAC and miscellaneous low voltage loads 2 Based on 85% capacity factor

Carbon Capture and Sequestration Approaches for NGCC Systems, 12/20/10
53 12/20/2010
The estimated air emissions are shown in Exhibit 3-30. Operation of the modern, state-of-the-art gas turbine fueled by natural gas, coupled to a HRSG, results in very low NOx emissions and negligible amounts of particulate and SO2. There are no mercury emissions in an NGCC plant. The low level of NOx production (2.5 ppmvd at 15 percent O2) is achieved by utilizing Selective Catalytic Reduction (SCR).
Exhibit 3-30 Case 2 Estimated Air Emissions
kg/GJ (lb/106 Btu)
Tonne/year (ton/year)
85% capacity factor
kg/MWh (lb/MWh)
SO2 Negligible Negligible Negligible NOx 0.021 (0.048) 770 (848) 0.160 (0.353) Particulate Negligible Negligible Negligible Hg Negligible Negligible Negligible CO2 5.5 (12.8) 204,492 (225,414) 43 (94) CO2 net1
47 (103)
1 CO2 emissions based on net power instead of gross power The carbon balance is shown in Exhibit 3-31. The carbon input to the plant consists of carbon in the air and the carbon in the natural gas. Carbon leaves the plant as CO2 in the stack gas and CO2 product. The percent of total carbon sequestered is defined as the amount of carbon product produced divided by the carbon in the natural gas feedstock, expressed as a percentage.
% Captured = Carbon in Product for Sequestration / Carbon in the Natural gas or
61,491/68,596 *100 = 89.6% Exhibit 3-31 Case 2 Carbon Balance
Carbon In, kg/hr (lb/hr) Carbon Out, kg/hr (lb/hr) Natural Gas 68,596 (151,229) Stack Gas 7,495 (16,524) Air (CO2) 498 (1,099) CO2 Product 61,491 (135,565) Convergence Tolerance* 108 (238) Total 69,095 (152,327) Total 69,095 (152,327)
*by difference An overall water balance for the plant is shown in Exhibit 3-32. Raw water is obtained from groundwater (50 percent) and from municipal sources (50 percent). Water demand represents the total amount of water required for a particular process. Some water is recovered within the process and is re-used as internal recycle. Raw water withdrawal is the difference between water demand and internal recycle. The difference between water withdrawal and process water discharge is defined as water consumption and can be represented by the portion of the raw water withdrawn that is evaporated, transpired, incorporated into products or otherwise not returned to the water source from which it was withdrawn. Water consumption represents the net impact of the plant process on the water source balance.

Carbon Capture and Sequestration Approaches for NGCC Systems, 12/20/10
54 12/20/2010
Exhibit 3-32 Case 2 Water Balance
Water Use
Water Demand, m3/min (gpm)
Internal Recycle, m3/min (gpm)
Raw Water Withdrawal,
m3/min (gpm)
Process Water
Discharge, m3/min (gpm)
Raw Water Consumption, m3/min (gpm)
Condenser Makeup 4.7 (1,253) 0 (0) 4.7 (1,253) 0 (0) 4.7 (1,253) Shift Steam 0.3 (80) 0 (0) 0.3 (80)
ATR Steam 2.01 (531) 0 (0) 2.01 (531) BFW Makeup 2.43 (643) 0 (0) 2.43 (643) Cooling Tower 13.3 (3,523) 1.3 (346) 12.0 (3,177) 3.0 (792) 9.0 (2,385)
BFW Blowdown 0 (0) 0.12 (32) -0.12 (-32) Flue Gas Condensate 0 (0) 1.18 (312) -1.18 (-312) CO2 Product Condensate 0 (0) 0.01 (2) -0.01 (-2) Total 18.1 (4,776) 1.3 (346) 16.8 (4,430) 3.0 (792) 13.8 (3,638)
An overall plant energy balance is provided in tabular form in Exhibit 3-33. The power out is the combined combustion turbine and steam turbine power after generator losses.
Exhibit 3-33 Case 2 Overall Energy Balance
HHV Sensible + Latent Power Total
Heat In GJ/hr (MMBtu/hr) Natural Gas 4,981 (4,721) 3.3 (3.2)
4,984 (4,724)
Ambient Air
323.3 (306.4)
323 (306) Raw Water Makeup
63.1 (59.8)
63 (60)
Auxiliary Power
213 (202) 213 (202) TOTAL 4,981 (4,721) 389.7 (369.4) 213 (202) 5,584 (5,293)
Heat Out GJ/hr (MMBtu/hr) CO2
-38.2 (-36.2)
-38 (-36) Cooling Tower Blowdown
22.3 (21.1)
22 (21)
Combustion Turbine Heat Loss
54.9 (52.0)
55 (52) Stack Gas
1,063 (1,007)
1,063 (1,007)
Condenser
1,345 (1,274)
1,345 (1,274) Non-Condenser Cooling Tower Loads
284 (269)
284 (269)
Process Losses*
531 (503)
531 (503) Power
2,323 (2,202) 2,323 (2,202)
TOTAL
3,261 (3,091) 2,323 (2,202) 5,584 (5,293) *Process losses including steam turbine, combustion reactions, HRSG, gas turbine, and gas cooling are estimated to match the heat input to the plant.

Carbon Capture and Sequestration Approaches for NGCC Systems, 12/20/10
55 12/20/2010
3.4 CASE 3-PRE-COMBUSTION PARTIAL OXIDATION WITH AMINE ABSORPTION CO2 SEPARATION This case is an NGCC plant with high pressure partial oxidation (POX) and pre-combustion CO2 capture via amine absorption. The POX reactor consists of fast exothermic partial oxidation reactions and slow endothermic steam reforming reactions. The reactions are [10, 11]: Partial oxidation:
CH4 + ½ O2 ↔ CO + 2 H2
CnH2n+2 + 2n O2 ↔ nCO + (n+1)H2
Water Gas Shift: CO + H2O ↔ CO2 + H2 (CO shift reaction) Where n = an integer This case is similar to Case 2. The system consists of two gas turbines, two HRSGs, and one steam turbine. The amine system used is methyl diethanolamine (MDEA). A BFD and stream tables are shown in Exhibit 3-34 and Exhibit 3-35, respectively. A study by GE Global (Hoffman et al.) [13] introduces two novel cycles that include a high-pressure syngas generation island where an air-blown, partial oxidation reformer is used to generate syngas from natural gas. CO2 is removed from the shifted syngas using either CO2 absorbing solvents or a CO2 membrane. Since the POX reaction is less pressure dependent than steam-methane reforming reaction, the standard POX reformer can be used at very high pressures without excessive methane-slip. Operation at high-pressure allows smaller downstream units and higher driving forces for CO2 removal [13
Steam to the POX reactor must be controlled to achieve a specified steam to carbon ratio (0.1) and carbon capture level (90 percent). Since there was no published data showing how the steam ratio is affected using a POX, various steam ratios were tested until the amount of methane in the syngas stream was less than one percent. The CO2 capture achieved through the process is 88.9 percent. The systems in the Hoffman, et al. [
]. The POX reactor in this study is operated at 2,102°F and 1,405 psia, which is consistent with Hoffman, et al.’s operating pressure range of 1,160-1,450 psia and operating temperature of 2,102°F. Since natural gas is delivered to the plant at a pipeline pressure of 450 psia, a compressor is used to increase the fuel pressure to 1,430 psia prior to the POX reactor.
13] study were designed to separate 80 percent of the overall CO2 produced in the cycle. For this study, extraction air for the POX is 20 percent of the CT compressor capacity. Since the extraction air flow is higher than normally allowed for the Advanced F-Class combustion turbine, it was assumed that the CT could be redesigned to accommodate 20 percent extraction air.
After CO2 is removed using the MDEA process the fuel gas has a heating value of 129 Btu/scf (LHV), which is in an acceptable range for the CT. However the mass flow rate is insufficient to fully load the F-class turbine, so additional dilution is achieved through humidification. The humidified fuel gas stream has a heating value of 111 Btu/scf (LHV).

Carbon Capture and Sequestration Approaches for NGCC Systems, 12/20/10
56 12/20/2010
Before entering the syngas quench, an expander was used on the outlet stream of the POX reactor to lower the pressure from 1,405 psia to 500 psia to accommodate the CT fuel gas pressure requirement and to recover 98 MW of power. Hoffman, et al. used a low pressure expander (inlet temperature of 644°F) to recover the energy in the syngas prior to combustion.
Comparing overall plant efficiencies of this study to other published studies reveals a slight difference. The efficiency in this study is 45.8 percent (LHV basis); whereas the published value is 47.5 percent (LHV) with a solvent based CO2 separation. The difference is attributed to the following:
• Cooling Water The Hoffman study assumes 46°F cooling water (seawater) compared to 60°F assumed in case 3 [13]. The lower water temperature in the Hoffman study would result in a lower condenser pressure and hence greater energy recovery in the steam turbine.
• Steam conditions
The steam conditions used in this study were 1,050°F and 2,400 psia. Hoffman, et al. [13] did not provide steam conditions for their study. A possible difference in steam conditions could also contribute to the efficiency difference.
• Amount of compressor power The power required for the natural gas compressor and air compressor are significant, 43,620 kW. The power requirements for the natural gas compressor and air compressor are 6,310 kW and 37,300 kW, respectively, which accounts for 56 percent of the total auxiliary loads. If these values were zero, the efficiency (LHV basis) would increase from 45.8 percent to 48.9 percent (both LHV basis). In the Hoffman study, the natural gas supply pressure was 725 psi compared to 450 psia used in this study. The higher natural gas supply pressure would result in a 0.2 percentage point increase in overall net efficiency (45.8 to 46.0 percent, LHV basis). Compressor efficiency was not provided in the Hoffman study and could potentially account for more of the efficiency difference.
• Combustion Turbine Frame Size The Hoffman study used a 9FB gas turbine in the power island while the current study uses a 7FB. The larger 9FB machine results in 0.5 to 0.75 percentage point higher efficiency using natural gas in a simple cycle or combined cycle configuration.
• Type of solvent In Hoffman, et al.’s study, there were two types of CO2 separation methods used: a solvent based CO2 separation unit and a CO2 membrane. The most efficient method was the CO2 membrane. The net efficiency (LHV basis) was 50.7 percent compared to 47.5 percent when chemical absorption was used. However, the type of chemical solvent used was not specified. For this study, the solvent used was MDEA. Alternative solvents may impact efficiency, but investigation of alternatives was beyond the scope of this study.

Carbon Capture and Sequestration Approaches for NGCC Systems, 12/20/10
57 12/20/2010
The high pressure partial oxidation plant produces a net output of 650 MW at a net plant efficiency of 41.3 percent (HHV basis). Overall plant performance is summarized in Exhibit 3-36. The summary includes auxiliary power requirements.
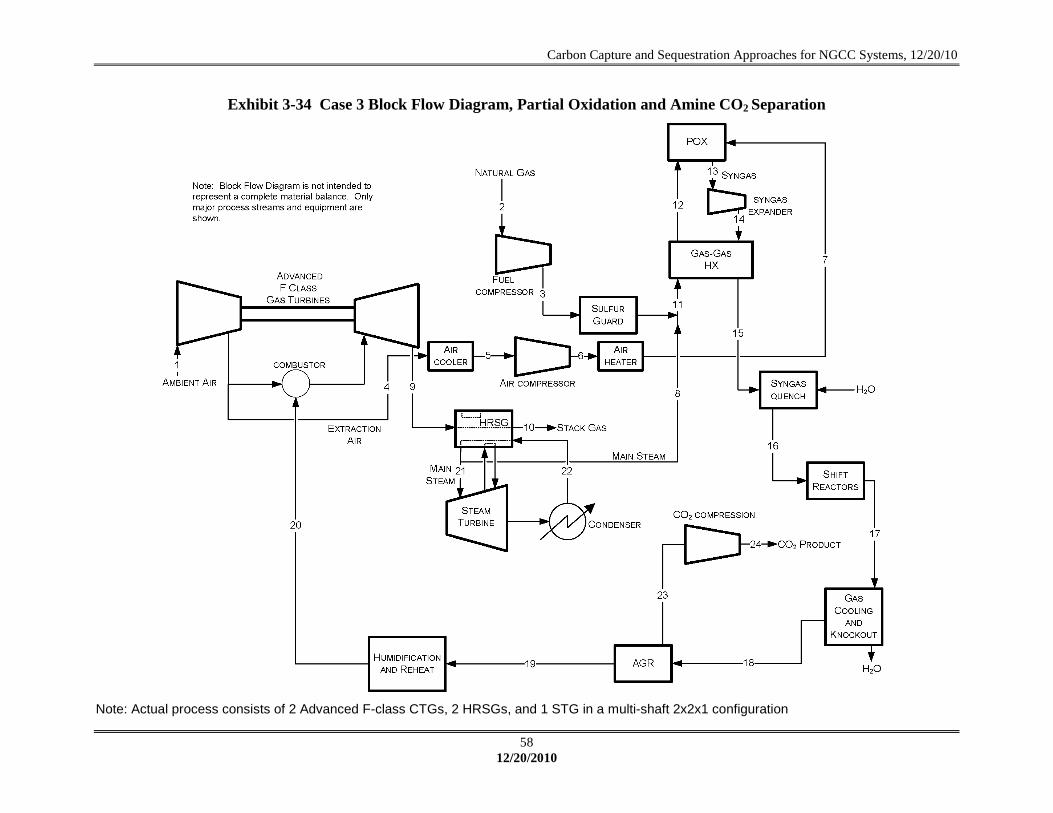
Carbon Capture and Sequestration Approaches for NGCC Systems, 12/20/10
58 12/20/2010
Exhibit 3-34 Case 3 Block Flow Diagram, Partial Oxidation and Amine CO2 Separation
Note: Actual process consists of 2 Advanced F-class CTGs, 2 HRSGs, and 1 STG in a multi-shaft 2x2x1 configuration
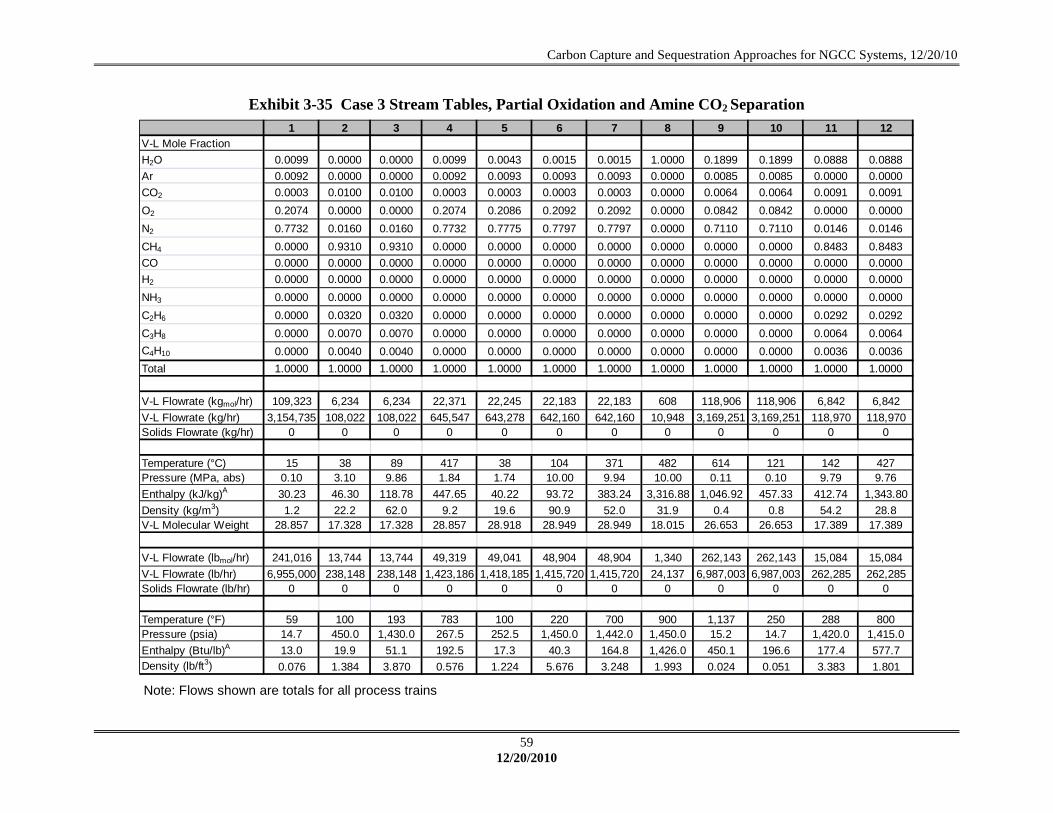
Carbon Capture and Sequestration Approaches for NGCC Systems, 12/20/10
59 12/20/2010
Exhibit 3-35 Case 3 Stream Tables, Partial Oxidation and Amine CO2 Separation 1 2 3 4 5 6 7 8 9 10 11 12
V-L Mole FractionH2O 0.0099 0.0000 0.0000 0.0099 0.0043 0.0015 0.0015 1.0000 0.1899 0.1899 0.0888 0.0888Ar 0.0092 0.0000 0.0000 0.0092 0.0093 0.0093 0.0093 0.0000 0.0085 0.0085 0.0000 0.0000CO2 0.0003 0.0100 0.0100 0.0003 0.0003 0.0003 0.0003 0.0000 0.0064 0.0064 0.0091 0.0091O2 0.2074 0.0000 0.0000 0.2074 0.2086 0.2092 0.2092 0.0000 0.0842 0.0842 0.0000 0.0000N2 0.7732 0.0160 0.0160 0.7732 0.7775 0.7797 0.7797 0.0000 0.7110 0.7110 0.0146 0.0146CH4 0.0000 0.9310 0.9310 0.0000 0.0000 0.0000 0.0000 0.0000 0.0000 0.0000 0.8483 0.8483CO 0.0000 0.0000 0.0000 0.0000 0.0000 0.0000 0.0000 0.0000 0.0000 0.0000 0.0000 0.0000H2 0.0000 0.0000 0.0000 0.0000 0.0000 0.0000 0.0000 0.0000 0.0000 0.0000 0.0000 0.0000NH3 0.0000 0.0000 0.0000 0.0000 0.0000 0.0000 0.0000 0.0000 0.0000 0.0000 0.0000 0.0000C2H6 0.0000 0.0320 0.0320 0.0000 0.0000 0.0000 0.0000 0.0000 0.0000 0.0000 0.0292 0.0292C3H8 0.0000 0.0070 0.0070 0.0000 0.0000 0.0000 0.0000 0.0000 0.0000 0.0000 0.0064 0.0064C4H10 0.0000 0.0040 0.0040 0.0000 0.0000 0.0000 0.0000 0.0000 0.0000 0.0000 0.0036 0.0036Total 1.0000 1.0000 1.0000 1.0000 1.0000 1.0000 1.0000 1.0000 1.0000 1.0000 1.0000 1.0000
V-L Flowrate (kgmol/hr) 109,323 6,234 6,234 22,371 22,245 22,183 22,183 608 118,906 118,906 6,842 6,842V-L Flowrate (kg/hr) 3,154,735 108,022 108,022 645,547 643,278 642,160 642,160 10,948 3,169,251 3,169,251 118,970 118,970Solids Flowrate (kg/hr) 0 0 0 0 0 0 0 0 0 0 0 0
Temperature (°C) 15 38 89 417 38 104 371 482 614 121 142 427Pressure (MPa, abs) 0.10 3.10 9.86 1.84 1.74 10.00 9.94 10.00 0.11 0.10 9.79 9.76Enthalpy (kJ/kg)A 30.23 46.30 118.78 447.65 40.22 93.72 383.24 3,316.88 1,046.92 457.33 412.74 1,343.80Density (kg/m3) 1.2 22.2 62.0 9.2 19.6 90.9 52.0 31.9 0.4 0.8 54.2 28.8V-L Molecular Weight 28.857 17.328 17.328 28.857 28.918 28.949 28.949 18.015 26.653 26.653 17.389 17.389
V-L Flowrate (lbmol/hr) 241,016 13,744 13,744 49,319 49,041 48,904 48,904 1,340 262,143 262,143 15,084 15,084V-L Flowrate (lb/hr) 6,955,000 238,148 238,148 1,423,186 1,418,185 1,415,720 1,415,720 24,137 6,987,003 6,987,003 262,285 262,285Solids Flowrate (lb/hr) 0 0 0 0 0 0 0 0 0 0 0 0
Temperature (°F) 59 100 193 783 100 220 700 900 1,137 250 288 800Pressure (psia) 14.7 450.0 1,430.0 267.5 252.5 1,450.0 1,442.0 1,450.0 15.2 14.7 1,420.0 1,415.0Enthalpy (Btu/lb)A 13.0 19.9 51.1 192.5 17.3 40.3 164.8 1,426.0 450.1 196.6 177.4 577.7Density (lb/ft3) 0.076 1.384 3.870 0.576 1.224 5.676 3.248 1.993 0.024 0.051 3.383 1.801 Note: Flows shown are totals for all process trains

Carbon Capture and Sequestration Approaches for NGCC Systems, 12/20/10
60 12/20/2010
Exhibit 3-35 Case 3 Stream Tables, Partial Oxidation and Amine CO2 Separation (continued) 13 14 15 16 17 18 19 20 21 22 23 24
V-L Mole FractionH2O 0.0800 0.0800 0.0800 0.2485 0.1269 0.0110 0.0104 0.1534 1.0000 1.0000 0.0148 0.0000Ar 0.0056 0.0056 0.0056 0.0046 0.0046 0.0052 0.0060 0.0051 0.0000 0.0000 0.0004 0.0005CO2 0.0202 0.0202 0.0202 0.0165 0.1381 0.1565 0.0140 0.0120 0.0000 0.0000 0.9720 0.9866O2 0.0000 0.0000 0.0000 0.0000 0.0000 0.0000 0.0000 0.0000 0.0000 0.0000 0.0000 0.0000N2 0.4707 0.4707 0.4707 0.3845 0.3845 0.4358 0.5100 0.4363 0.0000 0.0000 0.0115 0.0117CH4 0.0040 0.0040 0.0040 0.0033 0.0033 0.0037 0.0042 0.0036 0.0000 0.0000 0.0007 0.0007CO 0.1519 0.1519 0.1519 0.1241 0.0025 0.0028 0.0033 0.0028 0.0000 0.0000 0.0003 0.0003H2 0.2669 0.2669 0.2669 0.2180 0.3396 0.3849 0.4522 0.3868 0.0000 0.0000 0.0003 0.0003NH3 0.0007 0.0007 0.0007 0.0006 0.0006 0.0000 0.0000 0.0000 0.0000 0.0000 0.0000 0.0000C2H6 0.0000 0.0000 0.0000 0.0000 0.0000 0.0000 0.0000 0.0000 0.0000 0.0000 0.0000 0.0000C3H8 0.0000 0.0000 0.0000 0.0000 0.0000 0.0000 0.0000 0.0000 0.0000 0.0000 0.0000 0.0000C4H10 0.0000 0.0000 0.0000 0.0000 0.0000 0.0000 0.0000 0.0000 0.0000 0.0000 0.0000 0.0000Total 1.0000 1.0000 1.0000 1.0000 1.0000 1.0000 1.0000 1.0000 1.0000 1.0000 1.0000 1.0000
V-L Flowrate (kgmol/hr) 36,931 36,931 36,931 45,207 45,207 39,883 33,948 39,684 17,856 27,956 5,935 5,847V-L Flowrate (kg/hr) 761,130 761,130 761,130 910,235 910,235 814,326 556,731 660,063 321,679 503,636 257,595 256,010Solids Flowrate (kg/hr) 0 0 0 0 0 0 0 0 0 0 0 0
Temperature (°C) 1,150 881 594 232 220 35 31 342 566 38 21 53Pressure (MPa, abs) 9.69 3.45 3.41 3.34 3.17 3.03 2.96 2.79 16.65 0.01 0.14 15.27Enthalpy (kJ/kg)A 1,993.12 1,529.83 1,064.11 899.89 621.70 47.62 53.31 1,038.36 3,472.33 160.61 31.72 -153.69Density (kg/m3) 16.6 7.4 9.7 16.1 15.5 24.5 19.3 9.0 47.7 992.9 2.5 616.2V-L Molecular Weight 20.610 20.610 20.610 20.135 20.135 20.418 16.399 16.633 18.015 18.015 43.404 43.786
V-L Flowrate (lbmol/hr) 81,418 81,418 81,418 99,665 99,665 87,927 74,843 87,488 39,365 61,633 13,084 12,890V-L Flowrate (lb/hr) 1,678,005 1,678,005 1,678,005 2,006,726 2,006,726 1,795,280 1,227,381 1,455,189 709,180 1,110,327 567,899 564,406Solids Flowrate (lb/hr) 0 0 0 0 0 0 0 0 0 0 0 0
Temperature (°F) 2,102 1,617 1,101 450 428 95 87 648 1,050 101 70 127Pressure (psia) 1,405.0 500.0 495.0 485.0 460.0 440.0 430.0 405.0 2,415.0 1.0 20.0 2,214.7Enthalpy (Btu/lb)A 856.9 657.7 457.5 386.9 267.3 20.5 22.9 446.4 1,492.8 69.1 13.6 -66.1Density (lb/ft3) 1.036 0.459 0.604 1.004 0.969 1.530 1.205 0.563 2.977 61.982 0.154 38.470 Note: Flows shown are totals for all process trains

Carbon Capture and Sequestration Approaches for NGCC Systems, 12/20/10
61 12/20/2010
Exhibit 3-36 Case 3 Plant Performance Summary POWER SUMMARY (Gross Power at Generator Terminals, kWe)
Gas Turbine Power 456,776 Steam Turbine Power 172,422 Fuel Gas Expander 97,950
TOTAL POWER, kWe 727,148 AUXILIARY LOAD SUMMARY, kWe
CO2 Compression 21,820 Air Compression 37,300 Natural Gas Compression 6,310 Condensate Pumps 160 Boiler Feedwater Pumps 2,280 Amine System (MDEA) Auxiliaries 1,200 Circulating Water Pump 2,900 Ground Water Pumps 280 Cooling Tower Fans 1,500 SCR 10 Gas Turbine Auxiliaries 700 Steam Turbine Auxiliaries 100 Miscellaneous Balance of Plant1 500 Transformer Losses 2,390
TOTAL AUXILIARIES, kWe 77,450 Plant Performance NET POWER, kWe 649,698
Net Plant Efficiency (HHV) 41.3% Net Plant Efficiency (LHV) 45.8% Net Plant Heat Rate (HHV), kJ/kWh (Btu/kWh) 8,720 (8,265) Net Plant Heat Rate (LHV), kJ/kWh (Btu/kWh) 7,863 (7,452)
CONDENSER COOLING DUTY, GJ/hr (106 Btu/hr) 1,087 (1,030) CONSUMABLES
Natural Gas Feed Flow, kg/hr (lb/hr) 108,022 (238,148) Thermal Input (HHV), kWth 1,573,791 Thermal Input (LHV) , kWth 1,418,975 Raw Water Withdrawal, m3/min (gpm) 14.2 (3,762) Raw Water Consumption, m3/min (gpm) 11.7 (3,091) CO2 Capture 88.9% CO2 emissions tonne/yr (ton/yr)2 247,961 (273,331) CO2 emissions kg/MWh (lb/MWh) 46 (101)
1 Includes plant control systems, lighting, HVAC and miscellaneous low voltage loads 2 Based on 85% capacity factor

Carbon Capture and Sequestration Approaches for NGCC Systems, 12/20/10
62 12/20/2010
The estimated air emissions are shown in Exhibit 3-37. Operation of the modern, state-of-the-art gas turbine fueled by natural gas, coupled to a HRSG, results in very low NOx emissions and negligible amounts of particulate and SO2. There are no mercury emissions in an NGCC plant. The low level of NOx production (2.5 ppmvd at 15 percent O2) is achieved by utilizing Selective Catalytic Reduction (SCR).
Exhibit 3-37 Case 3 Estimated Air Emissions
kg/GJ (lb/106 Btu)
Tonne/year (ton/year)
85% capacity factor
kg/MWh (lb/MWh)
SO2 Negligible Negligible Negligible NOx 0.021 (0.048) 874 (964) 0.161 (0.356) Particulate Negligible Negligible Negligible Hg Negligible Negligible Negligible CO2 5.9 (13.7) 247,961 (273,331) 46 (101) CO2 net1
51 (113)
1 CO2 emissions based on net power instead of gross power The carbon balance is shown in Exhibit 3-38. The carbon input to the plant consists of carbon in the air and the carbon in the natural gas. Carbon leaves the plant as CO2 in the stack gas and CO2 product. The percent of total carbon sequestered is defined as the amount of carbon product produced divided by the carbon in the natural gas feedstock, expressed as a percentage.
% Captured = Carbon in Product for Sequestration / Carbon in the Natural gas or
69,355/78,023 *100 = 88.9%
Exhibit 3-38 Case 3 Carbon Balance Carbon In, kg/hr (lb/hr) Carbon Out, kg/hr (lb/hr)
Natural Gas 78,023 (172,012) Stack Gas 9,088 (20,037) Air (CO2) 517 (1,139) CO2 Product 69,355 (152,901) Convergence Tolerance* 97 (214) Total 78,540 (173,151) Total 78,540 (173,151)
*by difference An overall water balance for the plant is shown in Exhibit 3-39. Raw water is obtained from groundwater (50 percent) and from municipal sources (50 percent). Water demand represents the total amount of water required for a particular process. Some water is recovered within the process and is re-used as internal recycle. Raw water withdrawal is the difference between water demand and internal recycle. The difference between water withdrawal and process water discharge is defined as water consumption and can be represented by the portion of the raw water withdrawn that is evaporated, transpired, incorporated into products or otherwise not returned to the water source from which it was withdrawn. Water consumption represents the net impact of the plant process on the water source balance.
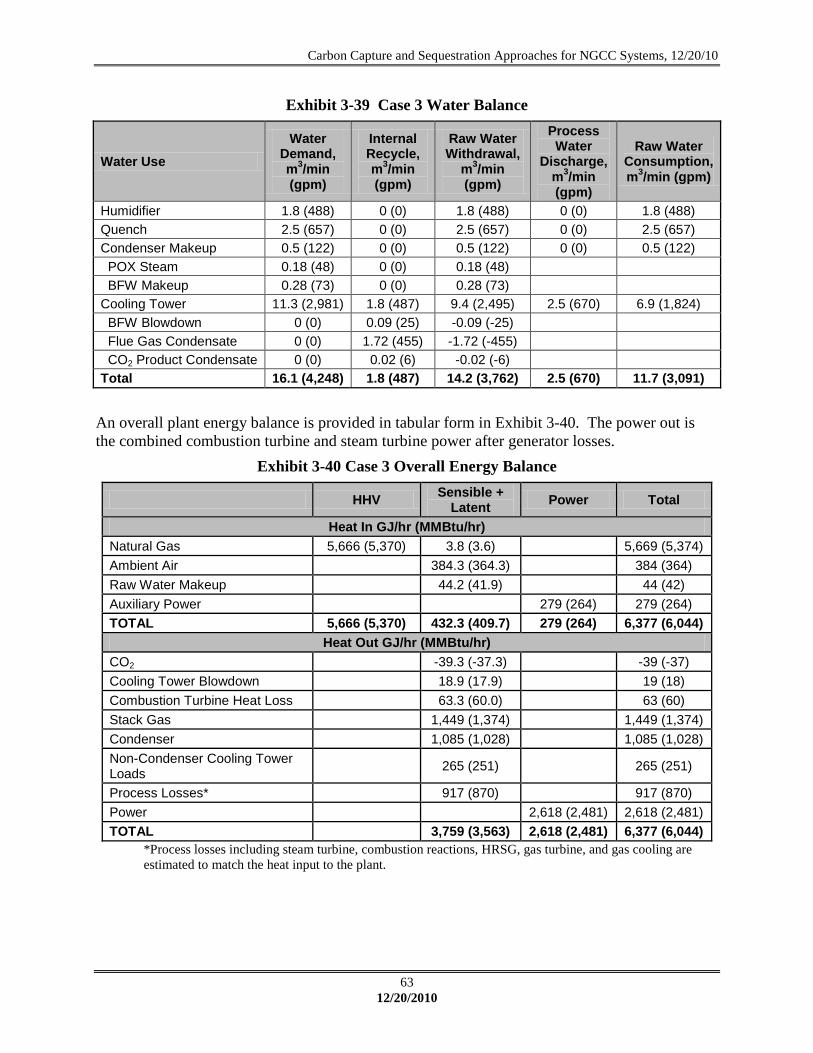
Carbon Capture and Sequestration Approaches for NGCC Systems, 12/20/10
63 12/20/2010
Exhibit 3-39 Case 3 Water Balance
Water Use
Water Demand, m3/min (gpm)
Internal Recycle, m3/min (gpm)
Raw Water Withdrawal,
m3/min (gpm)
Process Water
Discharge, m3/min (gpm)
Raw Water Consumption, m3/min (gpm)
Humidifier 1.8 (488) 0 (0) 1.8 (488) 0 (0) 1.8 (488) Quench 2.5 (657) 0 (0) 2.5 (657) 0 (0) 2.5 (657) Condenser Makeup 0.5 (122) 0 (0) 0.5 (122) 0 (0) 0.5 (122) POX Steam 0.18 (48) 0 (0) 0.18 (48)
BFW Makeup 0.28 (73) 0 (0) 0.28 (73)
Cooling Tower 11.3 (2,981) 1.8 (487) 9.4 (2,495) 2.5 (670) 6.9 (1,824) BFW Blowdown 0 (0) 0.09 (25) -0.09 (-25)
Flue Gas Condensate 0 (0) 1.72 (455) -1.72 (-455)
CO2 Product Condensate 0 (0) 0.02 (6) -0.02 (-6)
Total 16.1 (4,248) 1.8 (487) 14.2 (3,762) 2.5 (670) 11.7 (3,091)
An overall plant energy balance is provided in tabular form in Exhibit 3-40. The power out is the combined combustion turbine and steam turbine power after generator losses.
Exhibit 3-40 Case 3 Overall Energy Balance
HHV Sensible + Latent Power Total
Heat In GJ/hr (MMBtu/hr) Natural Gas 5,666 (5,370) 3.8 (3.6)
5,669 (5,374)
Ambient Air
384.3 (364.3)
384 (364) Raw Water Makeup
44.2 (41.9)
44 (42)
Auxiliary Power
279 (264) 279 (264) TOTAL 5,666 (5,370) 432.3 (409.7) 279 (264) 6,377 (6,044)
Heat Out GJ/hr (MMBtu/hr) CO2
-39.3 (-37.3)
-39 (-37) Cooling Tower Blowdown
18.9 (17.9)
19 (18)
Combustion Turbine Heat Loss
63.3 (60.0)
63 (60) Stack Gas
1,449 (1,374)
1,449 (1,374)
Condenser
1,085 (1,028)
1,085 (1,028) Non-Condenser Cooling Tower Loads
265 (251)
265 (251)
Process Losses*
917 (870)
917 (870) Power
2,618 (2,481) 2,618 (2,481)
TOTAL 3,759 (3,563) 2,618 (2,481) 6,377 (6,044) *Process losses including steam turbine, combustion reactions, HRSG, gas turbine, and gas cooling are estimated to match the heat input to the plant.

Carbon Capture and Sequestration Approaches for NGCC Systems, 12/20/10
64 12/20/2010
3.5 CASE 4 OXY-COMBUSTION WITH CO2 RECYCLE This case is an NGCC plant with oxy-combustion and CO2 capture. It is modeled after Case 1, except the EGR was replaced with CO2 recycle. The system consists of two gas turbines, two HRSGs, and one steam turbine. A BFD and stream tables are shown in Exhibit 3-41 and Exhibit 3-42, respectively. Since there is approximately two percent O2 in the CO2 product stream (stream 9), CO2 purification may be needed because this result does not meet the currently accepted CO2 pipeline specification. (This could be accomplished by adding a catalytic combustor using a small amount of natural gas prior to the CO2 compression section). For this case, two published studies were used as points of reference: Kvamsdal, et al., [14] and Lozza, et al. [15
For Case 4, the working fluid entering the CT is primarily CO2 (due to the high recycle percentage of ~90 percent) and the pressure ratio across the CT is 45.5. Due to this pressure ratio and the working fluid thermodynamic characteristics a new CT would be required. Additionally, the O2 supplied from the ASU needs to be compressed to this high level (~660 psia). The pressure ratio was based on the Lozza, et al. [
]. In the study completed by Kvamsdal, et al., various gas turbine cycles with CO2 capture were explored. The main focus for this current NGCC case was the oxy-combustion cycle. Kvamsdal, et al.’s study supplied an exhaust gas containing mostly H2O and CO2 to the HRSG. A large fraction of the CO2, 90 percent, was recycled back to the combustor in order to keep the TIT at a required level. The overall net efficiency was 47.0 percent (LHV). The study done by Lozza, et al. examined three types of CO2 capture methods: pre-combustion, post-combustion, and oxy-combustion. The main focus for this case is the oxy-combustion cycle. A higher pressure ratio, 45 vs. 18.5 (used in other cases), was used to keep the temperature profile (i.e. TIT and TEX) similar to the 9FB turbine used in the other cases. Lozza, et al.’s study produces a net plant efficiency of 46.2 percent (LHV basis), 96.9 percent CO2 capture, and negligible amounts of CO, unburned hydrocarbons, and NOx.
15] study discussed above after determining that using a pressure ratio corresponding to a 7F frame would result in an exhaust temperature greater than 1,500°F. This notion will be discussed more in the paragraph below. To get the desired total CT net work, ~362 MWe, the amount of CO2 recycle was varied. The turbine inlet temperature (TIT) was set to match the previous cases, TIT = 2,500°F, by adjusting the fuel flow rate while maintaining a fixed combustor heat loss. However, even with a high pressure ratio, the resulting exhaust temperature due to the primarily CO2 working fluid was 1,280°F. To match the 7F CT exhaust temperature (~1,163 °F) it was estimated that the pressure ratio would need to be increased to ~66 which is beyond any practical design. As discussed above, a study by Lozza, et al. [15] investigated the pressure ratio effect on cycle efficiency. The same temperature profile must be reproduced by means of a much higher pressure ratio in order to keep cycle efficiency close to conventional machines’ efficiency. Lozza, et al. [15] used a pressure ratio of 44 versus 18 for a conventional machine. However, it was stated that a full re-design of the machine was required to achieve a high pressure ratio. The pressure ratio used for this study was 45.5 (pressure rise across air compressor). This high pressure ratio resulted in a CT outlet temperature of 1,281°F, which is too high for a conventional HRSG but used nonetheless. The CT outlet temperature in the Lozza, et al. [15] study was 1,137°F. The current study produces steam at a temperature of 1,200°F. A conventional (commercial) steam turbine (ST) can accommodate temperatures up to about 1,100°F. Because of the high temperature, the ST would have to be designed with high temperature alloys.

Carbon Capture and Sequestration Approaches for NGCC Systems, 12/20/10
65 12/20/2010
The CO2 capture achieved through the process is greater than 99 percent, typical of oxy-combustion processes. Alternatives for this study include:
• Two-stage compressor In this study, a one-stage compressor was used in the CT. A two-stage compressor, with an intercooler, could have been used to reduce the exhaust gas temperature. The compressor’s first stage could have included a 3.1 pressure ratio, while the second stage incorporated the balance. • Pressure ratio Instead of having such a high pressure ratio across the CT, the pressure ratio could have been maintained at 18.5, the ratio used in all other cases. If this smaller pressure ratio is used, the firing temperature would be reduced so the exhaust gas temperature is approximately 1,100°F. This option was not considered in this study because it would derate the CT, thus causing a decrease in overall efficiency. • Recuperative cycle Use a pressure ratio of 18.5 which would result in a high outlet temperature. Before the turbine exhaust stream enters the HRSG, a recuperator could be used to preheat the stream exiting the compressor and reducing the fuel requirement in the combustor. After the recuperator, the lower temperature exhaust stream would enter the HRSG. This option was not evaluated but may be looked at in the future.
The overall plant efficiency of this study is comparable to published data. The efficiency in this study is 46.2 percent (LHV), whereas published data show 46.2 percent (LHV) [15] and 47.0 percent (LHV) [14].
There are no estimated air emissions for Case 4 because all the exit gas streams except the ASU vent are included in the CO2 Product for sequestration.

Carbon Capture and Sequestration Approaches for NGCC Systems, 12/20/10
66 12/20/2010
Exhibit 3-41 Case 4 Block Flow Diagram, Oxy-combustion with CO2 Recycle
Note: Actual process consists of 2 Advanced F-class CTGs, 2 HRSGs, and 1 STG in a multi-shaft 2x2x1 configuration

Carbon Capture and Sequestration Approaches for NGCC Systems, 12/20/10
67 12/20/2010
Exhibit 3-42 Case 4 Stream Tables, Oxy-combustion with CO2 Recycle 1 2 3 4 5 6 7 8 9 10 11
V-L Mole FractionAr 0.0092 0.0100 0.0000 0.0000 0.0176 0.0176 0.0200 0.0200 0.0200 0.0000 0.0000CH4 0.0000 0.0000 0.9310 0.9310 0.0000 0.0000 0.0000 0.0000 0.0000 0.0000 0.0000C2H6 0.0000 0.0000 0.0320 0.0320 0.0000 0.0000 0.0000 0.0000 0.0000 0.0000 0.0000C3H8 0.0000 0.0000 0.0070 0.0070 0.0000 0.0000 0.0000 0.0000 0.0000 0.0000 0.0000C4H10 0.0000 0.0000 0.0040 0.0040 0.0000 0.0000 0.0000 0.0000 0.0000 0.0000 0.0000CO 0.0000 0.0000 0.0000 0.0000 0.0000 0.0000 0.0000 0.0000 0.0000 0.0000 0.0000CO2 0.0005 0.0000 0.0100 0.0100 0.8332 0.8332 0.9466 0.9466 0.9471 0.0000 0.0000H2O 0.0101 0.0000 0.0000 0.0000 0.1203 0.1203 0.0006 0.0006 0.0000 1.0000 1.0000N2 0.7729 0.0000 0.0160 0.0160 0.0131 0.0131 0.0148 0.0149 0.0148 0.0000 0.0000O2 0.2074 0.9900 0.0000 0.0000 0.0159 0.0159 0.0180 0.0180 0.0180 0.0000 0.0000SO2 0.0000 0.0000 0.0000 0.0000 0.0000 0.0000 0.0000 0.0000 0.0000 0.0000 0.0000
Total 1.0000 1.0000 1.0000 1.0000 1.0000 1.0000 1.0000 1.0000 1.0000 1.0000 1.0000
V-L Flowrate (kgmol/hr) 43,629 8,877 4,275 4,275 71,594 71,594 4,706 58,314 4,703 23,401 27,523V-L Flowrate (kg/hr) 1,258,955 284,752 74,083 74,083 2,893,317 2,893,317 204,517 2,534,338 204,469 421,581 495,838Solids Flowrate (kg/hr) 0 0 0 0 0 0 0 0 0 0 0
Temperature (°C) 15 114 38 55 694 97 32 32 135 649 38Pressure (MPa, abs) 0.10 4.55 3.10 4.55 0.11 0.10 0.10 0.10 15.27 16.65 0.01Enthalpy (kJ/kg)A 30.57 97.41 46.30 71.73 901.58 222.58 26.56 26.54 36.31 3,692.36 160.61Density (kg/m3) 1.2 45.6 22.2 31.2 0.5 1.3 1.7 1.7 248.6 41.8 992.9V-L Molecular Weight 28.856 32.079 17.328 17.328 40.413 40.413 43.460 43.460 43.475 18.015 18.015
V-L Flowrate (lbmol/hr) 96,185 19,570 9,426 9,426 157,837 157,837 10,375 128,560 10,369 51,591 60,678V-L Flowrate (lb/hr) 2,775,521 627,771 163,325 163,325 6,378,672 6,378,672 450,883 5,587,258 450,777 929,428 1,093,135Solids Flowrate (lb/hr) 0 0 0 0 0 0 0 0 0 0 0
Temperature (°F) 59 238 100 130 1,281 206 90 90 274 1,200 101Pressure (psia) 14.7 660.0 450.0 660.0 15.2 14.7 14.6 14.6 2,214.7 2,414.7 1.0Enthalpy (Btu/lb)A 13.1 41.9 19.9 30.8 387.6 95.7 11.4 11.4 15.6 1,587.4 69.1Density (lb/ft3) 0.076 2.850 1.384 1.948 0.033 0.084 0.108 0.108 15.522 2.610 61.982
Note: Flows shown are for total values for all process trains

Carbon Capture and Sequestration Approaches for NGCC Systems, 12/20/10
68 12/20/2010
The oxy-combustion, CO2 recycle plant produces a net output of 449 MW at a net plant efficiency of 41.6 percent (HHV basis). Overall plant performance is summarized in Exhibit 3-43. The summary includes auxiliary power requirements.
Exhibit 3-43 Case 4 Plant Performance Summary POWER SUMMARY (Gross Power at Generator Terminals, kWe)
Gas Turbine Power 362,100 Steam Turbine Power 223,800
TOTAL POWER, kWe 585,900 AUXILIARY LOAD SUMMARY, kWe
ASU Compression 70,740 Oxygen Compression 28,520 Natural Gas Compression 1,410 CO2 Compression 20,880 Condensate Pumps 160 Boiler Feedwater Pumps 2,900 Amine System (MDEA) Auxiliaries N/A Circulating Water Pump 5,260 Ground Water Pumps 440 Cooling Tower Fans 2,720 SCR 0 Gas Turbine Auxiliaries 1,000 Steam Turbine Auxiliaries 100 Miscellaneous Balance of Plant1 500 Transformer Losses 1,850
TOTAL AUXILIARIES, kWe 136,480 Plant Performance NET POWER, kWe 449,420
Net Plant Efficiency (HHV) 41.6% Net Plant Efficiency (LHV) 46.2% Net Plant Heat Rate (HHV), kJ/kWh (Btu/kWh) 8,646 (8,195) Net Plant Heat Rate (LHV), kJ/kWh (Btu/kWh) 7,795 (7,388)
CONDENSER COOLING DUTY, GJ/hr (106 Btu/hr) 1,139 (1,080) CONSUMABLES
Natural Gas Feed Flow, kg/hr (lb/hr) 74,083 (163,325) Thermal Input (HHV), kWth 1,079,327 Thermal Input (LHV) , kWth 973,152 Raw Water Withdrawal, m3/min (gpm) 12.7 (3,344) Raw Water Consumption, m3/min (gpm) 9.3 (2,454) CO2 Capture >99% CO2 emissions tonne/yr (ton/yr)2 0 CO2 emissions kg/MWh (lb/MWh) 0
1 Includes plant control systems, lighting, HVAC and miscellaneous low voltage loads 2 Based on 85% capacity factor
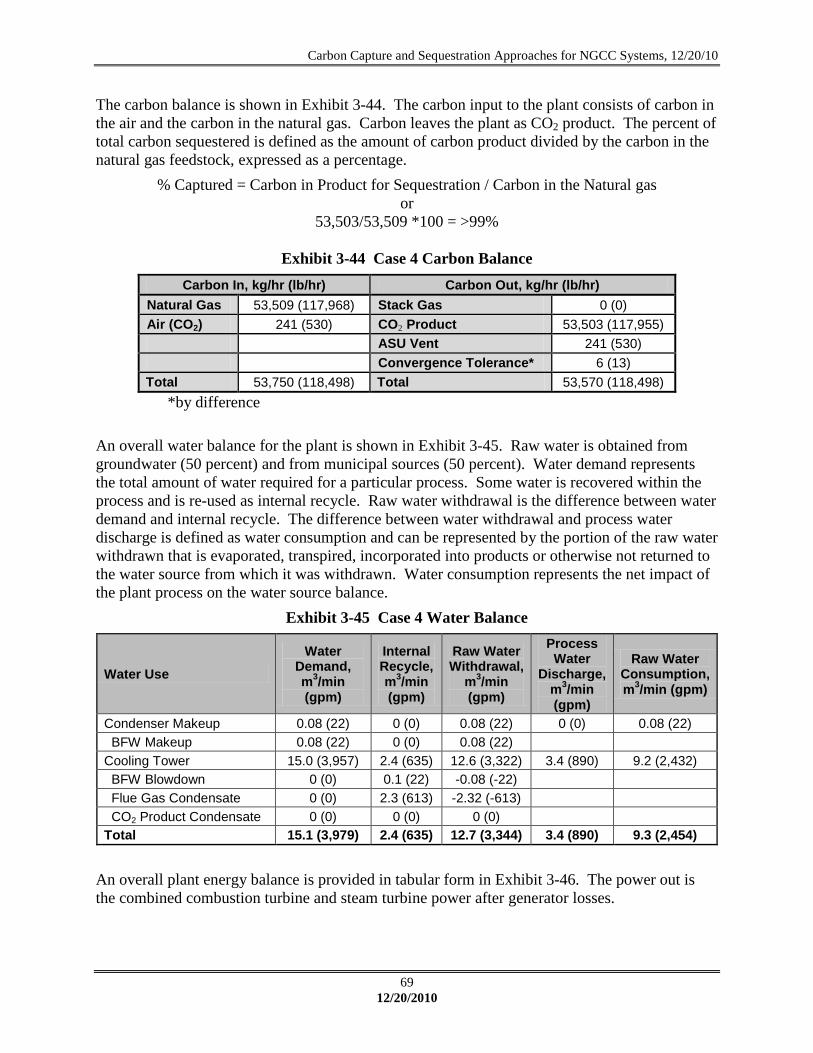
Carbon Capture and Sequestration Approaches for NGCC Systems, 12/20/10
69 12/20/2010
The carbon balance is shown in Exhibit 3-44. The carbon input to the plant consists of carbon in the air and the carbon in the natural gas. Carbon leaves the plant as CO2 product. The percent of total carbon sequestered is defined as the amount of carbon product divided by the carbon in the natural gas feedstock, expressed as a percentage.
% Captured = Carbon in Product for Sequestration / Carbon in the Natural gas or
53,503/53,509 *100 = >99%
Exhibit 3-44 Case 4 Carbon Balance Carbon In, kg/hr (lb/hr) Carbon Out, kg/hr (lb/hr)
Natural Gas 53,509 (117,968) Stack Gas 0 (0) Air (CO2) 241 (530) CO2 Product 53,503 (117,955) ASU Vent 241 (530) Convergence Tolerance* 6 (13) Total 53,750 (118,498) Total 53,570 (118,498)
*by difference An overall water balance for the plant is shown in Exhibit 3-45. Raw water is obtained from groundwater (50 percent) and from municipal sources (50 percent). Water demand represents the total amount of water required for a particular process. Some water is recovered within the process and is re-used as internal recycle. Raw water withdrawal is the difference between water demand and internal recycle. The difference between water withdrawal and process water discharge is defined as water consumption and can be represented by the portion of the raw water withdrawn that is evaporated, transpired, incorporated into products or otherwise not returned to the water source from which it was withdrawn. Water consumption represents the net impact of the plant process on the water source balance.
Exhibit 3-45 Case 4 Water Balance
Water Use
Water Demand, m3/min (gpm)
Internal Recycle, m3/min (gpm)
Raw Water Withdrawal,
m3/min (gpm)
Process Water
Discharge, m3/min (gpm)
Raw Water Consumption, m3/min (gpm)
Condenser Makeup 0.08 (22) 0 (0) 0.08 (22) 0 (0) 0.08 (22) BFW Makeup 0.08 (22) 0 (0) 0.08 (22)
Cooling Tower 15.0 (3,957) 2.4 (635) 12.6 (3,322) 3.4 (890) 9.2 (2,432) BFW Blowdown 0 (0) 0.1 (22) -0.08 (-22)
Flue Gas Condensate 0 (0) 2.3 (613) -2.32 (-613)
CO2 Product Condensate 0 (0) 0 (0) 0 (0)
Total 15.1 (3,979) 2.4 (635) 12.7 (3,344) 3.4 (890) 9.3 (2,454)
An overall plant energy balance is provided in tabular form in Exhibit 3-46. The power out is the combined combustion turbine and steam turbine power after generator losses.

Carbon Capture and Sequestration Approaches for NGCC Systems, 12/20/10
70 12/20/2010
Exhibit 3-46 Case 4 Overall Energy Balance
HHV Sensible + Latent Power Total
Heat In GJ/hr (MMBtu/hr) Natural Gas 3,886 (3,683) 2.6 (2.5)
3,888 (3,685)
Ambient Air
0 (0)
0 (0) Raw Water Makeup
47.6 (45.1)
48 (45)
Auxiliary Power
491 (466) 491 (466) TOTAL 3,886 (3,683) 70.9 (67.2) 491 (466) 4,448 (4,216)
Heat Out GJ/hr (MMBtu/hr) CO2
7.4 (7.0)
7 (7) Cooling Tower Blowdown
34.2 (32.5)
34 (33)
Combustion Turbine Heat Loss
54.9 (52.0)
55 (52) Stack Gas
550.3 (521.5)
550 (522)
Condenser
69.3 (65.7)
69 (66) Non-Condenser Cooling Tower Loads
1,135 (1,076)
1,135 (1,076)
Process Losses*
487 (462)
487 (462) Power
2,109 (1,999) 2,109 (1,999)
TOTAL 2,339 (2,217) 2,109 (1,999) 4,448 (4,216) *Process losses including steam turbine, combustion reactions, HRSG, gas turbine, and gas cooling are estimated to match the heat input to the plant.
3.6 CASE 5- OXY-COMBUSTION TURBINE WITH WATER/STEAM RECYCLE This case is an NGCC plant based on an oxy-combustion Clean Energy Systems (CES) design. A typical CES process includes a high pressure, oxy-combustion gas generator, a high pressure expander, and a reheat combustor followed by IP and LP expanders. A partial condenser following the LP expander is used to recover water while the remaining CO2 rich stream enters a compression section. Initial CO2 compressor stages are used to pressurize the CO2 from 1.9 psia to about atmospheric pressure and to recover most of the remaining water. This is followed by a compression section similar to other cases in this study, which results in a CO2 product pressure of 2,215 psia. This study is not a typical CES design because it recycles and injects steam and water into the gas generator. The steam is required to increase the mass flow of the working fluid and thereby increase the power generation. The steam is generated by modifying the heat exchanger network. This would require a redesign of the CES gas generator. A BFD and stream tables are shown in Exhibit 3-47 and Exhibit 3-48, respectively. A low pressure cryogenic air separation unit supplies high purity oxygen required for the gas generator and for the reheat combustor. Auxiliary compressors are used to increase the oxygen pressure to levels required for the gas generator (2,500 psia) and for the reheat combustor (420 psia). Natural gas is assumed to be available at 100°F and 450 psia. This is sufficient for the reheat combustor, but an auxiliary compressor is required to supply the natural gas to the high pressure gas generator. The gas generator is an oxy-combustion reactor that uses both water and steam injection to moderate temperature and produce a high pressure working fluid consisting of 95 mol% water

Carbon Capture and Sequestration Approaches for NGCC Systems, 12/20/10
71 12/20/2010
and 5 mol% CO2. The gas stream exiting the gas generator enters the high pressure expander at 1,800°F and 2,150 psia and is expanded to 450 psia. After being reheated in an auxiliary combustor, the working fluid goes through a series of IP and LP expanders before a large portion of the water is recovered in a partial condenser. The CO2 and remaining water enter the 7-stage CO2 compression train. Knockout water from the CO2 compressor is combined with water from the partial condenser, passes through a H2O treatment unit, and is recycled back to the gas generator as liquid water and steam. An alternative to this study would be to raise the low pressure turbine exit pressure to slightly above atmospheric pressure and introduce a HRSG and ST into the system. This change would cause a lower volumetric flow rate entering the CO2 compression train and make it easier to condense H2O. However, the plant cost would increase because of the addition of the HRSG and ST. Like Case 4, the amount of CO2 captured was greater than 99 percent, which is expected from an oxy-combustion system. This case plant produces a net output of 406 MW at a net plant efficiency of 44.7 percent (HHV basis). Overall plant performance is summarized in Exhibit 3-49. The summary includes auxiliary power requirements. There are no estimated air emissions for Case 5 because all the exit gas streams except the ASU vent are included in the CO2 Product for sequestration.

Carbon Capture and Sequestration Approaches for NGCC Systems, 12/20/10
72 12/20/2010
Exhibit 3-47 Case 5 Block Flow Diagram, Oxy-combustion Turbine
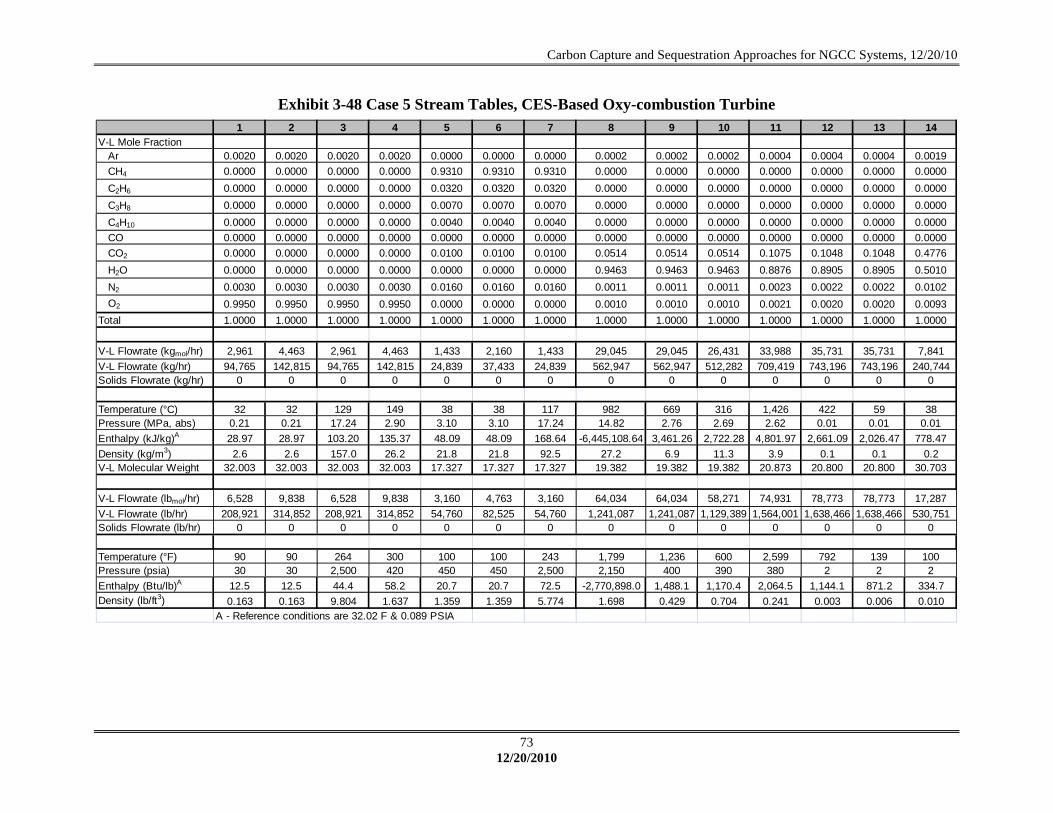
Carbon Capture and Sequestration Approaches for NGCC Systems, 12/20/10
73 12/20/2010
Exhibit 3-48 Case 5 Stream Tables, CES-Based Oxy-combustion Turbine 1 2 3 4 5 6 7 8 9 10 11 12 13 14
V-L Mole FractionAr 0.0020 0.0020 0.0020 0.0020 0.0000 0.0000 0.0000 0.0002 0.0002 0.0002 0.0004 0.0004 0.0004 0.0019CH4 0.0000 0.0000 0.0000 0.0000 0.9310 0.9310 0.9310 0.0000 0.0000 0.0000 0.0000 0.0000 0.0000 0.0000C2H6 0.0000 0.0000 0.0000 0.0000 0.0320 0.0320 0.0320 0.0000 0.0000 0.0000 0.0000 0.0000 0.0000 0.0000C3H8 0.0000 0.0000 0.0000 0.0000 0.0070 0.0070 0.0070 0.0000 0.0000 0.0000 0.0000 0.0000 0.0000 0.0000C4H10 0.0000 0.0000 0.0000 0.0000 0.0040 0.0040 0.0040 0.0000 0.0000 0.0000 0.0000 0.0000 0.0000 0.0000CO 0.0000 0.0000 0.0000 0.0000 0.0000 0.0000 0.0000 0.0000 0.0000 0.0000 0.0000 0.0000 0.0000 0.0000CO2 0.0000 0.0000 0.0000 0.0000 0.0100 0.0100 0.0100 0.0514 0.0514 0.0514 0.1075 0.1048 0.1048 0.4776H2O 0.0000 0.0000 0.0000 0.0000 0.0000 0.0000 0.0000 0.9463 0.9463 0.9463 0.8876 0.8905 0.8905 0.5010N2 0.0030 0.0030 0.0030 0.0030 0.0160 0.0160 0.0160 0.0011 0.0011 0.0011 0.0023 0.0022 0.0022 0.0102O2 0.9950 0.9950 0.9950 0.9950 0.0000 0.0000 0.0000 0.0010 0.0010 0.0010 0.0021 0.0020 0.0020 0.0093
Total 1.0000 1.0000 1.0000 1.0000 1.0000 1.0000 1.0000 1.0000 1.0000 1.0000 1.0000 1.0000 1.0000 1.0000
V-L Flowrate (kgmol/hr) 2,961 4,463 2,961 4,463 1,433 2,160 1,433 29,045 29,045 26,431 33,988 35,731 35,731 7,841V-L Flowrate (kg/hr) 94,765 142,815 94,765 142,815 24,839 37,433 24,839 562,947 562,947 512,282 709,419 743,196 743,196 240,744Solids Flowrate (kg/hr) 0 0 0 0 0 0 0 0 0 0 0 0 0 0
Temperature (°C) 32 32 129 149 38 38 117 982 669 316 1,426 422 59 38Pressure (MPa, abs) 0.21 0.21 17.24 2.90 3.10 3.10 17.24 14.82 2.76 2.69 2.62 0.01 0.01 0.01Enthalpy (kJ/kg)A 28.97 28.97 103.20 135.37 48.09 48.09 168.64 -6,445,108.64 3,461.26 2,722.28 4,801.97 2,661.09 2,026.47 778.47Density (kg/m3) 2.6 2.6 157.0 26.2 21.8 21.8 92.5 27.2 6.9 11.3 3.9 0.1 0.1 0.2V-L Molecular Weight 32.003 32.003 32.003 32.003 17.327 17.327 17.327 19.382 19.382 19.382 20.873 20.800 20.800 30.703
V-L Flowrate (lbmol/hr) 6,528 9,838 6,528 9,838 3,160 4,763 3,160 64,034 64,034 58,271 74,931 78,773 78,773 17,287V-L Flowrate (lb/hr) 208,921 314,852 208,921 314,852 54,760 82,525 54,760 1,241,087 1,241,087 1,129,389 1,564,001 1,638,466 1,638,466 530,751Solids Flowrate (lb/hr) 0 0 0 0 0 0 0 0 0 0 0 0 0 0
Temperature (°F) 90 90 264 300 100 100 243 1,799 1,236 600 2,599 792 139 100Pressure (psia) 30 30 2,500 420 450 450 2,500 2,150 400 390 380 2 2 2Enthalpy (Btu/lb)A 12.5 12.5 44.4 58.2 20.7 20.7 72.5 -2,770,898.0 1,488.1 1,170.4 2,064.5 1,144.1 871.2 334.7Density (lb/ft3) 0.163 0.163 9.804 1.637 1.359 1.359 5.774 1.698 0.429 0.704 0.241 0.003 0.006 0.010
A - Reference conditions are 32.02 F & 0.089 PSIA

Carbon Capture and Sequestration Approaches for NGCC Systems, 12/20/10
74 12/20/2010
Exhibit 3-48 Case 5 Stream Tables, CES-Based Oxy-combustion Turbine (continued) 15 16 17 18 19 20 21 22 23 24 25 26 27 28
V-L Mole FractionAr 0.0000 0.0000 0.0000 0.0000 0.0000 0.0000 0.0000 0.0000 0.0000 0.0000 0.0000 0.0000 0.0000 0.0000CH4 0.0000 0.0000 0.0000 0.0000 0.0000 0.0000 0.0000 0.0000 0.0000 0.0000 0.0000 0.0000 0.0000 0.0000C2H6 0.0000 0.0000 0.0000 0.0000 0.0000 0.0000 0.0000 0.0000 0.0000 0.0000 0.0000 0.0000 0.0000 0.0000C3H8 0.0000 0.0000 0.0000 0.0000 0.0000 0.0000 0.0000 0.0000 0.0000 0.0000 0.0000 0.0000 0.0000 0.0000C4H10 0.0000 0.0000 0.0000 0.0000 0.0000 0.0000 0.0000 0.0000 0.0000 0.0000 0.0000 0.0000 0.0000 0.0000CO 0.0000 0.0000 0.0000 0.0000 0.0000 0.0000 0.0000 0.0000 0.0000 0.0000 0.0000 0.0000 0.0000 0.0000CO2 1.0000 0.0001 0.0000 0.0000 1.0000 1.0000 0.0000 0.0000 0.0000 0.0000 0.0000 0.0000 0.0000 0.0000H2O 0.0000 0.9999 1.0000 1.0000 0.0000 0.0000 1.0000 1.0000 1.0000 1.0000 1.0000 1.0000 1.0000 1.0000N2 0.0000 0.0000 0.0000 0.0000 0.0000 0.0000 0.0000 0.0000 0.0000 0.0000 0.0000 0.0000 0.0000 0.0000O2 0.0000 0.0000 0.0000 0.0000 0.0000 0.0000 0.0000 0.0000 0.0000 0.0000 0.0000 0.0000 0.0000 0.0000
Total 1.0000 1.0000 1.0000 1.0000 1.0000 1.0000 1.0000 1.0000 1.0000 1.0000 1.0000 1.0000 1.0000 1.0000
V-L Flowrate (kgmol/hr) 3,744 3,918 31,808 7,199 3,744 3,744 24,609 24,609 11,217 11,217 9,936 9,936 21,153 3,456V-L Flowrate (kg/hr) 164,788 70,599 573,050 129,689 164,788 164,788 443,343 443,343 202,080 202,080 179,006 179,006 381,086 62,257Solids Flowrate (kg/hr) 0 0 0 0 0 0 0 0 0 0 0 0 0 0
Temperature (°C) 119 38 36 38 27 28 38 39 39 353 39 353 353 39Pressure (MPa, abs) 14.48 0.04 0.01 0.34 14.20 15.27 0.34 17.93 17.93 17.24 17.93 17.24 17.24 17.93Enthalpy (kJ/kg)A 12.18 153.68 153.62 159.40 -230.40 -228.52 159.40 180.23 180.23 2,510.83 180.23 2,504.21 2,679.93 176.95Density (kg/m3) 253.3 663.8 993.6 993.2 757.3 761.2 993.2 1,000.3 1,000.3 126.3 1,000.3 127.1 108.6 747.6V-L Molecular Weight 44.010 18.017 18.016 18.016 44.010 44.010 18.016 18.016 18.016 18.016 18.016 18.016 18.016 18.016
V-L Flowrate (lbmol/hr) 8,255 8,639 70,125 15,870 8,255 8,255 54,254 54,254 24,729 24,729 21,906 21,906 46,635 7,619V-L Flowrate (lb/hr) 363,295 155,644 1,263,359 285,915 363,295 363,295 977,405 977,405 445,511 445,511 394,641 394,641 840,152 137,253Solids Flowrate (lb/hr) 0 0 0 0 0 0 0 0 0 0 0 0 0 0
Temperature (°F) 246 100 98 100 80 83 100 102 102 668 102 668 668 102Pressure (psia) 2,100 6 2 50 2,060 2,215 50 2,600 2,600 2,500 2,600 2,500 2,500 2,600Enthalpy (Btu/lb)A 5.2 66.1 66.0 68.5 -99.1 -98.2 68.5 77.5 77.5 1,079.5 77.5 1,076.6 1,152.2 76.1Density (lb/ft3) 15.816 41.440 62.028 62.006 47.275 47.519 62.006 62.449 62.449 7.882 62.449 7.932 6.782 46.672
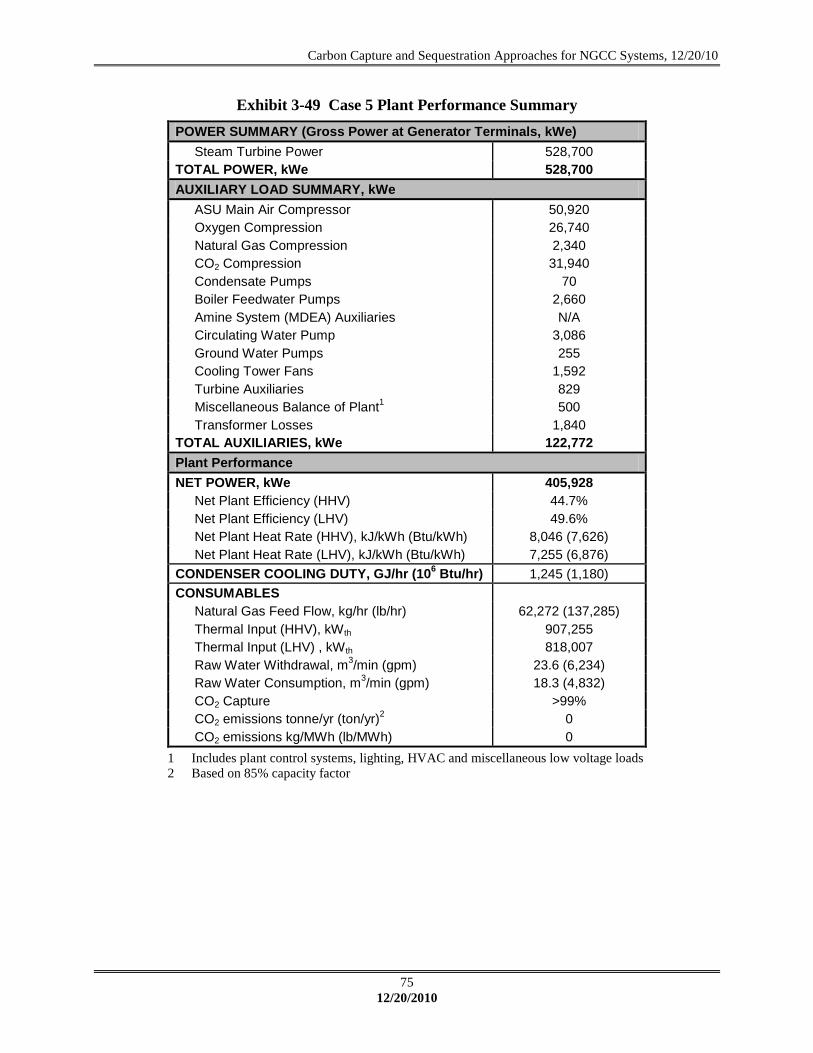
Carbon Capture and Sequestration Approaches for NGCC Systems, 12/20/10
75 12/20/2010
Exhibit 3-49 Case 5 Plant Performance Summary POWER SUMMARY (Gross Power at Generator Terminals, kWe)
Steam Turbine Power 528,700 TOTAL POWER, kWe 528,700 AUXILIARY LOAD SUMMARY, kWe
ASU Main Air Compressor 50,920 Oxygen Compression 26,740 Natural Gas Compression 2,340 CO2 Compression 31,940 Condensate Pumps 70 Boiler Feedwater Pumps 2,660 Amine System (MDEA) Auxiliaries N/A Circulating Water Pump 3,086 Ground Water Pumps 255 Cooling Tower Fans 1,592 Turbine Auxiliaries 829 Miscellaneous Balance of Plant1 500 Transformer Losses 1,840
TOTAL AUXILIARIES, kWe 122,772 Plant Performance NET POWER, kWe 405,928
Net Plant Efficiency (HHV) 44.7% Net Plant Efficiency (LHV) 49.6% Net Plant Heat Rate (HHV), kJ/kWh (Btu/kWh) 8,046 (7,626) Net Plant Heat Rate (LHV), kJ/kWh (Btu/kWh) 7,255 (6,876)
CONDENSER COOLING DUTY, GJ/hr (106 Btu/hr) 1,245 (1,180) CONSUMABLES
Natural Gas Feed Flow, kg/hr (lb/hr) 62,272 (137,285) Thermal Input (HHV), kWth 907,255 Thermal Input (LHV) , kWth 818,007 Raw Water Withdrawal, m3/min (gpm) 23.6 (6,234) Raw Water Consumption, m3/min (gpm) 18.3 (4,832) CO2 Capture >99% CO2 emissions tonne/yr (ton/yr)2 0 CO2 emissions kg/MWh (lb/MWh) 0
1 Includes plant control systems, lighting, HVAC and miscellaneous low voltage loads 2 Based on 85% capacity factor
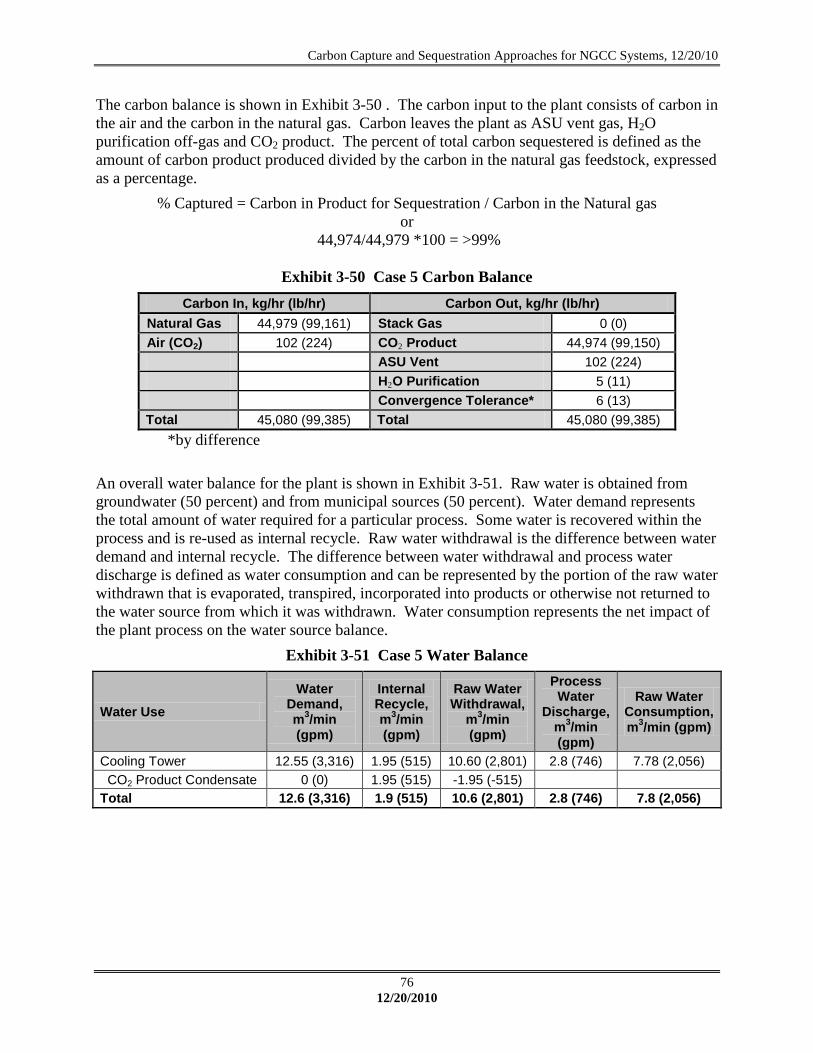
Carbon Capture and Sequestration Approaches for NGCC Systems, 12/20/10
76 12/20/2010
The carbon balance is shown in Exhibit 3-50 . The carbon input to the plant consists of carbon in the air and the carbon in the natural gas. Carbon leaves the plant as ASU vent gas, H2O purification off-gas and CO2 product. The percent of total carbon sequestered is defined as the amount of carbon product produced divided by the carbon in the natural gas feedstock, expressed as a percentage.
% Captured = Carbon in Product for Sequestration / Carbon in the Natural gas or
44,974/44,979 *100 = >99%
Exhibit 3-50 Case 5 Carbon Balance Carbon In, kg/hr (lb/hr) Carbon Out, kg/hr (lb/hr)
Natural Gas 44,979 (99,161) Stack Gas 0 (0) Air (CO2) 102 (224) CO2 Product 44,974 (99,150) ASU Vent 102 (224) H2O Purification 5 (11) Convergence Tolerance* 6 (13) Total 45,080 (99,385) Total 45,080 (99,385)
*by difference An overall water balance for the plant is shown in Exhibit 3-51. Raw water is obtained from groundwater (50 percent) and from municipal sources (50 percent). Water demand represents the total amount of water required for a particular process. Some water is recovered within the process and is re-used as internal recycle. Raw water withdrawal is the difference between water demand and internal recycle. The difference between water withdrawal and process water discharge is defined as water consumption and can be represented by the portion of the raw water withdrawn that is evaporated, transpired, incorporated into products or otherwise not returned to the water source from which it was withdrawn. Water consumption represents the net impact of the plant process on the water source balance.
Exhibit 3-51 Case 5 Water Balance
Water Use
Water Demand, m3/min (gpm)
Internal Recycle, m3/min (gpm)
Raw Water Withdrawal,
m3/min (gpm)
Process Water
Discharge, m3/min (gpm)
Raw Water Consumption, m3/min (gpm)
Cooling Tower 12.55 (3,316) 1.95 (515) 10.60 (2,801) 2.8 (746) 7.78 (2,056) CO2 Product Condensate 0 (0) 1.95 (515) -1.95 (-515)
Total 12.6 (3,316) 1.9 (515) 10.6 (2,801) 2.8 (746) 7.8 (2,056)

Carbon Capture and Sequestration Approaches for NGCC Systems, 12/20/10
77 12/20/2010
An overall plant energy balance is provided in tabular form in Exhibit 3-52. The power out is the combined combustion turbine and steam turbine power after generator losses.
Exhibit 3-52 Case 5 Overall Energy Balance
HHV Sensible + Latent Power Total
Heat In GJ/hr (MMBtu/hr) Natural Gas 3,266 (3,096) 2.2 (2.1)
3,268 (3,098)
Raw Water Makeup
39.9 (37.8)
40 (38) Auxiliary Power
442 (419) 442 (419)
TOTAL 3,266 (3,096) 42.1 (39.9) 442 (419) 3,750 (3,554) Heat Out GJ/hr (MMBtu/hr)
CO2 -37.7 (-35.7)
-38 (-36)
Cooling Tower Blowdown
21.0 (19.9)
21 (20) Compression Intercooling
397.7 (376.9)
398 (377)
Condenser
1,241 (1,177)
1,241 (1,177) Process Losses*
224 (213)
224 (213)
Power
1,903 (1,804) 1,903 (1,804) TOTAL 1,847 (1,750) 1,903 (1,804) 3,750 (3,554)
*Process losses including steam turbine, combustion reactions, HRSG, gas turbine, and gas cooling are estimated to match the heat input to the plant.

Carbon Capture and Sequestration Approaches for NGCC Systems, 12/20/10
78 12/20/2010
This page intentionally left blank

Carbon Capture and Sequestration Approaches for NGCC Systems, 12/20/10
79 12/20/2010
4. The estimating methodology for capital costs, operations and maintenance costs, and CO2 TS&M costs are described below. The finance structure, basis for the discounted cash flow analysis, and Cost of Electricity (COE) calculations are also described. More detailed information on the cost estimating methodology, calculations, and assumptions is presented in Section 2 of the Bituminous Baseline study report [
COST RESULTS
1] which contains the reference cases. Capital costs were estimated at four levels: Bare Erected Cost (BEC), Total Plant Cost (TPC), Total Overnight Cost (TOC) and Total As-spent Capital (TASC). BEC, TPC and TOC are “overnight” costs and are expressed in “base-year” dollars. The base year is the first year of capital expenditure, which for this study is assumed to be 2007. TASC is expressed in mixed-year, current-year dollars over the entire capital expenditure period, which is assumed to last three years for natural gas plants (2007 to 2009).
4.1 EQUIPMENT CAPITAL COSTING The Bare Erected Cost (BEC) comprises the cost of process equipment, on-site facilities and infrastructure that support the plant (e.g., shops, offices, labs, road), and the direct and indirect labor required for its construction and/or installation. The cost of EPC services and contingencies is not included in BEC. BEC is an overnight cost expressed in base-year (2007) dollars. The equipment cost estimating methodology for Cases 1 through 5 uses reference costs established in Bituminous Baseline Study [1]. WorleyParsons Group Inc. provided the Total Plant Cost (TPC) and Operation and Maintenance (O&M) costs for cases in the referenced study. Those cost data were employed for scaling conventional systems in the present cost estimates. All costs are in June 2007 dollars, similar to the basis of Bituminous Baseline Study, to facilitate comparison. Owner’s costs are included in the present estimates as they were in the Baseline study estimates. Specifically, the costs and performance data from Case 14 - NGCC with CO2 capture, in the Bituminous Baseline Study were employed as the references for cost scaling. The costs and performance data for this study’s reference case with CO2 capture, Ref2, were assumed to match the BB Case 14 values with the exception of an increase in the MEA auxiliary load and corresponding small decrease in the overall efficiency as described in section 3.1.2. Natural gas combined cycle plants have the following general plant subsystems in addition to site improvements, and buildings and structures:
• Natural gas supply system; • Combustion turbine; • Heat recovery steam generator; • NOx control system; • Carbon dioxide recovery facility; • Steam turbine; • Water and steam systems; • Accessory electric plant; and • Instrumentation and control.

Carbon Capture and Sequestration Approaches for NGCC Systems, 12/20/10
80 12/20/2010
Most of the cases in this study include equipment items that aren’t found in a conventional NGCC plant. Costs for the non-conventional equipment were estimated by WorleyParsons, scaled from integrated gasification combined cycle (IGCC) equipment items, or from other reference estimates as described below:
• Case 2, Account 4.4 (Low Temperature Heat Recovery): This account consists of four heat exchangers, three are gas-liquid and one is gas-gas. The costs were estimated by WorleyParsons using reference costs from other projects employing heat exchangers operating at similar conditions and scaling on heat duty.
• Case 2, Account 5.1 (Autothermal Reactor): This account was scaled by the project team using a steam-methane reformer cost from an ongoing coal-to-hydrogen study as the reference [16
• Case 2, Account 5A.2 (Syngas Cooling): This gas-gas heat exchanger is similar to a syngas cooler in an IGCC plant and was scaled using the replacement cost of the Wabash River syngas cooler as a reference. It was assumed that two exchangers would be required, and they were scaled on heat duty.
]. The cost was scaled on outlet volumetric flow rate. The resulting cost was multiplied by 0.8, assuming that an ATR is less expensive than an equivalent steam-methane reformer.
• Case 2, Account 5A.3 (Gas-Gas Heat Exchanger): WorleyParsons provided the cost estimate for this exchanger using a gas-gas heat exchanger (used to cool extraction air from a combustion turbine) as the reference. Cost was scaled based on heat duty.
• Case 2, Account 5B.1 (MDEA CO2 Removal System): The cost of the MDEA system was scaled by WorleyParsons from previous MDEA cost estimates that appear in the Bituminous Baseline report [1].
• Case 3, Account 4.4 (Low Temperature Heat Recovery): This account consists of three gas-liquid heat exchangers and an economizer/evaporator/superheater. The costs were estimated by WorleyParsons using reference costs from other projects employing heat exchangers operating at similar conditions and scaling on heat duty.
• Case 3, Account 5A.1 (Partial Oxidizers): The partial oxidizer costs were scaled by using the CoP gasifier cost in Bituminous Baseline study as a reference [1]. Per WorleyParsons, syngas cooling represents 41 percent of gasifier equipment costs and 44 percent of labor costs in the reference estimate. The POX scaling parameter, volumetric flow rate, was multiplied by 0.6 to account for the reduced residence time required to combust natural gas relative to coal. A correction factor was applied to account for the higher POX operating pressure.
• Case 3, Account 5A.2 (Syngas Cooling): WorleyParsons estimated the cost of this quench vessel using an FGD absorber for the reference cost with modifications for operating conditions.
• Case 3, Account 5A.3 (Syngas Cooling): WorleyParsons provided the cost estimate for this exchanger using a gas-gas heat exchanger (used to cool extraction air from a combustion turbine) as the reference. Cost was scaled based on heat duty.

Carbon Capture and Sequestration Approaches for NGCC Systems, 12/20/10
81 12/20/2010
• Case 3, Account 5B.1 (MDEA CO2 Removal System): The cost of the MDEA system was scaled by WorleyParsons from previous MDEA cost estimates that appear in the Bituminous Baseline report [1].
• Case 3, Account 6.5 (Syngas Expander): The cost of the syngas expander was estimated by WorleyParsons based on quotes for similar equipment items with corrections for operating conditions.
• Case 4, Account 6.1 (Combustion Turbine Generator): A factor of 1.5 was applied to the equipment cost of a conventional CT to account for the higher than normal pressure ratio and oxy-combustion configuration. A process contingency was also applied as described in Section 4.3.
• Case 5, Account 5A.1 (Gas Generator): The CoP gasifier from the Bituminous Baseline study was used as the reference cost and volumetric flow rate was the process parameter used for scaling with corrections made for pressure differences.
• Case 5, Account 6.5 (HTHP Gas Expanders): WorleyParsons estimated the expander cost with a 50 percent margin included in the equipment cost for advanced metallurgy.
The technologies modeled in this study include some unconventional equipment items that operate at temperatures and pressures beyond that currently offered commercially. Because the estimates for these equipment items contain a large degree of uncertainty, cost sensitivities were performed to show the impact of higher or lower than estimated costs. The rest of costing methodology is outlined in the following sections.
4.1.1 The costs for all the subsystems in the reference case are available along with the heat and material balances. These costs were scaled on the basis of the unit attributes (such as capacity, heat duty, and inlet flow rate) following the generally accepted scaling equation shown below.
Scaling Methodology
n
b
a
b
a
AA
CC
= (1)
where Ca and Cb = the costs of plant a and plant b (or equipment a and equipment b) Aa and Ab = attributes of plant (or equipment) a and b respectively.
The cost exponent, n, depends on the type of equipment in question and can range from 0.30 for a vertical carbon steel tank to 0.84 for a reciprocating compressor. The majority of the exponents for this scaling have already been established in previous studies and those exponents were used as is. For equipment without established exponents, an exponent of 0.7 was used. The attributes for scaling vary from equipment to equipment. For example, the HRSG was scaled against the heat duty of the HRSG (exponent = 0.70); steam turbine costs were scaled against the steam turbine capacity (exponent = 0.71); AGR costs were scaled by the actual gas flow rate into the AGR (exponent = 0.70); and ASU was scaled on the basis of air compressor power with an exponent of 0.57. Exponents employed for scaling various equipment items are detailed in the individual spreadsheet templates.

Carbon Capture and Sequestration Approaches for NGCC Systems, 12/20/10
82 12/20/2010
There were also new key pieces of equipment included in the simulations where costs were not available in the reference study. Those equipment items were independently estimated by WorleyParsons as discussed above, by employing available cost equations, or by scaling against costs of similar equipment. Since the cases evaluated had different cycle configurations and in some cases operated at vastly different temperatures and pressures from that of the reference case, simple scaling on the basis of Equation (1) alone was not sufficient to obtain reasonable estimated costs. Correction factors for pressure and temperature, in addition to the index correction to the June 2007 dollars, were evaluated separately and applied. They are discussed below.
4.1.2 For common equipment items whose costs were not available from previous studies or costs were not provided by WorleyParsons, the costs were calculated using the following equation. In some cases, the costs provided by WorleyParsons were for multiple equipment items lumped together and the breakdown of costs for individual pieces of equipment was difficult.
Purchased Equipment Costs
( )21031021
op10 loglogClog AKAKK ++= (2)
where Cpo = equipment cost at ambient operating pressure using carbon steel
K1, K2, K3 = correlation coefficients depending on the type of equipment A = capacity or size parameters of the equipment The correlation coefficients and the correct parameters to use for ‘A’ for different types of equipment are tabulated in Table A.1 of reference [17
4.1.3
]. For centrifugal, axial, and reciprocating compressors, K1 = 2.2897, K2 = 1.3604, and K3 = -0.1027 and the parameter A to use in Equation (2) is motor size in kW. Equation (2) was used to evaluate the costs of compressors with the pressure correction factors and material correction factors discussed below.
The pressure correction factors for both the horizontal and vertical pressurized vessels were evaluated based on the following equation [
Evaluation of Pressure Correction Factors
17]. The applied pressure correction factor is the ratio of this factor calculated for the vessel of interest divided by the factor calculated for the reference vessel.
( )( )[ ]
mmtforP
DP
vesselvesselpF 3.60063.0
00315.016.03502
1
, >+
+−
+
= (3)
where D - diameter of the vessel in meter
Fp,vessel - pressure correction factor for vessel P - pressure in barg
tvessel vessel thickness

Carbon Capture and Sequestration Approaches for NGCC Systems, 12/20/10
83 12/20/2010
Equation (3) was derived based on the American Society of Mechanical Engineers (ASME) code for pressure vessel design using a maximum allowable carbon steel stress of 944 bar (13,700 psi), a welding efficiency of 0.9, and a corrosion allowance of 3.15 mm (0.125 in). For other process equipment, the pressure factors were calculated on the basis of Equation (4).
( )21031021P10 loglogFlog PCPCC ++= (4)
where Fp - pressure correction factor C1, C2, C3 - correlation constants depending on type of equipment The correlation constants for different equipment items can be found in Table A.2 of reference [17]. For shell-and-tube heat exchangers, C1 = 0.03881, C2 = -0.11272, and C3 = 0.08183; and for centrifugal pumps, C1 = -0.3935, C2 = 0.3957, and C3 = -0.00226.
4.1.4 The effect of temperature on equipment cost is usually manifested as changes in material requirements. The more exotic materials required, the higher the cost will be. The material correction factors depend also on the type of equipment under consideration. The material correction factors for process vessels, heat exchangers, and pumps are given in Figure A. 18 of reference [
Evaluation of Material Correction Factors
17]. In general, stainless steel will cost approximately 2 to 3 times that of carbon steel, Nickel (Ni) alloy 3 to 4 times, and Titanium (Ti) up to 10 times.
4.2 ENGINEERING, PROCUREMENT, AND CONSTRUCTION COSTS The costs of services provided by the engineering, procurement and construction (EPC) contractor and project and process contingencies were estimated for each account based on the factors applied to similar equipment estimates in previous studies, most notably the referenced BB study natural gas cases [1]. More detailed information on estimating and applying contingencies is presented in Section 2.7.1 of the Bituminous Baseline study report [1]. EPC services include: detailed design, contractor permitting (i.e., those permits that individual contractors must obtain to perform their scopes of work, as opposed to project permitting, which is not included here), and project/construction management costs.
4.3 PROCESS AND PROJECT CONTINGENCIES Process and project contingencies are included in estimates to account for unknown costs that are omitted or unforeseen due to a lack of complete project definition and engineering. Contingencies are added because experience has shown that such costs are likely, and expected, to be incurred even though they cannot be explicitly determined at the time the estimate is prepared. The contingencies are estimated for each account based on the factors applied to similar equipment estimates in previous studies, most notably the referenced BB study natural gas cases [1]. More detailed information on estimating and applying contingencies is presented in Section 2.7.1 of the Bituminous Baseline study report [1]. Project contingencies were added to cover project uncertainty and the cost of any additional equipment that would result from a detailed design. The contingencies represent costs that are expected to occur. Process contingency is intended to compensate for uncertainty in cost estimates caused by performance

Carbon Capture and Sequestration Approaches for NGCC Systems, 12/20/10
84 12/20/2010
uncertainties associated with the development status of a technology. The cost accounts that received a process contingency include:
• Combustion Turbine Generator - five percent contingency on Cases 1a and 1c for modifications required to the inlet air system (material, static mixer) and the compressor. A 40 percent contingency is used in Case 1b since major design modifications would be required to accommodate the low combustor oxygen concentration, and 40 percent was also used for Case 4 because of the oxy-combustion configuration and the high pressure ratio.
• MEA-based carbon capture processes - 20 percent contingency on Cases Ref2, 1a, 1b, and 1c because it is considered unproven at commercial scale for power plant applications.
• Gas Generator and Reheat Combustor – 15 percent contingency for high-pressure oxy-combustion reactors.
4.4 OWNER’S COSTS AND TOTAL CAPITAL COSTS The TPC comprises the BEC plus the cost of services provided by the engineering, procurement and construction (EPC) contractor and project and process contingencies. Owner’s costs are added to the TPC estimate to generate the total overnight cost (TOC) values. With some exceptions, the estimation method follows guidelines in Sections 12.4.7 to 12.4.12 of AACE International Recommended Practice No. 16R-90 [18
Exhibit 4-1
]. The Electric Power Research Institute’s “Technical Assessment Guide (TAG®) – Power Generation and Storage Technology Options” also has guidelines for estimating owner’s costs. The EPRI and AACE guidelines are very similar. In instances where they differ, this study has sometimes adopted the EPRI approach. The owner’s costs included in the TOC cost estimate for this study are shown in . The TOC
The
comprises the TPC plus owner’s costs. TOC is an “overnight” cost, expressed in base-year (2007) dollars and as such does not include escalation during construction or interest during construction. TOC is an overnight cost expressed in base-year (2007) dollars.
TASC
4.7
is the sum of all capital expenditures as they are incurred during the capital expenditure period including their escalation. TASC also includes interest during construction. Accordingly, TASC is expressed in mixed, current-year dollars over the capital expenditure period. TASC is calculated by multiplying a factor times the value of TOC. This calculation is discussed in more detail in Section . Again, more detailed information on estimating and capital cost calculations is presented in Section 2.7.1 of the Bituminous Baseline study report [1].
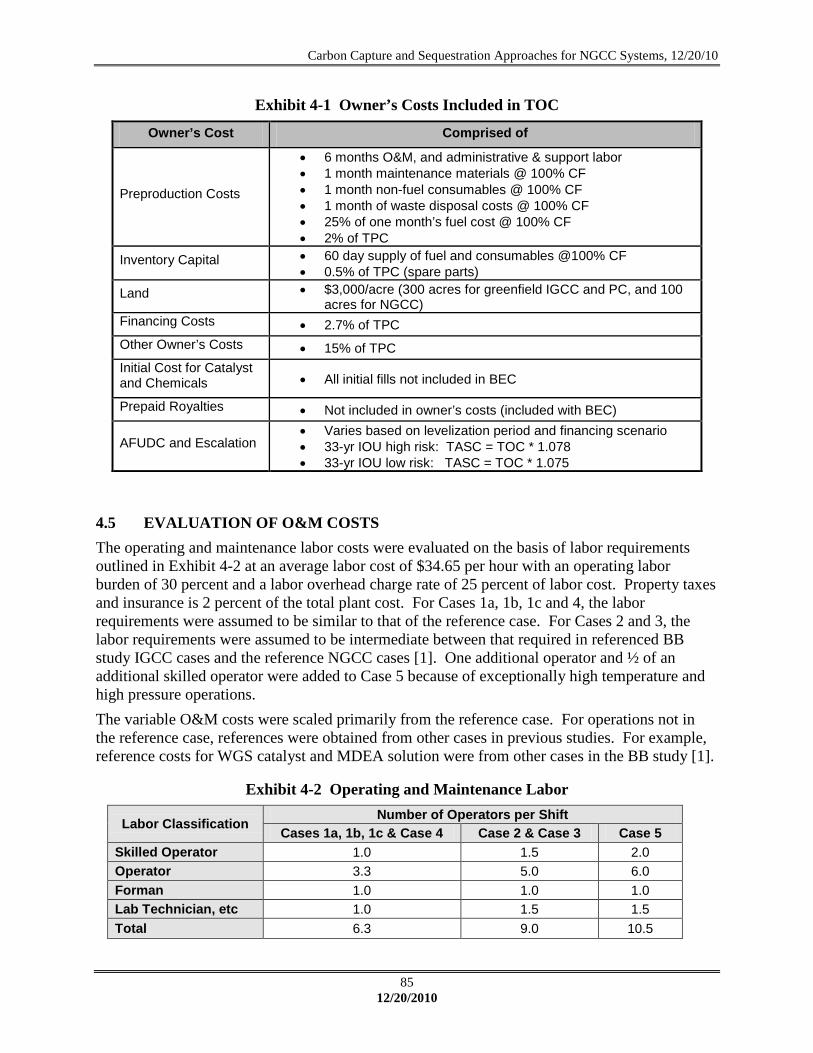
Carbon Capture and Sequestration Approaches for NGCC Systems, 12/20/10
85 12/20/2010
Exhibit 4-1 Owner’s Costs Included in TOC
Owner’s Cost Comprised of
Preproduction Costs
• 6 months O&M, and administrative & support labor • 1 month maintenance materials @ 100% CF • 1 month non-fuel consumables @ 100% CF • 1 month of waste disposal costs @ 100% CF • 25% of one month’s fuel cost @ 100% CF • 2% of TPC
Inventory Capital • 60 day supply of fuel and consumables @100% CF • 0.5% of TPC (spare parts)
Land • $3,000/acre (300 acres for greenfield IGCC and PC, and 100 acres for NGCC)
Financing Costs • 2.7% of TPC Other Owner’s Costs • 15% of TPC Initial Cost for Catalyst and Chemicals • All initial fills not included in BEC
Prepaid Royalties • Not included in owner’s costs (included with BEC)
AFUDC and Escalation • Varies based on levelization period and financing scenario • 33-yr IOU high risk: TASC = TOC * 1.078 • 33-yr IOU low risk: TASC = TOC * 1.075
4.5 EVALUATION OF O&M COSTS The operating and maintenance labor costs were evaluated on the basis of labor requirements outlined in Exhibit 4-2 at an average labor cost of $34.65 per hour with an operating labor burden of 30 percent and a labor overhead charge rate of 25 percent of labor cost. Property taxes and insurance is 2 percent of the total plant cost. For Cases 1a, 1b, 1c and 4, the labor requirements were assumed to be similar to that of the reference case. For Cases 2 and 3, the labor requirements were assumed to be intermediate between that required in referenced BB study IGCC cases and the reference NGCC cases [1]. One additional operator and ½ of an additional skilled operator were added to Case 5 because of exceptionally high temperature and high pressure operations. The variable O&M costs were scaled primarily from the reference case. For operations not in the reference case, references were obtained from other cases in previous studies. For example, reference costs for WGS catalyst and MDEA solution were from other cases in the BB study [1].
Exhibit 4-2 Operating and Maintenance Labor
Labor Classification Number of Operators per Shift
Cases 1a, 1b, 1c & Case 4 Case 2 & Case 3 Case 5 Skilled Operator 1.0 1.5 2.0 Operator 3.3 5.0 6.0 Forman 1.0 1.0 1.0 Lab Technician, etc 1.0 1.5 1.5 Total 6.3 9.0 10.5

Carbon Capture and Sequestration Approaches for NGCC Systems, 12/20/10
86 12/20/2010
4.6 CO2 TRANSPORT STORAGE AND MONITORING The capital and operating costs for CO2 transport, storage, and monitoring (TS&M) were independently estimated by NETL. Those costs were adjusted for the specific product CO2 flow rates of each case in this study and used to estimate the additional component required for incorporating into the overall cost of electricity results. The cost metrics utilized in this study provide a best estimate of TS&M costs for a “typical” sequestration project, and may vary significantly based on variables such as terrain to be crossed by the pipeline, reservoir characteristics, and number of land owners from which sub-surface rights must be acquired. Raw capital and operating costs are derived from detailed cost metrics found in the literature, escalated to June 2007-year dollars using appropriate price indices. These costs were then verified against values quoted by industrial sources where possible. Where regulatory uncertainty exists or costs are undefined, such as liability costs and the acquisition of underground pore volume, analogous existing policies were used for representative cost scenarios. More detailed information on the TS&M cost calculations is presented in Section 3.7 of the Bituminous Baseline study report [1]. CO2 is supplied to the pipeline at the plant fence line at a pressure of 15.3 MPa (2,215 psia). The CO2 is transported 80 km (50 miles) via pipeline to a geologic sequestration field for injection into a saline formation. The product gas composition varies in the cases presented. Cases 1a, 1b, 1c, 2, and 3 are expected to meet the specification described in Exhibit 4-3 [19
]. The compositions of the CO2 streams in the oxy-combustion cases (cases 4 and 5) do not meet the pipeline specification. While the recovery of the CO2 is high for these cases, purifying this CO2 stream presents some difficulty, with the presence of light gases making further separation costly. No attempt was made to further purify the CO2 in this study.
Exhibit 4-3 CO2 Pipeline Specification
Parameter Units Parameter Value Inlet Pressure MPa (psia) 15.3 (2,215) Outlet Pressure MPa (psia) 10.4 (1,515) Inlet Temperature °C (°F) 35 (95) N2 Concentration ppmv < 300 O2 Concentration ppmv < 40 Ar Concentration ppmv < 10
4.7 FINANCE STRUCTURE, DISCOUNTED CASH FLOW ANALYSIS, AND COE The global economic assumptions used in this study are listed in Exhibit 4-4. Finance structures were chosen based on the assumed type of developer/owner and the assumed risk profile of the plant being assessed (low-risk or high-risk). For this study the owner/developer was assumed to be an investor-owned utility (IOU). All NGCC cases with CO2 capture were considered high risk. The non-capture NGCC reference case was considered low risk.

Carbon Capture and Sequestration Approaches for NGCC Systems, 12/20/10
87 12/20/2010
Exhibit 4-5 describes the low-risk IOU and high-risk IOU finance structures that were assumed for this study. These finance structures were recommended in a 2008 NETL report based on interviews with project developers/owners, financial organizations and law firms [20
Exhibit 4-4 Global Economic Assumptions
].
Parameter Value TAXES Income Tax Rate 38% (Effective 34% Federal, 6% State) Capital Depreciation 20 years, 150% declining balance Investment Tax Credit 0% Tax Holiday 0 years CONTRACTING AND FINANCING TERMS
Contracting Strategy Engineering Procurement Construction Management (owner assumes project risks for performance, schedule and cost)
Type of Debt Financing Non-Recourse (collateral that secures debt is limited to the real assets of the project)
Repayment Term of Debt 15 years Grace Period on Debt Repayment 0 years Debt Reserve Fund None ANALYSIS TIME PERIODS Capital Expenditure Period Natural Gas Plants: 3 Years Operational Period 30 years
Economic Analysis Period (used for IRROE) 33 Years (capital expenditure period plus operational period)
TREATMENT OF CAPITAL COSTS Capital Cost Escalation During Capital Expenditure Period (nominal annual rate) 3.6%2
Distribution of Total Overnight Capital over the Capital Expenditure Period (before escalation)
3-Year Period: 10%, 60%, 30%
Working Capital zero for all parameters
% of Total Overnight Capital that is Depreciated 100% (this assumption introduces a very small error even if a substantial amount of TOC is actually non-depreciable)
ESCALATION OF OPERATING REVENUES AND COSTS Escalation of COE (revenue), O&M Costs, and Fuel Costs (nominal annual rate) 3.0%3
2 A nominal average annual rate of 3.6 percent is assumed for escalation of capital costs during construction. This rate is equivalent to the nominal average annual escalation rate for process plant construction costs between 1947 and 2008 according to the Chemical Engineering Plant Cost Index. 3 An average annual inflation rate of 3.0 percent is assumed. This rate is equivalent to the average annual escalation rate between 1947 and 2008 for the U.S. Department of Labor's Producer Price Index for Finished Goods, the so-called "headline" index of the various Producer Price Indices. (The Producer Price Index for the Electric Power Generation Industry may be more applicable, but that data does not provide a long-term historical perspective since it only dates back to December 2003.)

Carbon Capture and Sequestration Approaches for NGCC Systems, 12/20/10
88 12/20/2010
Exhibit 4-5 Financial Structure for Investor Owned Utility High and Low Risk Projects
Type of Security % of Total
Current (Nominal) Dollar
Cost
Weighted Current
(Nominal) Cost
After Tax Weighted Cost of
Capital Low Risk Debt 50 4.5% 2.25% Equity 50 12% 6% Total 8.25% 7.39% High Risk Debt 45 5.5% 2.475% Equity 55 12% 6.6% Total 9.075% 8.13%
For scenarios that adhere to the global economic assumptions listed in Exhibit 4-4 and utilize one of the finance structures listed in Exhibit 4-5, the multipliers shown in Exhibit 4-6 can be used to translate TOC to TASC to account for the impact of both escalation and interest during construction. TOC is expressed in base-year dollars and the resulting TASC is expressed in mixed-year, current-year dollars over the entire capital expenditure period
Exhibit 4-6 TASC/TOC Factor
Finance Structure High Risk IOU Low Risk IOU Capital Expenditure Period Three Years Three Years TASC/TOC Factor 1.078 1.075
4.7.1 The
Estimating COE with Capital Charge Factors COE
For scenarios that adhere to the global economic assumptions listed in
is the revenue received by the generator per net megawatt-hour during the power plant’s first year of operation, assuming that the COE escalates thereafter at a nominal annual rate equal to the general inflation rate, i.e., that it remains constant in real terms over the operational period of the power plant.
Exhibit 4-4 and utilize one of the finance structures listed in Exhibit 4-5, the following simplified equation can be used to estimate COE as a function of TOC4
Exhibit 4-7, fixed O&M, variable O&M (including fuel), capacity factor and net output. The equation
requires the application of one of the capital charge factors (CCF) listed in . These CCFs are valid only for the global economic assumptions listed in Exhibit 4-4, the stated finance structure, and the stated capital expenditure period.
4 Although TOC is used in the simplified COE equation, the CCF that multiplies it accounts for escalation during construction and interest during construction (along with other factors related to the recovery of capital costs).

Carbon Capture and Sequestration Approaches for NGCC Systems, 12/20/10
89 12/20/2010
Exhibit 4-7 Capital Charge Factors for COE Equation
Finance Structure High Risk IOU Low Risk IOU Capital Expenditure Period Three Years Three Years Capital Charge Factor (CCF) 0.111 0.105
All factors in the COE equation are expressed in base-year dollars. The base year is the first year of capital expenditure, which for this study is assumed to be 2007. As shown in Exhibit 4-4, all factors (COE, O&M and fuel) are assumed to escalate at a nominal annual general inflation rate of 3.0 percent. Accordingly, all first-year costs (COE and O&M) are equivalent to base-year costs when expressed in base-year (2007) dollars.
where:
COE = revenue received by the generator ($/MWh, equivalent to mills/kWh) during the power plant’s first year of operation (but expressed in base-year dollars), assuming that the COE escalates thereafter at a nominal annual rate equal to the general inflation rate, i.e., that it remains constant in real terms over the operational period of the power plant.
CCF = capital charge factor taken from Exhibit 4-7 that matches the applicable finance structure and capital expenditure period
TOC = total overnight capital, expressed in base-year dollars OCFIX = the sum of all fixed annual operating costs, expressed in base-year dollars OCVAR = the sum of all variable annual operating costs, including fuel at 100
percent capacity factor, expressed in base-year dollars CF = plant capacity factor, assumed to be constant over the operational period MWH = annual net megawatt-hours of power generated at 100 percent capacity
factor
4.7.2 The
Estimating LCOE from COE LCOE Exhibit ES-2 was presented in for reference, and is the revenue received by the
generator per net megawatt-hour during the power plant’s first year of operation, assuming that the COE escalates thereafter at a nominal annual rate of 0 percent, i.e., that it remains constant in nominal terms over the operational period of the power plant. To calculate the LCOE, a
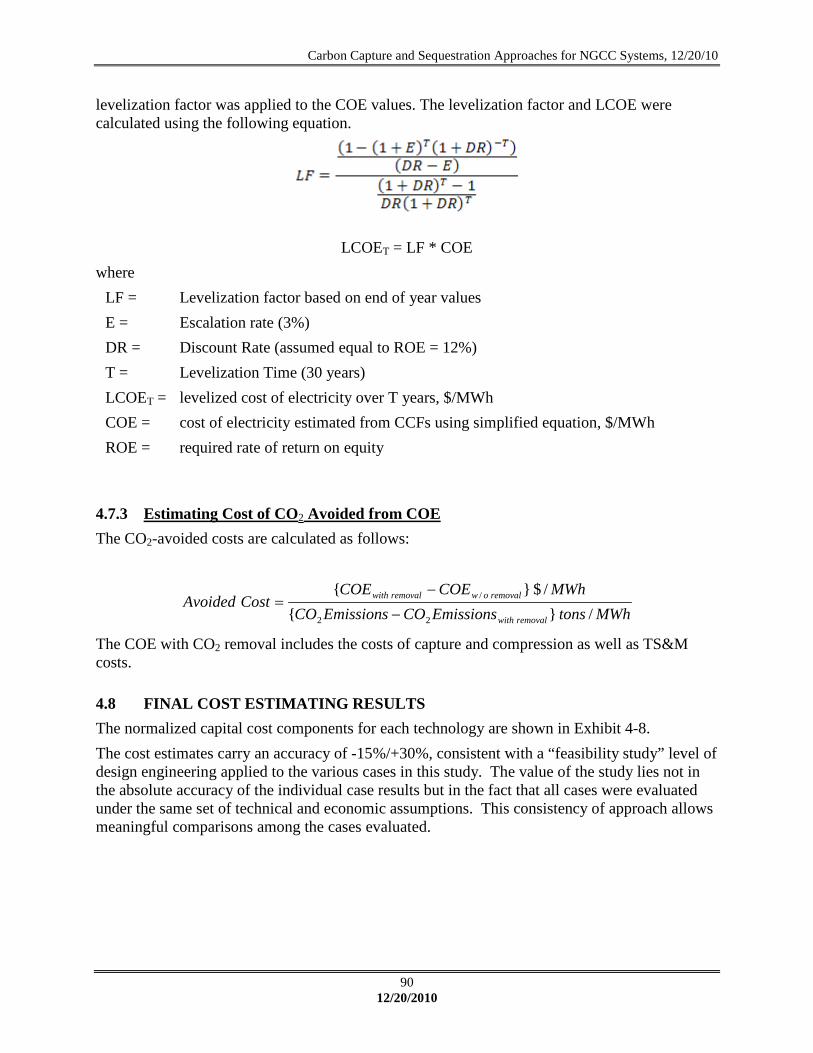
Carbon Capture and Sequestration Approaches for NGCC Systems, 12/20/10
90 12/20/2010
levelization factor was applied to the COE values. The levelization factor and LCOE were calculated using the following equation.
LCOET = LF * COE
where LF = Levelization factor based on end of year values E = Escalation rate (3%) DR = Discount Rate (assumed equal to ROE = 12%) T = Levelization Time (30 years) LCOET = levelized cost of electricity over T years, $/MWh COE = cost of electricity estimated from CCFs using simplified equation, $/MWh ROE = required rate of return on equity
4.7.3 The CO2-avoided costs are calculated as follows:
Estimating Cost of CO2 Avoided from COE
MWhtonsEmissionsCOEmissionsCOMWhCOECOE
CostAvoidedremovalwith
removalowremovalwith
/}{/$}{
22
/
−
−=
The COE with CO2 removal includes the costs of capture and compression as well as TS&M costs.
4.8 FINAL COST ESTIMATING RESULTS The normalized capital cost components for each technology are shown in Exhibit 4-8. The cost estimates carry an accuracy of -15%/+30%, consistent with a “feasibility study” level of design engineering applied to the various cases in this study. The value of the study lies not in the absolute accuracy of the individual case results but in the fact that all cases were evaluated under the same set of technical and economic assumptions. This consistency of approach allows meaningful comparisons among the cases evaluated.

Carbon Capture and Sequestration Approaches for NGCC Systems, 12/20/10
91 12/20/2010
Exhibit 4-8 Plant Capital Cost
482
940819 810 811
996 997
1,266
1,861
40
79
69 65 68
88 89
105
168
62
164
134 125 133
172 167
152
317
0
61
43 108 42
1 1
106
55
133
275
236 245234
286 284
354
517
718
1,519
1,302 1,3541,288
1,544 1,538
1,983
2,918
771
1,637
1,403 1,459 1,468
1,664 1,657
2,138
3,146
0
500
1,000
1,500
2,000
2,500
3,000
3,500
TOC TASC TOC TASC TOC TASC TOC TASC TOC TASC TOC TASC TOC TASC TOC TASC TOC TASC
Ref1 Ref2 1a 1b 1c 2 3 4 5
No Capture Post-Combustion Pre-Combustion Oxy-Combustion
Capi
tal C
osts
, 200
7$/k
WTotal As Spent CapitalOwner's CostProcess ContingencyProject ContingencyHome Office ExpenseBare Erected CostTOCTASC

Carbon Capture and Sequestration Approaches for NGCC Systems, 12/20/10
92 12/20/2010
The COE results are listed in Exhibit 4-9 and shown graphically in Exhibit 4-10. The capital cost, fixed operating cost, variable operating cost, and fuel cost shown separately. In the capture cases, the CO2 transport, storage, and monitoring (TS&M) costs are also shown as a separate bar segment.
Exhibit 4-9 COE Component Details (mills/kWh or $/MWh) for All Cases
Case Ref1 Ref2 1a 1b 1c 2 3 4 5
Capital 10.10 22.66 19.41 20.19 19.21 23.02 22.93 29.58 43.52
Fixed O&M 2.96 5.74 5.04 5.31 4.99 6.00 5.89 7.34 11.17
Variable O&M 1.32 2.60 1.89 2.04 1.89 2.74 2.41 2.74 3.90
Fuel 44.51 52.93 51.79 51.46 50.89 52.87 54.24 53.78 50.05
CO2 TS&M total 0.0 3.25 3.08 3.03 3.03 2.80 2.61 3.25 3.60
Transport 0.0 1.95 1.92 1.88 1.89 1.73 1.56 2.03 2.25
Storage 0.0 0.90 0.83 0.82 0.81 0.74 0.71 0.87 0.97
Monitoring 0.0 0.40 0.33 0.33 0.33 0.33 0.34 0.35 0.39
COE Total 58.90 87.17 81.22 82.02 80.01 87.44 88.08 96.69 112.24
LCOE, total (including TS&M) 74.66 110.50 102.96 103.97 101.42 110.84 111.66 122.57 142.28
1 CF is 85% for NGCC cases It can be seen that Cases 1a, 1b, and 1c all have lower COE than that of the reference case. The efficiencies of Cases 1a, 1b, and 1c increase from 48.0%, 48.3%, to 48.8% (HHV) respectively. This reduces fuel consumption accordingly. The flue gas recycle also reduces the size of the amine CO2 capture unit. This tends to reduce both COE due to fixed and variable O&M costs because the maintenance labor cost, the maintenance material cost, and the property taxes & insurance cost all are related to the overall plant cost. The efficiencies of Cases 2 and 3 are lower compared to the reference case, only 47.0 percent and 45.8 percent respectively. This slightly increases the fuel related COE. In addition, the processes are more complicated with more pieces of key equipment which not only increase the capital costs but also increase the variable O&M costs. Besides the MDEA solution for CO2 capture and removal, additional chemicals are required, such as expensive ZnO to remove sulfur from natural gas, water-gas-shift catalysts for WGS reactors, and reformer catalysts for syngas reformation. Case 4 is very similar to Cases 1a, 1b, and 1c except that the ASU has replaced the amine CO2 capture unit. Case 4 has a lower efficiency of 46.2 percent (LHV) and the ASU is also more expensive than the amine unit. Thus though Case 4 is competitive, its COE is higher. Case 5 is the most expensive configuration with the capital cost almost twice that of the reference case. In addition to the expensive ASU, Case 5 also has a high temperature, high

Carbon Capture and Sequestration Approaches for NGCC Systems, 12/20/10
93 12/20/2010
pressure gas generator, combustor, and a series of unique high temperature, high pressure turboexpanders. Because these pieces of equipment operate at conditions beyond current commercial offerings, large process contingencies were included during evaluation and this configuration has the greatest uncertainty in cost. Though the process is the most efficient, 49.6 percent (LHV), its COE is the highest compared to all the cases evaluated. Case 5 also has a proportionally larger condenser, water circulation pumps, and water treatment facility. The COE with CO2 removal includes the costs of capture and compression as well as TS&M costs. The resulting avoided costs are shown in Exhibit 4-11 for each of the cases in this study. The avoided costs for each capture case are calculated using the NGCC non-capture case (Ref1) as the reference and again with Bituminous Baseline Supercritical Pulverized Coal without CO2 capture as the reference. [1]
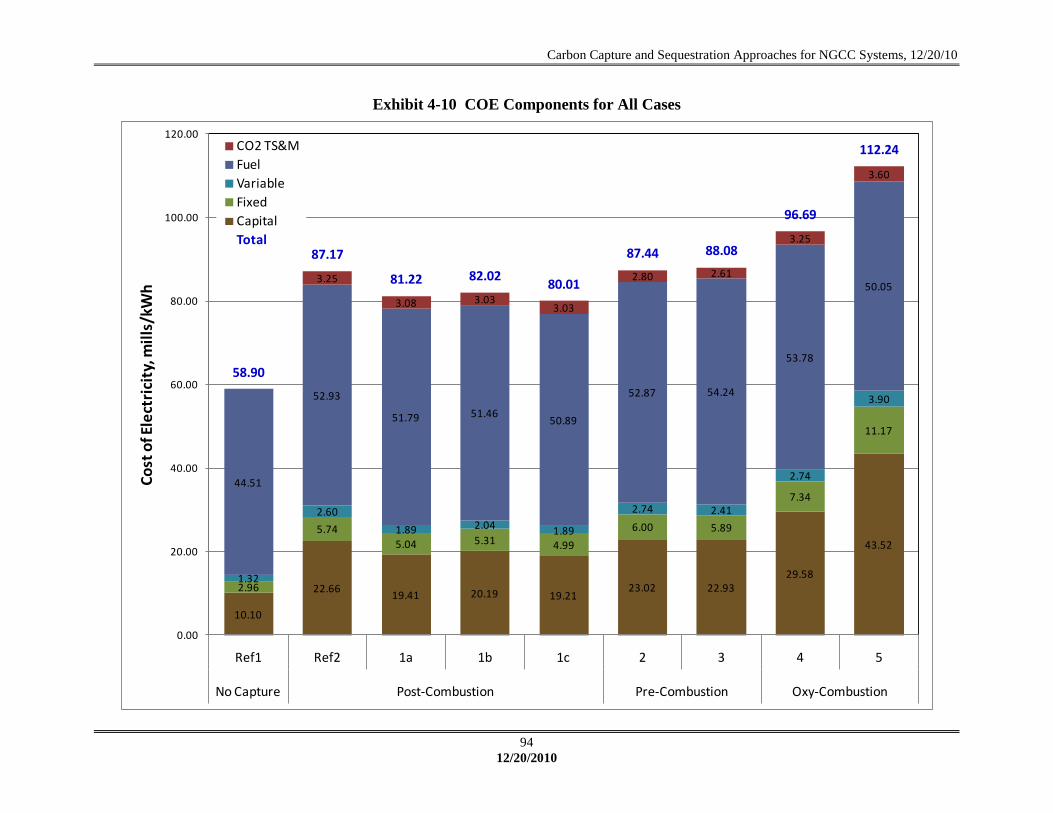
Carbon Capture and Sequestration Approaches for NGCC Systems, 12/20/10
94 12/20/2010
Exhibit 4-10 COE Components for All Cases
10.10
22.6619.41 20.19 19.21
23.02 22.9329.58
43.52
2.96
5.745.04 5.31 4.99
6.00 5.89
7.34
11.17
1.32
2.60
1.89 2.04 1.89
2.74 2.41
2.74
3.90
44.51
52.93
51.79 51.4650.89
52.87 54.24
53.78
50.053.25
3.08 3.033.03
2.80 2.61
3.25
3.60
58.90
87.17
81.22 82.0280.01
87.44 88.08
96.69
112.24
0.00
20.00
40.00
60.00
80.00
100.00
120.00
Ref1 Ref2 1a 1b 1c 2 3 4 5
No Capture Post-Combustion Pre-Combustion Oxy-Combustion
Cost
of E
lect
rici
ty, m
ills/
kWh
CO2 TS&MFuelVariableFixedCapitalTotal

Carbon Capture and Sequestration Approaches for NGCC Systems, 12/20/10
95 12/20/2010
Exhibit 4-11 Summary and Comparison of CO2 Avoided Costs for All Cases
87.31
69.2471.64
65.32
89.8093.12
103.63
146.27
37.14
29.38 30.4227.75
37.79 38.87
47.12
66.51
0
20
40
60
80
100
120
140
160
Ref2 1a 1b 1c 2 3 4 5
Post-Combustion Pre-Combustion Oxy-Combustion
Firs
t Yea
r CO
2A
void
ed C
ost,
$/t
onne
Avoided Cost (NGCC w/o Capture Reference)
Avoided Cost (SC PC w/o Capture Reference)

Carbon Capture and Sequestration Approaches for NGCC Systems, 12/20/10
96 12/20/2010
4.9 EVALUATION OF KEY EQUIPMENT COSTS IN CASES 1 THROUGH 5 AND SENSITIVITY ANALYSES Key equipment costs were evaluated on the basis of methodology discussed in previous sections. The costs for most of the equipment were obtained by scaling and applying factors from equations outlined in previous sections. Some of the unique equipment items with operating pressures and temperatures pushing or beyond limits offered commercially were estimated by WorleyParsons as discussed earlier.
4.9.1 For Case 1a with 35 percent recycle, the gas turbine design was expected to change little. However, a 5 percent process contingency was added to Account 6.1 – Combustion Turbine Generator for unanticipated design modifications to the inlet air system and compressor. For Case 1b with 50 percent recycle, the exhaust gas oxygen content is less than the 4 percent recommended by the gas turbine manufacturer. The gas turbine combustor will have to be redesigned to improve combustion efficiency and minimize CO production. The gas turbine costs were escalated by 20 percent and a 40 percent process contingency was also added.
Case 1a, Case 1b, and Case 1c
The cost of the amine-based CO2 removal system was scaled on the basis of actual gas flow rate into the AGR with an exponent of 0.7. The HRSG was assumed to require redesign to accommodate the change in composition and heat transfer properties of the recycle gas flow. For the 35 percent recycle case, Case 1a, the HRSG was scaled based on heat duty then both the HRSG equipment cost and direct labor were increased by 15 percent. Similarly, after scaling on heat duty, both the equipment and direct labor costs were escalated by 30 percent for the case with 50 percent recycle, Case 1b, because substantially more redesign was anticipated. Case 1c is similar to Case 1a except that the amine AGR unit was revised to improve operating efficiency. The processes for Cases 1a, 1b, and 1c are relatively simple and require minimal modifications from the base case. The substantially reduced gas flow rate into the amine unit for Cases 1a, 1b, and 1c made the amine unit smaller and cheaper, which along with increased efficiency results in a lower COE for these cases relative to the reference case. If the costs of the HRSG and amine unit are doubled, the COE is slightly greater than the reference case in Case 1a and nearly equal to the reference case in Case 1b as shown in Exhibit 4-12 and Exhibit 4-13. The operation of Case 1b with 50 percent flue gas recycle may be marginal because of low concentration of oxygen in the combustor. Further study is needed to verify the combustor efficiency and the CO emissions under the proposed operating conditions.

Carbon Capture and Sequestration Approaches for NGCC Systems, 12/20/10
97 12/20/2010
Exhibit 4-12 Sensitivity Analysis for Case 1a
60
70
80
90
100
110
120
0.60 0.80 1.00 1.20 1.40 1.60 1.80 2.00 2.20
COE,
$/M
Wh
HRSG & AGR Cost Factor
Ref2 Case COE = $87.17 /MWh
Doubling HRSG CostCOE = $82.91/MWh
Doubling Both HRSG & AGR CostCOE = $88.79 /MWh
Case 1a Study ResultCOE = $81.22/MWh
Exhibit 4-13 Sensitivity Analysis of Case 1b
60
70
80
90
100
110
120
0.60 0.80 1.00 1.20 1.40 1.60 1.80 2.00 2.20
COE,
$/M
Wh
HRSG & AGR Cost Factor
Ref2 Case COE = $87.17 /MWh
Doubling HRSG CostCOE = $83.04/MWh
Doubling Both HRSG & AGR CostCOE = $87.37 /MWh
Case 1b Study ResultCOE = $82.02/MWh
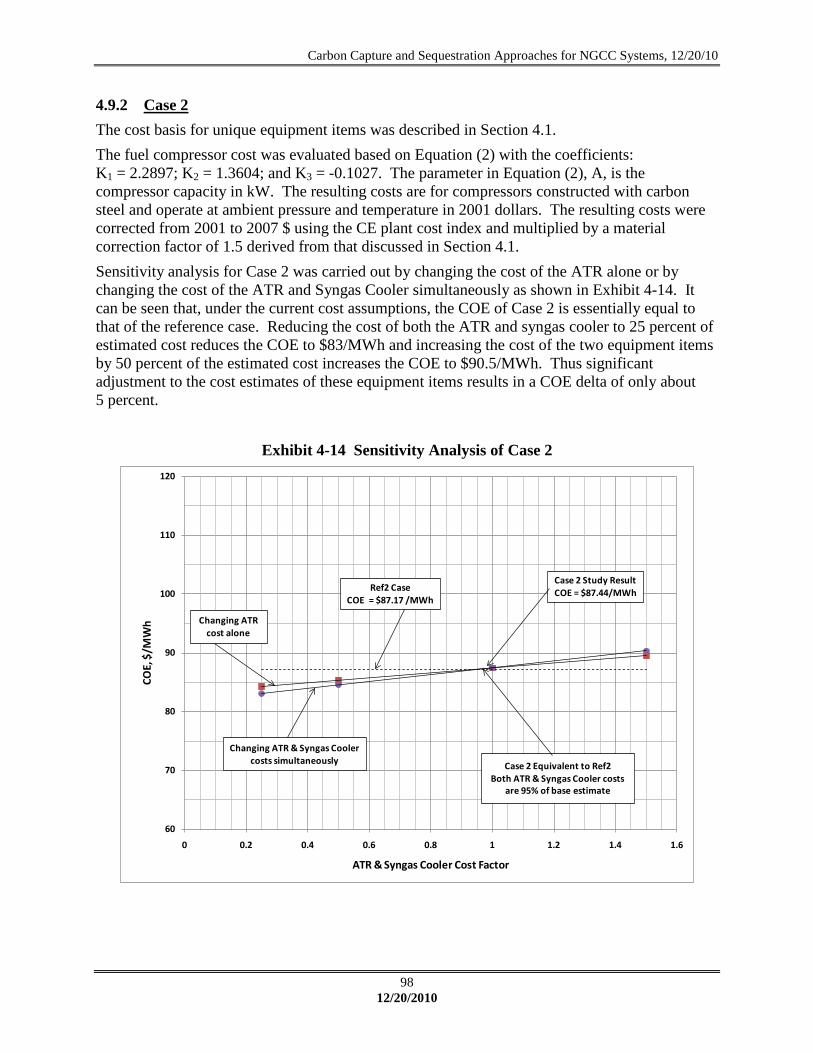
Carbon Capture and Sequestration Approaches for NGCC Systems, 12/20/10
98 12/20/2010
4.9.2 The cost basis for unique equipment items was described in Section
Case 2 4.1.
The fuel compressor cost was evaluated based on Equation (2) with the coefficients: K1 = 2.2897; K2 = 1.3604; and K3 = -0.1027. The parameter in Equation (2), A, is the compressor capacity in kW. The resulting costs are for compressors constructed with carbon steel and operate at ambient pressure and temperature in 2001 dollars. The resulting costs were corrected from 2001 to 2007 $ using the CE plant cost index and multiplied by a material correction factor of 1.5 derived from that discussed in Section 4.1. Sensitivity analysis for Case 2 was carried out by changing the cost of the ATR alone or by changing the cost of the ATR and Syngas Cooler simultaneously as shown in Exhibit 4-14. It can be seen that, under the current cost assumptions, the COE of Case 2 is essentially equal to that of the reference case. Reducing the cost of both the ATR and syngas cooler to 25 percent of estimated cost reduces the COE to $83/MWh and increasing the cost of the two equipment items by 50 percent of the estimated cost increases the COE to $90.5/MWh. Thus significant adjustment to the cost estimates of these equipment items results in a COE delta of only about 5 percent.
Exhibit 4-14 Sensitivity Analysis of Case 2
60
70
80
90
100
110
120
0 0.2 0.4 0.6 0.8 1 1.2 1.4 1.6
COE,
$/M
Wh
ATR & Syngas Cooler Cost Factor
Changing ATR cost alone
Changing ATR & Syngas Cooler costs simultaneously Case 2 Equivalent to Ref2
Both ATR & Syngas Cooler costs are 95% of base estimate
Ref2 Case COE = $87.17 /MWh
Case 2 Study ResultCOE = $87.44/MWh
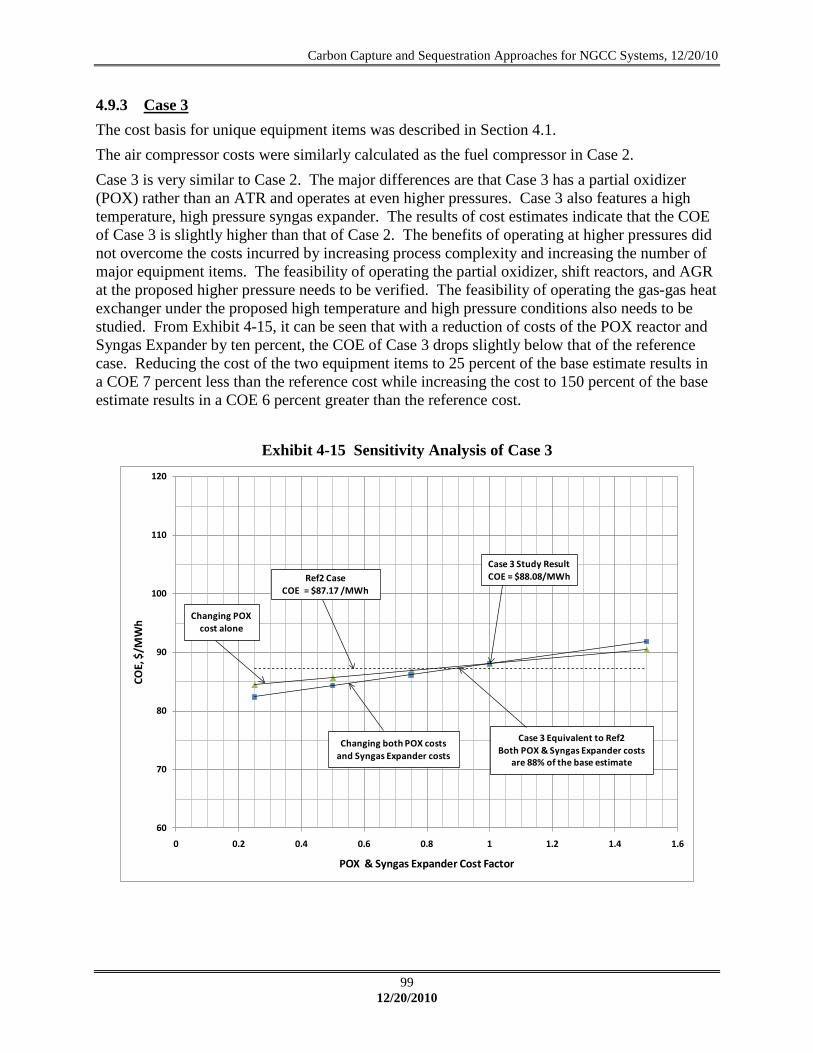
Carbon Capture and Sequestration Approaches for NGCC Systems, 12/20/10
99 12/20/2010
4.9.3 The cost basis for unique equipment items was described in Section
Case 3 4.1.
The air compressor costs were similarly calculated as the fuel compressor in Case 2. Case 3 is very similar to Case 2. The major differences are that Case 3 has a partial oxidizer (POX) rather than an ATR and operates at even higher pressures. Case 3 also features a high temperature, high pressure syngas expander. The results of cost estimates indicate that the COE of Case 3 is slightly higher than that of Case 2. The benefits of operating at higher pressures did not overcome the costs incurred by increasing process complexity and increasing the number of major equipment items. The feasibility of operating the partial oxidizer, shift reactors, and AGR at the proposed higher pressure needs to be verified. The feasibility of operating the gas-gas heat exchanger under the proposed high temperature and high pressure conditions also needs to be studied. From Exhibit 4-15, it can be seen that with a reduction of costs of the POX reactor and Syngas Expander by ten percent, the COE of Case 3 drops slightly below that of the reference case. Reducing the cost of the two equipment items to 25 percent of the base estimate results in a COE 7 percent less than the reference cost while increasing the cost to 150 percent of the base estimate results in a COE 6 percent greater than the reference cost.
Exhibit 4-15 Sensitivity Analysis of Case 3
60
70
80
90
100
110
120
0 0.2 0.4 0.6 0.8 1 1.2 1.4 1.6
COE,
$/M
Wh
POX & Syngas Expander Cost Factor
Ref2 Case COE = $87.17 /MWh
Changing POX cost alone
Changing both POX costsand Syngas Expander costs
Case 3 Equivalent to Ref2Both POX & Syngas Expander costs
are 88% of the base estimate
Case 3 Study ResultCOE = $88.08/MWh

Carbon Capture and Sequestration Approaches for NGCC Systems, 12/20/10
100 12/20/2010
4.9.4 No cost correction was applied to the HRSG in this case. The flow rate through the HRSG is actually 20 percent less than the reference case.
Case 4
Case S1A from the Low Rank Coal Study [21
21
] was employed as a reference case for cost estimates for the ASU. The costs were scaled on the basis of air compressor power with an exponent of 0.57 derived from a correlation established from analyzing the costs of Cases S1A, S1B, L1A, and L1B of the Low Rank Coal Study [ ]. The fuel compressor cost was calculated as discussed in Section 4.1.1 with a cost index correction factor of 1.34 (to 2007 dollars) and a material correction factor of 2.5. The high pressure ratio combustion turbine was assumed to be 50 percent more expensive than that of the advanced 7FB and a process contingency of 40 percent was also added. The results gave a COE of Case 4 slightly higher than that of the reference case (see Exhibit 4-16) but the sensitivity analysis shows that even with a significant reduction (75 percent) in the turbine costs and elimination of the process contingency, the COE for Case 4 is still higher than the reference case.
Exhibit 4-16 Sensitivity Analysis of Case 4
60
70
80
90
100
110
120
0.00 0.20 0.40 0.60 0.80 1.00 1.20 1.40 1.60
COE,
$/M
Wh
Gas Turbine Cost Factor
Case 4Turbine Cost = 75% lower than base estimate
Zero Process Contingency cost
Ref2 Case COE = $87.17 /MWh
Case 4 Study ResultCOE = $96.69/MWh
Carbon Capture and Sequestration Approaches for NGCC Systems, 12/20/10
101 12/20/2010
4.9.5 The ASU was scaled similarly as that in Case 4 employing Case S1A from the Low Rank Coal Study as a reference case with an exponent of 0.57 [
Case 5
21]. The cost of the gas generator was evaluated using reference cost for the CoP gasifier from Case 3 of the Bituminous Baseline Study [1]. Syngas cooling costs were removed from the lumped gasifier costs before scaling. The costs of the high temperature turboexpander were provided by WorleyParsons as discussed earlier. Both the costs of the combustion turbine generator and steam turbine generator were removed and replaced with the costs of the turboexpander. The cost of the high temperature combustor was assumed to be 15 percent of the cost of combustion turbine. The costs of the cooling tower and HRSG were also removed while the condenser and auxiliary costs remained. Condenser costs were scaled on the basis of heat duty with an exponent of 0.7. The fuel compressor costs were evaluated following the same methodology employed in Case 4 with a cost index correction factor of 1.34 and a material correction factor of 2.5. Case 5 has the greatest cost uncertainty and is substantially more expensive than all other cases. It also introduces some one-of-a-kind equipment items, such as the high temperature, high pressure turboexpander, gas generator, and reheat combustor. The sensitivity analysis shown in Exhibit 4-17 indicates that even with the turboexpander cost reduced to 25 percent of assumed cost; or reducing the costs of the turboexpander, reheat combustor, and gas generator to 50 percent of assumed costs; or reducing the costs of the turboexpander, reheat combustor, gas generator, and ASU to 50 percent of assumed costs; the COE of Case 5 is still much higher than that of the reference case.

Carbon Capture and Sequestration Approaches for NGCC Systems, 12/20/10
102 12/20/2010
Exhibit 4-17 Sensitivity Analysis of Case 5
60
70
80
90
100
110
120
0.0 0.2 0.4 0.6 0.8 1.0 1.2 1.4 1.6
LCO
E, $
/MW
h
Cost Factor
Changing Turboexpander Cost Alone
Costs of Expander, Combustor, Gas Generator = 50% of base estimate
Costs of Expander, Combustor, Gas Generator & ASU = 50% of base estimate
Ref2 Case COE = $87.17 /MWh
Case 5 Study ResultCOE = $112624MWh

Carbon Capture and Sequestration Approaches for NGCC Systems, 12/20/10
103 12/20/2010
5. A summary table showing quantitative (performance estimates) and qualitative (maturity, level of complexity, and technology status) items for all cases is shown in
CONCLUSIONS
Exhibit 5-1. The following conclusions were drawn from the performance:
• The post-combustion CO2 capture processes using EGR and the CES-based system have higher net efficiencies than the reference capture case, which consists of conventional NGCC and post-combustion amine capture. The pre-combustion capture cases and the conventional oxy-combustion case are approximately equal to or less than the reference capture case in net efficiency.
• The efficiency spread is only 3.4 absolute percentage point between the highest and lowest efficiency capture technology (HHV basis).
• The normalized water demand varies from 6.5 to 9.6 gpm/MWnet for the capture cases. At the low end of the range is case 3, high pressure partial oxidation with amine CO2 separation, primarily because the additional power recovered in the syngas expander results in the highest net output of all the cases as opposed to a significant reduction in water demand. At the high end of the range is the post-combustion capture reference case (Ref2), which has a relatively high water demand because of the Econamine process and relatively low net output.
• Raw water consumption for the capture cases varies over a narrower range than demand, 4.8 to 6.4 gpm/MWnet, primarily because the technologies with high demand also had high process water discharge which serves to reduce consumption.
A summary table showing the cost estimation results for all cases is shown in Exhibit 5-2. The cost results and sensitivity analyses lead to the following conclusions:
• Case 1c with 35 percent EGR and reduced amine reboiler duty has the lowest COE of all CO2 capture cases, including the reference case.
• All three cases employing EGR have comparable and relatively low COEs. The simple modification of providing various amounts of flue gas recycle performs much better compared to other cases evaluated. Cases 1a, 1b, and 1c employ conventional technologies which can be readily implemented commercially with minimum modifications. The optimal amount of recycled flue gas and feasibility based on flue gas oxygen content still needs to be determined.
• The pre-combustion capture cases (Case 2 and Case 3) are quite similar. Case 3 features a high temperature, high pressure syngas expander that operates outside the range of the currently available commercial machines. The process cycles are quite complicated with gas-gas heat exchangers, syngas cooling, shift reactors, air compressors, and fuel gas expanders, in addition to the AGR or POX. The number of equipment items and process complexity result in higher COEs than the EGR cases, but is still competitive with the reference case COE. Remaining to be verified are the feasibility and availability of reactor operations including the ATR, POX, shift reactors, and AGR at high temperature and high pressure operating conditions.
• Substituting oxygen for air results in the highest COEs of the cases examined in this study. Case 4, a more conventional oxy-combustion concept, has a COE that is
Carbon Capture and Sequestration Approaches for NGCC Systems, 12/20/10
104 12/20/2010
11 percent higher than the reference capture case. The ASU is more costly than the amine CO2 removal system it replaces and thus is also more costly than Cases 1a, 1b, and 1c.
• The CES-based system was the most expensive in the current study. The case contains several expensive pieces of equipment, including the ASU, the very high temperature, high pressure gas generator, and reheat combustor, and the high temperature, high pressure turboexpander. This process also had the highest degree of cost uncertainty. Even when reducing the cost of the ASU, the gas generator, the reheat combustor and the expander by 50 percent, the COE for Case 5 was still greater than the reference case. In addition, Case 5 generates the lowest net power compared to other cases, which also negatively impacts the COE.
The cases examined in this study largely show promise for reducing CO2 emissions at costs that are lower than simply applying a post-combustion amine system to a conventional NGCC system. The EGR technologies are relatively simple and result in reduced capital cost as well as increased efficiency, which in turn translate to lower COE compared to the reference CO2 capture case. The pre-combustion cases operate at a different pressure profile than the post-combustion cases using significantly different equipment items, but still result in a COE that is nearly equivalent to the reference case. The difference in the COE capital cost component between the pre-combustion cases and the reference case is small. The oxy-combustion based systems are the most expensive of the technologies examined in this study. Uncertainty in cost for specific equipment items contributed to the increased COE. However, the cost sensitivity analysis showed that even when greatly discounting the cost of the uncertain equipment items, the COE still remained greater than the reference case.

Carbon Capture and Sequestration Approaches for NGCC Systems, 12/20/10
105 12/20/2010
Exhibit 5-1 Summary Performance Table Case Ref1 Ref2 Ref2 1a 1b 1c 2 3 4 5
Description Non-capture Capture Modified Post-combustion
with 35% exhaust gas
recycle
Post-combustion
with 50% exhaust gas
recycle
Post-combustion
with 35% exhaust gas
recycle & lower amine
system steam
Pre-combustion
ATR
Pre-combustion
high pressure POX-GE
configuration
Oxy-combustion
with CO2
recycle
CES-BasedOxy-
combustion with
water/steam recycle
Gas Turbine Power (kWe) 362,200 362,200 362,200 361,600 359,800 361,600 384,227 456,776 362,100Steam Turbine Power (kWe) 202,500 148,800 148,800 151,400 155,700 160,200 260,973 172,422 223,800
Syngas Expander (kWe) 97,950Total (kWe) 564,700 511,000 511,000 513,000 515,500 521,800 645,200 727,148 585,900 528,700
ASU Compression (kWe) 70,740 50,920Fuel Gas Compression (kWe) 25,680
Oxygen Compression (kWe) 28,520 26,740Condensate Pumps (kWe) 170 80 80 80 90 100 250 160 160 70
Boiler Feedwater Pumps (kWe) 2,720 2,710 2,710 2,750 2,840 2,750 4,220 2,280 2,900 2,660Amine System Auxiliaries (kWe) 0 9,600 16,364 10,637 8,182 10,637 1,000 1,200 NA NA
CO2 Compression (kWe) 0 15,200 15,200 14,910 14,950 14,910 19,110 21,820 20,880 31,940Circulating Water Pump (kWe) 2,300 4,360 4,360 4,110 4,150 4,310 3,430 2,900 5,260 3,086
Ground Water Pumps (kWe) 210 360 360 340 340 360 400 280 430 255Cooling Tower Fans (kWe) 1,190 2,250 2,250 2,120 2,140 2,230 1,770 1,500 2,720 1,592
SCR (kWe) 10 10 10 10 10 10 10 10Turbine Auxiliaries (kWe) 829
Gas Turbine Auxiliaries (kWe) 700 700 700 1,000 1,000 1,000 700 700 1,000Steam Turbine Auxiliaries (kWe) 100 100 100 100 100 100 100 100 100Miscellaneous Balance of Plant
(kWe) 500 500 500 500 500 500 500 500 500 500Transformer Losses (kWe) 1,720 1,560 1,580 1,640 1,640 1,670 2,030 2,390 1,850 1,840
Air Compression (kWe) 37,300Natural Gas Compression (kWe) 6,310 1,410 2,340
Total 9,620 37,430 44,214 38,197 35,942 38,577 59,200 77,450 136,470 122,772
Net Auxiliary Load (kWe) 9,620 37,430 44,214 38,197 35,942 38,577 59,200 77,450 136,470 122,772Net Plant Power (kWe) 555,080 473,570 466,786 474,803 479,558 483,223 586,000 649,698 449,430 405,928
Net Plant Efficiency (HHV) 50.2% 42.8% 42.2% 43.2% 43.5% 44.0% 42.4% 41.3% 41.6% 44.7%
Net Plant Efficiency (LHV) 55.7% 47.5% 46.8% 48.0% 48.3% 48.8%
47.0% 47.6%1
45.9%2
46.9%3
49.7%445.8% 47.5%5
46.2% 47.0%3
46.2%4 49.6%Net Plant Heat Rate (HHV)
[kJ/kWhr (Btu/kWhr)] 7,172 (6,798) 8,406 (7,968) 8,528 (8,083) 8,326 (7,892) 8,274 (7,842) 8,181 (7,754) 8,500 (8,057) 8,720 (8,265) 8,646 (8,194) 8,046 (7,626)Net Plant Heat Rate (LHV)
[kJ/kWhr (Btu/kWhr)] 6,466 (6,129) 7,579 (7,184) 7,689 (7,288) 7,507 (7,115) 7,460 (7,070) 7,376 (6,991) 7,664 (7,264) 7,863 (7,452) 7,795 (7,388) 7,255 (6,876)Natural Gas Feed Flow
[kg/hr (lb/hr)]75,901
(167,333)75,901
(167,333)75,901
(167,333)75,374
(166,172)75,648
(166,774)75,374
(166,172)94,971
(209,375)108,022
(238,148)74,083
(163,325)62,272
(137,285)Thermal Input (HHV) [kWth] 1,105,812 1,105,812 1,105,812 1,098,140 1,102,121 1,098,140 1,383,644 1,573,791 1,079,327 907,255Thermal Input (LHV) [kWth] 997,032 997,032 997,032 990,114 993,704 990,114 1,247,533 1,418,975 973,152 818,007 y [
(MMBtu/hr)] 1,139 (1,080) 528 (500) 528 (500) 549 (520) 570 (540) 654 (620) 1,340 (1,270) 1,087 (1,030) 1,139 (1,080) 1,245 (1,180)Raw Water Withdrawal
[m3/min (gpm)] 8.9 (2,362) 15.1 (3,980) 15.1 (3,980) 14.2 (3,741) 14.1 (3,729) 14.9 (3,944) 16.8 (4,430) 11.8 (3,104) 18.2 (4,801) 10.6 (2,801)Raw Water Consumption
[m3/min (gpm)] 6.9 (1,831) 11.3 (2,985) 11.3 (2,985) 10.6 (2,802) 10.5 (2,781) 11.2 (2,959) 13.8 (3,638) 9.2 (2,434) 13.6 (3,584) 7.8 (2,056)Removal Efficiency 0.0% 90.7% 90.7% 90.5% 90.4% 90.5% 89.6% 88.9% >99% >99%
Maturity Mature Developmental Developmental Conceptual Conceptual Conceptual Conceptual Conceptual Conceptual Conceptual
Level of Complexity Low Low Low Low Low Low High High Low Medium
Technology Status Commercial
Demonstrated (on coal fired
plants)
Demonstrated (on coal fired
plants)
Future development:
6-10 years
Future development:
6-10 years
Future development:
6-10 years
Future development:
6-10 years
Future development:
6-10 years
Future development:
6-10 years
Future development:
6-10 years
1Analysis of Gas-Steam CC w/NG reforming & CO2 Capture: Corradetti & Desideri2NG fired Power plants w/CO2 Capture: Kvamsdal , Anderson, & Bolland3A quantitative comparison of gas turbine cycles w/CO2 capture: Kvamsdal, Jordal, & Bolland4CO2 Capture from NGCC: Lozza, Chiesa, Romanco, & Valenti5Performance & Cost Analysis of Advanced Gas Turbine Cycles w/pre-combustion CO2 capture: Hoffmann, Bartlett, Finkenrath, Evulet, & Ursin
Plant Performance
Auxiliary Load
Plant Output


Carbon Capture and Sequestration Approaches for NGCC Systems, 12/20/10
107 12/20/2010
Exhibit 5-2 Summary Cost Results Case Ref1 Ref2 1a 1b 1c 2 3 4 5
Capital Costs ($/kW) Bare Erected Cost 482 940 819 810 811 996 997 1,266 1,861 Home Office Expense 40 79 69 65 68 88 89 105 168
Process Contingency 0 61 43 108 42 1 1 106 55
Project Contingency 62 164 134 125 133 172 167 152 317
Owner's Cost 133 275 236 245 234 286 284 354 517 TOC 718 1,519 1,302 1,354 1,288 1,544 1,538 1,983 2,918 Total As Spent Capital 771 1,637 1,403 1,459 1,468 1,664 1,657 2,138 3,146
COE, (mills/kWh) Capital 10.10 22.66 19.41 20.19 19.21 23.02 22.93 29.58 43.52 Fixed O&M 2.96 5.74 5.04 5.31 4.99 6.00 5.89 7.34 11.17 Variable O&M 1.32 2.60 1.89 2.04 1.89 2.74 2.41 2.74 3.90 Fuel 44.51 52.93 51.79 51.46 50.89 52.87 54.24 53.78 50.05 CO2 TS&M total 0.0 3.25 3.08 3.03 3.03 2.80 2.61 3.25 3.60
Transport 0.0 1.95 1.92 1.88 1.89 1.73 1.56 2.03 2.25 Storage 0.0 0.90 0.83 0.82 0.81 0.74 0.71 0.87 0.97
Monitoring 0.0 0.40 0.33 0.33 0.33 0.33 0.34 0.35 0.39 COE Total 58.90 87.17 81.22 82.02 80.01 87.44 88.08 96.69 112.24
LCOE, total (including TS&M) 74.66 110.50 102.96 103.97 101.42 110.84 111.66 122.57 142.28
Cost of CO2 Avoided ($/tonne) NGCC w/o Capture as Reference
87.31 69.24 71.64 65.32 89.80 93.12 103.63 146.27
Cost of CO2 Avoided ($/tonne) SC PC w/o Capture as Reference
37.14 29.38 30.42 27.75 37.79 38.87 47.12 66.51


Carbon Capture and Sequestration Approaches for NGCC Systems, 12/20/10
109 12/20/2010
Exhibit A-1 Comparison of Total Plant Costs APPENDIX A - ACCOUNT BY ACCOUNT COMPARISON OF COSTS FOR ALL CASES
Ref2 Case Case 1a Case 1b Case 1c Case 2 Case 3 Case 4 Case 5
Cost Base (June, 2007) = $x1,000 Total Plant Cost Acct
No. Item/Description
3 FEEDWATER & MISC. BOP SYSTEMS 3.1 Feedwater System 8,690 8,803 9,011 8,803 12,169 7,612 9,208 9,479 3.2 Water Makeup & Pretreating 4,497 4,305 4,295 4,469 4,853 3,770 5,140 6,186 3.3 Other Feedwater Subsystems 2,229 2,258 2,312 2,258 3,122 1,953 2,362 2,432 3.4 Service Water Systems 3,188 3,051 3,044 3,167 3,440 2,672 3,643 4,384 3.5 Other Boiler Plant Systems 4,798 4,592 4,581 4,767 5,177 4,022 5,483 6,598 3.6 Natural Gas, incl. pipeline 19,389 19,372 19,388 19,372 19,987 20,587 19,295 18,202 3.7 Waste Treatment Equipment 1,569 1,502 1,499 1,560 1,694 1,316 1,794 2,159 3.8 Misc. Equip.(Cranes,AirComp.,Comm.) 1,951 1,948 1,950 1,948 2,010 2,071 1,941 1,831
SUBTOTAL 3. 46,312 45,831 46,080 46,346 52,451 44,003 48,867 51,270 4 GASIFIER & ACCESSORIES
4.1 Gasifier, Syngas Cooler & Auxiliaries 0 0 0 0 0 0 0 0 4.2 Syngas Cooling 0 0 0 0 0 0 0 0 4.3 ASU/Oxidant Compression 0 0 0 0 0 0 269,594 154,838 4.4 LT Heat Recovery & FG Saturation 0 0 0 0 56,392 31,413 0 0 4.5 Misc. Gasification Equipment 0 0 0 0 0 0 0 0 4.6 Other Gasification Equipment 0 0 0 0 0 0 0 0 4.8 Major Component Rigging 0 0 0 0 0 0 0 0 4.9 Gasification Foundations 0 0 0 0 0 0 0 0
SUBTOTAL 4. 0 0 0 0 56,392 31,413 269,594 154,838 5A GAS CLEANUP & PIPING
5A.1 ATR (Case 2), POX (Case 3), Gas Generator (Case 5) 0 0 0 0 105,682 132,834 0 182,463
5A.2 Syngas Cooling 0 0 0 0 40,347 42,899 0 0 5A.3 Gas-Gas Heat Exchangers 0 0 0 0 33,901 73,321 0 4,136

Carbon Capture and Sequestration Approaches for NGCC Systems, 12/20/10
110 12/20/2010
Ref2 Case Case 1a Case 1b Case 1c Case 2 Case 3 Case 4 Case 5
5A.4 WGS Reactors 0 0 0 0 26,338 20,023 0 0 5A.5 Zinc Oxide Guard Bed 0 0 0 0 1,138 1,246 0 0 5A.7 Fuel Gas Compressors 0 0 0 0 0 0 2,953 0 5A.9 HGCU Foundations 0 0 0 0 0 0 0 0
SUBTOTAL 5A. 0 0 0 0 207,406 270,324 2,953 186,599 5B CO2 REMOVAL & COMPRESSION 5B.1 CO2 Removal System 215,943 121,957 100,444 121,957 64,087 41,818 0 0 5B.2 CO2 Compression & Drying 24,390 34,993 35,056 34,993 28,377 29,256 28,960 31,936
SUBTOTAL 5B. 240,334 156,950 135,500 156,950 92,464 71,074 28,960 31,936 6 COMBUSTION TURBINE/ACCESSORIES
6.1 Combustion Turbine Generator 95,589 99,593 148,710 99,593 95,588 95,588 180,333 0 6.2 Combustion Turbine Accessories 0 0 0 0 0 0 0 0 6.3 Compressed Air Piping 0 0 0 0 0 0 0 0
6.4 Air or Fuel Compressors (Cases 2, 3, & 5) 0 0 0 0 4,931 14,401 0 2,854
6.5 Syngas Expanders (Case 3) or Turboexpander (Case 5) 0 0 0 0 0 77,533 0 354,384
6.6 HT Combustor (Case 5) 0 0 0 0 0 0 0 39,491 6.9 Combustion Turbine Foundations 1,901 1,902 1,902 1,902 1,902 1,902 1,902 1,902
SUBTOTAL 6. 97,490 101,495 150,612 101,495 102,421 189,424 182,235 398,631 7 HRSG, DUCTING & STACK
7.1 Heat Recovery Steam Generator 44,448 45,874 43,740 45,874 46,543 46,197 8,957 0 7.2-7.9
SCR System, Ductwork, Stack, & Foundations 3,120 2,800 2,362 2,800 3,267 3,243 629 0
7.3 Ductwork 0 0 0 0 0 0 0 0 7.4 Stack 0 0 0 0 0 0 0 0 7.9 HRSG,Duct & Stack Foundations 1,057 798 657 798 1,318 1,403 122 0
SUBTOTAL 7. 48,624 49,472 46,759 49,472 51,128 50,843 9,708 0 8 STEAM TURBINE GENERATOR
8.1 Steam TG & Accessories 27,110 27,445 27,997 28,569 40,398 30,100 36,223 0 8.2 Turbine Plant Auxiliaries 548 555 566 578 826 610 738 0 8.3 Condenser & Auxiliaries 3,711 3,658 3,756 4,114 6,849 5,894 6,085 6,480

Carbon Capture and Sequestration Approaches for NGCC Systems, 12/20/10
111 12/20/2010
Ref2 Case Case 1a Case 1b Case 1c Case 2 Case 3 Case 4 Case 5
8.4 Steam Piping 8,281 8,373 8,529 8,436 11,489 7,282 8,762 9,012 8.9 TG Foundations 2,140 2,167 2,210 2,258 3,225 2,383 2,883 5,400
SUBTOTAL 8. 41,791 42,199 43,057 43,955 62,787 46,269 54,691 20,892 9 COOLING WATER SYSTEM
9.1 Cooling Towers 8,182 7,857 7,907 8,107 1,816 1,730 9,338 0 9.2 Circulating Water Pumps 2,232 2,257 2,272 2,330 1,998 1,786 2,665 2,929 9.3 Circ.Water System Auxiliaries 184 178 179 183 158 142 208 228 9.4 Circ.Water Piping 6,128 10,170 10,230 10,464 9,106 8,226 11,821 12,879 9.5 Make-up Water System 912 880 878 908 974 786 1,022 1,195 9.6 Component Cooling Water Sys 983 948 954 977 844 758 1,110 1,215 9.9 Circ.Water System Foundations 6,783 6,558 6,596 6,742 5,892 5,338 7,588 8,245
SUBTOTAL 9. 25,403 28,848 29,016 29,711 20,787 18,767 33,751 26,692 11 ACCESSORY ELECTRIC PLANT 11.1 Generator Equipment 10,028 10,051 10,080 10,153 11,507 11,338 10,871 10,232 11.2 Station Service Equipment 2,498 2,520 2,455 2,531 3,042 3,415 4,357 4,163 11.3 Switchgear & Motor Control 3,402 3,431 3,342 3,445 4,142 4,649 5,932 5,668 11.4 Conduit & Cable Tray 5,949 6,001 5,846 6,027 7,245 8,133 10,376 9,915 11.5 Wire & Cable 7,337 7,400 7,209 7,432 8,935 10,029 12,795 12,226 11.6 Protective Equipment 2,966 2,966 2,966 2,966 2,966 2,966 2,966 2,966 11.7 Standby Equipment 224 224 225 226 251 248 239 228 11.8 Main Power Transformers 12,937 13,184 13,184 13,430 16,473 15,100 15,100 20,137 11.9 Electrical Foundations 546 547 549 554 643 632 601 559
SUBTOTAL 11. 45,888 46,325 45,857 46,763 55,204 56,509 63,237 66,093 12 INSTRUMENTATION & CONTROL 12.1 IGCC Control Equipment 0 0 0 0 0 0 0 0 12.2 Combustion Turbine Control 0 0 0 0 0 0 0 0 12.3 Steam Turbine Control 0 0 0 0 0 0 0 0 12.4 Other Major Component Control 1,690 1,694 1,681 1,697 1,794 1,858 2,000 1,972 12.5 Signal Processing Equipment 0 0 0 0 0 0 0 0 12.6 Control Boards,Panels & Racks 497 498 494 499 528 546 588 580 12.7 Computer & Accessories 4,892 4,905 4,866 4,911 5,192 5,377 5,788 5,709 12.8 Instrument Wiring & Tubing 2,426 2,431 2,412 2,435 2,574 2,665 2,869 2,830

Carbon Capture and Sequestration Approaches for NGCC Systems, 12/20/10
112 12/20/2010
Ref2 Case Case 1a Case 1b Case 1c Case 2 Case 3 Case 4 Case 5
12.9 Other I & C Equipment 5,813 5,827 5,781 5,835 6,169 6,388 6,876 6,783 SUBTOTAL 12. 15,318 15,356 15,235 15,376 16,257 16,834 18,121 17,874
13 IMPROVEMENTS TO SITE 13.1 Site Preparation 2,524 2,499 2,499 2,501 2,511 2,501 2,569 2,515 13.2 Site Improvements 2,472 2,447 2,447 2,449 2,459 2,449 2,516 2,463 13.3 Site Facilities 4,471 4,427 4,426 4,429 4,448 4,430 4,551 4,454
SUBTOTAL 13. 9,467 9,373 9,372 9,379 9,418 9,380 9,636 9,431 14 BUILDINGS & STRUCTURES 14.1 Combustion Turbine Area 447 447 447 447 447 447 447 447 14.2 Steam Turbine Building 4,756 4,656 4,655 4,662 4,704 4,664 4,939 4,718 14.3 Administration Building 962 950 950 951 956 951 984 957 14.4 Circulation Water Pumphouse 272 267 268 272 248 231 295 313 14.5 Water Treatment Buildings 1,089 1,042 1,040 1,082 1,175 913 1,244 1,498 14.6 Machine Shop 815 813 813 813 814 813 819 814 14.7 Warehouse 515 514 514 514 514 514 517 515 14.8 Other Buildings & Structures 166 166 166 166 165 166 167 166 14.9 Waste Treating Building & Str. 1,052 1,045 1,045 1,050 1,061 1,028 1,069 1,094
SUBTOTAL 14. 10,075 9,900 9,897 9,957 10,084 9,726 10,480 10,522 TOTAL PLANT COST 580,701 505,749 531,385 509,404 736,801 814,567 732,234 974,777
OWNERS Preproduction Costs 6 Months All Labor 4,163 3,858 4,1163 3,876 5,712 6,108 4,960 7,136 1 Month Maintenance Materials 612 540 612 545 822 915 800 1,070 1 Month Non-fuel Consumables 273 232 226 242 559 429 258 289 1 Month Waste Disposal 0 0 0 0 0 0 0 0
25% of 1 Months Fuel Cost at 100% CF 4,509 4,489 4,505 4,489 5,656 6,434 4,412 3,709
2% of TPC 11,614 10,115 10,628 10,188 14,736 16,291 14,645 19,496 SUBTOTAL Production Costs 21,170 19,235 20,134 19,339 27,485 30,176 25,075 31,699 Inventory Capital
60 day supply of consumables at 100% CF 357 287 276 296 907 710 289 282

Carbon Capture and Sequestration Approaches for NGCC Systems, 12/20/10
113 12/20/2010
Ref2 Case Case 1a Case 1b Case 1c Case 2 Case 3 Case 4 Case 5
0.5% of TPC (spare parts) 2,904 2,529 2,657 2,547 3,684 4,073 3,661 4,874 SUBTOTAL Inventory Capital 3,260 2,816 2,933 2,843 4,591 4,783 3,951 5,156
Initial Cost for Catalyst and Chemicals 823 390 307 390 4,930 4,930 0 47
Land 300 300 300 300 300 300 300 300 Other Owner's Costs 87,105 75,862 79,708 76,411 110,520 122,185 109,835 146,217 Financing Costs 15,679 13,665 14,347 13,754 19,894 21,993 19,770 26,319 TOTAL OVERNIGHT COST 709,039 618,008 649,113 622,441 904,522 998,934 891,165 1,184,515 TOTAL AS-SPENT COST 764,344 704,529 739,989 709,583 1,031,155 1,138,785 1,015,928 1,350,5347

Carbon Capture and Sequestration Approaches for NGCC Systems, 12/20/10
114 12/20/2010
This page intentionally left blank

Carbon Capture and Sequestration Approaches for NGCC Systems, 12/20/10
115 12/20/2010
6. REFERENCES
1 Cost and Performance Baseline for Fossil Energy Plants, Volume 1: Bituminous Coal and Natural Gas to Electricity, Revision 2, DOE/NETL-2010/1397, November 2010.
2 NETL Power Systems Financial Model Version 5.0, December 2008 User Guide available at: http://www.netl.doe.gov/business/solicitations/ssc2008/references/PSFM%20User%20Guide.pdf
3 Quality Guidelines for Energy System Studies, prepared by DOE NETL Office of Systems and Policy Support, June 4, 2003
4 Gross Domestic Product: Chain-type Price Index, Seasonally Adjusted, http://research.stlouisfed.org/fred2/series/GDPCTPI
5 Improvement in Power Generation with Post-Combustion Capture of CO2, IEA Greenhouse Gas R&D Programme, Report PH4/33, November 2004
6 Reddy, Satish, Johnson, Dennis, and Gilmartin, John, “Fluor’s Econamine FG PlusSM
Technology for CO2 Capture at Coal-Fired Power Plants,” Power Plant Air Pollutant Control “Mega” Symposium, Baltimore, MD, August 2008
7 Updated Coal Power Systems Study, Pulverized Coal Boiler, Fluor Subcontract Report for Carbon Dioxide Capture Unit, Fluor, December 2005
8 Reddy, Satish, “Econamine FG PlusSM Technology for Post-combustion CO2 Capture,” 11th Meeting of the International Post-Combustion CO2 Capture Network, May 20 – 21, 2008, Vienna, Austria
9 ElKady, A, Evulret, A, Brand, A Ursin, T, Lynghjem, A: Exhaust Gas Recirculation in LN F-Class Gas Turbines for Post-Combustion CO2 Capture, GT2008-51152, ASME Turbo Expo 2008: Power for Land, Sea, and Air, June 9-13, 2008. Berlin, Germany.
10 Corradetti, A. and Desideri, U., “Analysis if Gas-Stream Combined Cycles with natural Gas Reforming and CO2 Capture,” Journal of Engineering for Gas Turbines and Power 127 (July 2005, pages 545-552)
11 Kvamsdal, H, Thormad, A, Bolland, O., “ Natural Gas Fired Power Plants with CO2 Capture-Process Integration for High Fuel-to-Electricity Conversion Efficiency”
12 IEA Greenhouse Gas R&D Program, “CO2 Capture in Low Rank Coal Power Plants,” Technical Study, Report Number 2006/1, January 2006.
13 Hoffman, S., Bartlett, M., Finkenrath, M., Evulet, A., Ursin, T., “Performance and Cost Analysis of Advanced Gas Turbine Cycles with Pre-combustion CO2 Capture,” Journal of Engineering for Gas Turbines and Power 131 (March 2009, pages 021701-1 to 021701-7)
14 Kvamsdal, H., Jordal, K., Bolland, O., “A Quantitative Comparison of Gas Turbine Cycles with CO2 Capture.”

Carbon Capture and Sequestration Approaches for NGCC Systems, 12/20/10
116 12/20/2010
15 Lozza, G., Chiesa, P., Romano, M., Valenti, G., “CO2 Capture from Natural Gas Combined Cycles.”
16 Assessment of Hydrogen Production with CO2 Capture, Volume 1: Baseline State-of-the-Art Plants, DOE/NETL-401/082410, August 24, 2010
17 Turton, R., Bailie, R. C., Whiting, W. B., and Shaeiwitz, A. in Analysis, Synthesis, and Design of Chemical Processes, 3rd Ed., Prentice Hall: Upper Saddle River, New Jersey, 2009, 923-953.
18 “Conducting Technical and Economic Evaluations – As Applied for the Process and Utility Industries; TCM Framework: 3.2 – Asset Planning, 3.3 Investment Decision Making, AACE International Recommended Practice 16R-90, 2003
19 Tennessee Valley Authority, NETL, and EPRI. “Economic Evaluation of CO2 Storage and Sink Enhancement Options,” December 2002.
20 “Recommended Project Finance Structures for the Economic Analysis of Fossil-Based Energy Projects,” DOE/NETL-401/090808, September 2008
21 Cost and Performance Baseline for Low-rank coal Fossil Energy IGCC Power Plants with and without CO2 Capture, 2010, Final Report, DOE/NETL-2010/1399.