Carbon Benefits Project: Measurement of Carbon in Woody Biomass Mike Smalligan, Research Forester...
15
Carbon Benefits Project: Measurement of Carbon in Woody Biomass Mike Smalligan, Research Forester Global Observatory for Ecosystem Services Department of Forestry, Michigan State University
-
date post
19-Dec-2015 -
Category
Documents
-
view
216 -
download
2
Transcript of Carbon Benefits Project: Measurement of Carbon in Woody Biomass Mike Smalligan, Research Forester...

Carbon Benefits Project: Measurement of Carbon in Woody Biomass
Mike Smalligan, Research ForesterGlobal Observatory for Ecosystem Services
Department of Forestry, Michigan State University

Objectives of the CBP Measurement System
• Assist GEF sustainable land management projects in measuring landscape carbon in forest, agriculture, and other land cover– quantify tCO2e sequestered/avoided due to GEF activities
• Develop indicators to qualify carbon benefits in GEF projects– indexes to assess impacts from project activities– indexes to enable comparison between multiple projects
• Prepare for compliance or voluntary markets– CBP seeks to conform to IPCC Guidelines in most cases– CBP is not a methodology or standard for a voluntary carbon market
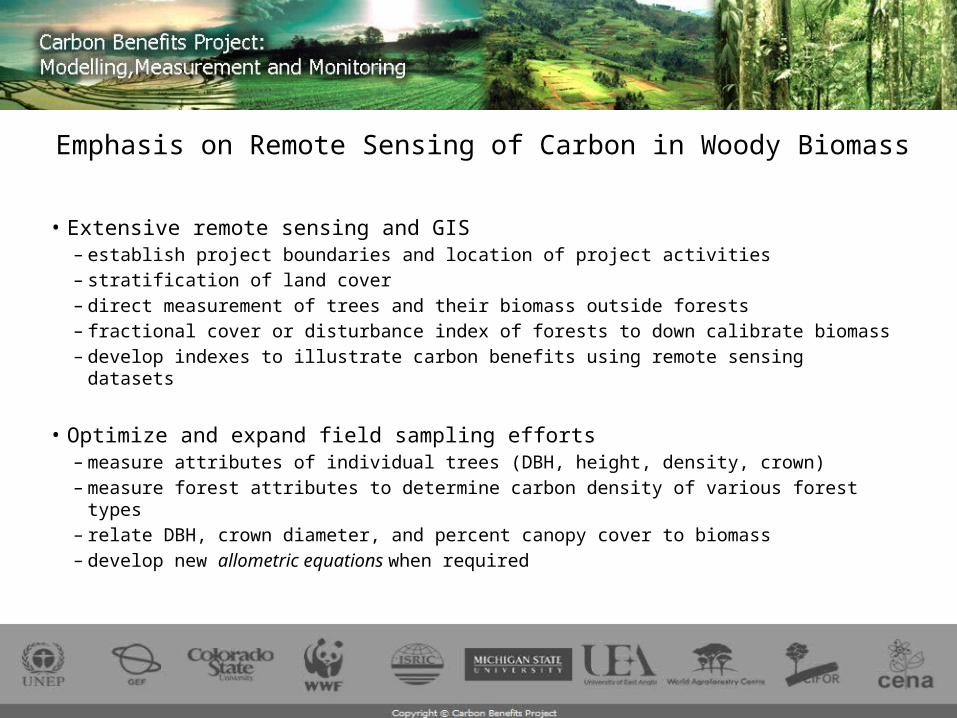
Emphasis on Remote Sensing of Carbon in Woody Biomass
• Extensive remote sensing and GIS– establish project boundaries and location of project activities– stratification of land cover– direct measurement of trees and their biomass outside forests– fractional cover or disturbance index of forests to down calibrate biomass– develop indexes to illustrate carbon benefits using remote sensing datasets
• Optimize and expand field sampling efforts – measure attributes of individual trees (DBH, height, density, crown)– measure forest attributes to determine carbon density of various forest types– relate DBH, crown diameter, and percent canopy cover to biomass– develop new allometric equations when required

Components of the Carbon in Woody Biomass Measurement System
• Documents to provide guidance for field measurements, laboratory analysis, and remote sensing
• Web based geographic information system to upload, store, analyze, monitor, report, and verify data
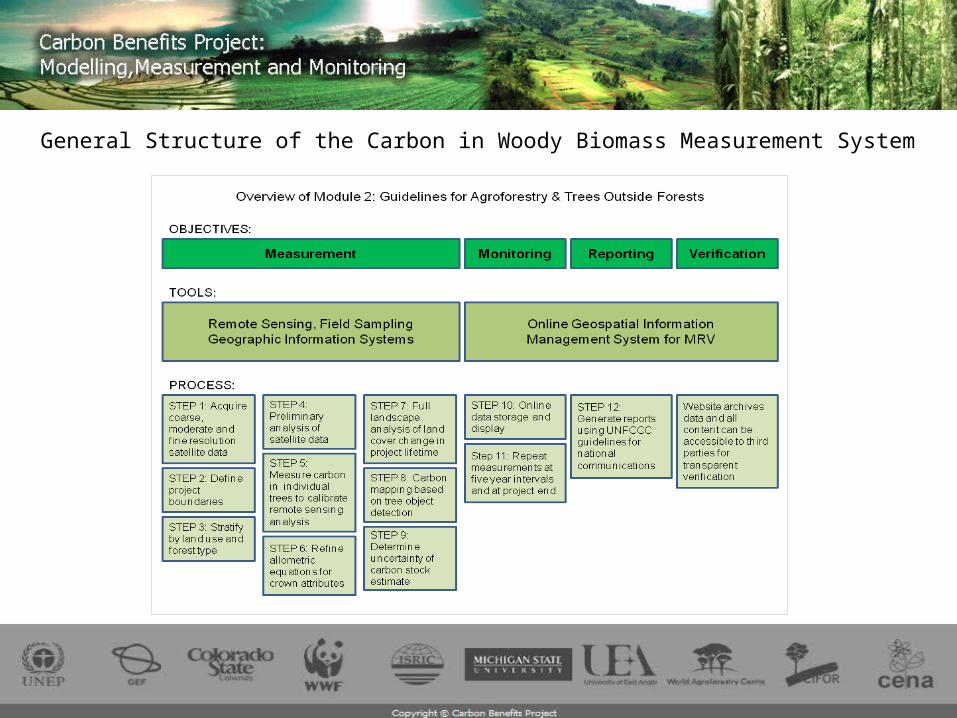
General Structure of the Carbon in Woody Biomass Measurement System
Versions of the CBP Measurement System
• Version 1.0 is available now at www.goes.msu.edu/cbp– First draft documents available for review and comments– Online Geographic Information System for MRV under development
• Updated versions in Fall 2011 and Spring 2012

Trees Outside Forest
• Identify and measure individual trees in non-forest land cover including trees on farms, trees outside forest, grasslands, settlements, etc
• Requires fine resolution (<1m) satellite imagery (Quickbird, Worldview, etc)
• Requires modified allometry to relate crown attributes (crown projection area, crown diameter) to stem DBH or directly to AGB
• Map carbon in all trees within area of interest(0.6 m PAN Quickbird image of Western Kenya)

Agricultural landscape with scattered trees and small woodlots in western Kenya ~30 km NE of Kisumu
Trees identified on Quickbird imagery (0.6m) Tree crowns measured by computer algorithmCrown allometry to assign biomass to treesDraw polygon over Area of Interest to sum the carbon in trees outside forest within AOI

Afforestation/Reforestation
GIS for project boundaries
Fine resolution (<1m) imagery for monitoring tree survival and growth
Field sampling to determine biomass growth rates
Online data management system to allow project participants to upload inventory data
System uses inventory data to perform carbon calculations to show carbon sequestration in each forest stand and total project
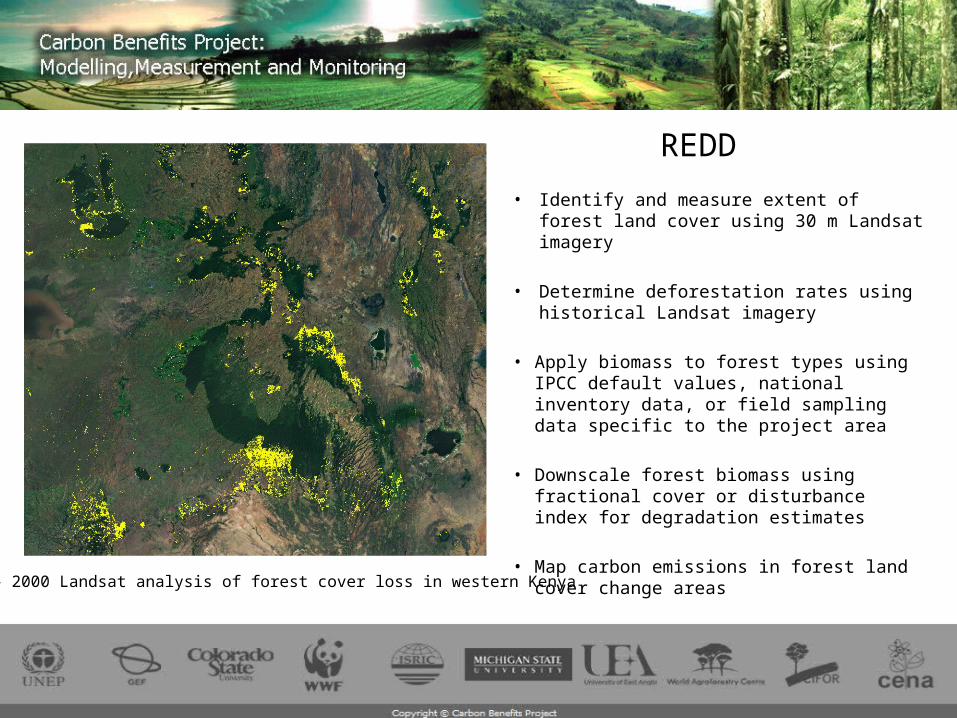
REDD
• Identify and measure extent of forest land cover using 30 m Landsat imagery
• Determine deforestation rates using historical Landsat imagery
• Apply biomass to forest types using IPCC default values, national inventory data, or field sampling data specific to the project area
• Downscale forest biomass using fractional cover or disturbance index for degradation estimates
• Map carbon emissions in forest land cover change areas
1984 – 2000 Landsat analysis of forest cover loss in western Kenya
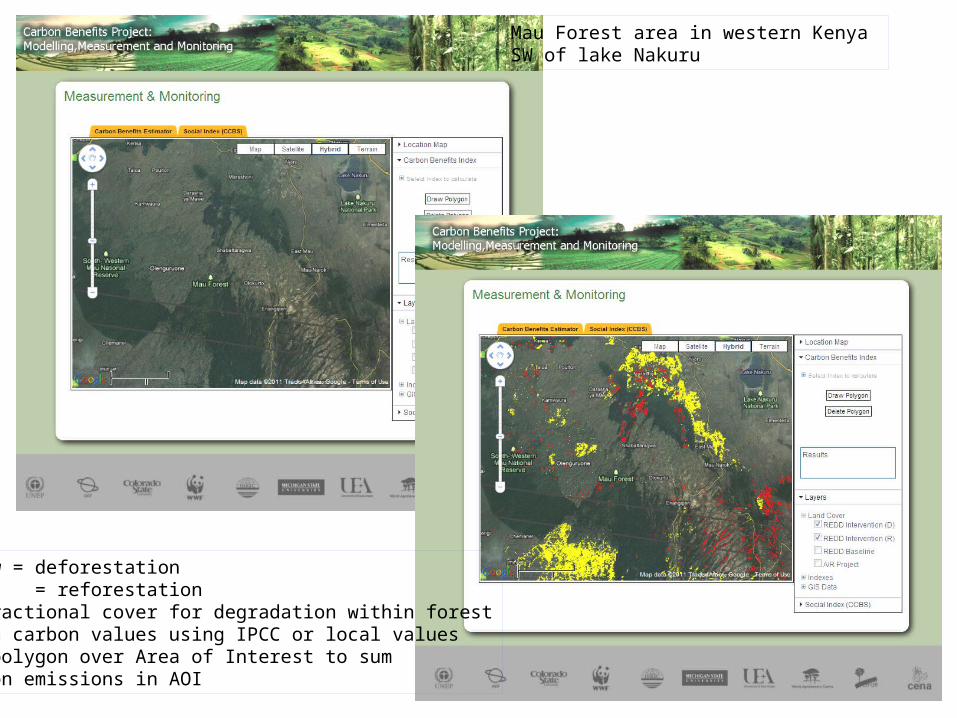
Mau Forest area in western Kenya SW of lake Nakuru
Yellow = deforestationRed = reforestationUse fractional cover for degradation within forestAssign carbon values using IPCC or local valuesDraw polygon over Area of Interest to sum carbon emissions in AOI

Develop Carbon Benefits Indicators using Remote Sensing Datasets
• Land Cover Change Index – deforestation or degradation
• Carbon Stock Index – deforestation with carbon density
• Environmental Index – deforestation with topography and watershed attributes
• Fire Risk Index– fire occurrence in or near project area using MODIS data

Mau Forest area in western Kenya SW of lake NakuruYellow = deforestationRed = regeneration
Draw polygon around Area of InterestCBP Index = 1 – [(Defort2 – Regent2) / Forestt1]Values <1 indicate C loss due to land cover change

Thank You
www.goes.msu.edu/cbp
www.unep.org/climatechange/carbon-benefits/
Please send any comments or questions about CBP Measurement of Carbon in Woody Biomass
to Mike Smalligan at [email protected]

Components of the CBP Measurement System
• Documents to provide guidance for field measurements, laboratory analysis, and remote sensing for several types of forest carbon projects
– Module 1: Ex Ante Forest Carbon Calculations– Module 2: Trees Outside Forest– Module 3: Afforestation/Reforestation– Module 4: REDD– Module 5: CBP Indexes
• Web based GIS information system
– Upload, store, analyze, monitor, report, and verify data