CARB/ICAT BPM Demonstration Program
25
el ec CARB/ICAT BPM Demonstration Program Garrett Beauregard VP Engineering May 12, 2008
Transcript of CARB/ICAT BPM Demonstration Program
e lec
CARB/ICAT BPM Demonstration Program
Garrett Beauregard VP Engineering May 12, 2008
e lec An • ®tality Company
ICAT 04-4
An Innovative Means to Minimize Electric GSE Charging
Infrastructure Costs

e lec An • ®tality Company
Electric GSE
eGSE—Electric Ground Support Equipment Reduce emitted pollutants from gasoline and diesel engines Bag tractors, belt loaders, pushback tractors
e lec An • ®tality Company
Roadblock to eGSE
Infrastructure Most airports are lacking the available power and circuits to power battery charging equipment Costly to bring new power to the air side

e lec An • ®tality Company
Power Costs--Example
5 chargers installed at Long Beach Charger cost = $125,000 Cost to install new circuits:
>$100,000!
e lec An • ®tality Company
What is the solution?
Use existing circuits Low utilization Large enough to power charger Critical: Ensure uninterrupted operationfor critical systems
Jet bridge is a good candidate High ampacity Low utilization
e lec An • ®tality Company
Bridge Power Manager (BPM)
Installed on existing jet bridge circuit Provides branch circuit to charger Monitors total current throughput Controls charger to keep total below design limit (circuit breaker)

TO SUPERCHARGER_--_____ __
TO BRIDGE CONTROLPANEL ----------
e lec An • ®t ality Company
EXJSTING POWER SUPPLY
I I
RELOCATE I I
,.-/ J
- - - - - - --- .f ..-' ______ __/"
BPM Installation

,~ ,~ ~ .. '~
I I
,.
J r-+ H I -~I I -
•
I I
~· .______I .
e lec An • ®tality Company
BPM Logic Measure actual
current in supply circuit
Current exceeds set point?
Yes
Decrease Power by ½
(max 2 steps)
NO
NO Is charger in power-limit
mode? Yes
Increase Power by ½
(max 2 steps)
e lec An • ®tality Company
BPM Operation
BPM has NO control over jet bridge— always has power BPM can ONLY control charger Charger won’t operate without communication from BPM Circuit breaker is last line of defense No operator interaction required

e lec An • ®tality Company
ICAT 04-4: Project Plan
Demonstrate BPM at OAK, Gate 32 Bridge traction power and fast battery charger Use existing 60A circuit—Bridge TransportMotor
Operate eGSE Use BPM/Charger system SWA to provide eGSE 6-month field demonstration
Evaluate efficacy Did power sharing affect ability to charge andmaintain operations?

e lec An • ®tality Company
Project Plan
Bridge Traction Supply Bridge Traction Breaker; Distribution Box
e lec An • ®tality Company
Project Timeline
BPM and Charger installed Early September, 2007 Gate 32 Port of Oakland provided much-needed support to streamline equipment installation
System Operating

e lec An • ®tality Company
BPM Installed
e lec An • ®tality Company
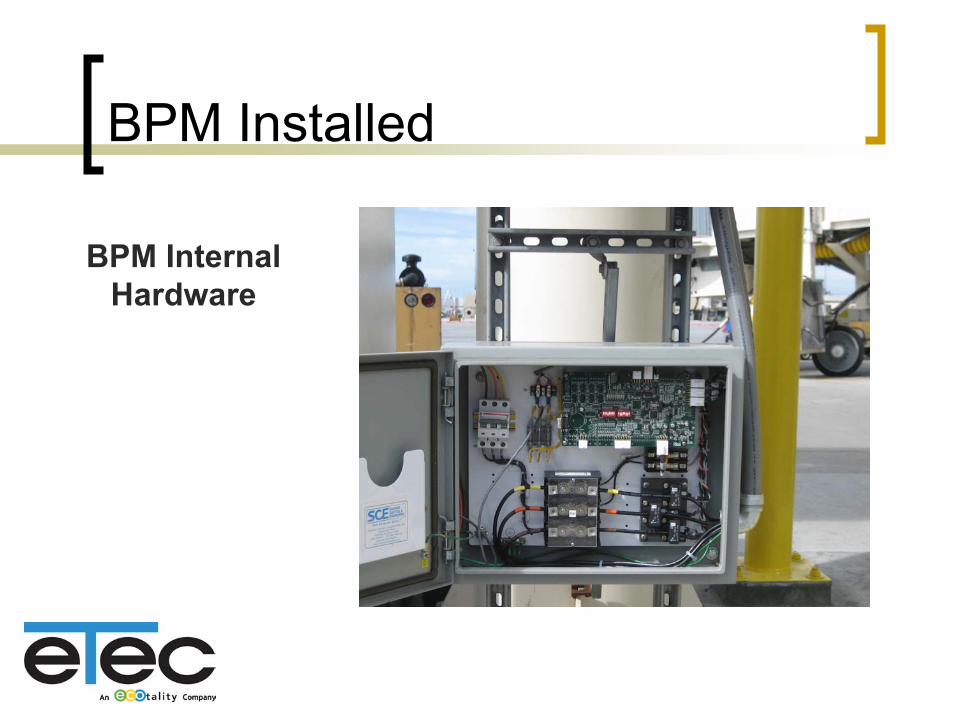
BPM Installed
BPM Internal Hardware
e lec An • ®tality Company
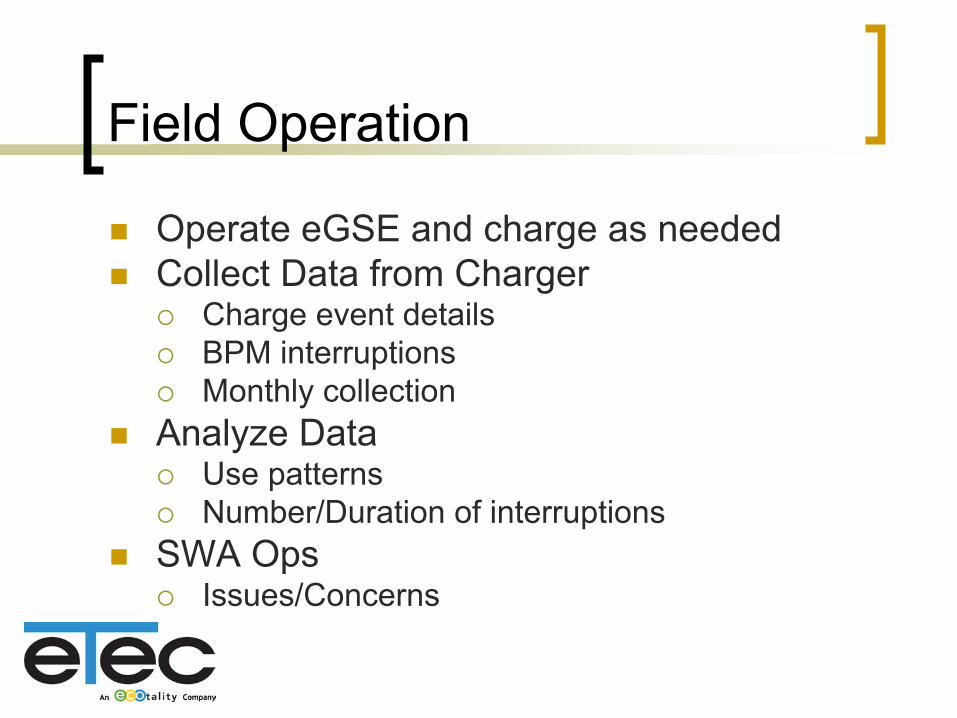
Field Operation
Operate eGSE and charge as needed Collect Data from Charger
Charge event details BPM interruptions Monthly collection
Analyze Data Use patterns Number/Duration of interruptions
SWA Ops Issues/Concerns
e lec An • ®tality Company
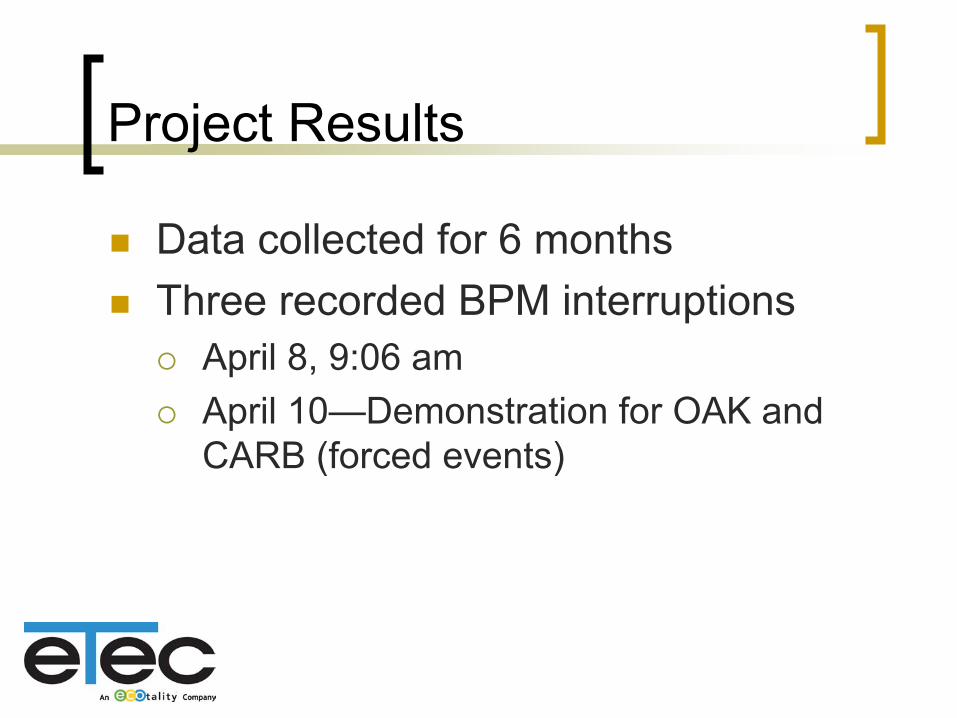
Project Results
Data collected for 6 months Three recorded BPM interruptions
April 8, 9:06 am April 10—Demonstration for OAK and CARB (forced events)

-
- -- -,,., /
~ / ,,
I
" ,. 1--
- --= I ~ ~ n n
e lec An • ®tality Company
0:00
0:00
0:00 :00 :00
:00
0 00 :00 :00
:00 0 :00 :00 00
0:00 00 :00 00
00 00 :00 :00 0 :0 :0 :00:: : : : :0 0 0 0 0 0 0 0 0 0 0 0 0 0 0 0 0 30 0
10:3
11:3 :3 3:3 14:3
15:3
16:3 :30:3 1:3 2:3 :3 4:3 5:3 6:3 7:3 3 :3 8:3 19:3
20:3
21:3 :38: 22:
123 9 17 231 1
Project Results
Histogram--Charge Event Start Time
0.00%
10.00%
20.00%
30.00%
40.00%
50.00%
60.00%
70.00%
80.00%
90.00%
100.00%
Frequency Cumulative %
50Charge Events 45Start Time 40
--897 events 35
30--SWA able to 25charge through-20out the day 15
10
5
0
Freq
uenc
y
Bin

e lec An • ®tality Company
0
0:00
0:00
0:00
0:000:00
:00
0:00
:00
:00
0:00
0:00
:00
00 00 00 00 00
00
00
00 00 00 00 00
00
00 00 00 00
:00
:00 0 :00 0 :00 0 :00 0 00 e :0 0 0 0 0 r
Mo: : : :: : : : : : :: : : : : : : : : : :
:00 0:30
4:00
4:30
8:00
2:30 0 :00 4:30
5:00
5:30
6:00
6:30 :00 0
8:00
8:30
9:00
9:30 :00 0 0 :00 0 :00 0 :00 03 0 3 3 03 3 0:0 3 0 3 7:3 3 3 0: : : : : : : : :: : : :2 3 3 6 7 03 3 4 7 7 11 11 12 15 15 16 18 19 191 1 1 1 1 1 1 1 1 1 1 2
Project Results
Histogram-Charge Duration Field Test Period
0
50
100
150
200
250
300
350
0.00%
10.00%
20.00%
30.00%
40.00%
50.00%
60.00%
70.00%
80.00%
90.00%
100.00%
Frequency
Cumulative %
Charge event duration across field test period
Freq
uenc
y
0:30
1:00
1:30
2:00
Bin

e lec An • ®tality Company
"'2!9 ~:::1 ■ I,@
BPM Interruption--Demo
Charger display during BPM interruption
Typical charger display during charge event
e lec An • ®tality Company
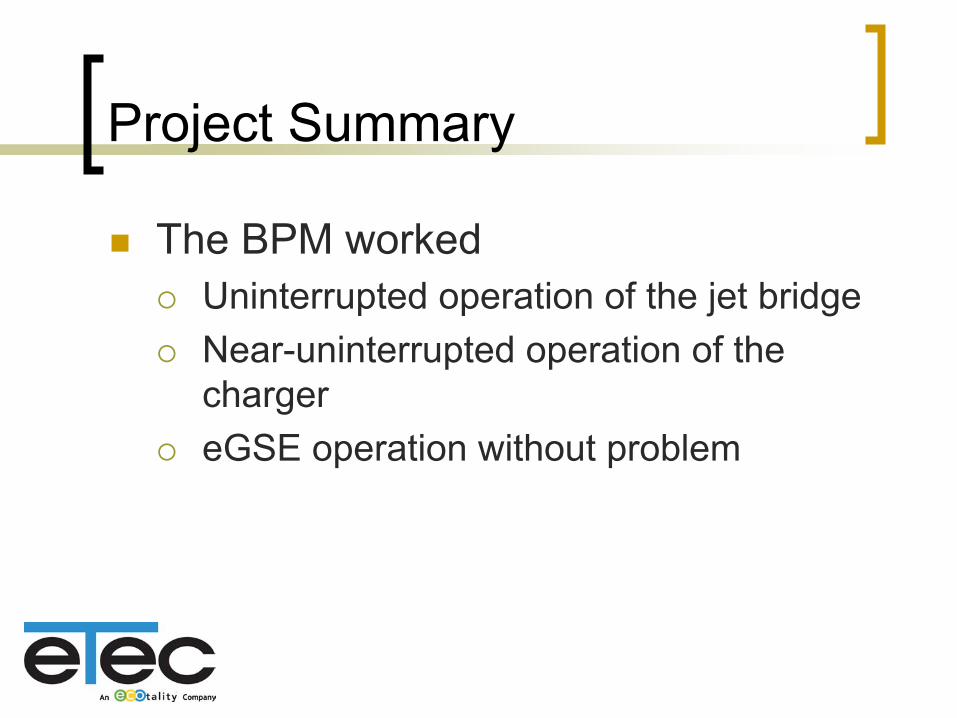
Project Summary
The BPM worked Uninterrupted operation of the jet bridge Near-uninterrupted operation of the charger eGSE operation without problem
e lec An • ®tality Company
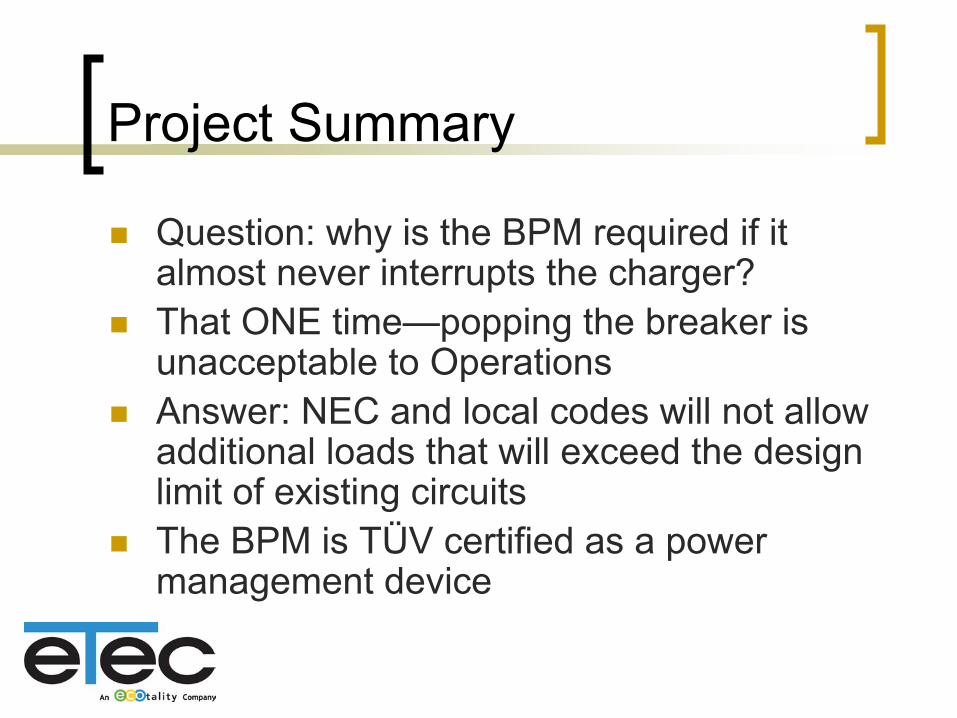
Project Summary
Question: why is the BPM required if italmost never interrupts the charger? That ONE time—popping the breaker isunacceptable to Operations Answer: NEC and local codes will not allow additional loads that will exceed the designlimit of existing circuits The BPM is TÜV certified as a powermanagement device

e lec An • ®tality Company
Project Summary
SWA is expanding eGSE at OAK 10+ chargers being installed 6 BPM units recently installed
(OAK installed a few dedicated charger circuits during 2007 terminal renovation)

e lec An • ®tality Company
Acknowledgements
Acknowledgements ETEC wishes to acknowledge the following individuals and organizations for their support of and participation in this project:
California Air Resources Board Steve Church Port of Oakland Britt Johnson Southwest Airlines Larry Laney
Donald Bribes John Salter

e lec An • ®tality Company
Acknowledgements
Conducted under a grant by the California Air Resources Board of the California
Environmental Protection Agency
The statements and conclusions in this report are those of the grantee and not necessarily those of the California Air
Resources Board. The mention of commercial products, their source, or their use in connection with material reported herein
is not to be construed as actual or implied endorsement of such products.