Carabao Group Public Company...
28
0 Strictly Private & Confidential Carabao Group Public Company Limited Opportunity Day FY17 Mar 2018
Transcript of Carabao Group Public Company...

00
Strictly Private & Confidential
Carabao Group Public Company LimitedOpportunity Day FY17
Mar 2018

11
DisclaimerThe provision herein does not constitute legal advice or investment opinions of any kind, neither is it intended as anoffer, solicitation for Carabao Group PCL. (“CBG” or “The Group”). The information presented within this material isintended to indicate the Group’s operational and financial position at a given period of time and to be used,downloaded, and distributed for analyst briefings, and general meetings with CBG, and to be used for educationalmaterial in order to understand CBG’s operation only. The Group makes no representation that all information iscomplete and accurate for the purpose of producing a projection of CBG’s operations, performance, or financial positionand may be susceptible to uncertainty and important changes based on political, economic, strategic, and other suchuncontrollable factors. Forward looking statements in this presentation are based on the management’s assumption inlight of information currently available and obtainable, as well as the aforementioned/unmentioned risks anduncertainties. CBG’s actual results may vary materially from those expressed or implied in its forward-lookingstatements, and no assurance is made as to whether such future events will occur. The Group accepts no liabilitywhatsoever for any loss arising directly or indirectly from the use or endorsement of any information contained hereinby any users and/or third parties.

22
2017 Business Highlights &2018 Looking Forward

33
2017 Performance Analysis: With VS Without ICUKICUK and Global Football Sponsorship: a strategic investment to build our footprint in global stage
Ex-ICUK & football sponsorship vsIncl. ICUK (Proportionate to 51% CBG’s stake holdings) & CBG’s portion of sponsorship

44
Non-ICUK profitability –domestic business (1/3)Portfolio expanded and new product groups took turn serving as the key driver to domestic sales growth in 2017• New product groups i.e. other branded products and 3rd-party products led the way to an 18.6%
increase yoy, accounting for 22.3% of domestic sales
• Wider range of 3rd-party products alone pushed sales up THB 310mn yoy, thanks to the white spirit
• Channel-wise, cash van turned in a powerhouse where most of the growth and pricing upside are driven through
Non-ICUK profitability –domestic business (1/3)
2015
Domestic
Sales
Energy
Drinks
Sports
Drinks
Other
Branded
Products
3rd-party
Products
2016
Domestic
Sales
5,477
614 51 238 195
6,576
By Products as a % of FY2015 Domestic Sales
100.0% 11.2% 0.9% 4.3% 3.6% 120.1%
Branded
OWN,
93.4%
Branded
OEM,
3.6%
3rd-party
Products,
3.0%
2016
Domestic
Sales
Energy
Drinks
Sports
Drinks
Other
Branded
Products
3rd-party
Products
2017
Domestic
Sales
6,576
41
(99)
699 606
7,822
By Product as a % of FY2016 Domestic Sales
100.0% 0.6% -1.5% 10.6% 9.2% 119.0%
Branded
OWN,
77.8%
Branded
OEM,
12.0%
3rd-party
Products,
10.3%
Note: Pie charts represent annual sales derived from individual product groups as a % of domestic sales in respective finanical reporting period

55
Non-ICUK profitability –domestic business (2/3)Strategic diversification and growth potential are the two compelling factors weighed positively against possible drop in near-term gross profits margin• Fast growing products namely coffee and white spirit came to shoulder our own energy drinks that
had been faced with rising production costs over the year
• 3rd-party products were blended with differing margin and their return are considered accretive
37.0% 31.3%38.8% 39% 28% 16% 16% 37% 28% 13% 12%
2015
Domestic
GP
Energy
Drinks
Sports
Drinks
Other
Branded
Products
3rd-party
Products
2016
Domestic
GP
2,123
221 18 38 31
2,430
By Products as a % of FY2015 Domestic Gross Profits
100.0% 10.4% 0.8% 1.8% 1.4% 114.5%
2016
Domestic
GP
Energy
Drinks
Sports
Drinks
Other
Branded
Products
3rd-party
Products
2017
Domestic
GP
2,430
(97) (28)
79 63
2,447
By Product as a % of FY2016 Domestic Gross Profits
100.0% -4.0% -1.2% 3.3% 2.6% 100.7%
Energy
Drinks
95.5%
Sports
Drinks 1.7%
Branded
OEM 1.5%
3rd-party
Products 1.3%
Energy
Drinks
90.9%
Sports
Drinks 0.6%
Branded
OEM 4.8%
3rd-party
Products 3.8%
Note: Pie charts represent annual gross profits from individual product groups as a % of total gross profits in respective finanical reporting period

66
Non-ICUK profitability –domestic business (3/3)Energy drinks were put under margin pressure due to rising costs of amber glass container and sugar content despite our modest gain from the new excise tax regime
• New excise tax regime booked us with cost saving of 0.11 THB for every bottle sold domestically at least until 2 years from now
• Our cluster of vertically integrated manufacturing units in Bangpakongintended to reduce energy and operating costs going forwards
• Sugar price set free in line with global market mechanism has tendency to benefit us
• Amber glass bottle became more costly due in large part to increased price of cullet and hit gross profits margin by 1-2%
• We expect depreciations to total +500 THBmn in 2018, up from 263 THBmn in 2017
+
-
+
-
+

77
Export Business ProfitabilityExport sales made a further jump on the back of both existing and new markets• CLMV soared a further 29.4% growth, led by Cambodia that broke record high during the last quarter
with volume sold up from 28 to 40 million cans sold in Dec
• China market shining out with a total of 1,019 THBmn in export sales this year is expected to play a vital role tin and by all means
2016 Export Sales CLMV China Other Existing
Markets
Export by CBD Export by ICUK 2017 Export Sales
3,356
747
1,019
(286)
187
5,024
By country as a % of FY2016 Export Sales
100.0% 22.3% 30.4% -8.5% 5.6% 149.7%
1,481
44.1%
CBD
96.0%ICUK
4.0%
CLMV
65.6%
China
20.3%
Afghanistan
& Yemen
9.6%
UK and Outside
Asia 4.0%Others,
0.5%
Note: Pie charts represent annual sales derived from key export markets as a % of export sales in respective finanical reporting period

88
2017 SG&A Analysis - Conso
Marketing (THBmn)Sponsorship +413 (Non-ICUK THB 30mn, ICUK THB 393mn)
Above-the-line Mktg +40 (due to initial launch of branded coffee products = 68 THBmn)
Listing Fee (ICUK) +54
Other marketing expenses (ICUK) +156
Selling (THBmn)Cash Van Expenses +c.100
Admin (THBmn)Services & Fees Expenses +54 (due to Consulting Fees 15 THBmn)
Moving & re-installation production lines 40 THBmn

99
China Looking-forward: 2018 Market Stimulus PlanPOS and Marketing Plan
Business Status:
26 Branches (Up by 2 Branches)
c. 900 Staffs
Marketing Timeline

1010
China Looking-forward: 2018 Focusing Strategy8-3-3-3 Strategy
1. Fuzhou
3. Putian
2. Nanping
Fujian

1111
2017 UK Development
Current Customers
Increasing visibilities prompt us to move on to the next step
Q1 2017 Q2 2017
Q3 2017 Q4 2017
2016
More facings in modern trade channels

1212
UK Looking-forward: 2018 Investment Phase to create fansPotential Customers
2018
- Listed in Jan’18
- To be on-shelf in Apr’18
- In negotiation
on shelf (F)
2Q2018
Product Differentiations
Continue our distinguish position of successful flavours initiation
Mandarin Orange
Engaging Marketing Campaign:
To match digital-lifestyle consumers with reasonable expenses
The Bonkers Drink for Bonkers Lives
- To be listed in Jul’18
NEW

1313
UK Looking-forward: Driving Stronger Sales with Push & PullPUSH
Retail Wholesales

1414
UK Looking-forward: Driving Stronger Sales with Push & PullPULL

1515
Global Marketing Platform
Looking-forward: 2018 Continue to utilize our global asset investments
Potential Export Countries
Windows of opportunity are widening thanks to Carabao Cup
Status: Done
Australia
KSA (Arabian Region)
Received Interest
Philippines
From CBD
Status: Early Negotiation
Turkey
Nigeria
India
Honduras
Nepal
Status: Done
Azerbyjan
Ghana
France
Peru
Received Interest
Macedonia
From ICUK
Status: Early Negotiation
Germany
Belgium/Netherland
Balkans Region
(Slovenia, Croatia, Bosnia)
Denmark
Romania
Switzerland/ Austria
Senegal
1616
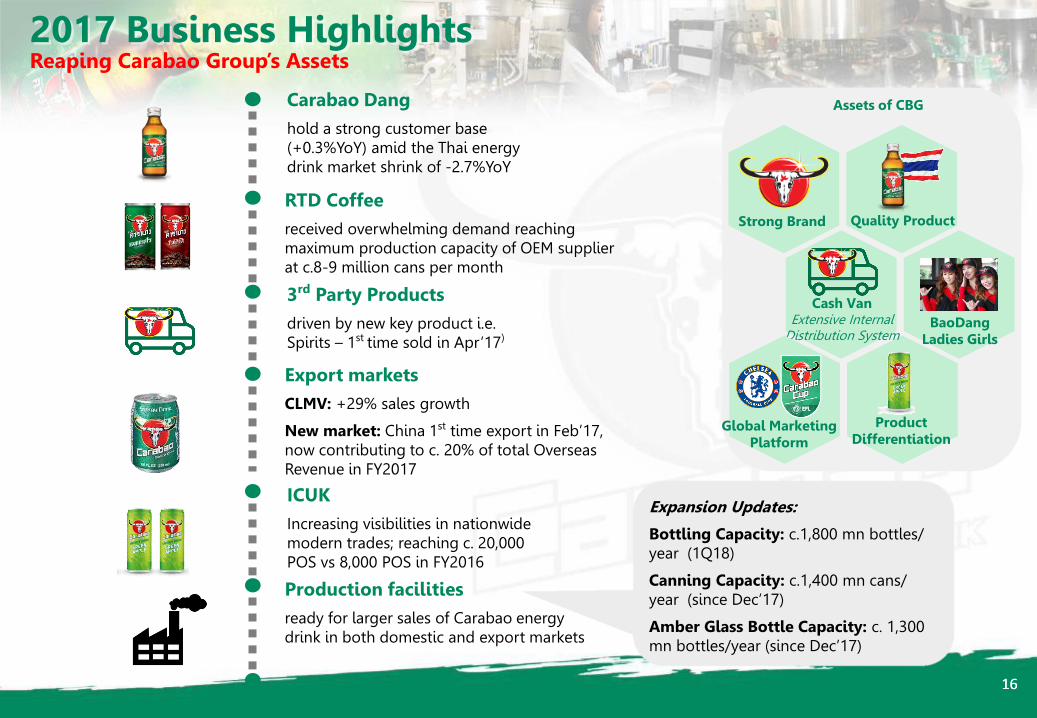
Production facilitiesready for larger sales of Carabao energy drink in both domestic and export markets
2017 Business Highlights
Carabao Dang hold a strong customer base (+0.3%YoY) amid the Thai energy drink market shrink of -2.7%YoY
RTD Coffee received overwhelming demand reaching maximum production capacity of OEM supplier at c.8-9 million cans per month
3rd Party Productsdriven by new key product i.e. Spirits – 1st time sold in Apr’17)
Export marketsCLMV: +29% sales growth
New market: China 1st time export in Feb’17, now contributing to c. 20% of total Overseas Revenue in FY2017
ICUK Increasing visibilities in nationwide modern trades; reaching c. 20,000 POS vs 8,000 POS in FY2016
Expansion Updates:
Bottling Capacity: c.1,800 mn bottles/ year (1Q18)
Canning Capacity: c.1,400 mn cans/ year (since Dec’17)
Amber Glass Bottle Capacity: c. 1,300 mn bottles/year (since Dec’17)
Reaping Carabao Group’s Assets
Assets of CBG
Strong Brand Quality Product
Cash Van Extensive Internal
Distribution SystemBaoDang
Ladies Girls
Product Differentiation
Global Marketing Platform

1717
2018 Growth Driver
(1) According to Spirits revenue of a key player in Thailand market
Production facilitiesACM: Aluminum cans production facilities to be ready for test run by 3Q2018
Carabao DangIntegrating marketing incentives with distribution coverage
RTD Coffee new capacity of OEM supplier at c.13 million cans per month; increase market share
3rd Party Productsdriven by potential growth of key product i.e. Spirits of which the market size is THB c.80k-100k million per year(1)
Export marketsCLMV: effective consumer marketing activities implemented by the local importer and strong brand recognition
China: Increasing brand awareness to drive volume sold
New markets: Australia
ICUKNew flavours: Mandarin Orange
Increasing POS & brand recognition
New export opportunities into European, Africa and Asia regions

1818
Appendix:Detail Financial

1919
Statement of comprehensive income
Remark: G&A excludes Other Expenses
Unit: THB million 2015 2016 2016 2017 2017 Change 4Q2016 4Q2017 4Q2017 Change%sales %sales YoY %sales YoY
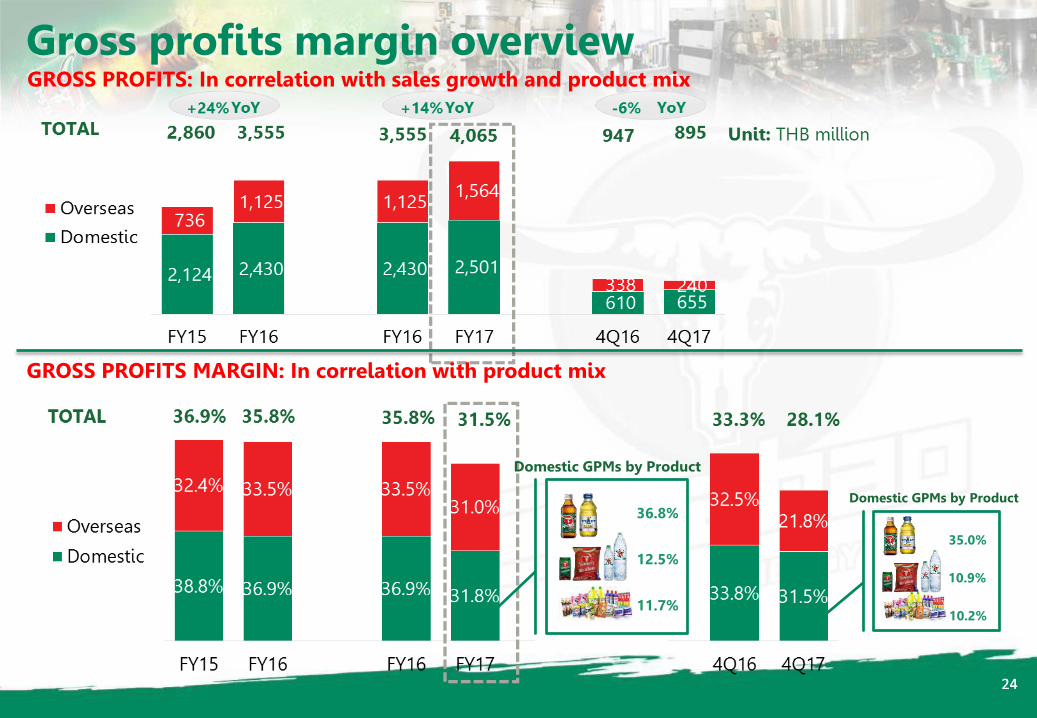
Revenue from sales 7,753 9,943 100.0% 12,904 100.0% 29.8% 2,837 3,181 100.0% 12.1%Costs of goods sold 4,893 6,388 64.2% 8,840 68.5% 38.4% 1,889 2,286 71.9% 21.0%Gross profits 2,860 3,555 35.8% 4,065 31.5% 14.3% 947 895 28.1% -5.6%Selling expenses 1,120 1,462 14.7% 2,379 18.4% 62.7% 500 571 18.0% 14.3%G&A expenses 395 553 5.6% 741 5.7% 33.9% 213 217 6.8% 2.0%Operating profits 1,380 1,540 15.5% 945 7.3% -38.6% 235 107 3.3% -54.6%Other incomes 121 147 1.5% 164 1.3% 11.4% 27 34 1.1% 25.6%EBIT 1,466 1,687 17.0% 1,109 8.6% -34.3% 262 140 4.4% -46.4%EBITDA 1,702 1,914 19.2% 1,372 10.6% -28.3% 319 219 6.9% -31.2%Interest expenses 2 4 0.0% 48 0.4% 1196.7% 1 19 0.6% 1277.9%EBT 1,465 1,683 16.9% 1,061 8.2% -36.9% 260 121 3.8% -53.4%Income tax expenses 209 278 2.8% 261 2.0% -6.3% 64 42 1.3% -33.5%Net profits for the period 1,256 1,405 14.1% 801 6.2% -43.0% 197 79 2.5% -59.9%
1,256 1,490 15.0% 1,246 9.7% -16.4% 282 209 6.6% -25.7%Equity Holder of the Company

2020
ASSETS Dec-16 Dec-17 Change LIABILITIES Dec-16 Dec-17 ChangeCurrent Assets Current LiabilitiesCash, Cash Equivalents 745 147 (598) Bank overdrafts&short-term loans from financial institutions 750 845 95 Current Investments 604 7 (597) Trade and other payable 1,365 1,897 532 Trade and other receivable 562 960 398 Current portion of long-term loans from financial institution - 300 300 Inventories 434 656 223 Other current liabilities 210 164 (46) Other current assets 110 389 279 Total Current Liabilities 2,325 3,207 881 Total Current Assets 2,455 2,159 (296) Long-term loan from financial institutions 250 2,190 1,940
Other non-current liabilities 104 118 14 Total non-current liabilities 354 2,308 1,954 Total Liabilities 2,679 5,515 2,836
Non-Current Assets SHAREHOLDERS' EQUITYLong-term Investment - - Issued and fully paid up share capital 1,000 1,000 - Investment Properties 104 103 (1) Premium on shares 3,963 3,963 - Property, plant & equipment 6,627 9,609 2,982 Retained earnings 1,478 1,775 297 Intangible Assets 15 67 52 Other components of shareholders' equity 433 376 - Deferred Tax Assets 34 31 (2) Equity attributable to owners of the Company 6,873 7,114 241 Other non-current assets 8 15 7 Non-controlling interests of the subsidiary 226 (108) (334) Goodwill 536 535 (1) Total Non-Current Assets 7,324 10,361 3,037 Total shareholders' equity 7,099 7,005 (94) Total Assets 9,778 12,520 2,741 Total liabilities and Equity 9,778 12,520 2,742
STATEMENT OF FINANCIAL POSITION Unit: THB million
Statement of financial position

2121
BREAKDOWN OF DOMESTIC AND EXPORT SALES
Total revenue from salesFY17 Sales growth delivered our target

2222
Breakdown of our domestic sales
DOMESTIC SALES CHANNEL CONTRIBUTION FROM CASH VAN STRATEGY
DOMESTIC: Increasing sales driven by growth of RTD coffee and 3rd party products for distribution

2323
THB mn FY15 FY16 %YoY FY16 FY17 %YoY 4Q16 3Q17 4Q17 %YoY %QoQCambodia 1,547 2,074 34% 2,074 2,489 20% 599 605 739 23% 22%Myanmar 223 279 25% 279 422 51% 99 69 126 27% 83%Vietnam 98 173 77% 173 356 106% 68 142 74 9% -48%Yemen 167 202 21% 202 225 11% 71 70 112 59% 62%Afghanistan 164 481 193% 481 257 -46% 160 62 - -100% -100%China - - - - 1,019 N/A - 407 - N/A -100%Others 77 153 99% 137 80 -42% 25 21 17 -32% -18%Sales from Thailand 2,276 3,362 48% 3,346 4,847 45% 1,022 1,375 1,068 5% -22%Sales from ICUK - - - 16 203 1179% 16 97 34 117% -65%Total 2,276 3,362 48% 3,362 5,050 50% 1,038 1,472 1,103 6% -25%
Overseas sales by key export countriesEXPORT: 4Q17 Overseas sales soften due to winter effect
2424
Gross profits margin overview
35.0%
10.9%
10.2%
Domestic GPMs by Product
GROSS PROFITS: In correlation with sales growth and product mix
GROSS PROFITS MARGIN: In correlation with product mix
Domestic GPMs by Product
36.8%
12.5%
11.7%
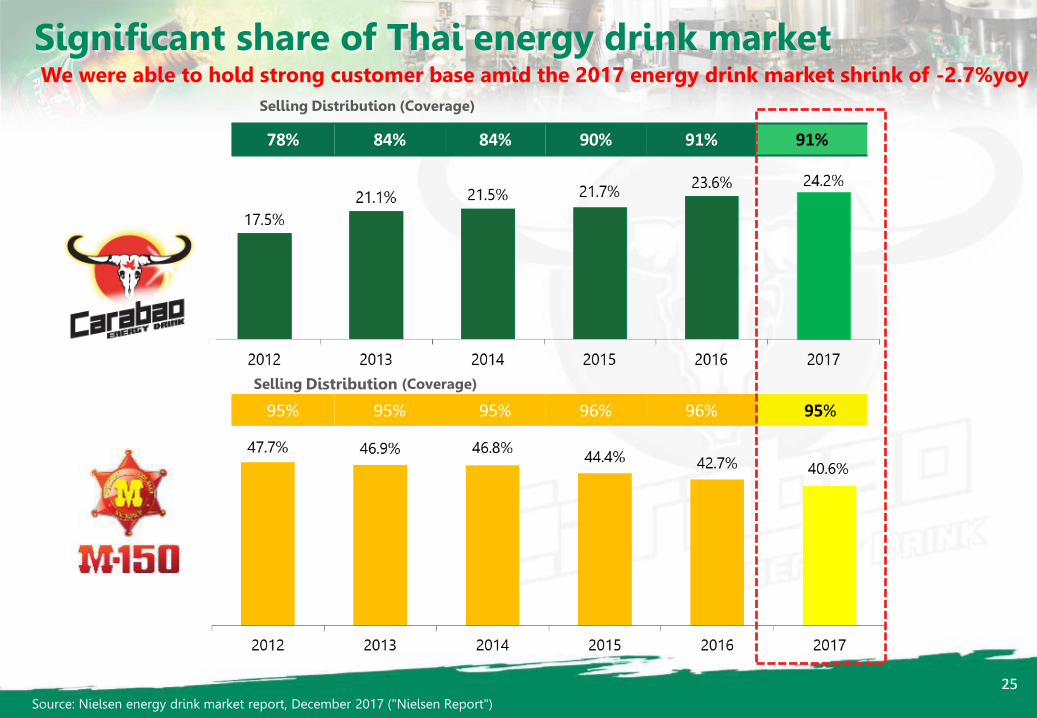
2525Source: Nielsen energy drink market report, December 2017 ("Nielsen Report")
78% 84% 84% 90% 91% 91%
Selling Distribution (Coverage)
Selling Distribution (Coverage)
Significant share of Thai energy drink market
95% 95% 95% 96% 96% 95%
We were able to hold strong customer base amid the 2017 energy drink market shrink of -2.7%yoy

2626
Thai energy drink and its geographical segmentations
Source: Nielsen energy drink market report, December2017 ("Nielsen Report")
Thai energy drink marketby geographical segmentation
Central Region
Northeast Region North Region
We successfully continued to stay ahead on the Central Region while taking steps closer to bridging the gap of share for the Northeast Region
Greater BKK,
11.8%
Central, 27.9%North,
19.7%
Northeast, 31.2%
South, 9.4%

2727
WORLD CLASS WORLD CLASS
Carabao Group Public Co., Ltd.
Tel: +66 2636 6111 Ext.882
Email : [email protected]
www.carabaogroup.com/en PRODUCT BRAND
Investor Relations