Car-to-car accidents at intersections in Europe and...
27
Wisch 1 Car-to-car accidents at intersections in Europe and identification of Use Cases for the test and assessment of respective active vehicle safety systems Marcus Wisch Adrian Hellmann Markus Lerner Federal Highway Research Institute (BASt), Germany Thomas Hierlinger Volker Labenski Audi AG, Germany Michael Wagner Harald Feifel Continental Teves AG & Co. oHG, Germany Oana Robescu Denso, Sweden Pauline Renoux Renault, France Xavier Groult Valeo, France Paper Number 19-0176 ABSTRACT The Intersection 2020 project was initiated to develop a test procedure for Automatic Emergency Braking systems in intersection car-to-car scenarios to be transferred to Euro NCAP. The project aims to address current road traffic accidents on European roads and therefore sets a priority of the identification of the most important car-to-car accidents and Use Cases. Taking into account technological and practical limitations, Test Scenarios are derived from the Use Cases in a later stage of the project. This paper presents parts of a larger study and provides an overview of common car-to-vehicle(at least four wheels) collision types at junctions in Europe and specifies seven Accident Scenarios from which the three scenarios “Straight Crossing Paths (SCP)”, “Left Turn Across Path – Opposite Direction Conflict (LTAP/OD)” and “Left Turn Across Path – Lateral Direction (LTAP/LD)” are most important due to their high relevance regarding severe car-to-car accidents. Technical details about crash parameters such as collision and initial speeds are delivered. The analysis work performed is input for the definition and selection of the Use Cases as well as for the project’s benefit estimation. The numbers of accidents and fatalities in accidents at intersections involving a passenger car were shown per intersection type. In both statistics, it was found that accidents at crossroads and T- or staggered junctions are of highest relevance, followed by roundabouts. Focusing on accidents at intersections between one passenger car and another road user shows that around one-third of all accidents and related fatalities could have been assigned to car-to-PTW accidents and one-fifth of all accidents and fatalities to car-to-car accidents. Regarding car-to-car accidents with at least serious injury outcome 38% out of 34,489 car-to-car accidents happened at intersections. These figures correspond to 18% of the fatalities (4,236 fatalities in total). Considering all intersection types, around half of all related accidents happened in urban environments whereas this number decreased to one-third of all fatalities. Further, the proportion of road fatalities per country occurring at intersections varies widely across the EU. Also, there are proportionately more fatalities in daylight or twilight conditions at junctions. Use Cases are supposed to be derived from Accident Scenarios and by adding detailed information for example about the road layout, right-of-way and the vehicle trajectories prior to the collision. Instead of applying cluster algorithms to the accident data, a pragmatic approach was finally preferred to create them. Note: Use Cases serve as an intermediate step between the Accident Scenarios and the Test Scenarios which describe the actual testing conditions. Finally, 74 Use Cases were identified. This large number indicates the complexity of intersection crashes due to the combination of several parameters.
Transcript of Car-to-car accidents at intersections in Europe and...

Wisch 1
Car-to-car accidents at intersections in Europe and identification of Use Cases for the test and assessment of respective active vehicle safety systems Marcus Wisch Adrian Hellmann Markus Lerner Federal Highway Research Institute (BASt), Germany Thomas Hierlinger Volker Labenski Audi AG, Germany Michael Wagner Harald Feifel Continental Teves AG & Co. oHG, Germany Oana Robescu Denso, Sweden Pauline Renoux Renault, France Xavier Groult Valeo, France Paper Number 19-0176 ABSTRACT The Intersection 2020 project was initiated to develop a test procedure for Automatic Emergency Braking systems in intersection car-to-car scenarios to be transferred to Euro NCAP. The project aims to address current road traffic accidents on European roads and therefore sets a priority of the identification of the most important car-to-car accidents and Use Cases. Taking into account technological and practical limitations, Test Scenarios are derived from the Use Cases in a later stage of the project. This paper presents parts of a larger study and provides an overview of common car-to-vehicle(at least four wheels) collision types at junctions in Europe and specifies seven Accident Scenarios from which the three scenarios “Straight Crossing Paths (SCP)”, “Left Turn Across Path – Opposite Direction Conflict (LTAP/OD)” and “Left Turn Across Path – Lateral Direction (LTAP/LD)” are most important due to their high relevance regarding severe car-to-car accidents. Technical details about crash parameters such as collision and initial speeds are delivered. The analysis work performed is input for the definition and selection of the Use Cases as well as for the project’s benefit estimation. The numbers of accidents and fatalities in accidents at intersections involving a passenger car were shown per intersection type. In both statistics, it was found that accidents at crossroads and T- or staggered junctions are of highest relevance, followed by roundabouts. Focusing on accidents at intersections between one passenger car and another road user shows that around one-third of all accidents and related fatalities could have been assigned to car-to-PTW accidents and one-fifth of all accidents and fatalities to car-to-car accidents. Regarding car-to-car accidents with at least serious injury outcome 38% out of 34,489 car-to-car accidents happened at intersections. These figures correspond to 18% of the fatalities (4,236 fatalities in total). Considering all intersection types, around half of all related accidents happened in urban environments whereas this number decreased to one-third of all fatalities. Further, the proportion of road fatalities per country occurring at intersections varies widely across the EU. Also, there are proportionately more fatalities in daylight or twilight conditions at junctions. Use Cases are supposed to be derived from Accident Scenarios and by adding detailed information for example about the road layout, right-of-way and the vehicle trajectories prior to the collision. Instead of applying cluster algorithms to the accident data, a pragmatic approach was finally preferred to create them. Note: Use Cases serve as an intermediate step between the Accident Scenarios and the Test Scenarios which describe the actual testing conditions. Finally, 74 Use Cases were identified. This large number indicates the complexity of intersection crashes due to the combination of several parameters.
Wisch 2
INTRODUCTION General View on Road Traffic Accidents at Intersections Junctions are intended to operate where vehicles often must share space with other vehicles and pedestrians. Negotiating a junction requires many simultaneous or closely spaced decisions, such as selection of the proper lane; maneuvering to get into the proper position; need to decelerate, stop, or accelerate; and need to select a safe gap [1]. Three- or four-arm non-signalized at grade junctions: These junctions may provide satisfactory road safety level when operating in low traffic volumes and speeds. Traffic islands and pavement marking, delimiting traffic directions and creating special lanes for left turning movements have a positive road safety effect [2]. When traffic volumes increase, it is necessary to establish traffic signals or consider modifications of the junction layout. In urban areas, changing a three- or four-arm level junction into a roundabout may lead to around 30% accidents reduction [3]. Signalized level junctions are the most common junction type in urban areas. Fatal accidents at signalized junctions are predominantly multivehicle [4]. The majority of accidents on signalized junctions concern left-turn vehicle movement or pedestrian's movement. Moreover, a higher accident involvement, in relation to their traffic volumes, may be observed for motorized two-wheelers and bicycles [5]. Roundabouts Roundabouts have higher capacity than three- or four-arm non-signalized junctions; Roundabouts appear to have considerable safety advantages over other types of at-grade junction and are now being widely used in many countries [6]. However, in some countries they appear to be related to higher accident involvement of motorized two-wheelers and bicycles [5]. Roundabouts reduce the number of injury accidents depending on the number of arms and the previous form of traffic control. There appears to be a larger effect in junctions that used to have yield control than in junctions that used to be traffic controlled. Fatal accidents and serious injury accidents are reduced more than slight injury accidents [7]. Montella et al. reported in [8] that “The use of roundabouts improves intersection safety by eliminating or altering conflict types, reducing crash severity, and causing drivers to reduce speeds. However, roundabout performances can degrade if precautions are not taken during either the design or the operation phase.” Accident Data The European project TRACE (funded by the European Commission) also investigated accidents at intersections in the EU-27 [9]. The authors reported that:
- Approx. 43% of all road injuries occur at intersections in EU-27; - Approx. 70% of intersection accidents occur inside urban area; - Approx. 80% of intersection accidents occur with at least one passenger car in urban area; - 45% to 68% of intersection accidents occur at intersections with traffic regulation.
The authors also note issues about the definitions of intersections. For example, “intersections” in the UK include the point where the roads cross plus the 20 m on either side. The European Commission arranged intersection accident data analyses using the Community Database on Accidents on the Roads in Europe (CARE) and published the results in a special issue of the series “Traffic Safety Basic Facts” [10] in 2015. It was estimated that more than 5,000 people died in road accidents at junctions in the EU in 2013. Note: European figures have to be handled with care as there is no common definition for crashes at junctions in Europe and not all countries provide related figures in the same quality. It was summarised that the proportion of fatalities occurring at junctions is higher on urban roads than on rural roads or motorways and varied widely across the EU. The proportion of fatalities occurring at junctions is highest for pedal cyclists and moped riders, and lowest for HGV, lorry and car occupants. However, proportions change when considering seriously injured casualties. Regarding the light conditions at the point of time of the accidents at intersections, proportionately more fatalities occurred in daylight or twilight compared to dark light conditions. With regard to the weather condition, the proportion of accidents with fatal outcome that occurred at junctions was highest for dry conditions (87%), followed by rainy conditions (7%) and lowest in adverse conditions such as snow. Accident Clusters and Methods for Identification Nitsche et al. analysed in [11] accident data from the United Kingdom with the aim to identify critical pre-crash scenarios at T- and four-legged junctions (“crossroads”). The method employed k-medoids to cluster historical junction crash data into distinct partitions and then applies the association rules algorithm to each cluster to specify the driving scenarios in more detail. The study resulted in thirteen crash clusters for T-junctions and six for crossroads. Association rules revealed common crash characteristics, which were the basis for the scenario descriptions. Exemplarily for all clusters, some are detailed: Cluster T-C1 is the largest cluster with a size of 212 crashes, from which all resulted in slight injury. More than 90 percent of the accidents occurred at T-junctions with a minor road joining from the left. There is no clear indication on the collision type of this cluster. The third largest cluster T-C2 groups collisions while turning,
Wisch 3
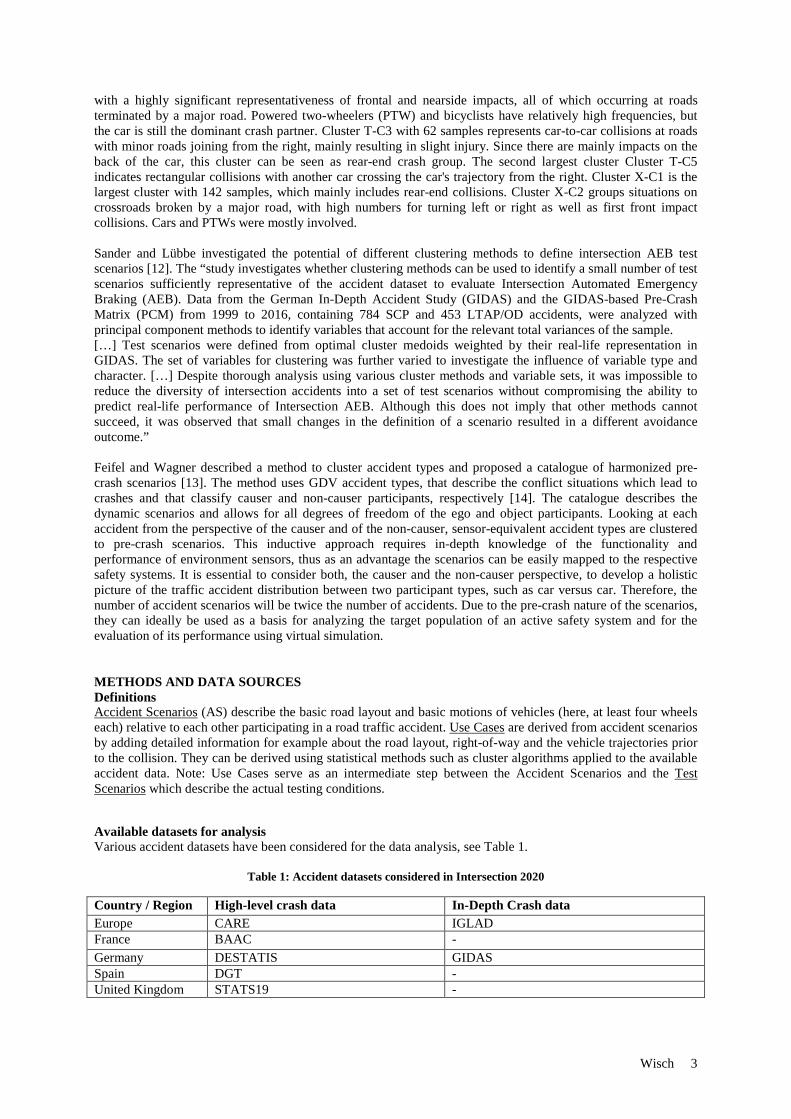
with a highly significant representativeness of frontal and nearside impacts, all of which occurring at roads terminated by a major road. Powered two-wheelers (PTW) and bicyclists have relatively high frequencies, but the car is still the dominant crash partner. Cluster T-C3 with 62 samples represents car-to-car collisions at roads with minor roads joining from the right, mainly resulting in slight injury. Since there are mainly impacts on the back of the car, this cluster can be seen as rear-end crash group. The second largest cluster Cluster T-C5 indicates rectangular collisions with another car crossing the car's trajectory from the right. Cluster X-C1 is the largest cluster with 142 samples, which mainly includes rear-end collisions. Cluster X-C2 groups situations on crossroads broken by a major road, with high numbers for turning left or right as well as first front impact collisions. Cars and PTWs were mostly involved. Sander and Lübbe investigated the potential of different clustering methods to define intersection AEB test scenarios [12]. The “study investigates whether clustering methods can be used to identify a small number of test scenarios sufficiently representative of the accident dataset to evaluate Intersection Automated Emergency Braking (AEB). Data from the German In-Depth Accident Study (GIDAS) and the GIDAS-based Pre-Crash Matrix (PCM) from 1999 to 2016, containing 784 SCP and 453 LTAP/OD accidents, were analyzed with principal component methods to identify variables that account for the relevant total variances of the sample. […] Test scenarios were defined from optimal cluster medoids weighted by their real-life representation in GIDAS. The set of variables for clustering was further varied to investigate the influence of variable type and character. […] Despite thorough analysis using various cluster methods and variable sets, it was impossible to reduce the diversity of intersection accidents into a set of test scenarios without compromising the ability to predict real-life performance of Intersection AEB. Although this does not imply that other methods cannot succeed, it was observed that small changes in the definition of a scenario resulted in a different avoidance outcome.” Feifel and Wagner described a method to cluster accident types and proposed a catalogue of harmonized pre-crash scenarios [13]. The method uses GDV accident types, that describe the conflict situations which lead to crashes and that classify causer and non-causer participants, respectively [14]. The catalogue describes the dynamic scenarios and allows for all degrees of freedom of the ego and object participants. Looking at each accident from the perspective of the causer and of the non-causer, sensor-equivalent accident types are clustered to pre-crash scenarios. This inductive approach requires in-depth knowledge of the functionality and performance of environment sensors, thus as an advantage the scenarios can be easily mapped to the respective safety systems. It is essential to consider both, the causer and the non-causer perspective, to develop a holistic picture of the traffic accident distribution between two participant types, such as car versus car. Therefore, the number of accident scenarios will be twice the number of accidents. Due to the pre-crash nature of the scenarios, they can ideally be used as a basis for analyzing the target population of an active safety system and for the evaluation of its performance using virtual simulation. METHODS AND DATA SOURCES Definitions Accident Scenarios (AS) describe the basic road layout and basic motions of vehicles (here, at least four wheels each) relative to each other participating in a road traffic accident. Use Cases are derived from accident scenarios by adding detailed information for example about the road layout, right-of-way and the vehicle trajectories prior to the collision. They can be derived using statistical methods such as cluster algorithms applied to the available accident data. Note: Use Cases serve as an intermediate step between the Accident Scenarios and the Test Scenarios which describe the actual testing conditions. Available datasets for analysis Various accident datasets have been considered for the data analysis, see Table 1.
Table 1: Accident datasets considered in Intersection 2020
Country / Region High-level crash data In-Depth Crash data Europe CARE IGLAD France BAAC - Germany DESTATIS GIDAS Spain DGT - United Kingdom STATS19 -
Wisch 4
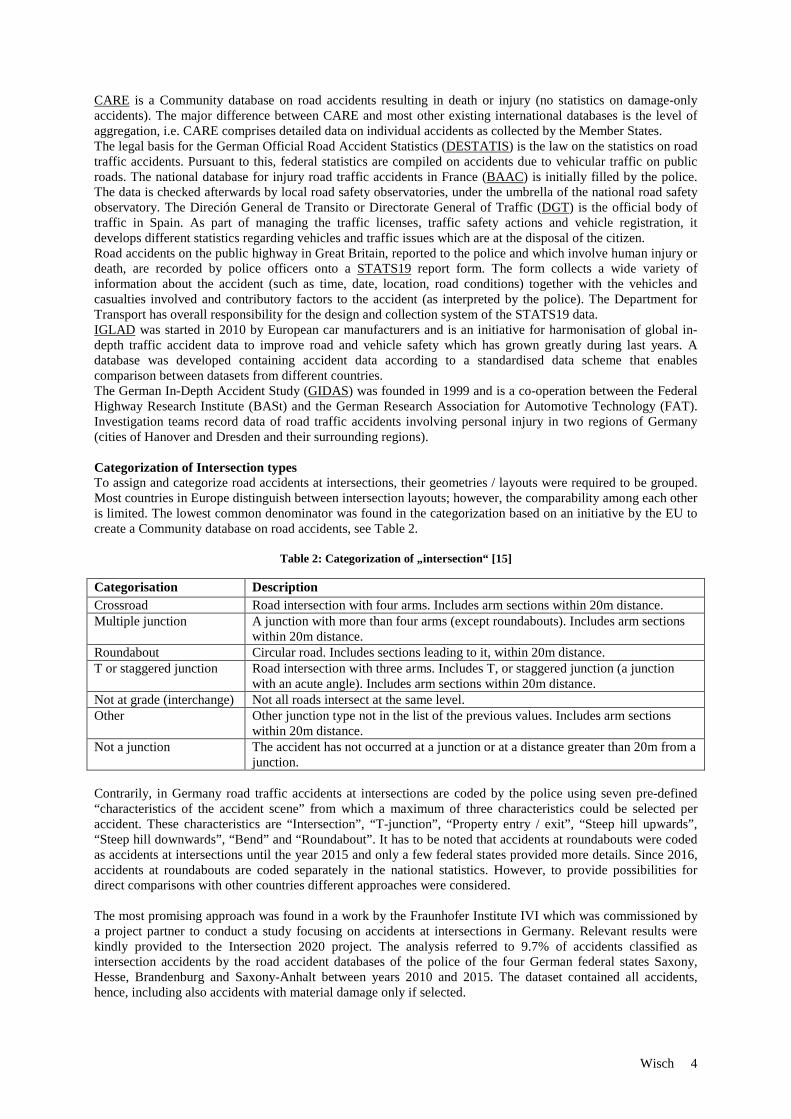
CARE is a Community database on road accidents resulting in death or injury (no statistics on damage-only accidents). The major difference between CARE and most other existing international databases is the level of aggregation, i.e. CARE comprises detailed data on individual accidents as collected by the Member States. The legal basis for the German Official Road Accident Statistics (DESTATIS) is the law on the statistics on road traffic accidents. Pursuant to this, federal statistics are compiled on accidents due to vehicular traffic on public roads. The national database for injury road traffic accidents in France (BAAC) is initially filled by the police. The data is checked afterwards by local road safety observatories, under the umbrella of the national road safety observatory. The Direción General de Transito or Directorate General of Traffic (DGT) is the official body of traffic in Spain. As part of managing the traffic licenses, traffic safety actions and vehicle registration, it develops different statistics regarding vehicles and traffic issues which are at the disposal of the citizen. Road accidents on the public highway in Great Britain, reported to the police and which involve human injury or death, are recorded by police officers onto a STATS19 report form. The form collects a wide variety of information about the accident (such as time, date, location, road conditions) together with the vehicles and casualties involved and contributory factors to the accident (as interpreted by the police). The Department for Transport has overall responsibility for the design and collection system of the STATS19 data. IGLAD was started in 2010 by European car manufacturers and is an initiative for harmonisation of global in-depth traffic accident data to improve road and vehicle safety which has grown greatly during last years. A database was developed containing accident data according to a standardised data scheme that enables comparison between datasets from different countries. The German In-Depth Accident Study (GIDAS) was founded in 1999 and is a co-operation between the Federal Highway Research Institute (BASt) and the German Research Association for Automotive Technology (FAT). Investigation teams record data of road traffic accidents involving personal injury in two regions of Germany (cities of Hanover and Dresden and their surrounding regions). Categorization of Intersection types To assign and categorize road accidents at intersections, their geometries / layouts were required to be grouped. Most countries in Europe distinguish between intersection layouts; however, the comparability among each other is limited. The lowest common denominator was found in the categorization based on an initiative by the EU to create a Community database on road accidents, see Table 2.
Table 2: Categorization of „intersection“ [15]
Categorisation Description Crossroad Road intersection with four arms. Includes arm sections within 20m distance. Multiple junction A junction with more than four arms (except roundabouts). Includes arm sections
within 20m distance. Roundabout Circular road. Includes sections leading to it, within 20m distance. T or staggered junction Road intersection with three arms. Includes T, or staggered junction (a junction
with an acute angle). Includes arm sections within 20m distance. Not at grade (interchange) Not all roads intersect at the same level. Other Other junction type not in the list of the previous values. Includes arm sections
within 20m distance. Not a junction The accident has not occurred at a junction or at a distance greater than 20m from a
junction. Contrarily, in Germany road traffic accidents at intersections are coded by the police using seven pre-defined “characteristics of the accident scene” from which a maximum of three characteristics could be selected per accident. These characteristics are “Intersection”, “T-junction”, “Property entry / exit”, “Steep hill upwards”, “Steep hill downwards”, “Bend” and “Roundabout”. It has to be noted that accidents at roundabouts were coded as accidents at intersections until the year 2015 and only a few federal states provided more details. Since 2016, accidents at roundabouts are coded separately in the national statistics. However, to provide possibilities for direct comparisons with other countries different approaches were considered. The most promising approach was found in a work by the Fraunhofer Institute IVI which was commissioned by a project partner to conduct a study focusing on accidents at intersections in Germany. Relevant results were kindly provided to the Intersection 2020 project. The analysis referred to 9.7% of accidents classified as intersection accidents by the road accident databases of the police of the four German federal states Saxony, Hesse, Brandenburg and Saxony-Anhalt between years 2010 and 2015. The dataset contained all accidents, hence, including also accidents with material damage only if selected.

Wisch 5
CARE analysis The CARE database has been analysed applying specific filter criteria, see Figure 1. A country selection was required because only 11 countries delivered satisfying data about the abovementioned commonly agreed European definitions of an intersection. For the present analysis accidents with fatalities AND serious injuries were included under the assumption that the structure of type of junction (variable R13) is comparable and even if the total number of serious injuries is not fully comparable between different countries.
Figure 1: Approach for CARE analysis
Derivation of Accident Scenarios According to the Federal Statistical Office of Germany “the kind of accident describes of the entire course of events in an accident the direction into which the vehicles involved were heading when they first collided on the carriageway or, if there was no collision, the first mechanical impact on a vehicle” [16]. It can be distinguished between 10 kinds of accidents. To address accidents being of highest relevance for enhanced AEB systems specifically designed for intersection scenarios (and thus considering existing AEB systems, e.g. car-to-rearend systems), it was determined to focus on accidents either assigned to kind of accident 4) Collision with another oncoming vehicle, 5) Collision with another vehicle which turns into or crosses a road or 10) Accident of another kind. Figure 2 describes the data filter criteria to derive the AS for car-to-car accidents using data from the German national statistics. The focus was on accidents on urban and rural roads (but not on motorways) with at least one killed or seriously injured (KSI) person.
Figure 2: Approach for the derivation of Accident Scenarios from the German national statistics
In the German statistics there are seven types of accidents (coded as type 1 to type 7) describing the conflict situation prior to the accident. Each of these types can be further detailed into sub-types (e.g., accident type
Wisch 6
“301”), see also [14]. However, in the German accident statistics this 3-digit accident type information is not available for all federal states of Germany but is provided by 5 (out of 16) federal states (Lower Saxony, North Rhine-Westphalia, Rhineland Palatinate, Saxony-Anhalt and Saarland) which by random, represent the German accident occurrence quite well, as non-published studies have shown. It was concluded that only data from these 5 federal states were used for the subsequent analyses regarding AS. Various studies have already defined groups of accidents at intersections. Finally, for the purpose of comparisons and for harmonization it was aimed to select the AS of Intersection 2020 considering mainly findings from the US Department of Transport in [17]. Detailed analysis of Accident Scenarios regarding technical parameters Basic crash parameters have been analysed for the most frequent AS SCP, LTAP/OD and LTAP/LD using GIDAS according to the following filter criteria:
1) Accident years 2005-2016 (GIDAS database version 07/2017) 2) Completed and reconstructed cases 3) Car-to-car (two parties exactly), first major collision 4) Only urban and rural roads, no motorways 5) Two injury severity groups:
a. Seriously and/or killed car occupants (KSI) b. Slightly, seriously and/or killed car occupants (ALL)
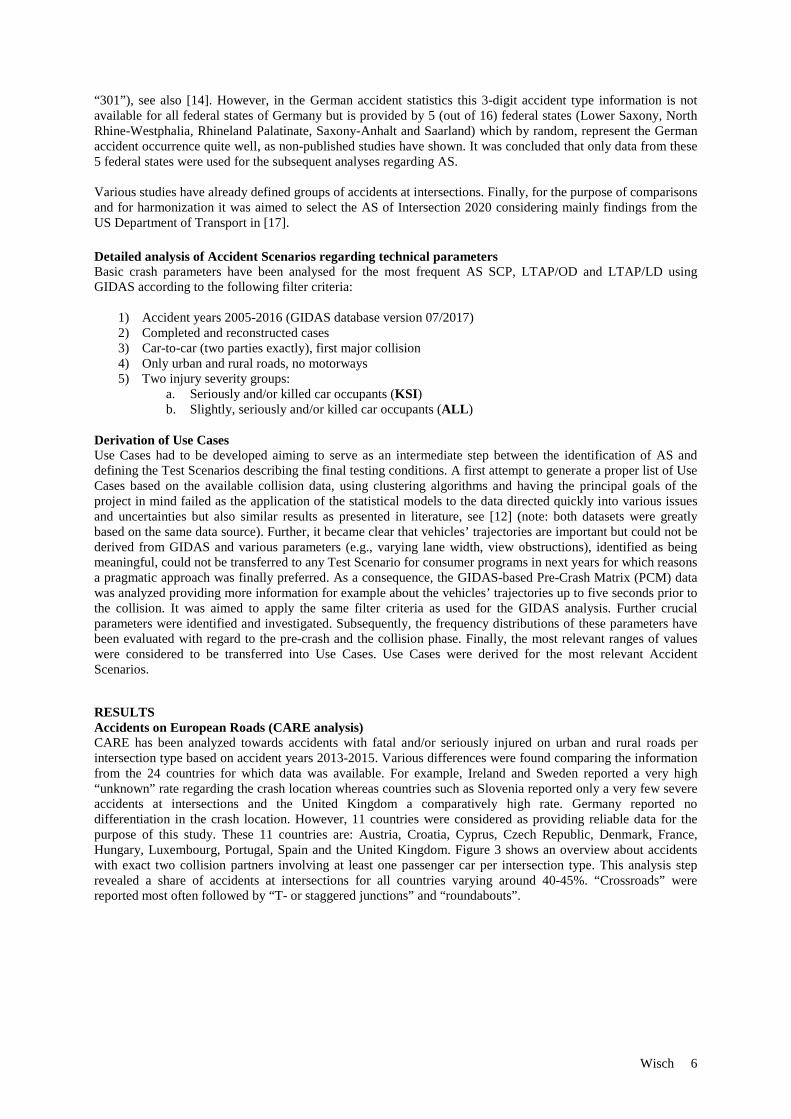
Derivation of Use Cases Use Cases had to be developed aiming to serve as an intermediate step between the identification of AS and defining the Test Scenarios describing the final testing conditions. A first attempt to generate a proper list of Use Cases based on the available collision data, using clustering algorithms and having the principal goals of the project in mind failed as the application of the statistical models to the data directed quickly into various issues and uncertainties but also similar results as presented in literature, see [12] (note: both datasets were greatly based on the same data source). Further, it became clear that vehicles’ trajectories are important but could not be derived from GIDAS and various parameters (e.g., varying lane width, view obstructions), identified as being meaningful, could not be transferred to any Test Scenario for consumer programs in next years for which reasons a pragmatic approach was finally preferred. As a consequence, the GIDAS-based Pre-Crash Matrix (PCM) data was analyzed providing more information for example about the vehicles’ trajectories up to five seconds prior to the collision. It was aimed to apply the same filter criteria as used for the GIDAS analysis. Further crucial parameters were identified and investigated. Subsequently, the frequency distributions of these parameters have been evaluated with regard to the pre-crash and the collision phase. Finally, the most relevant ranges of values were considered to be transferred into Use Cases. Use Cases were derived for the most relevant Accident Scenarios. RESULTS Accidents on European Roads (CARE analysis) CARE has been analyzed towards accidents with fatal and/or seriously injured on urban and rural roads per intersection type based on accident years 2013-2015. Various differences were found comparing the information from the 24 countries for which data was available. For example, Ireland and Sweden reported a very high “unknown” rate regarding the crash location whereas countries such as Slovenia reported only a very few severe accidents at intersections and the United Kingdom a comparatively high rate. Germany reported no differentiation in the crash location. However, 11 countries were considered as providing reliable data for the purpose of this study. These 11 countries are: Austria, Croatia, Cyprus, Czech Republic, Denmark, France, Hungary, Luxembourg, Portugal, Spain and the United Kingdom. Figure 3 shows an overview about accidents with exact two collision partners involving at least one passenger car per intersection type. This analysis step revealed a share of accidents at intersections for all countries varying around 40-45%. “Crossroads” were reported most often followed by “T- or staggered junctions” and “roundabouts”.
Wisch 7
Figure 3: Accidents with fatal and/or seriously injured on urban and rural roads per intersection type, Two crash
participants with at least one car, Country selection EU28, 2013-2015
The second analysis step based on CARE data from 2012-2015 and has looked for the number of KSI accidents (N=162,460) and corresponding fatalities (N=15,857) involving one passenger car (incl. taxis) and another road user (differentiating for accidents according to the configurations car-to-car, car-to-lorry, car-to-HeavyGoodsVehicle/Bus, car-to-PoweredTwoWheeler and car-to-RemainingRoadUsers). Omitting the “remaining road users”, it was found that car-to-PTW collisions (n=46,195) dominated the number of severe accidents, followed by car-to-car collisions (n=34,489). However, car-to-car collisions dominated the number of fatalities (n=4,236), followed by car-to-PTW collisions (n=2,992). The numbers of accidents involving at least one passenger car and another road user and the corresponding figures on fatalities are shown per intersection type in Table 3 and Table 4, respectively. In both statistics, it was found that accidents at crossroads and T- or staggered junctions are of highest relevance. Focussing on accidents at intersections between one passenger car and another road user shows that around one-third of all accidents and related fatalities could have been assigned to car-to-PTW accidents and one-fifth of all accidents and fatalities to car-to-car accidents. “Car-to-remain” accidents involve accidents between cars and pedestrians/cyclists.
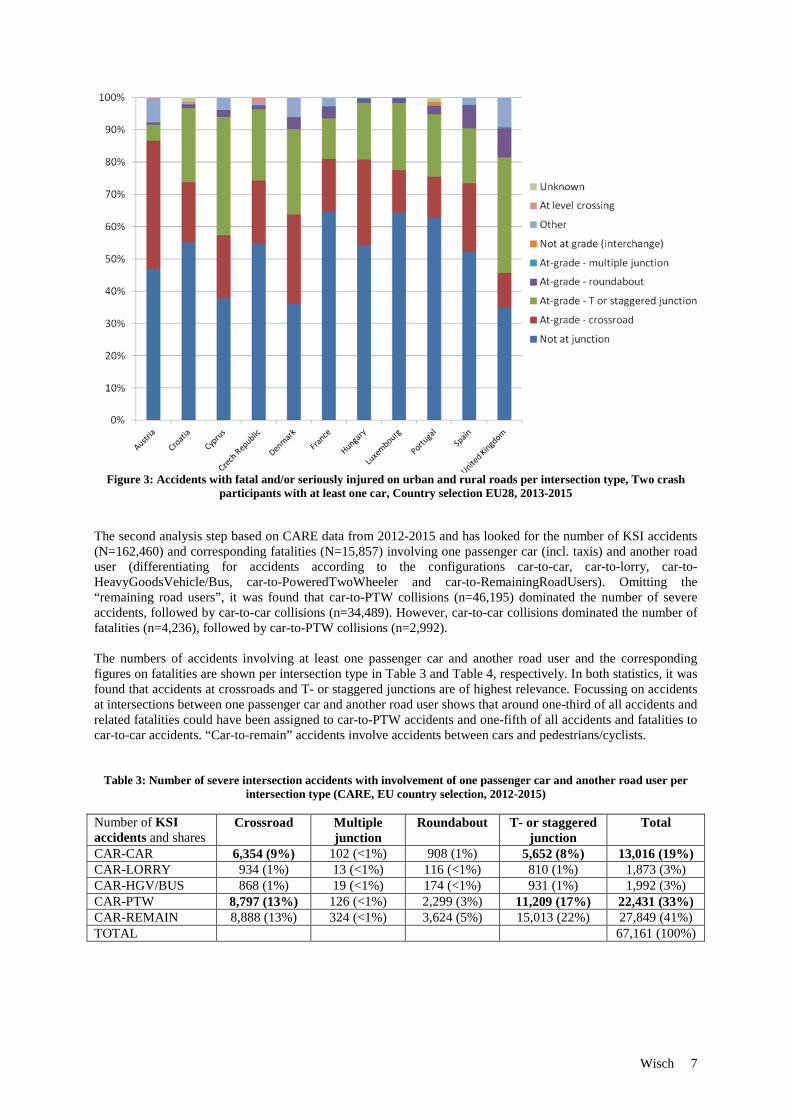
Table 3: Number of severe intersection accidents with involvement of one passenger car and another road user per intersection type (CARE, EU country selection, 2012-2015)
Number of KSI accidents and shares
Crossroad Multiple junction
Roundabout T- or staggered junction
Total
CAR-CAR 6,354 (9%) 102 (<1%) 908 (1%) 5,652 (8%) 13,016 (19%) CAR-LORRY 934 (1%) 13 (<1%) 116 (<1%) 810 (1%) 1,873 (3%) CAR-HGV/BUS 868 (1%) 19 (<1%) 174 (<1%) 931 (1%) 1,992 (3%) CAR-PTW 8,797 (13%) 126 (<1%) 2,299 (3%) 11,209 (17%) 22,431 (33%) CAR-REMAIN 8,888 (13%) 324 (<1%) 3,624 (5%) 15,013 (22%) 27,849 (41%) TOTAL 67,161 (100%)
Wisch 8
Table 4: Number of fatalities in severe intersection accidents with involvement of one passenger car and another road user per intersection type (CARE, EU country selection, 2012-2015)
Number of fatalities and shares
Crossroad Multiple junction
Roundabout T- or staggered junction
Total
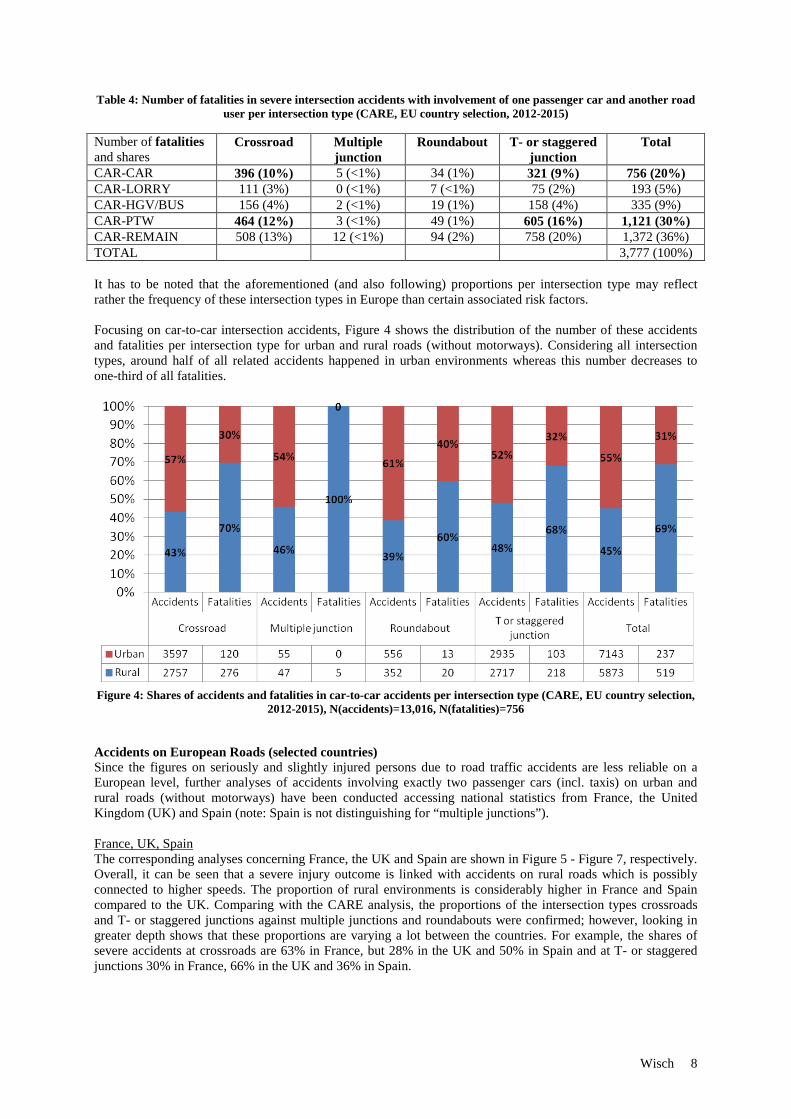
CAR-CAR 396 (10%) 5 (<1%) 34 (1%) 321 (9%) 756 (20%) CAR-LORRY 111 (3%) 0 (<1%) 7 (<1%) 75 (2%) 193 (5%) CAR-HGV/BUS 156 (4%) 2 (<1%) 19 (1%) 158 (4%) 335 (9%) CAR-PTW 464 (12%) 3 (<1%) 49 (1%) 605 (16%) 1,121 (30%) CAR-REMAIN 508 (13%) 12 (<1%) 94 (2%) 758 (20%) 1,372 (36%) TOTAL 3,777 (100%) It has to be noted that the aforementioned (and also following) proportions per intersection type may reflect rather the frequency of these intersection types in Europe than certain associated risk factors. Focusing on car-to-car intersection accidents, Figure 4 shows the distribution of the number of these accidents and fatalities per intersection type for urban and rural roads (without motorways). Considering all intersection types, around half of all related accidents happened in urban environments whereas this number decreases to one-third of all fatalities.
Figure 4: Shares of accidents and fatalities in car-to-car accidents per intersection type (CARE, EU country selection,
2012-2015), N(accidents)=13,016, N(fatalities)=756
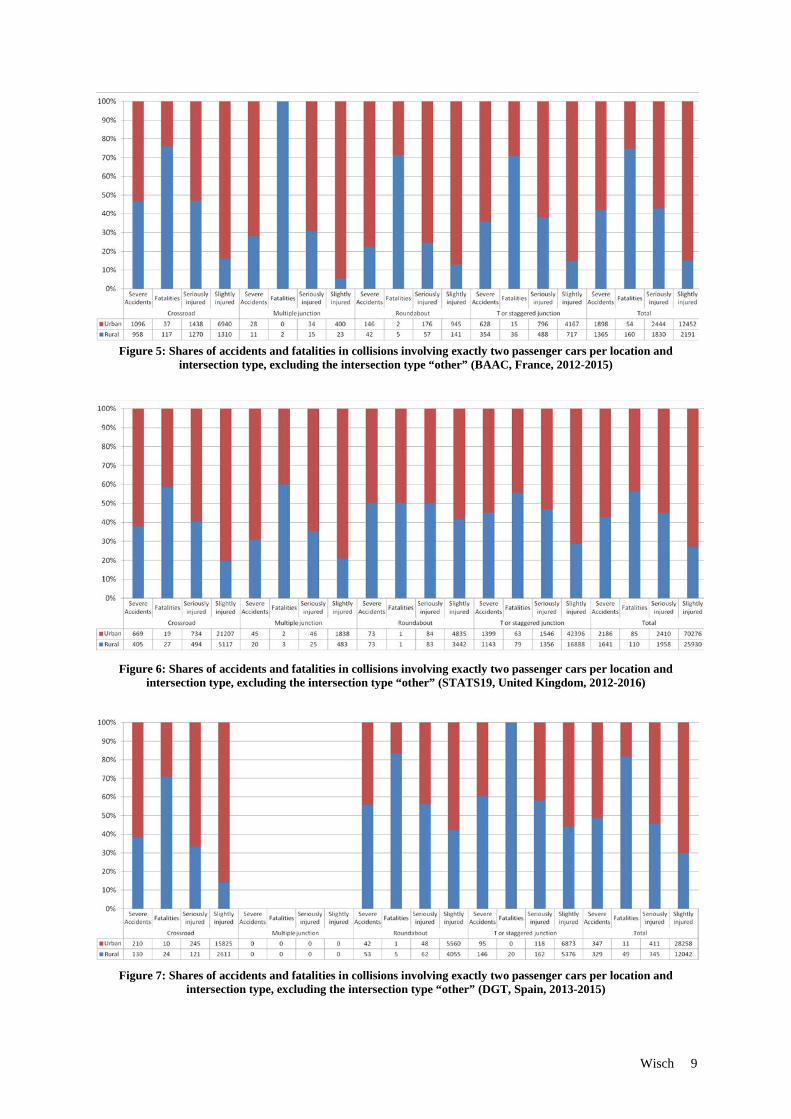
Accidents on European Roads (selected countries) Since the figures on seriously and slightly injured persons due to road traffic accidents are less reliable on a European level, further analyses of accidents involving exactly two passenger cars (incl. taxis) on urban and rural roads (without motorways) have been conducted accessing national statistics from France, the United Kingdom (UK) and Spain (note: Spain is not distinguishing for “multiple junctions”). France, UK, Spain The corresponding analyses concerning France, the UK and Spain are shown in Figure 5 - Figure 7, respectively. Overall, it can be seen that a severe injury outcome is linked with accidents on rural roads which is possibly connected to higher speeds. The proportion of rural environments is considerably higher in France and Spain compared to the UK. Comparing with the CARE analysis, the proportions of the intersection types crossroads and T- or staggered junctions against multiple junctions and roundabouts were confirmed; however, looking in greater depth shows that these proportions are varying a lot between the countries. For example, the shares of severe accidents at crossroads are 63% in France, but 28% in the UK and 50% in Spain and at T- or staggered junctions 30% in France, 66% in the UK and 36% in Spain.
Wisch 9
Figure 5: Shares of accidents and fatalities in collisions involving exactly two passenger cars per location and
intersection type, excluding the intersection type “other” (BAAC, France, 2012-2015)
Figure 6: Shares of accidents and fatalities in collisions involving exactly two passenger cars per location and
intersection type, excluding the intersection type “other” (STATS19, United Kingdom, 2012-2016)
Figure 7: Shares of accidents and fatalities in collisions involving exactly two passenger cars per location and
intersection type, excluding the intersection type “other” (DGT, Spain, 2013-2015)
Wisch 10
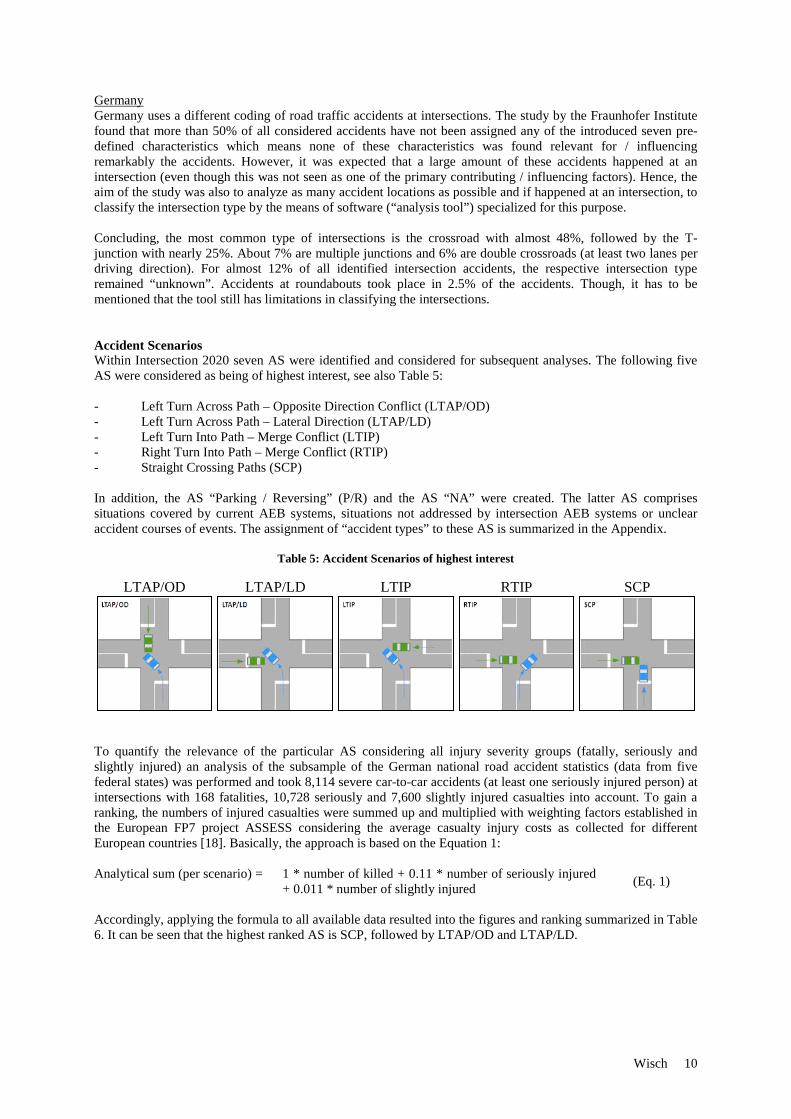
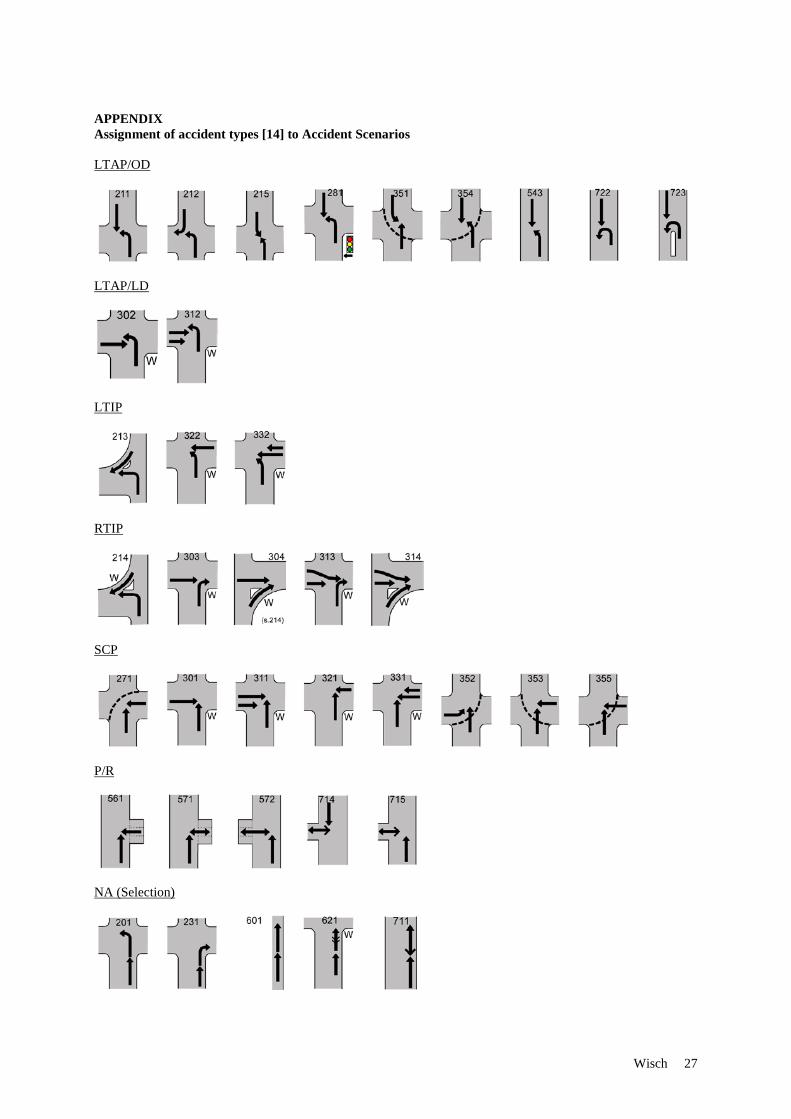
Germany Germany uses a different coding of road traffic accidents at intersections. The study by the Fraunhofer Institute found that more than 50% of all considered accidents have not been assigned any of the introduced seven pre-defined characteristics which means none of these characteristics was found relevant for / influencing remarkably the accidents. However, it was expected that a large amount of these accidents happened at an intersection (even though this was not seen as one of the primary contributing / influencing factors). Hence, the aim of the study was also to analyze as many accident locations as possible and if happened at an intersection, to classify the intersection type by the means of software (“analysis tool”) specialized for this purpose. Concluding, the most common type of intersections is the crossroad with almost 48%, followed by the T-junction with nearly 25%. About 7% are multiple junctions and 6% are double crossroads (at least two lanes per driving direction). For almost 12% of all identified intersection accidents, the respective intersection type remained “unknown”. Accidents at roundabouts took place in 2.5% of the accidents. Though, it has to be mentioned that the tool still has limitations in classifying the intersections. Accident Scenarios Within Intersection 2020 seven AS were identified and considered for subsequent analyses. The following five AS were considered as being of highest interest, see also Table 5: - Left Turn Across Path – Opposite Direction Conflict (LTAP/OD) - Left Turn Across Path – Lateral Direction (LTAP/LD) - Left Turn Into Path – Merge Conflict (LTIP) - Right Turn Into Path – Merge Conflict (RTIP) - Straight Crossing Paths (SCP) In addition, the AS “Parking / Reversing” (P/R) and the AS “NA” were created. The latter AS comprises situations covered by current AEB systems, situations not addressed by intersection AEB systems or unclear accident courses of events. The assignment of “accident types” to these AS is summarized in the Appendix.
Table 5: Accident Scenarios of highest interest
LTAP/OD LTAP/LD LTIP RTIP SCP
To quantify the relevance of the particular AS considering all injury severity groups (fatally, seriously and slightly injured) an analysis of the subsample of the German national road accident statistics (data from five federal states) was performed and took 8,114 severe car-to-car accidents (at least one seriously injured person) at intersections with 168 fatalities, 10,728 seriously and 7,600 slightly injured casualties into account. To gain a ranking, the numbers of injured casualties were summed up and multiplied with weighting factors established in the European FP7 project ASSESS considering the average casualty injury costs as collected for different European countries [18]. Basically, the approach is based on the Equation 1: Analytical sum (per scenario) = 1 * number of killed + 0.11 * number of seriously injured
+ 0.011 * number of slightly injured (Eq. 1)
Accordingly, applying the formula to all available data resulted into the figures and ranking summarized in Table 6. It can be seen that the highest ranked AS is SCP, followed by LTAP/OD and LTAP/LD.
Wisch 11
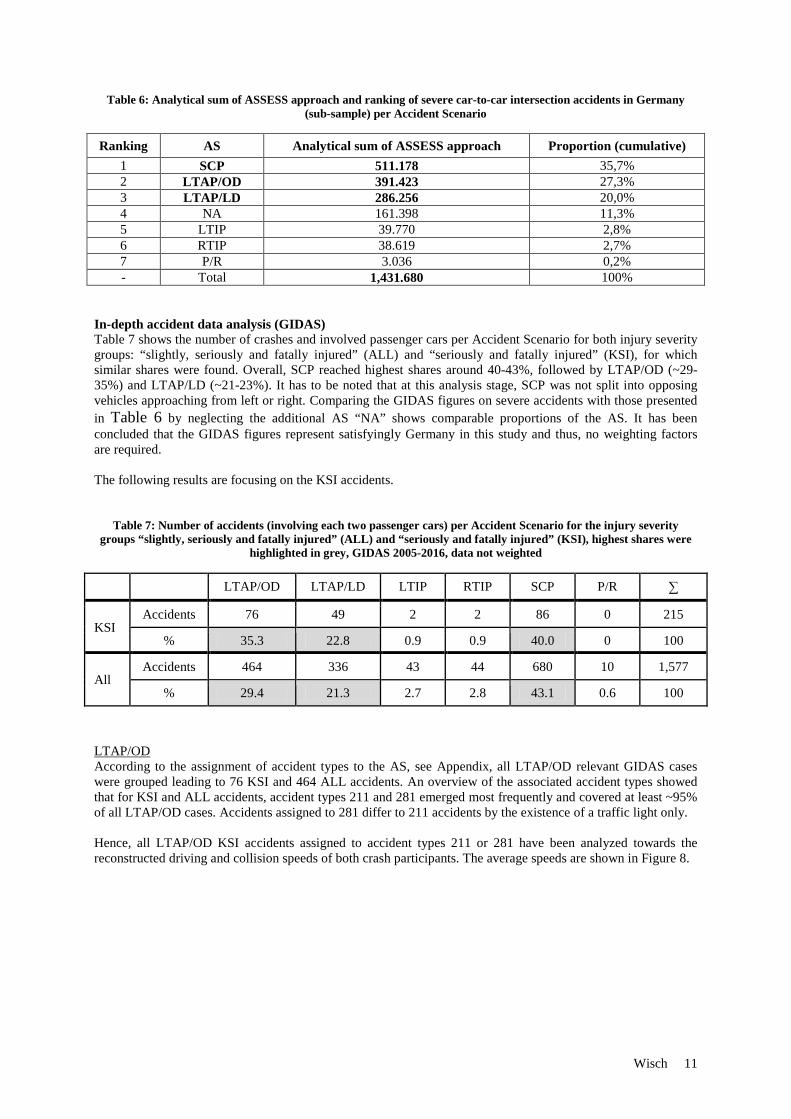
Table 6: Analytical sum of ASSESS approach and ranking of severe car-to-car intersection accidents in Germany (sub-sample) per Accident Scenario
Ranking AS Analytical sum of ASSESS approach Proportion (cumulative) 1 SCP 511.178 35,7% 2 LTAP/OD 391.423 27,3% 3 LTAP/LD 286.256 20,0% 4 NA 161.398 11,3% 5 LTIP 39.770 2,8% 6 RTIP 38.619 2,7% 7 P/R 3.036 0,2% - Total 1,431.680 100%
In-depth accident data analysis (GIDAS) Table 7 shows the number of crashes and involved passenger cars per Accident Scenario for both injury severity groups: “slightly, seriously and fatally injured” (ALL) and “seriously and fatally injured” (KSI), for which similar shares were found. Overall, SCP reached highest shares around 40-43%, followed by LTAP/OD (~29-35%) and LTAP/LD (~21-23%). It has to be noted that at this analysis stage, SCP was not split into opposing vehicles approaching from left or right. Comparing the GIDAS figures on severe accidents with those presented in Table 6 by neglecting the additional AS “NA” shows comparable proportions of the AS. It has been concluded that the GIDAS figures represent satisfyingly Germany in this study and thus, no weighting factors are required. The following results are focusing on the KSI accidents.
Table 7: Number of accidents (involving each two passenger cars) per Accident Scenario for the injury severity groups “slightly, seriously and fatally injured” (ALL) and “seriously and fatally injured” (KSI), highest shares were
highlighted in grey, GIDAS 2005-2016, data not weighted
LTAP/OD LTAP/LD LTIP RTIP SCP P/R ∑
KSI Accidents 76 49 2 2 86 0 215
% 35.3 22.8 0.9 0.9 40.0 0 100
All Accidents 464 336 43 44 680 10 1,577
% 29.4 21.3 2.7 2.8 43.1 0.6 100
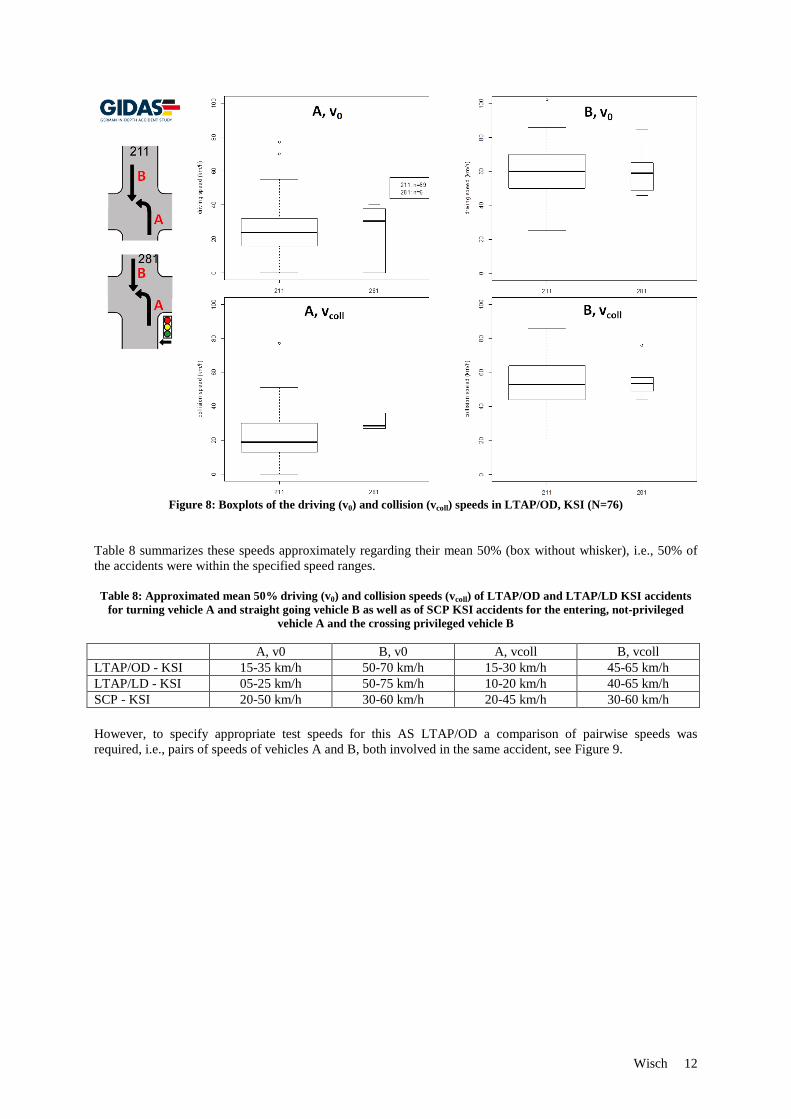
LTAP/OD According to the assignment of accident types to the AS, see Appendix, all LTAP/OD relevant GIDAS cases were grouped leading to 76 KSI and 464 ALL accidents. An overview of the associated accident types showed that for KSI and ALL accidents, accident types 211 and 281 emerged most frequently and covered at least ~95% of all LTAP/OD cases. Accidents assigned to 281 differ to 211 accidents by the existence of a traffic light only. Hence, all LTAP/OD KSI accidents assigned to accident types 211 or 281 have been analyzed towards the reconstructed driving and collision speeds of both crash participants. The average speeds are shown in Figure 8.
Wisch 12
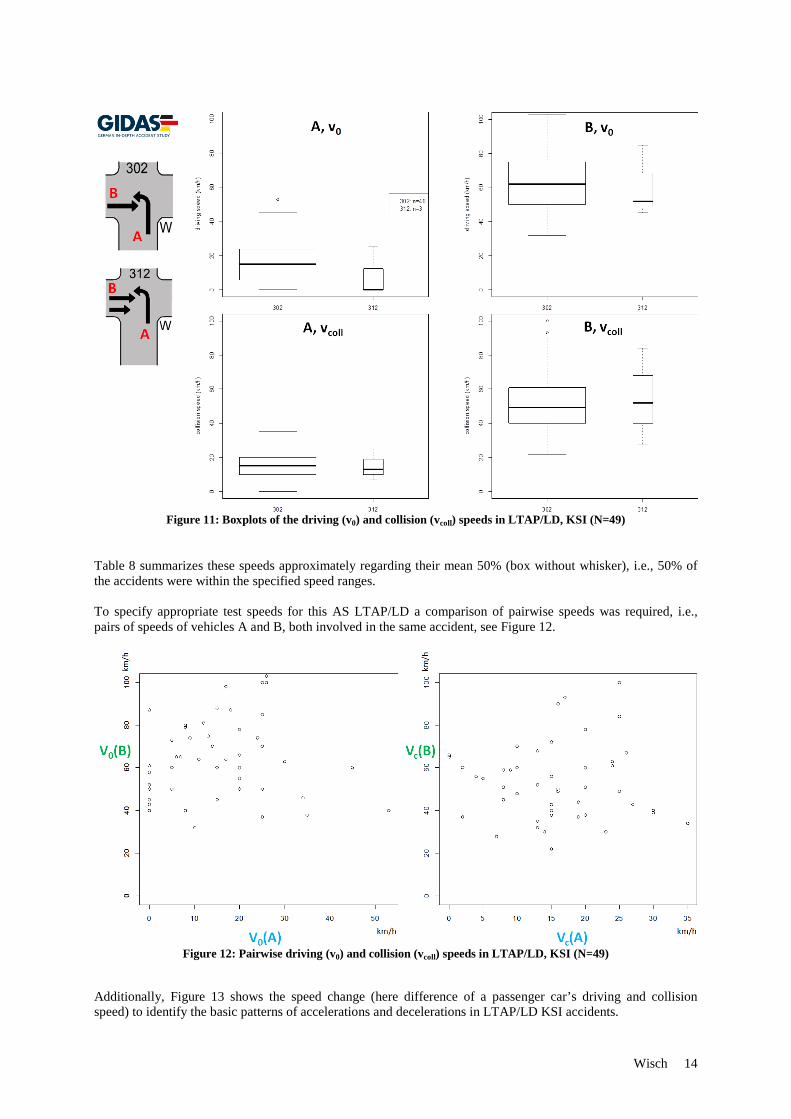
Figure 8: Boxplots of the driving (v0) and collision (vcoll) speeds in LTAP/OD, KSI (N=76)
Table 8 summarizes these speeds approximately regarding their mean 50% (box without whisker), i.e., 50% of the accidents were within the specified speed ranges. Table 8: Approximated mean 50% driving (v0) and collision speeds (vcoll) of LTAP/OD and LTAP/LD KSI accidents
for turning vehicle A and straight going vehicle B as well as of SCP KSI accidents for the entering, not-privileged vehicle A and the crossing privileged vehicle B
A, v0 B, v0 A, vcoll B, vcoll LTAP/OD - KSI 15-35 km/h 50-70 km/h 15-30 km/h 45-65 km/h LTAP/LD - KSI 05-25 km/h 50-75 km/h 10-20 km/h 40-65 km/h SCP - KSI 20-50 km/h 30-60 km/h 20-45 km/h 30-60 km/h However, to specify appropriate test speeds for this AS LTAP/OD a comparison of pairwise speeds was required, i.e., pairs of speeds of vehicles A and B, both involved in the same accident, see Figure 9.

Wisch 13
Figure 9: Pairwise driving (v0) and collision (vcoll) speeds in LTAP/OD, KSI (N=76)
In addition, Figure 10 shows the speed change (here difference of a passenger car’s driving and collision speed) to identify the basic patterns of accelerations and decelerations in LTAP/OD KSI accidents. Note: visible accelerations and decelerations do not necessarily correlate with initiated accelerating or braking of the driver. Further, the speed changes might have led to smaller or bigger changes in movement as the driving speeds could have been low or high. This is also true for the related figures on the AS LTAP/LD and SCP, see Figure 13 and Figure 16, respectively.
Figure 10: Pairwise speeds - accelerations and decelerations, LTAP/OD, KSI (N=76)
LTAP/LD According to the assignment of accident types to the AS, see Appendix, all LTAP/LD relevant GIDAS cases were grouped leading to 49 KSI and 336 ALL accidents. An overview of the associated accident types showed that for KSI and ALL accidents, the accident type 302 emerged most frequently and covered at least ~94% of all LTAP/LD cases. Accidents assigned to 312 differ to 302 (accounting for remaining cases) accidents by the driving of another vehicle parallel to the vehicle with right of way. Hence, all LTAP/LD KSI accidents assigned to accident types 302 or 312 have been analyzed towards the reconstructed driving and collision speeds of both crash participants. The average speeds are shown in Figure 11.
Wisch 14
Figure 11: Boxplots of the driving (v0) and collision (vcoll) speeds in LTAP/LD, KSI (N=49)
Table 8 summarizes these speeds approximately regarding their mean 50% (box without whisker), i.e., 50% of the accidents were within the specified speed ranges. To specify appropriate test speeds for this AS LTAP/LD a comparison of pairwise speeds was required, i.e., pairs of speeds of vehicles A and B, both involved in the same accident, see Figure 12.
Figure 12: Pairwise driving (v0) and collision (vcoll) speeds in LTAP/LD, KSI (N=49)
Additionally, Figure 13 shows the speed change (here difference of a passenger car’s driving and collision speed) to identify the basic patterns of accelerations and decelerations in LTAP/LD KSI accidents.

Wisch 15
Figure 13: Pairwise speeds - accelerations and decelerations, LTAP/LD, KSI (N=49)
SCP According to the assignment of accident types to the AS, see Appendix, all SCP relevant GIDAS cases were grouped leading to 86 KSI and 680 ALL accidents. An overview of the associated accident types showed that for KSI and ALL accidents, the accident types 301 and 321 emerged most frequently and covered at least ~92% of all SCP cases. Accidents assigned to 301 differ to 321 accidents by the direction of the privileged vehicle, either approaching from left or right. Hence, all SCP KSI accidents assigned to accident types 301 or 321 have been analyzed towards the reconstructed driving and collision speeds of both crash participants. The average speeds are shown in Figure 14.
Figure 14: Boxplots of the driving (v0) and collision (vcoll) speeds in SCP, KSI (N=86)

Wisch 16
Table 8 summarizes these speeds approximately regarding their mean 50% (box without whisker), i.e., 50% of the accidents were within the specified speed ranges. To specify appropriate test speeds for this AS SCP a comparison of pairwise speeds was required, i.e., pairs of speeds of vehicles A and B, both involved in the same accident, see Figure 15.
Figure 15: Pairwise driving (v0) and collision (vcoll) speeds in SCP, KSI (N=86)
Additionally, Figure 16 shows the speed change (here difference of a passenger car’s driving and collision speed) to identify the basic patterns of accelerations and decelerations in SCP KSI accidents.
Figure 16: Pairwise speeds - accelerations and decelerations, SCP, KSI (N=86)
Use Cases Required Parameters Up to the level of Accident Scenarios, a rather abstract description of the basic movements of the vehicles is given. At the same time, the most important conflict situations at intersections to be addressed by corresponding AEB systems are known. However, when it comes to testing of such systems, scenarios should be representative

Wisch 17
with regard to the crucial parameters. The selected parameters for further investigations are listed in Table 9. The principles of the analysis are provided for LTAP/OD in this paper. Analogue gained results for LTAP/LD and SCP were summarized below.
Table 9: Parameters under investigation using the GIDAS-based PCM to derive Use Cases
Parameter Description / Main reason for consideration Intersection type Basic layout of an intersection (crossroad, t-junction etc.) Right-of-Way Driving behavior might be affected by the kind of road/traffic regulation Angles between road arms To estimate more exactly the relative direction of approach of the collision partners. Lateral Offset between accident participants
Regarding a turning vehicle, the lateral distance to an oncoming crash opponent before initiating the turn maneuver is of interest. Defining this parameter is required to enable the initial positioning of the two vehicles.
Speed Profiles To estimate the initial and collision velocities of both collision partners. Initial velocity means the speed at the point in time when the driver recognized the situation to be critical and thus, started a braking or evasive maneuver. In addition, data about the longitudinal acceleration and deceleration is of interest.
Collision Angle Represents the orientation of two colliding vehicles to each other at the time of the crash. It can be related to the longitudinal axes or to the velocity vectors of the colliding vehicles.
Impact Points/Overlap To determine the overlap by comparing the impact points for each of the colliding vehicles pair wise.
Turning Radius/Curvature Relevant for turning vehicles LTAP/OD - Lateral Offset The lateral offset of both vehicles in the LTAP/OD could not be extracted automatically from GIDAS. Therefore, the sketches of the corresponding accident sites have been analyzed case-by-case to extract at least the relative positions of the lanes used by the accident participants. In general, the evaluation was performed regarding ALL LTAP/OD accidents; however, if classified as significant during the analysis of certain further parameters, the results for KSI accidents were reported separately. Additionally, the dataset was reduced to those cases that are included in the PCM (version 2016/2), as the associated subset was used in particular to determine the turning radii. Also, only those cases were evaluated where driver of the turning car had to give way to the oncoming traffic, which represented 88 % of all LTAP/OD cases. Finally, three simplified intersection layouts were identified, see Figure 17. Layout 1 represents a rather clean layout, containing only two lanes in sum (one lane per direction of travel). The lanes are not separated by any other road elements. Layout 2 contains specific lanes (at least for the left turning car). However, as with layout 1, the lanes used by the accident participants are not separated by any other road elements. Layout 3 represents a rather complex geometry, containing a separation between the lanes used by the accident participants due to road elements such as traffic islands or additional lanes, for instance. Compared to layouts 1 and 2, this leads to an additional offset.
Figure 17: Simplified layouts for the LTAP/OD scenario
The spread of the lane widths and offsets with regard to the layouts 1 and 2 is relatively low. Regarding the offset, the mean 50% is in a range of approximately 3.2 to 3.5 m. It is worth noting that the lane widths also match the most relevant left turn types described in the German recommendations for the construction of rural roads [19]. However, the aforementioned determination of the lateral offset between the vehicles’ centers followed the assumption that drivers are using exactly the middle of their lanes. In this context, the actual positions of the
Wisch 18
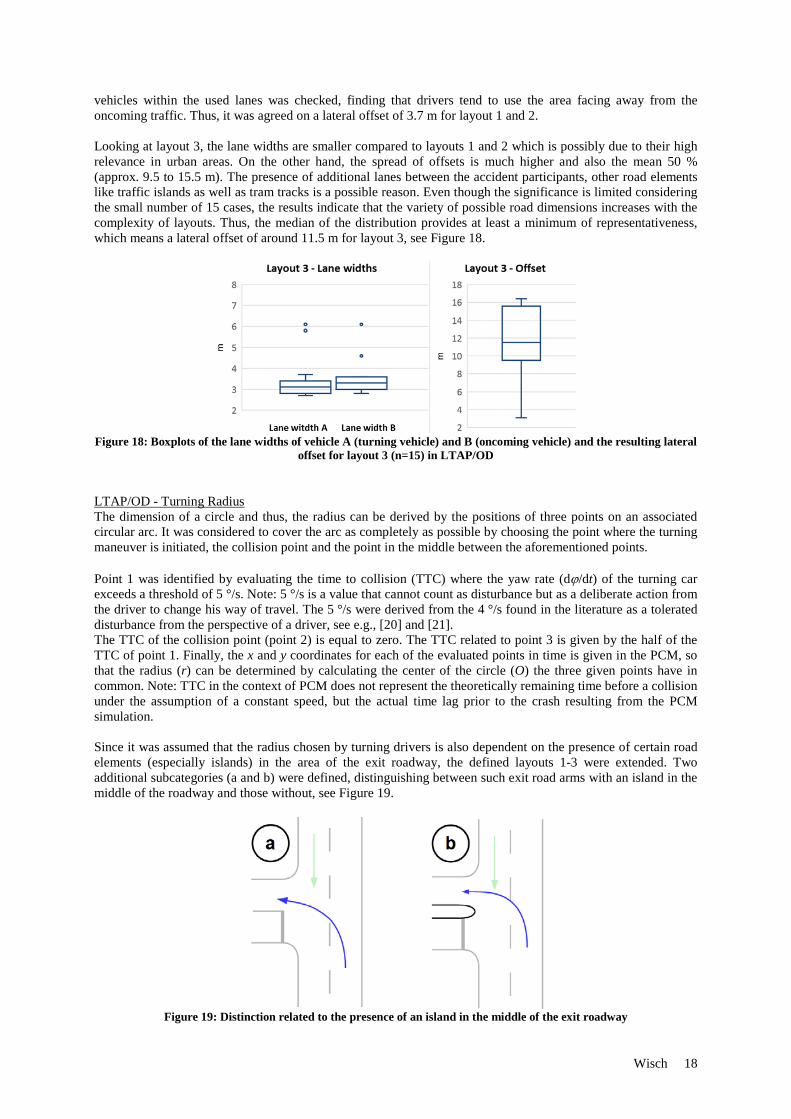
vehicles within the used lanes was checked, finding that drivers tend to use the area facing away from the oncoming traffic. Thus, it was agreed on a lateral offset of 3.7 m for layout 1 and 2. Looking at layout 3, the lane widths are smaller compared to layouts 1 and 2 which is possibly due to their high relevance in urban areas. On the other hand, the spread of offsets is much higher and also the mean 50 % (approx. 9.5 to 15.5 m). The presence of additional lanes between the accident participants, other road elements like traffic islands as well as tram tracks is a possible reason. Even though the significance is limited considering the small number of 15 cases, the results indicate that the variety of possible road dimensions increases with the complexity of layouts. Thus, the median of the distribution provides at least a minimum of representativeness, which means a lateral offset of around 11.5 m for layout 3, see Figure 18.
Figure 18: Boxplots of the lane widths of vehicle A (turning vehicle) and B (oncoming vehicle) and the resulting lateral
offset for layout 3 (n=15) in LTAP/OD
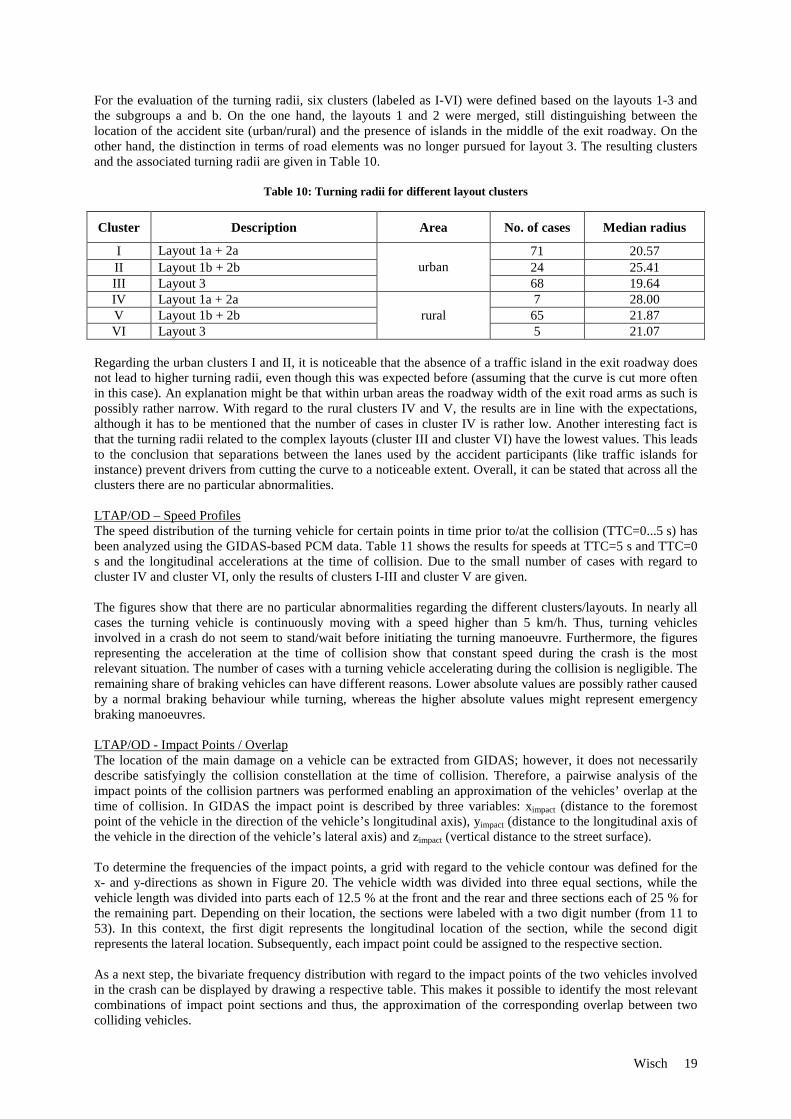
LTAP/OD - Turning Radius The dimension of a circle and thus, the radius can be derived by the positions of three points on an associated circular arc. It was considered to cover the arc as completely as possible by choosing the point where the turning maneuver is initiated, the collision point and the point in the middle between the aforementioned points. Point 1 was identified by evaluating the time to collision (TTC) where the yaw rate (dϕ/dt) of the turning car exceeds a threshold of 5 °/s. Note: 5 °/s is a value that cannot count as disturbance but as a deliberate action from the driver to change his way of travel. The 5 °/s were derived from the 4 °/s found in the literature as a tolerated disturbance from the perspective of a driver, see e.g., [20] and [21]. The TTC of the collision point (point 2) is equal to zero. The TTC related to point 3 is given by the half of the TTC of point 1. Finally, the x and y coordinates for each of the evaluated points in time is given in the PCM, so that the radius (r) can be determined by calculating the center of the circle (O) the three given points have in common. Note: TTC in the context of PCM does not represent the theoretically remaining time before a collision under the assumption of a constant speed, but the actual time lag prior to the crash resulting from the PCM simulation. Since it was assumed that the radius chosen by turning drivers is also dependent on the presence of certain road elements (especially islands) in the area of the exit roadway, the defined layouts 1-3 were extended. Two additional subcategories (a and b) were defined, distinguishing between such exit road arms with an island in the middle of the roadway and those without, see Figure 19.
Figure 19: Distinction related to the presence of an island in the middle of the exit roadway
Wisch 19
For the evaluation of the turning radii, six clusters (labeled as I-VI) were defined based on the layouts 1-3 and the subgroups a and b. On the one hand, the layouts 1 and 2 were merged, still distinguishing between the location of the accident site (urban/rural) and the presence of islands in the middle of the exit roadway. On the other hand, the distinction in terms of road elements was no longer pursued for layout 3. The resulting clusters and the associated turning radii are given in Table 10.
Table 10: Turning radii for different layout clusters
Cluster Description Area No. of cases Median radius
I Layout 1a + 2a urban
71 20.57 II Layout 1b + 2b 24 25.41 III Layout 3 68 19.64 IV Layout 1a + 2a
rural 7 28.00
V Layout 1b + 2b 65 21.87 VI Layout 3 5 21.07
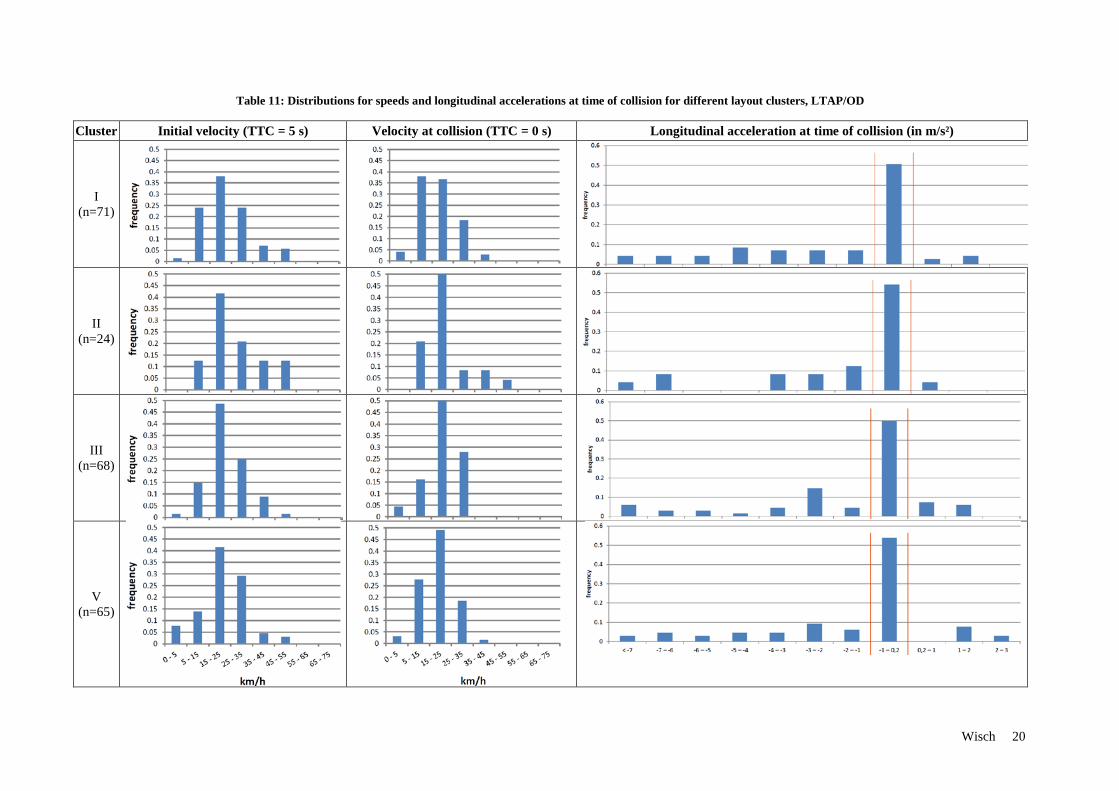
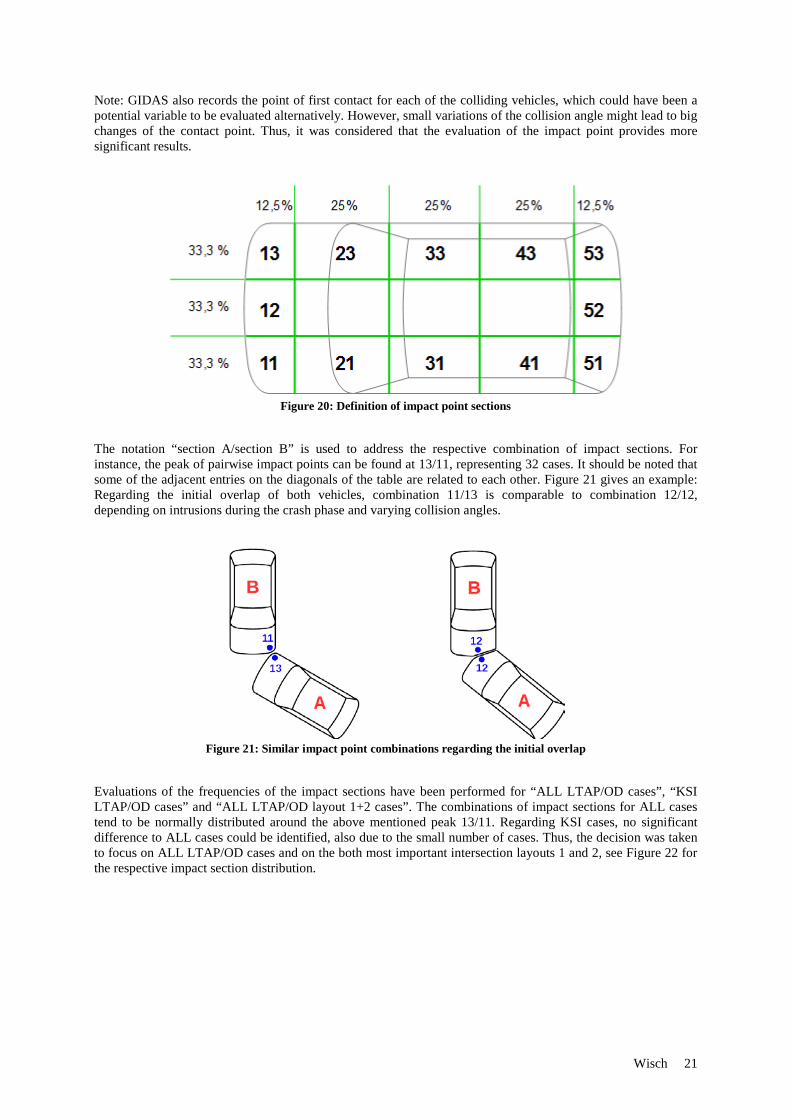
Regarding the urban clusters I and II, it is noticeable that the absence of a traffic island in the exit roadway does not lead to higher turning radii, even though this was expected before (assuming that the curve is cut more often in this case). An explanation might be that within urban areas the roadway width of the exit road arms as such is possibly rather narrow. With regard to the rural clusters IV and V, the results are in line with the expectations, although it has to be mentioned that the number of cases in cluster IV is rather low. Another interesting fact is that the turning radii related to the complex layouts (cluster III and cluster VI) have the lowest values. This leads to the conclusion that separations between the lanes used by the accident participants (like traffic islands for instance) prevent drivers from cutting the curve to a noticeable extent. Overall, it can be stated that across all the clusters there are no particular abnormalities. LTAP/OD – Speed Profiles The speed distribution of the turning vehicle for certain points in time prior to/at the collision (TTC=0...5 s) has been analyzed using the GIDAS-based PCM data. Table 11 shows the results for speeds at TTC=5 s and TTC=0 s and the longitudinal accelerations at the time of collision. Due to the small number of cases with regard to cluster IV and cluster VI, only the results of clusters I-III and cluster V are given. The figures show that there are no particular abnormalities regarding the different clusters/layouts. In nearly all cases the turning vehicle is continuously moving with a speed higher than 5 km/h. Thus, turning vehicles involved in a crash do not seem to stand/wait before initiating the turning manoeuvre. Furthermore, the figures representing the acceleration at the time of collision show that constant speed during the crash is the most relevant situation. The number of cases with a turning vehicle accelerating during the collision is negligible. The remaining share of braking vehicles can have different reasons. Lower absolute values are possibly rather caused by a normal braking behaviour while turning, whereas the higher absolute values might represent emergency braking manoeuvres. LTAP/OD - Impact Points / Overlap The location of the main damage on a vehicle can be extracted from GIDAS; however, it does not necessarily describe satisfyingly the collision constellation at the time of collision. Therefore, a pairwise analysis of the impact points of the collision partners was performed enabling an approximation of the vehicles’ overlap at the time of collision. In GIDAS the impact point is described by three variables: ximpact (distance to the foremost point of the vehicle in the direction of the vehicle’s longitudinal axis), yimpact (distance to the longitudinal axis of the vehicle in the direction of the vehicle’s lateral axis) and zimpact (vertical distance to the street surface). To determine the frequencies of the impact points, a grid with regard to the vehicle contour was defined for the x- and y-directions as shown in Figure 20. The vehicle width was divided into three equal sections, while the vehicle length was divided into parts each of 12.5 % at the front and the rear and three sections each of 25 % for the remaining part. Depending on their location, the sections were labeled with a two digit number (from 11 to 53). In this context, the first digit represents the longitudinal location of the section, while the second digit represents the lateral location. Subsequently, each impact point could be assigned to the respective section. As a next step, the bivariate frequency distribution with regard to the impact points of the two vehicles involved in the crash can be displayed by drawing a respective table. This makes it possible to identify the most relevant combinations of impact point sections and thus, the approximation of the corresponding overlap between two colliding vehicles.
Wisch 20
Table 11: Distributions for speeds and longitudinal accelerations at time of collision for different layout clusters, LTAP/OD
Cluster Initial velocity (TTC = 5 s) Velocity at collision (TTC = 0 s) Longitudinal acceleration at time of collision (in m/s²)
I (n=71)
II (n=24)
III (n=68)
V (n=65)
Wisch 21
Note: GIDAS also records the point of first contact for each of the colliding vehicles, which could have been a potential variable to be evaluated alternatively. However, small variations of the collision angle might lead to big changes of the contact point. Thus, it was considered that the evaluation of the impact point provides more significant results.
Figure 20: Definition of impact point sections
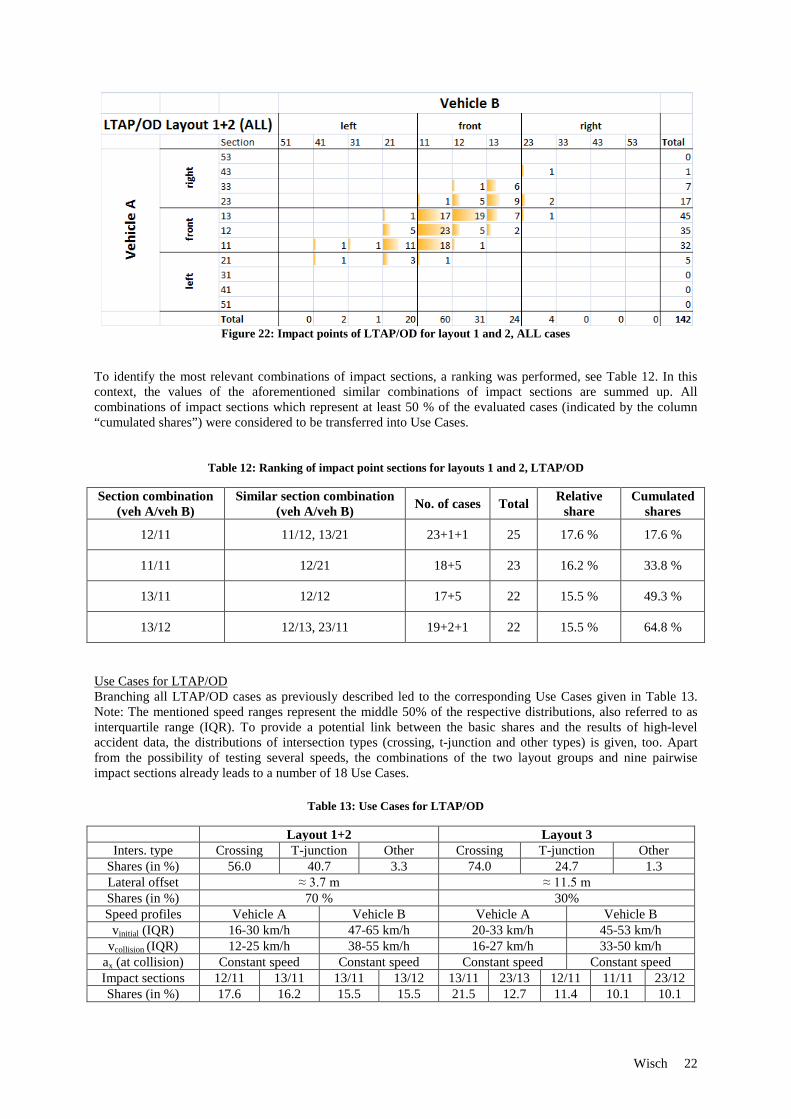
The notation “section A/section B” is used to address the respective combination of impact sections. For instance, the peak of pairwise impact points can be found at 13/11, representing 32 cases. It should be noted that some of the adjacent entries on the diagonals of the table are related to each other. Figure 21 gives an example: Regarding the initial overlap of both vehicles, combination 11/13 is comparable to combination 12/12, depending on intrusions during the crash phase and varying collision angles.
Figure 21: Similar impact point combinations regarding the initial overlap
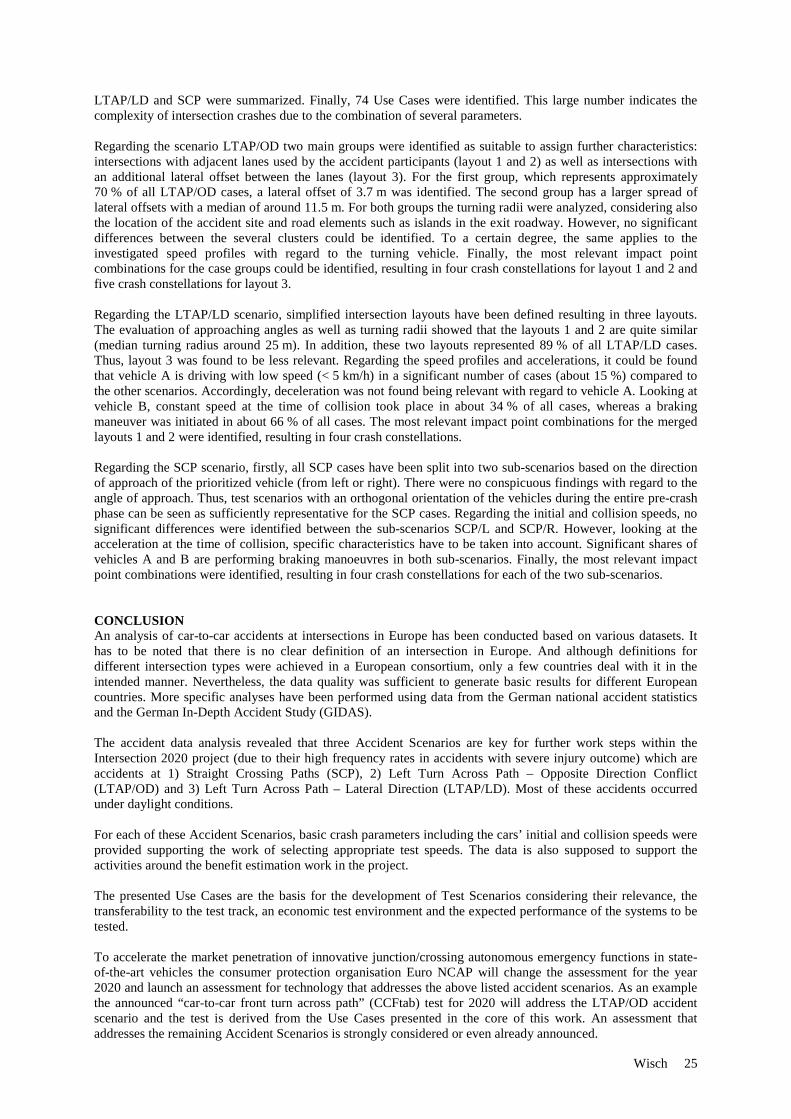
Evaluations of the frequencies of the impact sections have been performed for “ALL LTAP/OD cases”, “KSI LTAP/OD cases” and “ALL LTAP/OD layout 1+2 cases”. The combinations of impact sections for ALL cases tend to be normally distributed around the above mentioned peak 13/11. Regarding KSI cases, no significant difference to ALL cases could be identified, also due to the small number of cases. Thus, the decision was taken to focus on ALL LTAP/OD cases and on the both most important intersection layouts 1 and 2, see Figure 22 for the respective impact section distribution.
Wisch 22
Figure 22: Impact points of LTAP/OD for layout 1 and 2, ALL cases
To identify the most relevant combinations of impact sections, a ranking was performed, see Table 12. In this context, the values of the aforementioned similar combinations of impact sections are summed up. All combinations of impact sections which represent at least 50 % of the evaluated cases (indicated by the column “cumulated shares”) were considered to be transferred into Use Cases.
Table 12: Ranking of impact point sections for layouts 1 and 2, LTAP/OD
Section combination (veh A/veh B)
Similar section combination (veh A/veh B) No. of cases Total Relative
share Cumulated
shares
12/11 11/12, 13/21 23+1+1 25 17.6 % 17.6 %
11/11 12/21 18+5 23 16.2 % 33.8 %
13/11 12/12 17+5 22 15.5 % 49.3 %
13/12 12/13, 23/11 19+2+1 22 15.5 % 64.8 %
Use Cases for LTAP/OD Branching all LTAP/OD cases as previously described led to the corresponding Use Cases given in Table 13. Note: The mentioned speed ranges represent the middle 50% of the respective distributions, also referred to as interquartile range (IQR). To provide a potential link between the basic shares and the results of high-level accident data, the distributions of intersection types (crossing, t-junction and other types) is given, too. Apart from the possibility of testing several speeds, the combinations of the two layout groups and nine pairwise impact sections already leads to a number of 18 Use Cases.
Table 13: Use Cases for LTAP/OD
Layout 1+2 Layout 3 Inters. type Crossing T-junction Other Crossing T-junction Other
Shares (in %) 56.0 40.7 3.3 74.0 24.7 1.3 Lateral offset ≈ 3.7 m ≈ 11.5 m Shares (in %) 70 % 30% Speed profiles Vehicle A Vehicle B Vehicle A Vehicle B
vinitial (IQR) 16-30 km/h 47-65 km/h 20-33 km/h 45-53 km/h vcollision (IQR) 12-25 km/h 38-55 km/h 16-27 km/h 33-50 km/h
ax (at collision) Constant speed Constant speed Constant speed Constant speed Impact sections 12/11 13/11 13/11 13/12 13/11 23/13 12/11 11/11 23/12 Shares (in %) 17.6 16.2 15.5 15.5 21.5 12.7 11.4 10.1 10.1

Wisch 23
Use Cases for LTAP/LD Similar to LTAP/OD scenario evaluation, simplified intersection layouts have been defined with regard to the LTAP/LD scenario, resulting in three groups (from a rather clean layout 1 up to a rather complex layout 3). The evaluation of approaching angles as well as turning radii showed that the layouts 1 and 2 are quite similar (median turning radius: ≈ 25 m). In addition, these two layouts represented 89 % of all LTAP/LD cases. Thus, layout 3 was found to be less relevant. Regarding the speed profiles and accelerations, it was found that vehicle A is driving with low speed (< 5 km/h) in a significant number of cases (about 15 %) compared to the other scenarios. Accordingly, deceleration is not relevant with regard to vehicle A. Looking at vehicle B, constant speed at the time of collision took place in about 34 % of all cases, whereas a braking maneuver was initiated in about 66 % of all cases. The most relevant impact point combinations for the merged layouts 1 and 2 were identified, resulting in four crash constellations. Branching all LTAP/LD cases finally led to the corresponding Use Cases given in Table 14. The speed ranges represent the middle 50% of the respective distributions (IQR). Apart from the possibility of testing several speeds, the combinations of all identified parameter groups (acceleration and pairwise impact sections) already leads to a number of 24 Use Cases.
Table 14: Use Cases for LTAP/LD
Layout 1+2 (89 % of all LTAP/LD cases) Inters. type Crossing T-junction Other
Shares (in %) 18.5 60.5 21.0 Speed profiles Vehicle A Vehicle B
vinitial (IQR) 8-19 km/h 45-61 km/h vcollision (IQR) 9-16 km/h 37-50 km/h
ax (at collision) Const. Accel. Braking Const. Braking Shares (in %) 47.0 32.0 21.0 33.8 66.2
Impact sections 11/13 21/12 11/12 12/23 Shares (in %) 22.4 14.4 11.2 10.4
Use Cases for SCP First, all SCP cases have been split into two sub-scenarios based on the direction of approach of the prioritized vehicle (from left or right). With regard to the angle of approach, no particular abnormalities were found. Thus, test scenarios with an orthogonal orientation of the vehicles during the entire pre-crash phase can be seen as sufficiently representative for the SCP cases. Regarding the initial and collision speeds, no significant differences were identified between the sub-scenarios SCP/L and SCP/R. However, looking at the acceleration at the time of collision, specific characteristics have to be taken into account. Significant shares of vehicle A and vehicle B are performing braking manoeuvres in both sub-scenarios. Finally, the most relevant impact point combinations were identified, resulting in four crash constellations for each of the two sub-scenarios. Branching all SCP cases led to the corresponding Use Cases given in Table 15. The speed ranges represent the middle 50 % of the respective distributions (IQR). Apart from the possibility of testing several speeds, the combinations of the sub-scenarios and the further parameter groups (acceleration and pairwise impact sections) already leads to a number of 32 Use Cases.
Table 15: Use Cases for SCP
SCP/L SCP/R Inters. type Crossing T-junction Other Crossing T-junction Other
Shares (in %) 92.0 6.6 1.4 91.8 7.7 0.4 Speed profiles Vehicle A Vehicle B Vehicle A Vehicle B
vinitial (IQR) 19-44 km/h 37-52 km/h 25-46 km/h 30-50 km/h vcollision (IQR) 19-40 km/h 33-48 km/h 21-40 km/h 26-46 km/h
ax (at collision) Const. Braking Const. Braking Const. Braking Const. Braking Shares (in %) 75 25 50 50 50 50 50 50
Impact sections 11/13 31/12 21/13 21/12 33/12 23/12 13/11 23/11 Shares (in %) 15.7 15.7 13.6 11.4 14.8 13.9 12.2 11.8

Wisch 24
SUMMARY The Intersection 2020 project was initiated to develop a test procedure for Automatic Emergency Braking systems in intersection car-to-car scenarios to be transferred to Euro NCAP. The project aims to address current road traffic accidents on European roads and therefore sets a priority of the identification of the most important car-to-car accidents and Use Cases. In a later stage taking into account technological and practical limitations, Test Scenarios are derived from the Use Cases. This report provides an overview of common car-to-vehicle(at least four wheels) collision types at junctions in Europe, specifies seven Accident Scenarios from which the three scenarios “Straight Crossing Paths (SCP)”, “Left Turn Across Path – Opposite Direction Conflict (LTAP/OD)” and “Left Turn Across Path – Lateral Direction (LTAP/LD)” are most important due to their high frequencies of severe car-to-car accidents. Technical details about crash parameters such as collision and initial speeds are delivered. The analysis work performed is input for the definition and selection of the Use Cases as well as for the project’s benefit estimation. Various accident datasets from Europe have been analyzed. Two major injury severity groups have been investigated: killed and seriously injured (KSI) and killed, seriously and slightly injured (ALL). Most countries in Europe distinguish between intersection layouts; however, the comparability among each other is limited. The lowest common denominator was found in the categorization based on an initiative by the EU. However, although these definitions are widely accepted and applied, only a few countries work accordingly. The numbers of accidents and fatalities in accidents at intersections involving a passenger car were shown per intersection type. In both statistics, it was found that accidents at crossroads and T- or staggered junctions are of highest relevance, followed by roundabouts. Focusing on accidents at intersections between one passenger car and another road user showed that around one-third of all accidents and related fatalities could have been assigned to car-to-PTW accidents and one-fifth of all accidents and fatalities to car-to-car accidents. Regarding severe car-to-car accidents 38% out of 34,489 car-to-car accidents in Europe happened at intersections. These figures correspond to 18% of the fatalities (4,236 fatalities in total). Considering all intersection types, around half of all related accidents happened in urban environments whereas this number decreased to one-third of all fatalities. It has to be noted that the aforementioned proportions of the number of accidents and fatalities per intersection type may reflect rather the frequency of these intersection types in Europe than certain associated risk factors. Further results based on the CARE analysis comprised that the proportion of road fatalities per country occurring at intersections varies widely across the EU and that there are proportionately more fatalities in daylight/twilight. In addition, latest national accident statistics from France, the United Kingdom, Spain and Germany have been analyzed regarding road traffic accidents at intersections. Overall, the results were similar to the ones obtained from the CARE analysis. The shares of accidents in urban areas differed considerably between the countries. Severe car-to-car accidents occurred most often on crossroads and T- or staggered junctions. Contrarily, two-thirds of these accidents were assigned to crossroads in France, but to T- or staggered junctions in the UK and around half of these accidents each to crossroads and T- or staggered junctions in Germany. In Spain, half of the severe accidents occurred on crossroads and one-third on T-or staggered junctions. At roundabouts, severe accidents were similarly proportioned in urban and rural areas. Fatal crashes happened most often in rural areas. Germany uses a different coding of road traffic accidents at intersections. Also, accidents at roundabouts were coded as accidents at intersections until the year 2015. Since 2016, accidents at roundabouts are coded separately in the national statistics. However, to provide possibilities for direct comparisons with other countries different approaches were considered. The most promising approach was found in a work by the Fraunhofer Institute IVI which developed a tool (commissioned by Toyota Motor Europe) being able to distinguish between different intersection types. Relevant results were kindly provided to the Intersection 2020 project. Use Cases are supposed to be derived from Accident Scenarios and by adding detailed information for example about the road layout, right-of-way and the vehicle trajectories prior to the collision. A first attempt to generate a proper list of Use Cases based on the available collision data, using clustering algorithms and having the principal goals of the project in mind failed as the application of the statistical models to the data directed quickly into various issues and uncertainties but also similar results as presented in literature. Further, it became clear that vehicles’ trajectories are important but could not be derived from GIDAS and various parameters (e.g., varying lane width, view obstructions), identified as being meaningful, could not be transferred to any Test Scenario for consumer programs in next years for which reasons a pragmatic approach was finally preferred. The principles of the Use Case analysis are provided for LTAP/OD in this paper. Analogue gained results for
Wisch 25
LTAP/LD and SCP were summarized. Finally, 74 Use Cases were identified. This large number indicates the complexity of intersection crashes due to the combination of several parameters. Regarding the scenario LTAP/OD two main groups were identified as suitable to assign further characteristics: intersections with adjacent lanes used by the accident participants (layout 1 and 2) as well as intersections with an additional lateral offset between the lanes (layout 3). For the first group, which represents approximately 70 % of all LTAP/OD cases, a lateral offset of 3.7 m was identified. The second group has a larger spread of lateral offsets with a median of around 11.5 m. For both groups the turning radii were analyzed, considering also the location of the accident site and road elements such as islands in the exit roadway. However, no significant differences between the several clusters could be identified. To a certain degree, the same applies to the investigated speed profiles with regard to the turning vehicle. Finally, the most relevant impact point combinations for the case groups could be identified, resulting in four crash constellations for layout 1 and 2 and five crash constellations for layout 3. Regarding the LTAP/LD scenario, simplified intersection layouts have been defined resulting in three layouts. The evaluation of approaching angles as well as turning radii showed that the layouts 1 and 2 are quite similar (median turning radius around 25 m). In addition, these two layouts represented 89 % of all LTAP/LD cases. Thus, layout 3 was found to be less relevant. Regarding the speed profiles and accelerations, it could be found that vehicle A is driving with low speed (< 5 km/h) in a significant number of cases (about 15 %) compared to the other scenarios. Accordingly, deceleration was not found being relevant with regard to vehicle A. Looking at vehicle B, constant speed at the time of collision took place in about 34 % of all cases, whereas a braking maneuver was initiated in about 66 % of all cases. The most relevant impact point combinations for the merged layouts 1 and 2 were identified, resulting in four crash constellations. Regarding the SCP scenario, firstly, all SCP cases have been split into two sub-scenarios based on the direction of approach of the prioritized vehicle (from left or right). There were no conspicuous findings with regard to the angle of approach. Thus, test scenarios with an orthogonal orientation of the vehicles during the entire pre-crash phase can be seen as sufficiently representative for the SCP cases. Regarding the initial and collision speeds, no significant differences were identified between the sub-scenarios SCP/L and SCP/R. However, looking at the acceleration at the time of collision, specific characteristics have to be taken into account. Significant shares of vehicles A and B are performing braking manoeuvres in both sub-scenarios. Finally, the most relevant impact point combinations were identified, resulting in four crash constellations for each of the two sub-scenarios. CONCLUSION An analysis of car-to-car accidents at intersections in Europe has been conducted based on various datasets. It has to be noted that there is no clear definition of an intersection in Europe. And although definitions for different intersection types were achieved in a European consortium, only a few countries deal with it in the intended manner. Nevertheless, the data quality was sufficient to generate basic results for different European countries. More specific analyses have been performed using data from the German national accident statistics and the German In-Depth Accident Study (GIDAS). The accident data analysis revealed that three Accident Scenarios are key for further work steps within the Intersection 2020 project (due to their high frequency rates in accidents with severe injury outcome) which are accidents at 1) Straight Crossing Paths (SCP), 2) Left Turn Across Path – Opposite Direction Conflict (LTAP/OD) and 3) Left Turn Across Path – Lateral Direction (LTAP/LD). Most of these accidents occurred under daylight conditions. For each of these Accident Scenarios, basic crash parameters including the cars’ initial and collision speeds were provided supporting the work of selecting appropriate test speeds. The data is also supposed to support the activities around the benefit estimation work in the project. The presented Use Cases are the basis for the development of Test Scenarios considering their relevance, the transferability to the test track, an economic test environment and the expected performance of the systems to be tested. To accelerate the market penetration of innovative junction/crossing autonomous emergency functions in state-of-the-art vehicles the consumer protection organisation Euro NCAP will change the assessment for the year 2020 and launch an assessment for technology that addresses the above listed accident scenarios. As an example the announced “car-to-car front turn across path” (CCFtab) test for 2020 will address the LTAP/OD accident scenario and the test is derived from the Use Cases presented in the core of this work. An assessment that addresses the remaining Accident Scenarios is strongly considered or even already announced.
Wisch 26
REFERENCES [1] European Road Safety Observatory, “Roads,” www.erso.eu, 2006. [2] T. Neuman, R. Pfefer, K. Slack, K. Kennedy, D. Harwood, I. Potts, D. Torbic and E. Kohlman, Guidance
for implementation of the AASHTO Strategic Highway Safety Plan - Volume 5: A Guidance for Addressing Unsignalized intersections Collisions, vol. NCHRP Report 500, Transportation Research Board, 2003.
[3] Transport Department, “Design Manual for Roads and Bridges - Geometric Design of Major/Minor Priority Junctions,” London, 1995.
[4] N. Antonucci, K. Kennedy, K. Slack, R. Pfefer and T. Neuman, Guidance for implementation of the AASHTO Strategic Highway Safety Plan - Volume 5: A Guidance for Reducing Collisions at Signalized Intersections, NCHRP Report 500, Transportation Research Board, 2003.
[5] TRL Transport Research Laboratory, “Laboratory Report 1120: Accidents at 4-arm roundabouts,” 1984. [6] D. O'Cinneide och R. Troutbek, ”At-grade intersections/worldwide review,” i Transportation Research
Circular - International Symposium on Highway Geometric Design Practices, Boston, 1998. [7] R. Elvik and T. Vaa, “The Handbook of Road Safety Measures,” Elsevier, 2004. [8] A. Montella, “Identifying crash contributory factors at urban roundabouts and using association rules to
explore their relationships to different crash types,” Accident Analysis and Prevention 43, pp. 1451-1463, 2011.
[9] M. Simon, T. Hermitte and Y. Page, “Intersection Road Accident Causation: A European View,” in Study was part of the European TRACE project, Enhanced Safety of Vehicles Conference Proceedings, 2009, pp. Paper No. 09-0370.
[10] European Commission, “Traffic Safety Basic Facts on Junctions,” Directorate General for Transport, 2015. [11] P. Nitsche, P. Thomas, R. Stuetz and R. Welsh, “Pre-crash scenarios at road junctions: A clustering method
for car crash data,” Accident Analysis and Prevention 107, pp. 137-151, 2017. [12] U. Sander and N. Lubbe, “The potential of clustering methods to define intersection test scenarios:
Assessing real-life performance of AEB,” Accident Analysis and Prevention 113, pp. 1-11, 2018. [13] H. Feifel and M. Wagner, “Harmonized Scenarios for the Evaluation of Active Safety Systems based on In-
Depth-Accident Data,” in Proceedings of the Expert Symposium on Accident Research (ESAR), Hanover, 2018.
[14] German Insurance Association (GDV), Accident Types Catalogue 2016, Berlin, 2016. [15] CARE Database, “CaDaS - Common Accident Data Set,” vol. Version 3.4, 2015. [16] Statistisches Bundesamt (Destatis), “Verkehrsunfälle 2016,” vol. Fachserie 8 Reihe 7, 2017. [17] US Department of Transport, “Analysis of Crossing Path Crashes,” DOT HS 809 423 Final Report, DOT-
VNTSC-NHTSA-01-03, 2001. [18] M. McCarthy, H. Fagerlind, I. Heinig, T. Langner, S. Heinrich, L. Sulzberger and S. Schaub, “Deliverable
1.1 - Preliminary Test Scenarios,” European Commission - FP7 project ASSESS, 2011. [19] Forschungsgesellschaft für Straßen- und Verkehrswesen (FGSV), Arbeitsgruppe Straßenentwurf,
“Richtlinien für die Anlage von Landstraßen (RAL) - Ausgabe 2012,” FGSV Verlag, Köln, 2013. [20] A. Wesp, Analyse fahrerwirksamer Systemauslegungen und -störungen eines Fahrzeugs mit
Hinterradlenkung bei gleichzeitiger Fahrerbeanspruchung durch eine Fahraufgabe, TU Darmstadt: Dissertation, 2010.
[21] A. Neukum, E. Ufer, J. Paulig and H. Krüger, “Controllability of Superposition Steering System Failures,” in Steering.Tech, Garching (Germany), 2008.
[22] J. E. Bakaba and J. Ortlepp, “Sichere Knotenpunkte für schwächere Verkehrsteilnehmer (“Design of safe intersections for vulnerable road users“),” in Forschungsbericht Nr. 23, Berlin, Gesamtverband der Deutschen Versicherungswirtschaft e.V. (GDV) - Unfallforschung der Versicherer, 2014.
[23] C. Flannagan, A. Bálint, K. Klinich, U. Sander, M. Manary, S. Cuny, M. McCarthy, V. Phan, C. Wallbank, P. Green, B. Sui, A. Forsman and H. Fagerlind, “Comparing Motor-vehicle Crash Risk of EU and US Vehicles,” University of Michigan, UMTRI, 2015.
[24] U. Sander, “Opportunities and limitations for intersection collision intervention - A study of real world 'left turn across path' accidents,” Accident Analysis and Prevention 99, pp. 342-355, 2017.
[25] J. Sandin, “Analysis of intersection crash statistics to define pre-crash test scenarios for detection sensors,” in SAFER Report Project Scenariobased testing of pre-crash systems, Gothenburg, SAFER - Vehicle and Traffic Safety Centre at Chalmers, 2009.
Wisch 27
APPENDIX Assignment of accident types [14] to Accident Scenarios LTAP/OD
LTAP/LD
LTIP
RTIP
SCP
P/R
NA (Selection)