The effects of car access on employment outcomes for welfare recipients
Car Access andEmploymentOutcomes
for TennesseeWelfare Recipients
Center for Business and Economic ResearchCollege of Business Administration
The University of Tennessee100 Glocker Building
1000 Volunteer BoulevardKnoxville, TN 37996
Phone: (865) 974-5441Fax: (865) 974-3100
http://cber.bus.utk.edu
June 2004
Tami Richardsand
Donald Bruce
Center for Business andEconomic Research
A Report to the Tennessee Department of Human Services
This project is funded under an agreement with the Tennessee Department of Human Services. The viewsencompassed in this research do not necessarily reflect the views of the Tennessee Department of Human Services.
We thank Angela Thacker for assistance with the data, and participants at the 2003 Conference of the NationalAssociation for Welfare Research and Statistics and the University of Tennessee Economics Brown Bag Workshop forinsightful comments on earlier drafts.
Center for Business and Economic Research Staff
William F. Fox, DirectorMatthew N. Murray, Associate Director and Project Director
Donald J. Bruce, Research Assistant Professor
Research AssociatesVickie Cunningham
Julie MarshallJoan Snoderly
Angela ThackerBetty Vickers
Support StaffStacia Couch, Publications Specialist
Betty Drinnen, Program Resource Specialist
Graduate Research AssistantsKarie BarbourJohn Deskins
Brian HillTami RichardsMegan WatsonLydia Zhang
Page 1Center for Business and Economic Research
Car Access and Employment Outcomes for Tennessee Welfare Recipients
Executive Summary
Work requirements imposed on American welfare recipients in 1996 brought a substantial policy andspending shift toward support services. Requiring participants to work meant devoting resources to eliminatingthe most significant barriers to employment. Participants and administrators have consistently identified trans-portation as one of the most important barriers to obtaining and maintaining employment. A growing literaturecontinues to explore whether private automobile ownership improves employment outcomes for welfare recipi-ents. We contribute to the discussion by focusing on car access instead of ownership, accounting for urban andrural differences, controlling for the simultaneity of car access and employment outcomes, and examining em-ployment as well as hours worked and hourly wages.
Our results are broadly consistent with those in the prior literature. Our analysis of unemployed Wave 1program participants reveals that those who had car access in the first Wave of the survey are less likely toremain unemployed and on the program and much more likely to become employed and leave the program as ofWave 4 (18-24 months later). Among the subset of unemployed Wave 1 program participants who had workrequirements, those who had access to a car in Wave 1 are dramatically less likely to remain unemployed andleave the program as of Wave 4. Results are similar in spirit for employed Wave 1 program participants, regard-less of work requirement status. For this group, having access to a car in Wave 1 reduces the probability ofbecoming unemployed while remaining on the program and increases the likelihood of remaining employed butleaving the program.
While car access does not seem to be an important determinant of work hours for broader samples, we dofind that gaining access to a car between Waves 1 and 3 increases Wave 4 work hours by nearly 9 hours amongWave 1 program participants with work requirements. Car access also seems to enable respondents to findbetter-paying jobs. Wave 4 wages were $0.70 to $2.06 higher for those who had car access in Wave 1. All ofthese results suggest that car access is important to the labor market success of low-income households generallyand welfare recipients more specifically.
Page 2 Center for Business and Economic Research
Car Access and Employment Outcomes for Tennessee Welfare Recipients
1. Introduction
The imposition of work requirements in 1996 as part of the shift from Aid to Families with DependentChildren (AFDC) to Temporary Assistance for Needy Families (TANF) marked a major change in U.S. welfarepolicy and prompted states to take a broader approach to welfare assistance. Requiring participants to workmeant not only providing cash assistance but also identifying and removing barriers to employment. This broaderapproach was evidenced by both a change in policy and a shift toward more spending on support services andless emphasis on cash benefits. The primary goal of support services is to remove barriers to work by providingsuch things as transportation, childcare, dental, and optical assistance.
Among barriers to work, participants consistently identify transportation as a significant problem. Conse-quently, many states provide some form of reimbursement, shuttle, or public transportation to work-relatedactivities. States also permit asset exemptions (for the purposes of calculating eligibility and benefit level) eitherfor one entire vehicle or for a set value amount. Researchers have argued that car ownership allows for jobsearch in a broader area, increased reliability on the job, and shorter commute times that translate into higheremployment rates. The recent literature has provided evidence that car ownership does indeed increase theprobability of being employed.
However, previous studies suffer from a few key limitations that are potentially important to policy makers.First, they do not always adequately account for the simultaneity of car ownership and employment (i.e., the ideathat correlation between car ownership and employment might not indicate causation). They also have not fullyconsidered the important differences across urban and rural populations. Finally, they have focused almostexclusively on car ownership rather than access. We address each of these, while also improving upon estima-tion methods and making use of more diverse data, in order to provide a more accurate account of the effects ofcar access on employment outcomes. Our intent is to inform the policy debate over the relative merits ofpersonal vehicle support programs.
We rely on a unique panel of individual survey data from the state of Tennessee in our analysis. Tennessee’slow-income cash assistance program, Families First (FF), operates under a waiver from U.S. federal guidelines.Significant features include stricter, more immediate work requirements (40 hours upon entry into the program),shorter interim time limits (18 months at a time followed by three months of ineligibility), and a generous arrayof non-cash support services (including an allowance of up to 20 hours of the weekly work requirement foreducation and training activities).1
An examination of Tennessee data is useful for a number of reasons. First, Tennessee has recognized theimportance of automobile access for welfare recipients. In addition to a standard vehicle asset exemption amount,their unique benefit program, First Wheels, provides zero-interest loans for the purchase of a used automobilefor program participants and for leavers up to 12 months after cash assistance payments end. Second, Tennessee’sgeneral welfare policies closely resemble those currently being proposed for implementation at the nationallevel. Third, Tennessee data enable a more complete treatment of urban-rural differences. While most FFrecipients live in urban areas, a significant minority are spread across the many rural counties in the state.
1 For more details, see Center for Business and Economic Research (2000).
Page 3Center for Business and Economic Research
Car Access and Employment Outcomes for Tennessee Welfare Recipients
2. Why Car Access, and How Is It Promoted?
Proponents argue that the lack of transportation places welfare recipients and the working poor at a disad-vantage for several reasons. They note the “spatial mismatch” between rural and inner-city residents and suburbanemployment opportunities.2 Personal vehicles might therefore allow for a broader job search, generally morereliable transportation, shorter commute times, and the ability to work during hours not supported by the masstransit system. Additional trips to day care providers and retailers are also less complicated with a personalautomobile. Supporters also note that inner-city car ownership can lead to entrepreneurship as those with carsshuttle neighbors on the way to jobs.3 Car ownership might also provide secondary benefits in the form ofgreater self-confidence and stronger credit ratings.4
Those opposed to promoting car ownership also raise compelling arguments. First, the cars available towelfare recipients and the working poor are generally older with higher mileage. This problem is exacerbated bypolicies that provide an asset exemption for a set value amount. Older vehicles are costlier to maintain and emitmore air pollutants than their newer counterparts.5 Further, personal vehicle promotion strategies can also leadto increased congestion, especially in urban areas.
Despite these arguments, several states have adopted measures to facilitate car access or ownership amongcurrent and former welfare recipients. Table 1 presents a comparison of Tennessee’s transportation-relatedbenefits with its eight neighboring states. All of these states permit an asset exemption, ranging from a low of$1,500 in Mississippi to a high of the value of one vehicle in several states. In addition to asset exemptions andthe other programs listed in Table 1, a number of other unique transportation benefit programs can be found inthe U.S. As noted above, Tennessee’s First Wheels program provides zero-interest loans for the purchase of apre-owned automobile. Wisconsin and Michigan also offer low interest loans while Texas, Maryland, andColorado operate in conjunction with nonprofit car donation programs. Virginia and Ohio allow the purchaseand resale of government vehicles. New York provides participants with mechanical training and then allowsthem to purchase cars they have re-conditioned.
Given that promoting car ownership has already become an important policy goal for many states, under-standing the impacts of these programs on employment outcomes is vital to recognizing whether the statedobjectives—namely increased employment rates—are likely to be met. Following a review of the prior litera-ture in Section 3, we turn to a discussion of our data and methods in Section 4. Section 5 presents results, andSection 6 concludes.
2 For more discussion, see Ihlanfeldt and Sjoquist (1998), Preston and McLafferty (1999), or Blumenberg and Waller (2003).3 See Davis and Johnson (1984), and Cervero (1997).4 Research in this area is sparse and focuses on loan or lease default rates. A study of five programs places the default rate between 2 and 7percent and as high as 17 percent when additional criteria are considered, such as maintaining employment for the duration of the paymentperiod (Port JOBS, 2001).5 Older vehicles are subject to less stringent emission standards, and emission control systems deteriorate over time. For more discussion,see Barbour (2003).

Page 4 Center for Business and Economic Research
Car Access and Employment Outcomes for Tennessee Welfare Recipients
Table 1: Transportation Benefits in Tennessee and Neighboring States
State Vehicle Asset Limit Reimbursement Bus Passes Repair Allowance Other
Alabama Value of one vehicle $32 per month X County specific solutions in rural areas.
Arkansas Value of one vehicle X X County specific solutions.
Georgia $4,650 State: $3 per day
County: $25 per
month
X X
Kentucky Value of one vehicle X Up to $300 per year. Regional providers and districts provide
payment and coordinate transportation.
Mississippi $1,500 $.20 per mile up to $8
per day
X
Missouri Value of one vehicle $5 per day
North Carolina $5,000 Allowances
determined at local
level.
Tennessee* $4,600 $6 per day** X X Up to $800 per year.
Virginia $7,500 No specific limit or
cap.
Benefits paid from overall work program
allocation.
Source (except Tennessee): Maiers, Paul. "June, 1999 Transportation in Welfare Reform." Office of Family Assistance.
*Source (Tennessee): Tennessee Department of Human Services. "Families First Handbook" 2000.
Reimbursement rate reduced to $4 per day as of July 1, 2003.

Page 5Center for Business and Economic Research
Car Access and Employment Outcomes for Tennessee Welfare Recipients
The primary objective of TANF is to encourage self-sufficiency among recipients. Employment has beenidentified as a means to this end, which makes identifying and removing barriers to employment a key concern.Program participants and administrators consistently identify transportation as an important barrier to employ-ment.6 Reasons for the transportation difficulties are well documented. Welfare recipients often live withininner-city areas which are frequently isolated from suburban jobs, and they are often poorly qualified for jobs inthe central business district.7 Transportation also affects the job-search area, as many entry-level positionsrequire applying in person for face-to-face interviews.8
Transportation difficulties among current and former Tennessee welfare recipients are consistent with therecent literature. A 2002 study of welfare leavers found that 6.5 percent of unemployed leavers identified lackof adequate transportation as prohibiting employment (Perkins and Homer, 2002). Consistent with “spatialmismatch,” leavers in urban counties reported transportation difficulties more often than those in rural counties.Lack of a reliable car and limited public transportation were the concerns most often reported by welfare recipi-ents; again the transportation problems were more common for urban residents (Social Work Office of Researchand Public Service, 2003).
A number of studies have examined the effects of labor market conditions on welfare dynamics. Blumenbergand Ong (1998) examine access to low-wage jobs and find that those who live in areas of greater job concentra-tion are less likely to be on welfare. However, even among those living in job-rich areas, most work outside oftheir immediate living area. This study, along with others discussed below, makes use of data from urbanCalifornia. Consequently, its applicability for policy makers in other areas may be somewhat limited.
Given the above, one would expect that improved transportation might increase employment levels. Cervero,Sandoval, and Landis (2002) find that among forms of transportation, private and public, private mobility ismost effective in moving participants from welfare to work. Data limitations in their work, including a rathersmall sample size, the use of pre-TANF data, and a focus on urban California residents, indicate that findingsmay not apply in other areas and more recent time periods.9 However, the general association of car ownershipand improved employment levels has been consistently established elsewhere in the literature.10
3. Prior Research
6 See Blumenberg and Ong (1999), Cox, et al. (2000), Ebener and Klerman (1999), Fein, et al. (1998), Iowa Department of HumanServices (2002), Julnes and Halter (2000), Owen, et al. (2000), and Social Research Institute (1999) for empirical evidence.7 For more discussion, see Bania, Coulton, and Leete (1999), Holzer (1999), Rich (1999), Kain (1992), and Kasarda (1980).8 See Henly (1999), and Ong and McConville (2001).9 Cevero, Sandoval, and Landis (2002) use a multinomial logit to estimate AFDC and employment transitions. Their Alameda County,California sample consists of two points in time and 466 individuals of which only 66, or about 7 percent, transition into employment.10 See Ong (1996), Blumenberg and Waller (2003), and the references therein. Ong’s sample included four counties and consisted of 1,112observations from 1993-1994 AFDC-FC recipients. Owning a car increased employment by 12 percentage points, monthly hours by 23,and monthly earnings by $152.
Page 6 Center for Business and Economic Research
Car Access and Employment Outcomes for Tennessee Welfare Recipients
Several studies have proceeded beyond association to causality. These studies control for the simultaneityof the car ownership/employment decision either by using the instrumental variable approach or panel data.Again, the evidence is largely consistent with car ownership accounting for higher levels of employment (Raphaeland Stoll, 2000; Raphael and Rice, 2002; Ong, 2002; Cervero, Sandoval and Landis, 2002). Differences in carownership rates have been shown to account for a portion of inter-racial employment gaps, including 43 percentof the black-white differential (Raphael and Stoll, 2000). Evidence also suggests that car ownership increaseshours worked (Ong, 1996; Raphael and Rice, 2002). Raphael and Rice (2002) find a negative relationshipbetween hourly wage rates and car ownership. However, failure to control for urban and rural differences maybe driving this result as those in rural areas are more likely to own cars and to work for lower wages.
We extend the literature in a variety of ways. First, we use a transition analysis similar to that of Cervero,Sandoval, and Landis (2002) along with panel data to account for the possibility that being employed leads to carownership or access. This approach overcomes the difficulties of finding appropriate instrumental variables.11
In addition, instead of measuring car ownership, our data provide a proxy for car access (study participants wereasked whether anyone in their household owned a vehicle). This distinction is potentially important as house-hold members are likely to share use of a vehicle, making access more relevant than ownership when consideringemployment benefits.
Further, earlier work either did not control for urban and rural differences or relied on a primarily urbansample. Ong (2002), and Cervero, Sandoval, and Landis (2002) use data from urban areas of Los Angeles andAlameda Counties in California, respectively. Raphael and Rice (2002) and Raphael and Stoll (2002) usenational Survey of Income and Program Participation (SIPP) data, however, the former study does not controlfor urban and rural differences, and the latter focuses exclusively on 242 metropolitan areas. Our data includeboth urban and rural residents from across the state of Tennessee. This distinction is important to state policymakers as differences in transportation needs and employment opportunities affect the potential benefits of awide-scale personal vehicle promotion program.
While there is strong and consistent evidence that car ownership improves the probability of being em-ployed, the effects of car ownership on hours and wages are sparsely documented. Our analysis explores eachof these employment outcomes. Finally, our rich survey data permit a comparison of different samples: allsurvey respondents (including those who had recently left the welfare rolls), those who were program partici-pants at the time of the survey, and the subset of program participants for whom a work requirement was ineffect.12
11 Raphael and Stoll (2000), Raphael and Rice (2002), and Ong (2002) use an instrumental variable approach to overcome the simultaneityproblem.12 There is evidence that evaluating low-income households separately is appropriate for policy questions as it has been shown that poorhouseholds respond differently to factors influencing automobile ownership (Gardenhire and Sermons, 1998).
Page 7Center for Business and Economic Research
Car Access and Employment Outcomes for Tennessee Welfare Recipients
4. Data and Estimation Procedure
Data for this analysis are taken from the first four Waves of the Family Assistance Longitudinal Study(FALS).13 The respondents include a large sample of individuals who were on Tennessee’s welfare program,Families First, as of January 2001. Maximum sample sizes are 1,935, 1,474, and 1,810, and 1,919 for each ofthe four Waves.14
We exploit the panel nature of the FALS data in order to control for the simultaneity of car access andemployment. Specifically, we estimate the effects of car access in one Wave of the survey on employment (andprogram participation) in a subsequent Wave. Due to the larger sample sizes in Waves 1 and 4 of the survey andthe length of time (18 to 24 months) between these two Waves, these two endpoints are selected for the analysis.While this approach does not completely control for simultaneity, experimentation with alternative estimationtechniques led us to prefer it over less reliable instrumental variables approaches.15
Multinomial logits are used to estimate the effects of Wave 1 explanatory variables (including demograph-ics) on the probabilities of making transitions from being on FF in Wave 1 to being in one of four employmentand FF participation categories as of the Wave 4 survey.16 These categories are unemployed/on FF, unem-ployed/off FF, employed/on FF, and employed/off FF. Separate multinomial logits are estimated for those whowere unemployed and those who were employed in Wave 1. This approach allows us to assess the impact of caraccess on transitions off welfare and into employment. In addition to the multinomial logit transition analysis,Heckman selection regressions are estimated to evaluate the effects of car access and other factors on hoursworked per week and average hourly wages.
Following Cervero, Sandoval and Landis (2002), we include three variables to measure car access. Thefirst indicates whether the participant had access to a car in Wave 1. The remaining two variables account for theeffects of gaining or losing access to a car between Waves 1 and 3.
We include a variety of control variables in all multivariate models. The age of the survey respondent isentered in quadratic form. Education variables consist of dummies for less than or more than high school, withhigh school graduate (and nothing more) as the reference category. We also include three dummies for partici-pation in GED courses, vocational training, and Fresh Start (a program that provides basic job market survivalskills). In models that are not restricted to participants with work requirements, we control for work requirementstatus with an additional dummy variable. Marital status enters in the form of dummies for divorced (includingmarried but separated) and committed (including married, engaged, or living together), with single being the
13 The FALS is an ongoing collaborative effort of the Tennessee Department of Human Services, the Bureau of Business and EconomicResearch/Center for Manpower Studies at the University of Memphis, and the Social Work Office of Research and Public Service, theCenter for Literacy Studies, and the Center for Business and Economic Research, all at the University of Tennessee in Knoxville. As of thiswriting, the fifth Wave was entering the field.14 Observations from two over-sampled groups (those referred to or participating in Adult Basic Education or Family Services Counseling)are omitted from our analysis. While a direct analysis of First Wheels participants would be useful, sample sizes of First Wheelsparticipants in the FALS data are unfortunately too small.15 We experimented with county-level instruments using such things as automobile insurance costs and local vehicle taxes, but all of ourchosen instruments turned out to be quite weak.16 See Green (2003, pages 720-723) for more information on multinomial logit models.
Page 8 Center for Business and Economic Research
Car Access and Employment Outcomes for Tennessee Welfare Recipients
reference category. We control for race using a series of three indicators for White, Hispanic, and other race,with Black serving as the reference category. We also include the number of non-caretaker adults in the house-hold, the dollar amount of spouse’s earnings, and a dummy for whether child care was being provided by one ofthe child’s parents as control variables.17 Region-level controls consist of county population density, a dummyfor residence in one of the four major urban counties, and the county’s unemployment rate at the time of thesurvey.18
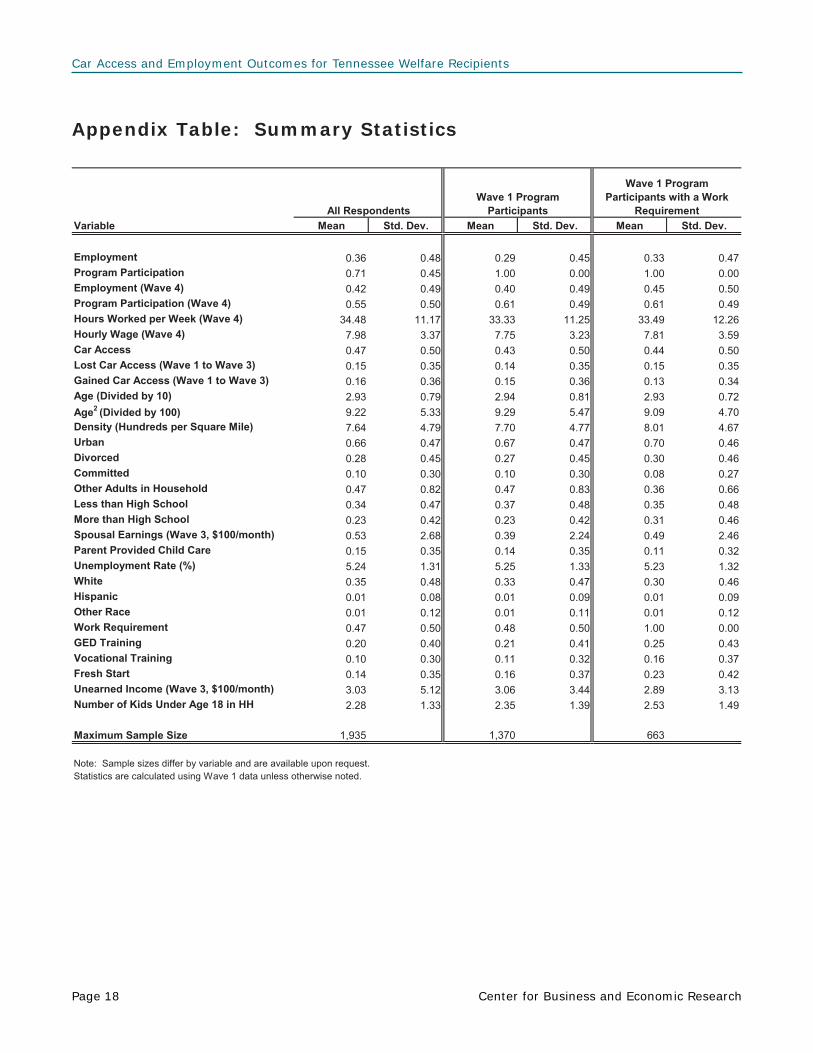
Summary statistics for all variables used in the analysis can be found in the Appendix Table. To highlighta few of the key variables, we first note that 36 percent of all respondents were employed as of Wave 1. This rateincreases to 42 percent as of Wave 4. The Wave 1 employment rate among FF participants was slightly lower at29 percent, while about one-third of those FF participants with work requirements were employed. Employmentrates as of Wave 4 rose to 40 and 45 percent for these two sub-samples, respectively. Nearly three-quarters of theWave 1 respondents were participating in FF at the time of the Wave 1 survey, a participation rate that falls to 55percent in Wave 4. Average weekly hours of work in Wave 4 ranged from 33 to 35 for the three groups, whilehourly wages were on the order of $7.75 to $8.00. Nearly half of the respondents reported having access to a carin Wave 1 (43 percent of FF participants and 44 percent of FF participants with work requirements). Roughly 30percent either lost or gained access to a car between Waves 1 and 3.
17 Due to data inavailability in earlier Waves, spouse’s earnings are taken from the Wave 3 data.18 Unemployment for June of 2002 was collected from the Bureau of Labor Statistics. Population and land area data are from the U.S.Census Bureau, 2000 Census (http://factfinder.census.gov/servlet/BasicFactsServlet). The four urban counties (and the cities they contain)are Shelby (Memphis), Davidson (Nashville), Hamilton (Chattanooga), and Knox (Knoxville). These counties account for nearly two-thirds of Tennessee’s welfare caseload.
Page 9Center for Business and Economic Research
Car Access and Employment Outcomes for Tennessee Welfare Recipients
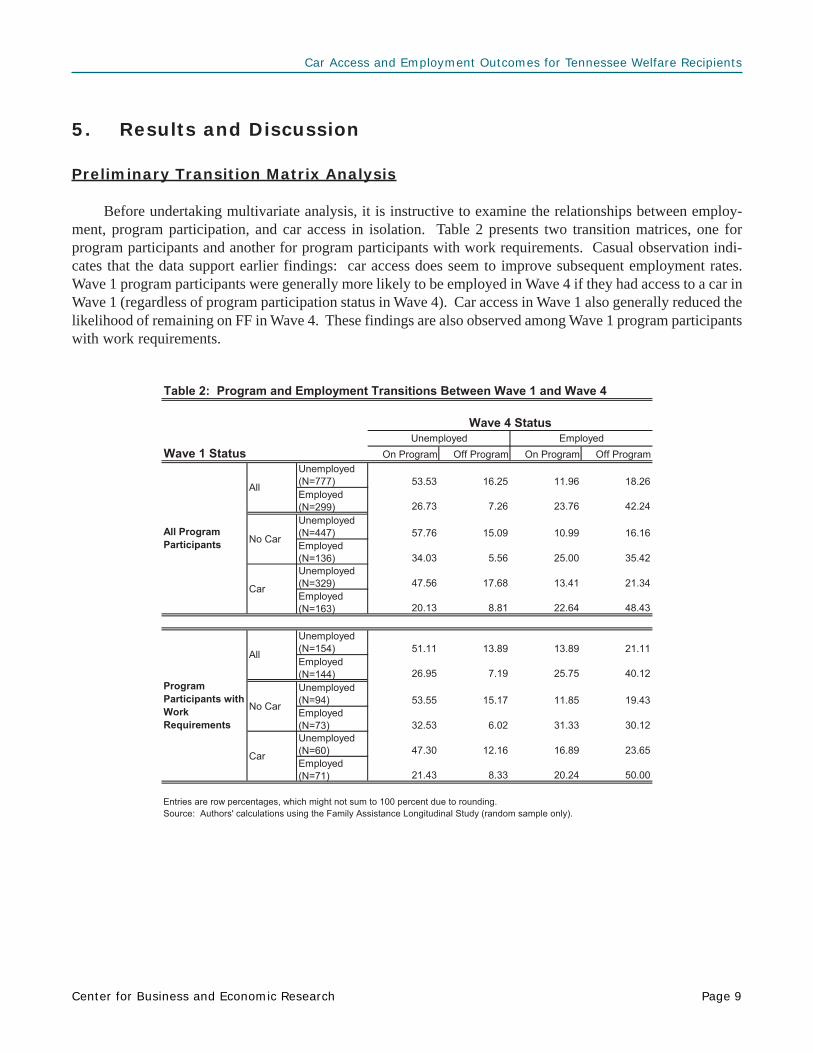
Table 2: Program and Employment Transitions Between Wave 1 and Wave 4
On Program Off Program On Program Off Program
Unemployed
(N=777) 53.53 16.25 11.96 18.26
Employed
(N=299) 26.73 7.26 23.76 42.24
Unemployed
(N=447) 57.76 15.09 10.99 16.16
Employed
(N=136) 34.03 5.56 25.00 35.42
Unemployed
(N=329) 47.56 17.68 13.41 21.34
Employed
(N=163) 20.13 8.81 22.64 48.43
Unemployed
(N=154) 51.11 13.89 13.89 21.11
Employed
(N=144) 26.95 7.19 25.75 40.12
Unemployed
(N=94) 53.55 15.17 11.85 19.43
Employed
(N=73) 32.53 6.02 31.33 30.12
Unemployed
(N=60) 47.30 12.16 16.89 23.65
Employed
(N=71) 21.43 8.33 20.24 50.00
Entries are row percentages, which might not sum to 100 percent due to rounding.
Source: Authors' calculations using the Family Assistance Longitudinal Study (random sample only).
Program
Participants with
Work
Requirements
All Program
Participants
All
No Car
Car
All
No Car
Car
Wave 4 StatusEmployedUnemployed
Wave 1 Status
Preliminary Transition Matrix Analysis
Before undertaking multivariate analysis, it is instructive to examine the relationships between employ-ment, program participation, and car access in isolation. Table 2 presents two transition matrices, one forprogram participants and another for program participants with work requirements. Casual observation indi-cates that the data support earlier findings: car access does seem to improve subsequent employment rates.Wave 1 program participants were generally more likely to be employed in Wave 4 if they had access to a car inWave 1 (regardless of program participation status in Wave 4). Car access in Wave 1 also generally reduced thelikelihood of remaining on FF in Wave 4. These findings are also observed among Wave 1 program participantswith work requirements.
5. Results and Discussion
Page 10 Center for Business and Economic Research
Car Access and Employment Outcomes for Tennessee Welfare Recipients
Multivariate Analysis of Employment and Program Participation
Table 3 presents results of the multinomial logit analysis for those on the program and unemployed in Wave1. The first four columns of numbers represent marginal effects on the probability of being in each of the fourcategories given a one-unit change in each explanatory variable, holding all other variables constant at theirmean values.19 The last four columns present results for a sub-sample of the first group—unemployed programparticipants with a work requirement in Wave 1.
To interpret the results in this table, consider the marginal effects associated with the car access variables inthe model. Among these unemployed program participants, having car access in Wave 1 decreases the probabil-ity of remaining unemployed and on FF by 9.78 percentage points (or about 16 percent, given that the overallprobability of this outcome is 62.64 percent). The increase in the probability of becoming employed and leavingthe program is quite substantial, at 7.96 percentage points or about 59 percent. Car access, including gaining orlosing a car between Waves 1 and 3, has no statistically significant effects on the other two transitions among thegroup of all program participants. Note that this result pertains to all FF participants, including those who areexempt from work requirements (many of whom are not able to work).
To investigate the effects of car access on those who may be most likely to benefit from it, we repeat theanalysis for those FF participants with work requirements (columns 5 through 7 of Table 3). There are twostatistically significant effects of car access among this sub-sample. Access to a car in Wave 1 dramaticallyreduces the probability of remaining unemployed but moving off the program (by 10.91 percentage points, orabout 69 percent). Gaining car access between Waves 1 and 3 of the survey increases the probability of becom-ing employed and leaving the program by 20.56 percentage points or over 100 percent.
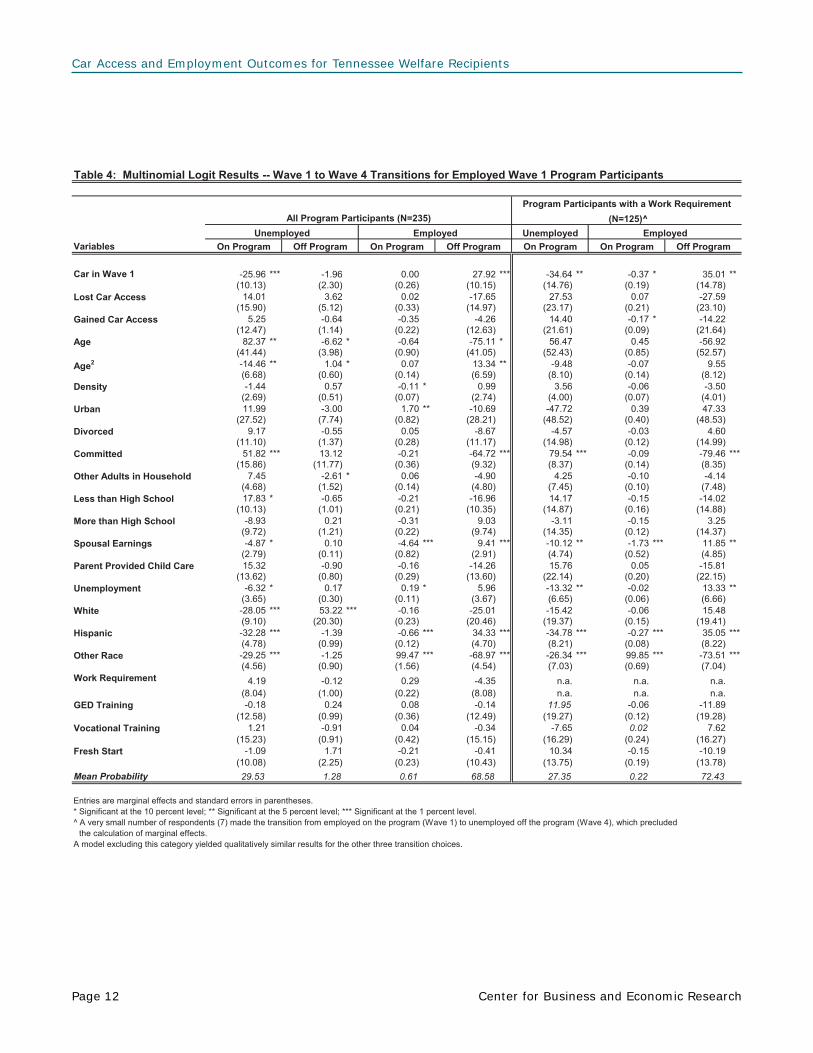
The analysis in Table 3 was duplicated for those who were on the program and employed in Wave 1, andresults are presented in the same format in Table 4. Among all employed program participants in Wave 1, havingaccess to a car in Wave 1 reduced the probability of becoming unemployed while remaining on the program by25.96 percentage points (88 percent) and increased the probability of remaining employed but leaving the pro-gram by 27.92 percentage points (41 percent). Restricting the analysis to employed Wave 1 program participantswith work requirements, we find similar but larger effects. Overall, the results are consistent and indicate largeand significant benefits from car access in encouraging self-sufficiency through employment.
19 For dummy variables, the marginal effect represents the change in the particular probability given a change in the dummy variable from 0to 1.

Page 11Center for Business and Economic Research
Car Access and Employment Outcomes for Tennessee Welfare Recipients
Table 3: Multinomial Logit Results -- Wave 1 to Wave 4 Transitions for Unemployed Wave 1 Program Participants
Variables
Car in Wave 1 -9.78 * -1.40 3.22 7.96 * 0.68 -10.91 * 10.23
(5.88) (4.20) (2.99) (4.12) (8.95) (6.47) (7.28)
Lost Car Access 4.73 -6.74 1.63 0.38 -4.82 -1.48 6.30
(6.84) (4.86) (3.48) (4.27) (12.13) (10.17) (10.08)
Gained Car Access -5.88 -1.17 0.15 6.90 -16.18 -4.39 20.56 *
(6.43) (4.71) (3.12) (4.95) (11.49) (5.96) (10.75)
Age -20.01 -8.93 23.41 ** 5.53 14.06 -2.28 -11.79
(18.88) (10.96) (10.69) (17.01) (28.74) (20.71) (24.78)
Age2 4.09 1.88 -4.40 *** -1.57 -1.71 0.95 0.76
(2.91) (1.57) (1.67) (2.78) (4.41) (3.12) (3.90)
Density 0.22 0.15 -0.73 0.36 -0.57 1.83 -1.27
(1.29) (1.08) (0.54) (0.79) (2.46) (2.29) (1.56)
Urban -2.02 -3.81 9.62 ** -3.79 21.50 -31.14 9.64
(13.67) (11.65) (4.39) (8.91) (30.72) (33.44) (13.87)
Divorced -2.24 5.47 -0.27 -2.97 -3.71 -3.13 6.84
(6.16) (5.27) (2.81) (3.35) (9.56) (6.74) (7.54)
Committed 1.34 1.95 -1.72 -1.57 18.33 * -11.23 * -7.09
(8.50) (6.33) (3.71) (4.99) (10.06) (6.16) (8.34)
Other Adults in Household -2.93 3.53 ** -1.11 0.52 -3.90 2.48 1.42
(2.39) (1.43) (1.65) (1.70) (4.58) (3.08) (3.69)
Less than High School 13.53 *** -3.76 -0.31 -9.46 *** 11.29 1.32 -12.61 **
(4.59) (3.39) (2.31) (2.84) (7.96) (6.49) (5.36)
More than High School 2.35 -7.11 * 1.30 3.46 -3.97 -1.03 5.00
(5.84) (4.09) (2.76) (3.69) (8.57) (6.68) (6.19)
Spousal Earnings -3.74 ** 3.03 *** -0.53 1.24 -5.10 ** 3.59 *** 1.54
(1.90) (0.87) (0.90) (0.81) (2.24) (1.34) (1.31)
Parent Provided Child Care 10.77 ** -5.56 -2.96 -2.26 -13.66 0.33 13.33
(5.47) (3.96) (2.35) (3.53) (12.49) (9.02) (10.78)
Unemployment -0.81 0.46 0.40 -0.06 -3.34 1.08 2.26
(1.78) (1.19) (0.85) (1.05) (2.96) (2.25) (1.79)
White -13.65 ** 8.39 0.27 4.99 -7.19 2.93 4.25
(6.42) (5.21) (3.13) (3.99) (8.91) (6.83) (6.89)
Hispanic -0.53 28.53 -10.47 *** -17.53 *** -39.89 62.04 ** -22.15 ***
(23.58) (23.55) (1.76) (1.95) (25.42) (25.49) (3.38)
Other Race -28.69 ** 12.25 3.69 12.75 -43.86 ** 11.23 32.62
(13.87) (15.97) (9.26) (13.19) (21.12) (19.55) (22.27)
Work Requirement -6.01 0.44 2.14 3.43 n.a. n.a. n.a.
(4.48) (3.48) (2.01) (2.83) n.a. n.a. n.a.
GED Training 1.81 3.14 -0.80 -4.16 2.77968 4.74 -7.52
(5.02) (4.21) (2.21) (2.91) (7.53) (6.41) (5.49)
Vocational Training 7.37 -1.29 -3.00 -3.08 2.63 -0.87 -1.75
(6.52) (5.55) (2.33) (3.28) (8.47) (6.72) (5.63)
Fresh Start -1.78 -1.40 2.58 0.61 4.13 -10.94 ** 6.81
(5.99) (4.68) (2.98) (3.78) (7.81) (5.12) (6.74)
Mean Probability 62.64 15.98 7.98 13.40 66.81 15.92 17.27
Entries are marginal effects and standard errors in parentheses.
* Significant at the 10 percent level; ** Significant at the 5 percent level; *** Significant at the 1 percent level.
^The probability of transitioning from unemployed on the program (Wave 1) to employed on the program (Wave 4) was .0014 percent precluding the calculation of meaningful marginal effects. Results are available upon request.
Program Participants with a Work Requirement
EmployedEmployed
Off Program
UnemployedUnemployed
(N=283)^All Program Participants (N=611)
On Program Off ProgramOn Program Off Program On Program On Program
Page 12 Center for Business and Economic Research
Car Access and Employment Outcomes for Tennessee Welfare Recipients
Table 4: Multinomial Logit Results -- Wave 1 to Wave 4 Transitions for Employed Wave 1 Program Participants
Variables
-25.96 *** -1.96 0.00 27.92 *** -34.64 ** -0.37 * 35.01 **(10.13) (2.30) (0.26) (10.15) (14.76) (0.19) (14.78)
14.01 3.62 0.02 -17.65 27.53 0.07 -27.59(15.90) (5.12) (0.33) (14.97) (23.17) (0.21) (23.10)
5.25 -0.64 -0.35 -4.26 14.40 -0.17 * -14.22(12.47) (1.14) (0.22) (12.63) (21.61) (0.09) (21.64)
82.37 ** -6.62 * -0.64 -75.11 * 56.47 0.45 -56.92(41.44) (3.98) (0.90) (41.05) (52.43) (0.85) (52.57)
-14.46 ** 1.04 * 0.07 13.34 ** -9.48 -0.07 9.55(6.68) (0.60) (0.14) (6.59) (8.10) (0.14) (8.12)
-1.44 0.57 -0.11 * 0.99 3.56 -0.06 -3.50(2.69) (0.51) (0.07) (2.74) (4.00) (0.07) (4.01)
11.99 -3.00 1.70 ** -10.69 -47.72 0.39 47.33(27.52) (7.74) (0.82) (28.21) (48.52) (0.40) (48.53)
9.17 -0.55 0.05 -8.67 -4.57 -0.03 4.60(11.10) (1.37) (0.28) (11.17) (14.98) (0.12) (14.99)
51.82 *** 13.12 -0.21 -64.72 *** 79.54 *** -0.09 -79.46 ***(15.86) (11.77) (0.36) (9.32) (8.37) (0.14) (8.35)
7.45 -2.61 * 0.06 -4.90 4.25 -0.10 -4.14(4.68) (1.52) (0.14) (4.80) (7.45) (0.10) (7.48)
17.83 * -0.65 -0.21 -16.96 14.17 -0.15 -14.02(10.13) (1.01) (0.21) (10.35) (14.87) (0.16) (14.88)
-8.93 0.21 -0.31 9.03 -3.11 -0.15 3.25(9.72) (1.21) (0.22) (9.74) (14.35) (0.12) (14.37)
-4.87 * 0.10 -4.64 *** 9.41 *** -10.12 ** -1.73 *** 11.85 **(2.79) (0.11) (0.82) (2.91) (4.74) (0.52) (4.85)
15.32 -0.90 -0.16 -14.26 15.76 0.05 -15.81(13.62) (0.80) (0.29) (13.60) (22.14) (0.20) (22.15)
-6.32 * 0.17 0.19 * 5.96 -13.32 ** -0.02 13.33 **(3.65) (0.30) (0.11) (3.67) (6.65) (0.06) (6.66)
-28.05 *** 53.22 *** -0.16 -25.01 -15.42 -0.06 15.48(9.10) (20.30) (0.23) (20.46) (19.37) (0.15) (19.41)
-32.28 *** -1.39 -0.66 *** 34.33 *** -34.78 *** -0.27 *** 35.05 ***(4.78) (0.99) (0.12) (4.70) (8.21) (0.08) (8.22)
-29.25 *** -1.25 99.47 *** -68.97 *** -26.34 *** 99.85 *** -73.51 ***(4.56) (0.90) (1.56) (4.54) (7.03) (0.69) (7.04)
4.19 -0.12 0.29 -4.35 n.a. n.a. n.a.
(8.04) (1.00) (0.22) (8.08) n.a. n.a. n.a.
-0.18 0.24 0.08 -0.14 11.95 -0.06 -11.89
(12.58) (0.99) (0.36) (12.49) (19.27) (0.12) (19.28)
1.21 -0.91 0.04 -0.34 -7.65 0.02 7.62
(15.23) (0.91) (0.42) (15.15) (16.29) (0.24) (16.27)
-1.09 1.71 -0.21 -0.41 10.34 -0.15 -10.19
(10.08) (2.25) (0.23) (10.43) (13.75) (0.19) (13.78)
Mean Probability 29.53 1.28 0.61 68.58 27.35 0.22 72.43
Entries are marginal effects and standard errors in parentheses.
* Significant at the 10 percent level; ** Significant at the 5 percent level; *** Significant at the 1 percent level.
^ A very small number of respondents (7) made the transition from employed on the program (Wave 1) to unemployed off the program (Wave 4), which precluded
the calculation of marginal effects.
A model excluding this category yielded qualitatively similar results for the other three transition choices.
Program Participants with a Work Requirement
All Program Participants (N=235)
GED Training
Vocational Training
Fresh Start
Spousal Earnings
Parent Provided Child Care
Unemployment
White
(N=125)^
Work Requirement
Urban
Divorced
Car in Wave 1
Lost Car Access
Gained Car Access
Age
Other Race
EmployedUnemployedEmployed
Hispanic
Committed
Other Adults in Household
Less than High School
More than High School
Age2
Density
On ProgramOff ProgramOn Program Off ProgramOn ProgramOn ProgramOff Program
Unemployed
Page 13Center for Business and Economic Research
Car Access and Employment Outcomes for Tennessee Welfare Recipients
Multivariate Analysis of Hours Worked and Average Hourly Earnings
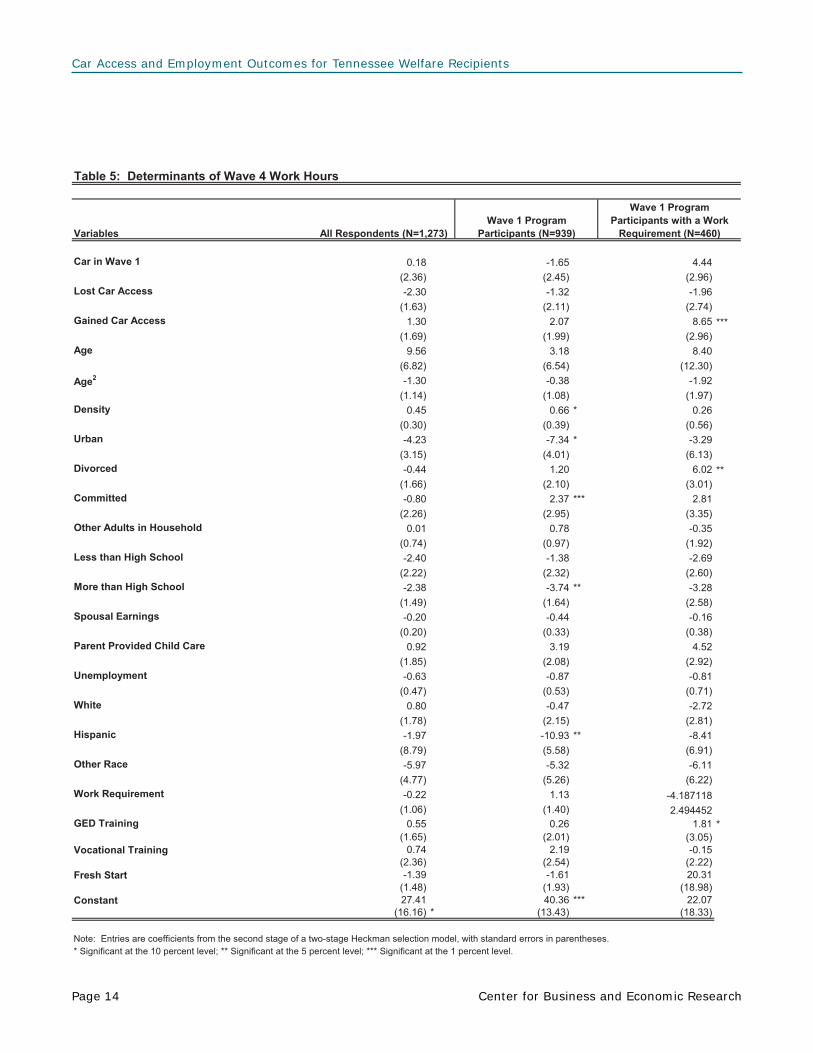
Table 5 presents the results from Heckman selection regressions of hours worked in Wave 4.20 Explanatoryvariables remain the same as those in the preceding multinomial logit analysis, and results for all study respon-dents, program participants, and program participants with a work requirement are presented separately. For themost part, car access does not seem to be an important determinant of work hours. However, among Wave 1program participants with work requirements, gaining access to a car between Waves 1 and 3 increases workhours in Wave 4 by nearly 9 hours. The lack of a strong effect of car access overall may be indicative of a generalinability among the samples in question to alter their hours of work. Having access to a car might increase one’sability to find and keep a job, but the jobs are likely to be characterized by standard labor hours contracts (e.g.,with a 40-hour work week).
Survey evidence adds credence to this contention that employers generally offered a limited set of availablehours. Participants were asked how many hours per week they usually worked and responses from Wave 4 areoutlined below. The most frequent response was 40 hours per week (34 percent). Other common responseswere 20 hours (7 percent), 30 hours (9 percent), 35 hours (9 percent), and 50 hours (3 percent). The averagenumber of hours worked was 34 and the majority of respondents reported that they usually worked less than 40hours per week (54 percent), suggesting that full-time employment opportunities might have been limited. Fif-teen percent worked 20 or fewer hours per week and 39 percent worked between 20 and 39 hours per week.Twelve percent of the respondents reported working more than 40 hours per week.
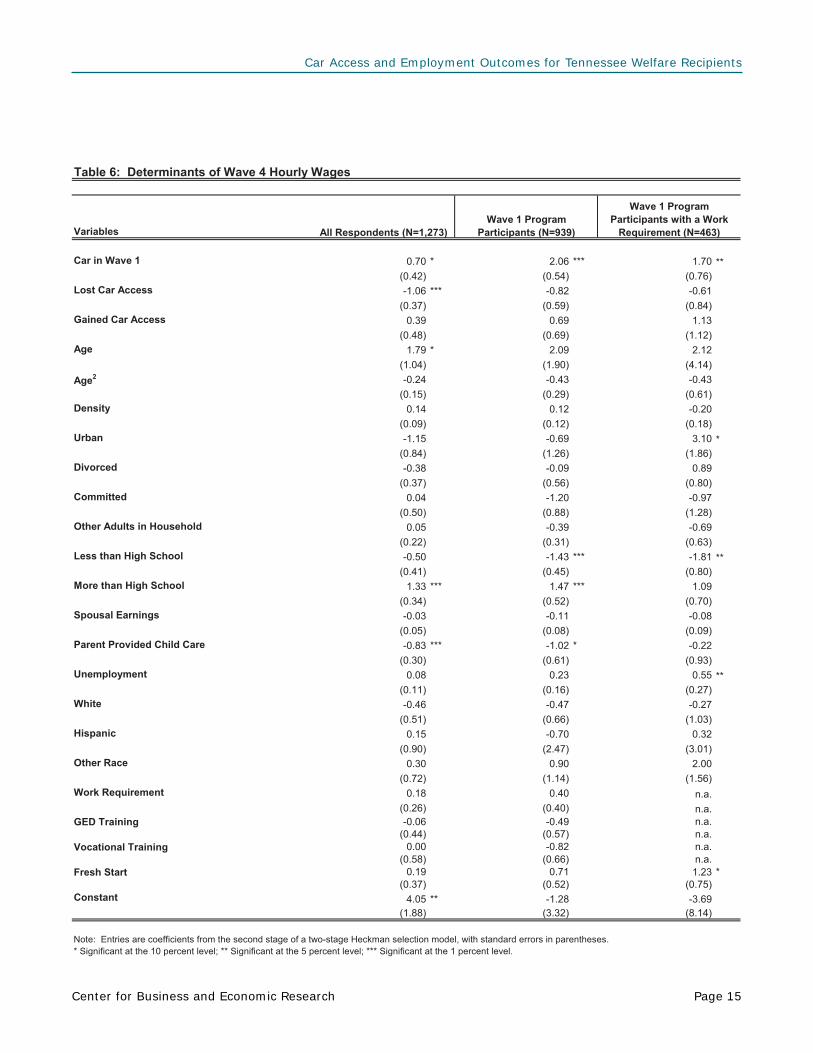
Regression results for hourly wages are reported in Table 6. We find that Wave 1 car access increases Wave4 average hourly wage for all three of our samples. In fact, the increases are quite large, ranging from $0.70 perhour for all respondents to $2.06 for Wave 1 program participants. Losing car access between Waves 1 and 3reduces the Wave 4 wage by slightly more than one dollar per hour among all respondents. Even though caraccess has little to no effect on hours of work, it does seem to enable respondents to find better-paying jobs.
20 We employ a two-stage selection model to account for the fact that hours and wages are only observed for working respondents. Theidentification variables for the first-stage employment probit are the household’s unearned income (as of Wave 3) and the number ofchildren under age 18 in the household (as of Wave 1). Results from first-stage probits are available upon request.
Page 14 Center for Business and Economic Research
Car Access and Employment Outcomes for Tennessee Welfare Recipients
Table 5: Determinants of Wave 4 Work Hours
0.18 -1.65 4.44
(2.36) (2.45) (2.96)
-2.30 -1.32 -1.96
(1.63) (2.11) (2.74)
1.30 2.07 8.65 ***
(1.69) (1.99) (2.96)
9.56 3.18 8.40
(6.82) (6.54) (12.30)
-1.30 -0.38 -1.92
(1.14) (1.08) (1.97)
0.45 0.66 * 0.26
(0.30) (0.39) (0.56)
-4.23 -7.34 * -3.29
(3.15) (4.01) (6.13)
-0.44 1.20 6.02 **
(1.66) (2.10) (3.01)
-0.80 2.37 *** 2.81
(2.26) (2.95) (3.35)
0.01 0.78 -0.35
(0.74) (0.97) (1.92)
-2.40 -1.38 -2.69
(2.22) (2.32) (2.60)
-2.38 -3.74 ** -3.28
(1.49) (1.64) (2.58)
-0.20 -0.44 -0.16
(0.20) (0.33) (0.38)
0.92 3.19 4.52
(1.85) (2.08) (2.92)
-0.63 -0.87 -0.81
(0.47) (0.53) (0.71)
0.80 -0.47 -2.72
(1.78) (2.15) (2.81)
-1.97 -10.93 ** -8.41
(8.79) (5.58) (6.91)
-5.97 -5.32 -6.11
(4.77) (5.26) (6.22)
-0.22 1.13 -4.187118
(1.06) (1.40) 2.494452
0.55 0.26 1.81 *
(1.65) (2.01) (3.05)0.74 2.19 -0.15
(2.36) (2.54) (2.22)
-1.39 -1.61 20.31
(1.48) (1.93) (18.98)
27.41 40.36 *** 22.07(16.16) * (13.43) (18.33)
Note: Entries are coefficients from the second stage of a two-stage Heckman selection model, with standard errors in parentheses.
* Significant at the 10 percent level; ** Significant at the 5 percent level; *** Significant at the 1 percent level.
Wave 1 Program
Participants (N=939)
Wave 1 Program
Participants with a Work
Requirement (N=460)
Lost Car Access
Gained Car Access
Age
All Respondents (N=1,273)
Other Race
Spousal Earnings
Density
Urban
Hispanic
Divorced
Committed
Work Requirement
Age2
Variables
Car in Wave 1
Parent Provided Child Care
Unemployment
White
Other Adults in Household
Less than High School
More than High School
GED Training
Vocational Training
Fresh Start
Constant
Page 15Center for Business and Economic Research
Car Access and Employment Outcomes for Tennessee Welfare Recipients
Table 6: Determinants of Wave 4 Hourly Wages
Variables
0.70 * 2.06 *** 1.70 **
(0.42) (0.54) (0.76)
-1.06 *** -0.82 -0.61
(0.37) (0.59) (0.84)
0.39 0.69 1.13
(0.48) (0.69) (1.12)
1.79 * 2.09 2.12
(1.04) (1.90) (4.14)
-0.24 -0.43 -0.43
(0.15) (0.29) (0.61)
0.14 0.12 -0.20
(0.09) (0.12) (0.18)
-1.15 -0.69 3.10 *
(0.84) (1.26) (1.86)
-0.38 -0.09 0.89
(0.37) (0.56) (0.80)
0.04 -1.20 -0.97
(0.50) (0.88) (1.28)
0.05 -0.39 -0.69
(0.22) (0.31) (0.63)
-0.50 -1.43 *** -1.81 **
(0.41) (0.45) (0.80)
1.33 *** 1.47 *** 1.09
(0.34) (0.52) (0.70)
-0.03 -0.11 -0.08
(0.05) (0.08) (0.09)
-0.83 *** -1.02 * -0.22
(0.30) (0.61) (0.93)
0.08 0.23 0.55 **
(0.11) (0.16) (0.27)
-0.46 -0.47 -0.27
(0.51) (0.66) (1.03)
0.15 -0.70 0.32
(0.90) (2.47) (3.01)
0.30 0.90 2.00
(0.72) (1.14) (1.56)
0.18 0.40 n.a.
(0.26) (0.40) n.a.
-0.06 -0.49 n.a.
(0.44) (0.57) n.a.
0.00 -0.82 n.a.
(0.58) (0.66) n.a.
0.19 0.71 1.23 *
(0.37) (0.52) (0.75)
4.05 ** -1.28 -3.69
(1.88) (3.32) (8.14)
Note: Entries are coefficients from the second stage of a two-stage Heckman selection model, with standard errors in parentheses.
* Significant at the 10 percent level; ** Significant at the 5 percent level; *** Significant at the 1 percent level.
Density
Urban
Work Requirement
Other Race
Hispanic
Divorced
Committed
Parent Provided Child Care
Unemployment
White
Other Adults in Household
Less than High School
More than High School
Spousal Earnings
Age2
Car in Wave 1
Lost Car Access
Gained Car Access
Age
GED Training
Vocational Training
Fresh Start
Constant
All Respondents (N=1,273)
Wave 1 Program
Participants (N=939)
Wave 1 Program
Participants with a Work
Requirement (N=463)
Page 16 Center for Business and Economic Research
Car Access and Employment Outcomes for Tennessee Welfare Recipients
Effects of Education
Finally, it is interesting to note that education variables had surprisingly little explanatory power in employ-ment transitions, although when significant, the effects followed predictable patterns.21 For unemployedparticipants as of Wave 1, less than a high school education increased the probability of remaining unemployedand on the program (13.53 percentage points) and decreased the probability of becoming employed and leavingthe program (9.46 percentage points) relative to those with a high school degree (Table 3). The probability ofbecoming employed and leaving the program was also significantly lower (12.61 percentage points) for unem-ployed Wave 1 participants with a work requirement.
For employed program participants, less than a high school education led to a 17.83 percentage point (60percent) increase in the probability of becoming unemployed and remaining on the program (Table 4). Havingmore than a high school education only had the effect of decreasing the probability that unemployed participantswould remain unemployed but leave the program. The results generally indicate that a high school education isimportant for achieving better outcomes, particularly for the unemployed (presumably those with the largestskill deficits), and that obtaining education beyond a high school degree, all else equal, has little effect onemployment and program participation outcomes.
The only significant effect of education in the hours estimation is that program participants with more thana high school education worked almost four fewer hours per week. This result is less puzzling in light of thehourly wage results, which indicate that participants with more education received higher wages allowing work-ers with more education to earn comparable wages in a shorter amount of time. In contrast to the employmenttransition results, education beyond high school leads to more favorable wage outcomes. Gaining high schooleducation, all else equal, also appears beneficial. Participants (all and the sub-set with a work requirement) withless than a high school education earned between $1.43 and $1.81 less per hour than their counterparts with ahigh school education.
21 Less education was associated with fewer transitions into employment and off of the program, etc.
Page 17Center for Business and Economic Research
Car Access and Employment Outcomes for Tennessee Welfare Recipients
6. Conclusions
Early research into the effects of car ownership on employment has established a positive correlationbetween the two. Subsequent literature has moved toward causality by accounting for the simultaneity of em-ployment and car ownership decisions using both instrumental variable and panel data approaches. We improveon the previous literature in several ways. First, we broaden the perspective to account for car access and notjust car ownership. Second, we consider urban and rural differences rather than focusing only on urban welfarerecipients. Finally, the rich survey data in the FALS allow for a more detailed analysis. Hours worked andhourly wages are considered as outcomes in addition to employment levels.
Our results are broadly consistent with those of earlier work. Our analysis of unemployed Wave 1 programparticipants reveals that those who had car access in the first Wave of the survey are much more likely to becomeemployed and leave the program as of Wave 4 (18-24 months later). Among the subset of unemployed Wave 1program participants who had work requirements, those who had access to a car in Wave 1 are dramatically lesslikely to remain unemployed and leave the program as of Wave 4. Results are similar in spirit for employedWave 1 program participants, regardless of work requirement status. For this group, having access to a car inWave 1 reduces the probability of becoming unemployed while remaining on the program and increases thelikelihood of remaining employed but leaving the program.
While car access does not seem to be an important determinant of work hours for broader samples, we dofind that gaining access to a car between Waves 1 and 3 increases Wave 4 work hours by nearly nine hoursamong Wave 1 program participants with work requirements. Car access also seems to enable respondents tofind better-paying jobs. Wave 4 wages were $0.72 to $2.12 higher for those who had car access in Wave 1. Allof these results suggest that car access is important to the labor market success of low-income householdsgenerally and welfare recipients more specifically.
Page 18 Center for Business and Economic Research
Car Access and Employment Outcomes for Tennessee Welfare Recipients
Appendix Table: Summary Statistics
Variable Mean Std. Dev. Mean Std. Dev. Mean Std. Dev.
Employment 0.36 0.48 0.29 0.45 0.33 0.47
Program Participation 0.71 0.45 1.00 0.00 1.00 0.00
Employment (Wave 4) 0.42 0.49 0.40 0.49 0.45 0.50
Program Participation (Wave 4) 0.55 0.50 0.61 0.49 0.61 0.49
Hours Worked per Week (Wave 4) 34.48 11.17 33.33 11.25 33.49 12.26
Hourly Wage (Wave 4) 7.98 3.37 7.75 3.23 7.81 3.59
Car Access 0.47 0.50 0.43 0.50 0.44 0.50
Lost Car Access (Wave 1 to Wave 3) 0.15 0.35 0.14 0.35 0.15 0.35
Gained Car Access (Wave 1 to Wave 3) 0.16 0.36 0.15 0.36 0.13 0.34
Age (Divided by 10) 2.93 0.79 2.94 0.81 2.93 0.72
Age2 (Divided by 100) 9.22 5.33 9.29 5.47 9.09 4.70
Density (Hundreds per Square Mile) 7.64 4.79 7.70 4.77 8.01 4.67
Urban 0.66 0.47 0.67 0.47 0.70 0.46
Divorced 0.28 0.45 0.27 0.45 0.30 0.46
Committed 0.10 0.30 0.10 0.30 0.08 0.27
Other Adults in Household 0.47 0.82 0.47 0.83 0.36 0.66
Less than High School 0.34 0.47 0.37 0.48 0.35 0.48
More than High School 0.23 0.42 0.23 0.42 0.31 0.46
Spousal Earnings (Wave 3, $100/month) 0.53 2.68 0.39 2.24 0.49 2.46
Parent Provided Child Care 0.15 0.35 0.14 0.35 0.11 0.32
Unemployment Rate (%) 5.24 1.31 5.25 1.33 5.23 1.32
White 0.35 0.48 0.33 0.47 0.30 0.46
Hispanic 0.01 0.08 0.01 0.09 0.01 0.09
Other Race 0.01 0.12 0.01 0.11 0.01 0.12
Work Requirement 0.47 0.50 0.48 0.50 1.00 0.00
GED Training 0.20 0.40 0.21 0.41 0.25 0.43
Vocational Training 0.10 0.30 0.11 0.32 0.16 0.37
Fresh Start 0.14 0.35 0.16 0.37 0.23 0.42
Unearned Income (Wave 3, $100/month) 3.03 5.12 3.06 3.44 2.89 3.13
Number of Kids Under Age 18 in HH 2.28 1.33 2.35 1.39 2.53 1.49
Maximum Sample Size 1,935 1,370 663
Note: Sample sizes differ by variable and are available upon request.
Statistics are calculated using Wave 1 data unless otherwise noted.
All Respondents
Wave 1 Program
Participants
Wave 1 Program
Participants with a Work
Requirement
Page 19Center for Business and Economic Research
Car Access and Employment Outcomes for Tennessee Welfare Recipients
References
Bania, Neil, Claudia Coulton, and Laura Leete. 1999. “Welfare Reform and Access to Job Opportunities inthe Cleveland Metropolitan Area,” Center on Urban Poverty and Social Change, Case WesternReserve University.
Barbour, Karie. 2003. “Motor Vehicle Wealth Taxes and Fleet Age: Air Quality Implications.” WorkingPaper, The University of Tennessee.
Blumenberg, Evelyn, and Paul Ong. 1998. “Job Accessibility and Welfare Usage: Evidence from LosAngeles.” Journal of Policy Analysis and Management 17(4): 639-657.
Blumenberg, Evelyn, and Paul Ong. 1999. “The Transportation-Welfare Nexus: Getting Welfare Recipientsto Work.” In Daniel Mitchell and Patricia Nomura (Eds.) (pp. 24-35). California PolicyOptions, Los Angeles: UCLA.
Blumenberg, Evelyn, and Margy Waller. 2003. The Long Journey to Work: A Federal Transportation Policyfor Working Families. Washington, DC: The Brookings Institution (Transportation ReformSeries).
Center for Business and Economic Research. 2000. Welfare Reform in Tennessee: A Summary of FamiliesFirst Policy. Knoxville, TN: The University of Tennessee. (Available at http://bus.utk.edu/cber/welfare.htm.)
Cervero, Robert. 1997. Paratransit in America: Redefining Mass Transportation. Westport, Connecticut:Praeger Press.
Cervero, Robert, Onésimo Sandoval, and John Landis. 2002. “Transportation as a Stimulus of Welfare-to-Work: Private versus Public Mobility.” Journal of Planning Education and Research. 22:50-63.
Cox, Amy, Nicole Humphrey, and Jacob Alex Klerman. 2000. Welfare Reform in California: Results of the1999 CalWORKs Program Staff Survey. Santa Monica, CA: RAND Corporation (MR-1181.0-CDSS).
Davis, Otto, and Norman Johnson. 1984. “The Jitneys: A Study of Grassroots Capitalism.” Journal ofContemporary Studies 4: 81-102.
Ebener, Patricia A., and Jacob Alex Klerman. 1999. “Welfare Reform in California: Results of the 1998 All-County Implementation Survey.” Santa Monica, CA: RAND Corporation (MR-1052-CDSS).
Page 20 Center for Business and Economic Research
Car Access and Employment Outcomes for Tennessee Welfare Recipients
Fein, David J., Erik Beecroft, William Hamilton, and Wang S. Lee. 1998. The Indiana Welfare ReformEvaluation: Program Implementation and Economic Impacts after Two Years. Washington:Abt Associates and The Urban Institute.
Gardenhire, Alissa D., and M. William Sermons. 1998. “Understanding Automobile Ownership Behavior ofLow-Income Households: How Behavior Differences May Influence Transportation Policy.”Transit Markets of the Future: The Challenges of Change, Transportation Research Board,Report 28.
Green, William H. 2003. Econometric Analysis. 5th ed. Upper Saddle River, New Jersey: Prentice Hall.
Henly, Julia R. 1999. “Matching and Mismatch in the Low-Wage Labor Market: Job Search Perspective.” InThe Low-Wage Labor Market: Challenges and Opportunities for Economic Self-sufficiency.Washington, D.C.: Urban Institute.
Holzer, Harry. 1999. “Matching and Mismatch in the Low-wage Labor Market: Hiring Perspective.” In TheLow-wage Labor Market: Challenges and Opportunities for Economic Self-sufficiency.Washington, D.C.: Urban Institute.
Ihlanfeldt, Keith, and David Sjoquist. 1998. “The Spatial Mismatch Hypothesis: A Review of RecentStudies and Their Implications for Welfare Reform.” Housing Policy Debate 9: 849-892.
Iowa Department of Human Services. 2002. Long-Term Welfare Recipients’ Barriers to Employment:Summary.
Julnes, George, and Anthony Halter. 2000. Illinois Study of Former TANF Clients, Final Report.Springfield, IL: Institute for Public Affairs, University of Illinois.
Kain, John F. 1992. “The Spatial Mismatch Hypotheses: Three Decades Later.” Housing Policy Debate3(2): 371-460.
Kasarda, John D. 1980. “The Implications of Contemporary Redistribution Trends for National UrbanPolicy.” Social Science Quarterly 61: 373-400.
Ong, Paul. 1996. “Work and Automobile Ownership among Welfare Recipients.” Social Work Research20(4): 255-262.
Ong, Paul. 2002. “Car Ownership and Welfare-to-Work.” Journal of Policy Analysis and Management21(2): 239-252.
Page 21Center for Business and Economic Research
Car Access and Employment Outcomes for Tennessee Welfare Recipients
Ong, Paul, and Evelyn Blumenberg. 1998. “Job Access, Commute, and Travel Burden Among WelfareRecipients. Urban Studies 35(1): 77-93.
Ong, Paul, and Shannon McConville. 2001. “Welfare to Work and the Entry-Level Labor Market.” In P.Ong and J. Lincoln (Eds.), The State of California Labor (pp. 289-307). Los Angeles andBerkeley, CA: UCLA Institute of Industrial Relations and UC Berkeley Institute of IndustrialRelations.
Owen, Greg, Ellen Shelton, Amy Bush Stevens, Justine Nelson-Christinedaughter, Corinna Roy, and JuneHeineman. 2000. “Whose Job Is It? Employers’ Views on Welfare Reform.” Joint Centerfor Poverty Research Working Paper No. 184.
Perkins, Deborah Godwin, and Karen Homer. 2002. Welfare Leavers in Tennessee: For Better or forWorse? Knoxville, TN: The University of Tennessee, College of Social Work.
Port JOBS. 2001. “But Do Car Ownership Programs Work?” Port JOBS Reports (Autumn).
Preston, Valerie, and Sara McLafferty. 1999. “Spatial Mismatch Research in the 1990s: Progress andPotential.” Papers in Regional Science 78: 387-402.
Raphael, Steven, and Lorien Rice. 2002. “Car Ownership, Employment, and Earnings.” Journal of UrbanEconomics 52: 109-130.
Raphael, Steven and Michael Stoll. 2000. “Can Boosting Minority Car-Ownership Rates Narrow Inter-Racial Employment Gaps?” Berkeley Program on Housing and Urban Policy. WorkingPapers: Working Paper W00-002.
Rich, Michael J. 1999. “Access to Opportunities: The Welfare-to-Work Challenge in Metropolitan Atlanta.”Paper presented at the APPAM Research Conference, Washington, D.C., November 6.
Social Research Institute. 1999. Understanding Families with Multiple Barriers to Self Sufficiency: FinalReport. Salt Lake City, UT: Author.
Social Work Office of Research and Public Service. 2003. Families First Customer Satisfaction Survey,2001. Knoxville, TN: The University of Tennessee, College of Social Work.


Center for Business and Economic ResearchCollege of Business Administration
The University of Tennessee100 Glocker Building
1000 Volunteer BoulevardKnoxville, TN 37996
Phone: (865) 974-5441Fax: (865) 974-3100
http://cber.bus.utk.edu

Center for Business andEconomic Research