Capturing the impact X of philanthropy...of Wisconsin charitable giving and current giving trends....
28
Capturing the impact of philanthropy u 2016 Wisconsin Gives Report
Transcript of Capturing the impact X of philanthropy...of Wisconsin charitable giving and current giving trends....

Capturing the impact of philanthropy
u
2016 Wisconsin Gives Report

2 | 2016 Wisconsin Gives Report
Wisconsin Philanthropy Network (WPN) proudly welcomes you to the 2016 Wisconsin Gives Report. This biennial publication provides a comprehensive look at the state of philanthropy in Wisconsin and throughout the United States.
WPN’s objective is twofold: First, to create a dynamic, updated knowledge base of in-depth information on
national, regional and local funders while deepening the understanding of Wisconsin charitable giving and current giving trends. And, second, to ensure that funders have the information, data and analysis needed to be effective philanthropists, maximizing the impact of funding awarded throughout the state.
Historically, WPN accomplished this by accessing and compiling information from numerous national studies and data sources. However, this methodology posed several challenges. Minimal Wisconsin-focused data is available due to limited statewide research and, unfortunately, national research is frequently dated by the time it is released.
With this in mind, WPN has enhanced this year’s report by undertaking a qualitative and quantitative study of Wisconsin grantmakers. This included an extensive survey seeking feedback from 383 of our state’s funders on the type and level of support awarded, as well as topics such as projections for the upcoming fiscal year, evaluation of their philanthropic impact and their perception of the overall status of Wisconsin nonprofit service organizations. In addition, the survey sought feedback on funding for leadership development, a topic of interest to many of our state’s grantmakers.
In the end, WPN was able to more effectively analyze, compare and contrast local, regional, and statewide trends and how they align or differ from those on a national level. And for you, our reader, whether you are a funder hoping to increase your overall impact, or a grantseeker striving to meet pressing needs in our state, we hope you find this information insightful and beneficial as you work collectively to make Wisconsin a great place to live and work for current and future generations.
Jill Van CalsterPresident and CEO, Wisconsin Philanthropy Network
Capturing Effective Philanthropy A Message from the President and CEO
Table of ContentsExecutive Summary and Key Findings 2WPN's Grantmaker Survey Results 3-9Diversity, Equity and Inclusion 10Wisconsin Giving 11Midwest Giving 12Corporate Giving 13-15Community Foundation Giving 16-17Donor-Advised Fund Giving 18-20Independent Foundation Giving 21Family Foundation Giving 22-23Operating Foundation Giving 24National Trends 25-26
Overall Key Findings� Total estimated charitable giving in the
United States rose 4.1 percent between 2014 and 2015, to $373.25 billion.*
� Giving to arts, culture, and humanities is estimated to have increased 7.0 percent between 2014 and 2015, to $17.07 billion.*
� The single largest contributor to the increase in total giving was $9.77 billion in Giving By Individuals (67 percent of the total change).*
*GIVING USA 2016, Giving USA FoundationTM
� 100% of respondents of the WPN Grantmaker Survey believe in investments in nonprofit leadership development; however, only 57.5% report funding leadership development.
2016 Wisconsin Gives Report | 3
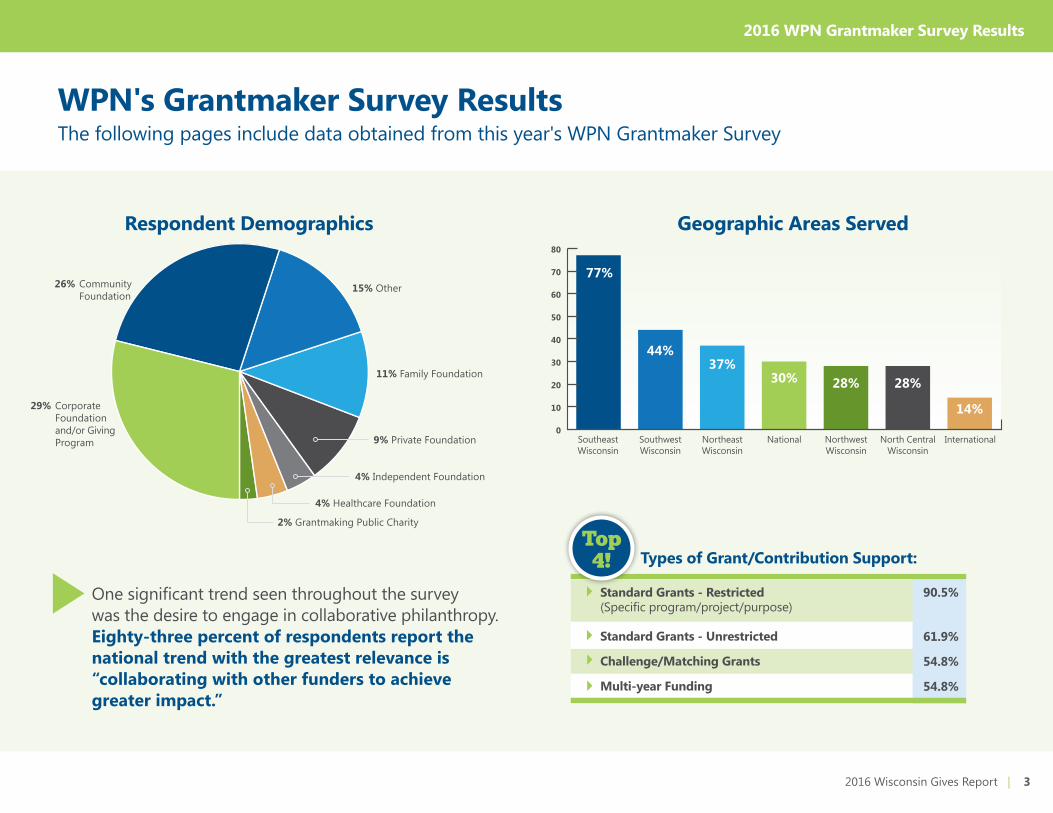
The following pages include data obtained from this year's WPN Grantmaker Survey
Respondent Demographics Geographic Areas Served
4% Independent Foundation
4% Healthcare Foundation
2% Grantmaking Public Charity
15% Other
29% Corporate Foundation and/or Giving Program
26% Community Foundation
11% Family Foundation
9% Private Foundation Southeast Wisconsin
Southwest Wisconsin
Northeast Wisconsin
National Northwest Wisconsin
North Central Wisconsin
International
77%
44%37%
30% 28% 28%
14%
WPN's Grantmaker Survey Results
One significant trend seen throughout the survey was the desire to engage in collaborative philanthropy. Eighty-three percent of respondents report the national trend with the greatest relevance is “collaborating with other funders to achieve greater impact.”
2016 WPN Grantmaker Survey Results
80
70
60
50
40
30
20
10
0
Types of Grant/Contribution Support:
}
}
}
}
Standard Grants - Restricted (Specific program/project/purpose)
Standard Grants - Unrestricted
Challenge/Matching Grants
Multi-year Funding
90.5%
61.9%
54.8%
54.8%
Top4!
4 | 2016 Wisconsin Gives Report
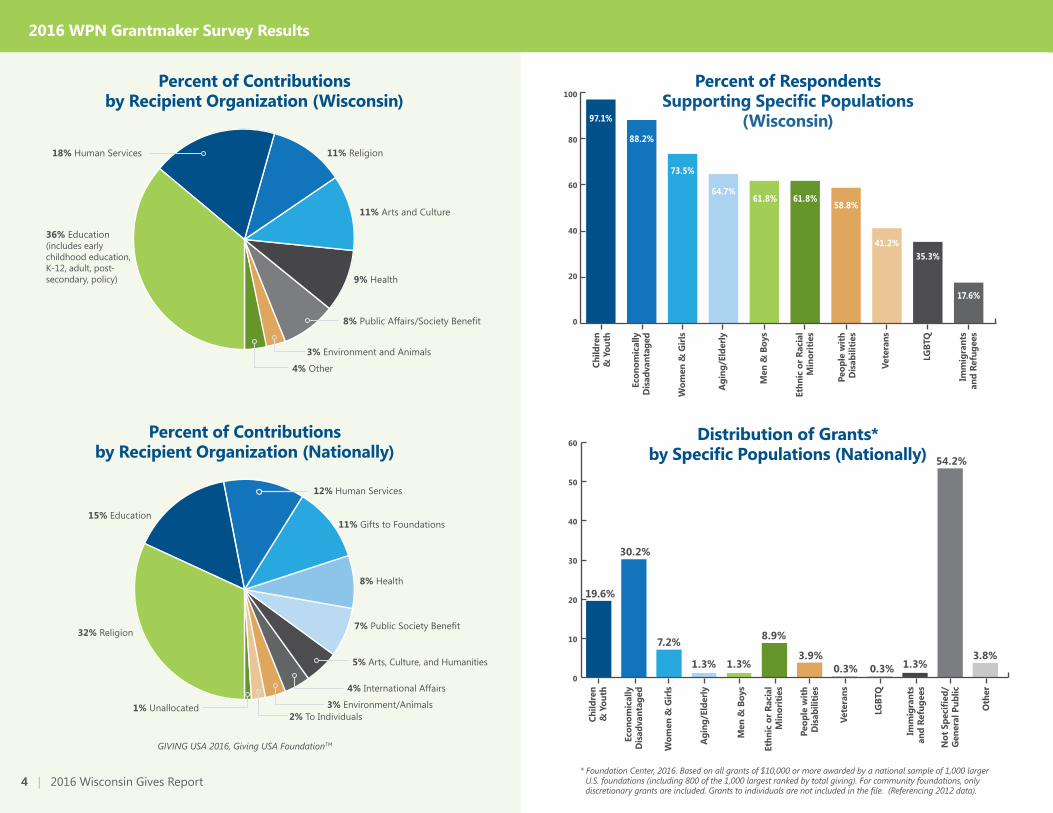
Percent of Contributions by Recipient Organization (Wisconsin)
36% Education (includes early childhood education, K-12, adult, post- secondary, policy)
18% Human Services 11% Religion
11% Arts and Culture
9% Health
8% Public Affairs/Society Benefit
3% Environment and Animals
4% Other
Percent of Respondents Supporting Specific Populations
(Wisconsin)
Child
ren
& Y
outh
Econ
omic
ally
D
isad
vant
aged
Wom
en &
Girl
s
Agi
ng/E
lder
ly
Men
& B
oys
Ethn
ic o
r Rac
ial
Min
oriti
es
Peop
le w
ith
Dis
abili
ties
Vete
rans
LGBT
Q
Imm
igra
nts
and
Refu
gees
100
80
60
40
20
0
97.1%
88.2%
73.5%
64.7%61.8%
58.8%61.8%
41.2%35.3%
17.6%
Distribution of Grants*by Specific Populations (Nationally)
19.6%
30.2%
7.2%
1.3% 1.3%
8.9%
3.8%3.9%0.3% 0.3% 1.3%
54.2%
Child
ren
& Y
outh
Econ
omic
ally
D
isad
vant
aged
Wom
en &
Girl
s
Agi
ng/E
lder
ly
Men
& B
oys
Ethn
ic o
r Rac
ial
Min
oriti
es
Peop
le w
ith
Dis
abili
ties
Vete
rans
LGBT
Q
Oth
er
Imm
igra
nts
and
Refu
gees
Not
Spe
cifie
d/G
ener
al P
ublic
60
50
40
30
20
10
0
* Foundation Center, 2016. Based on all grants of $10,000 or more awarded by a national sample of 1,000 larger U.S. foundations (including 800 of the 1,000 largest ranked by total giving). For community foundations, only discretionary grants are included. Grants to individuals are not included in the file. (Referencing 2012 data).
Percent of Contributions by Recipient Organization (Nationally)
32% Religion
15% Education
12% Human Services
11% Gifts to Foundations
8% Health
7% Public Society Benefit
5% Arts, Culture, and Humanities
4% International Affairs
3% Environment/Animals2% To Individuals
1% Unallocated
GIVING USA 2016, Giving USA FoundationTM
2016 WPN Grantmaker Survey Results
2016 Wisconsin Gives Report | 5
50
40
30
20
10
0
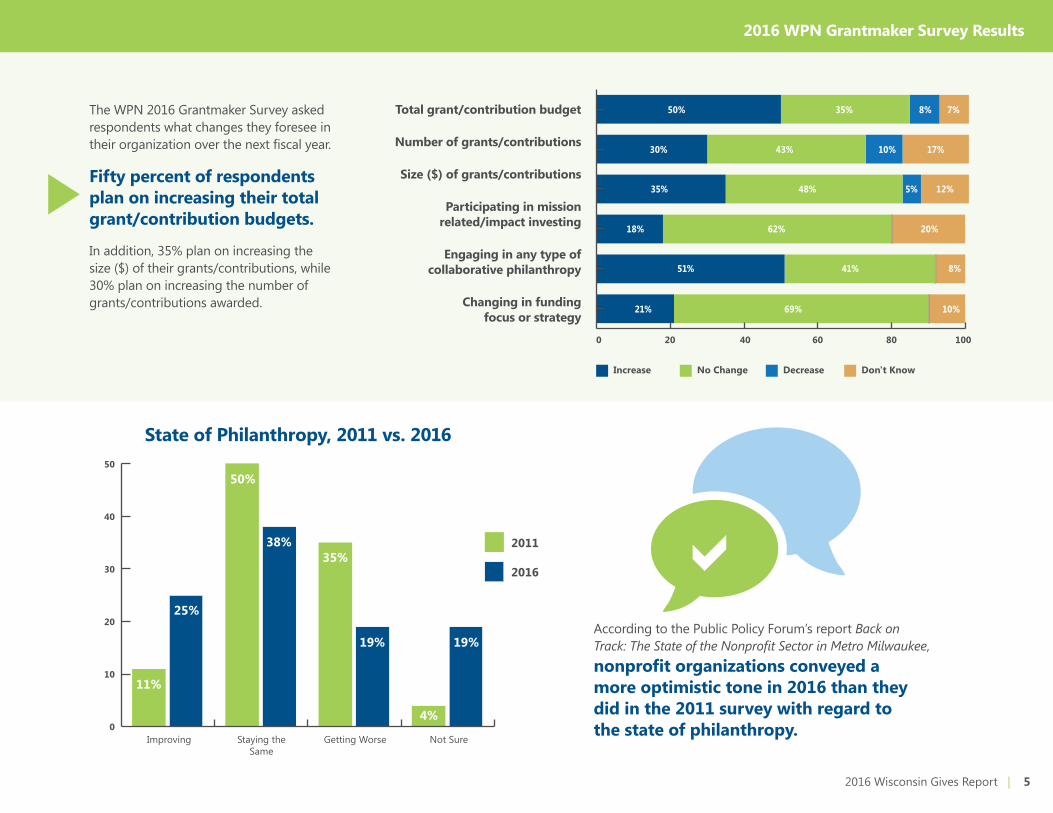
State of Philanthropy, 2011 vs. 2016
According to the Public Policy Forum’s report Back on Track: The State of the Nonprofit Sector in Metro Milwaukee, nonprofit organizations conveyed a more optimistic tone in 2016 than they did in the 2011 survey with regard to the state of philanthropy.
25%
38%
19% 19%
11%
4%
50%
35%2011
2016
Improving Staying the Same
Getting Worse Not Sure
The WPN 2016 Grantmaker Survey asked respondents what changes they foresee in their organization over the next fiscal year.
Fifty percent of respondents plan on increasing their total grant/contribution budgets. In addition, 35% plan on increasing the size ($) of their grants/contributions, while 30% plan on increasing the number of grants/contributions awarded.
Increase No Change Decrease Don't Know
0 20 40 60 80 100
Total grant/contribution budget
Number of grants/contributions
Size ($) of grants/contributions
Participating in mission related/impact investing
Engaging in any type of collaborative philanthropy
Changing in funding focus or strategy
30% 43% 10% 17%
35% 48% 5% 12%
18% 62%
41%
69%
8%
10%
20%
51%
21%
50% 35% 8% 7%
2016 WPN Grantmaker Survey Results
6 | 2016 Wisconsin Gives Report
Most Important Nonprofit Leader Competencies (Corporate Responses)
Mission, Vision and Strategy Conduct organizational planning, assessment and development
Community Building Networking, community outreach, initiating/building and leading/supporting collaborative efforts
People Management Delegation, staff selection and development, diversity optimization, team building
Organizational Skills Financial management, strategic planning, human resources, crisis/change management
Fund Development Develop and implement fundraising strategy; plan/execute other revenue-generating activities
Interpersonal Emotional intelligence, conflict resolution, building consensus/alignment, creating dialogue
Sector Specific Competencies Program management, advocacy, policy, grant management, volunteer development, board governance
Sector Content Knowledge Understanding nonprofit business model, relationships, laws, regulations
Leadership Summary When respondents were asked whether they believed that investments in the development of nonprofit leaders (staff and volunteer) were important to the future of the sector, all responded affirmatively. However, only 57.5% report funding nonprofit leaders who attend local or national academic or other leadership development programs.
The grantmaker survey asked respondents to rank nonprofit leader competencies from the most to the least important. Interestingly, when reviewing all respondents, there wasn’t consistency on which competencies were most important. However, once corporate foundation/giving program respondents were analyzed independently, a clear ranking of competencies was evident.
Three WPN programs commented on by survey respondents included Leadership Advanced, Sustainability & Impact Project, and the Wisconsin Leadership Development Project (see next page). Additional local opportunities noted were Cardinal Stritch University’s African American Leadership Program and the Association for Healthcare Philanthropy's Madison Institute.
Frequently referenced national opportunities included: Georgetown University’s New Strategies Program, Neighborhood Leadership Institute, Policy Link Equity Summit, and Ministry Leadership Institute.
Investments in the development of nonprofit leaders (staff and volunteer) are important to the future of the sector.
100% Agree
2016 WPN Grantmaker Survey Results

2016 Wisconsin Gives Report | 7
Practices Funders Utilize to Increase Grantee Effectiveness:
Personal meetings and/or site visits with potential grantees
Establishing clear priorities and goals for your organization's grantmaking
Encouraging/facilitating grantee collaboration
Top3!
Percent of respondents report measuring the effectiveness of their organization’s grantmaking.63%
Common ways funders measure impact include: Grantee grant evaluation and reporting (expected vs. actual results), interviews and site visits.
Project/program
Advocacy and education
General operating (basic unrestricted grant support of an organization - critical infrastructure/core support)
Capacity building (grants that strengthen overall organizational function through strategic investments to improve leadership/governance, resource and asset management, program/service delivery and technology infrastructure)
WPN Leadership InitiativesLeadership Advanced – This program supports outstanding nonprofit leaders as they seek to strengthen their organizations. This is accomplished by creating a network of empowered, innovative, and resilient leaders, capable of navigating change with the skills and tools necessary to enhance their organizations.
Sustainability and Impact Project – This executive education project is designed for nonprofit organizations that receive funding from Bader Philanthropies, Inc. The Sustainability & Impact Project utilizes social innovation as a framework to achieve positive, sustainable social change – a departure from conventional charity. With expert guidance and coaching, participants design and implement their own social-innovation model that aims for sustainability and impact for their nonprofit organization.
Wisconsin Leadership Development Project (WiLD) – This leadership development effort teaches participants how to engage others around their own core values, structure effective leadership teams, and make strategic choices that lead to measurable, effective action for change.
Kresge Initiative LaunchedIn September 2015, The Kresge Foundation announced the creation of its Social Investment Practice. The Practice plans to award $350 million in program-related investments (PRIs) through 2020 to expand opportunities for low income families across U.S. cities. In 2014, it provided $11.6 million in PRIs to human services initiatives.
More broadly, in the context of its ongoing human services initiatives, The Kresge Foundation focuses on funding “high-performing organizations that seek to increase their ability to innovate and take their service-delivery and systems-change work to a higher level,” as well as networks that are working on improving the economic security of low income households. The Foundation awarded more than $5.5 million toward human services initiatives to public and private organizations in 2015.
2016 WPN Grantmaker Survey Results
}
}
}
}
}
}
}
Purposes of Grant/Contribution Support Are:
Top4!
86.1%
62.8%
61.5%
58.1%

8 | 2016 Wisconsin Gives Report
0% 10% 20% 30% 40% 50% 60% 70% 80% 90% 100%
Major Challenge A Challenge Not a Challenge Does Not Apply
13% 50% 27% 10%
18% 64% 12% 6%
26% 55% 10% 10%
45% 45% 10%
13% 63% 16% 9%
13% 53% 19% 16%
19% 45% 13% 23%
48% 10% 19%
16% 44% 31% 9%
12% 56% 21% 12%
40% 49% 11%0%
18% 59% 18% 6%
9% 56% 21% 15%
20% 57% 11% 11%
23% 63% 3% 11%
19% 53% 16% 13%
23%
Grantmaker Perception of Grantee Challenges
In WPN’s recent 2016 Grantmaker Survey, funders were asked what perceived challenges grantee organizations faced. The top four “major challenges" funders felt their grantee organizations face included: recruiting new donors (40%), succession planning (26%), building an endowment (23%), and meeting needs/interests of clients/members (23%).
When WPN combined responses of “Major Challenge” and “A Challenge,” two areas showed a significant difference between how funders responded on the WPN Grantmaker Survey and how nonprofit/grantee organizations responded in the Public Policy Forum Survey (see next page). First, 82% of
funders perceived partnerships/collaborations with others as a challenge or major challenge, whereas only 58% of nonprofits responded as such. Second, 59% of funders perceived accountability to donors as a challenge or major challenge, whereas only 36% of nonprofits felt this was a challenge or major challenge.
There were three areas that nonprofit/grantee organizations reported as a greater challenge than what was reported by their funder counterparts. These included: enhancing their visibility and reputation, recruiting or retaining qualified volunteers, and recruiting new board members.
Competition from other nonprofits
Partnerships/collaborations with other nonprofits
Succession planning
Retaining current board members
Recruiting new board members
Addressing repair/maintenance needs
Initiating capital improvements
Building an endowment
Accountability to donors
Retaining current donors
Recruiting new donors
Recruiting or retaining qualified staff
Recruiting or retaining qualified volunteers
Enhancing their visibility and reputation
Meeting needs/interests of clients/members
Growth in clients
2016 WPN Grantmaker Survey Results

2016 Wisconsin Gives Report | 9
According to the Public Policy Forum’s publication, Back on Track: The State of the Nonprofit Sector in Metro Milwaukee, nonprofits were asked about their overall organizational challenges.
0% 10% 20% 30% 40% 50% 60% 70% 80% 90% 100%
Major Challenge A Challenge Not a Challenge Does Not Apply
19% 42% 30% 10%
10% 48% 37% 5%
23% 51% 22% 4%
6% 39% 52% 4%
28% 53% 16% 2%
20% 33% 18% 30%
33% 22% 13% 32%
36% 24% 7% 32%
6% 30% 52% 12%
16% 51% 22% 11%
64% 26% 2% 7%
23% 38% 32% 6%
23% 48% 22% 6%
44% 44% 11% 2%
25% 49% 23% 3%
31% 32% 23% 14%
Competition from other nonprofits
Partnerships/collaborations with other nonprofits
Succession planning
Retaining current board members
Recruiting new board members
Addressing repair/maintenance needs
Initiating capital improvements
Building an endowment
Accountability to donors
Retaining current donors
Recruiting new donors
Recruiting or retaining qualified staff
Recruiting or retaining qualified volunteers
Enhancing their visibility and reputation
Meeting needs/interests of clients/members
Growth in clients
Organizational Challenges Reported by Nonprofits
The top four most commonly cited “major challenges” include: • Recruiting new donors (64%)• Enhancing visibility and reputation (44%)• Building an endowment (36%)• Initiating capital improvements (33%)
2016 WPN Grantmaker Survey Results

10 | 2016 Wisconsin Gives Report
Foundation grants to organizations serving Black men and boys totaled $64.6 million in 2012, increasing 60 percent over 2011.This is according to a 2015 report, Quantifying Hope: Philanthropic Support for Black Men and Boys, coproduced by Open Society Foundations and the Foundation Center. The results revealed that while organizations serving Black men and boys received less grant dollars than organizations serving women and girls of color in 2012, these figures have merged closer together in recent years. Still, grant dollars to these groups constituted a very small portion of foundation giving in 2012, at 0.14 percent.
Milwaukee Waukesha Dane Menominee WI State National
Overall Grade C A- B+ D+ ----- -----
Economy
Unemployment Rate 5.50% 3.50% 2.90% 2.50% 4.40% 5.10%
Median Household Income $40,429 $70,996 $57,771 $31,200 $48,173 $48,906
Poverty (% of population below poverty line) 21.60% 5.40% 12.90% 31.40% 13.50% 15.80%
Education
On-Time High School Graduation (% of freshmen who graduate in four years) 75% 94% 86% ----- 88% 81.40%
Community Health & Civic Life
Violent Crime (per 100,000 population) 799.6 66.5 239.1 ----- 271.10 387.80
Youth Not in School and Not Working (% ages 16-24) 15.10% 6.30% 5.10% 37.90% 9.80% 13.80%
Population 956,386 393,940 510,027 4,382 5,742,953 316,497,531
The Opportunity Index is designed to provide a snapshot of what opportunity looks like at the state and county levels. The Index focuses on the conditions present in different communities and is designed to help local communities connect economic, academic, civic and other factors that support increased opportunity and economic mobility.
The 2015 Opportunity Index provides Opportunity Scores for all 50 U.S. states and the District of Columbia, and Opportunity Grades for 2,673 counties and county equivalents, comprising 99 percent of the nation’s population. Wisconsin ranked 18th out of 51. The following chart contains national and local data from The 2015 Opportunity Index. Data was collected from several counties to show the variance of issues in rural, suburban, and urban Wisconsin.
Diversity, Equity and InclusionD
iver
sity,
Equi
ty a
nd In
clus
ion
The Opportunity Index by County
GIVING USA 2016, Giving USA FoundationTM
According to respondents of the 2016 WPN Grantmaker Survey, the factor that most significantly limits a funders philanthropic impact is “the complexity of issues we seek to address.” Areas of most concern to funders include:
• Hyper-segregation; lack of equityfor marginalized communities;race, equity and inclusion
• Lack of economic vitality; creatingthriving neighborhoods; growingpoverty and its root causes; jobcreation/employment
• Proliferation of nonprofits;many are grassroots organizationthat lack the knowledge,experience and infrastructurenecessary to succeed

2016 Wisconsin Gives Report | 11
Wisconsin G
iving
Wisconsin Giving Statistics
Northwest# of Foundations
86Total Giving $35,444,448
Total Assets $611,241,280
Granted
5.80%
Southwest# of Foundations
511 Total Giving
$638,424,626
Total Assets $10,217,107,282
Granted
6.25%
Southeast# of Foundations
1,344Total Giving
$671,690,899
Total Assets $11,007,083,283
Granted
6.10%
North Central# of Foundations
149Total Giving $52,346,268
Total Assets $856,782,550
Granted
6.11%
Northeast# of Foundations
298Total Giving
$173,397,902
Total Assets $1,550,859,281
Granted
11.18%
Foundation Giving Regionally
Total Giving by Foundation Type in Wisconsin, From 2001-2014 (in Millions)
2001 2002 2003 2004 2005 2006 2007 2008 2009 2010 2011 2012 2013 2014
$450
400
350
300
250
200
150
100
50
0
IndependentFoundations
FamilyFoundations
CorporateFoundations
CommunityCharities
OperatingCharities
IN M
ILLI
ON
S
Foundation Center, 2016
Wisconsin Nonprofit Data (Source: National Center for Charitable Statistics)
2003 2013 Percent Change
501(c)3 Public Charities 15,879 18,725 17.9%
Foundation Information Center, 2015

12 | 2016 Wisconsin Gives Report
Midwest Giving Statistics
MinnesotaTotal Giving
$1,140,819,805
Total Assets $18,653,739,414
WisconsinTotal Giving $630,773,666
Total Assets $9,976,350,131
IowaTotal Giving $212,303,690
Total Assets $3,749,215,500
IndianaTotal Giving
$1,358,528,062
Total Assets $20,240,276,664
IllinoisTotal Giving
$3,358,980,877
Total Assets $38,885,306,660
OhioTotal Giving
$1,451,675,152
Total Assets $23,945,241,971
MichiganTotal Giving
$1,652,091,344
Total Assets $31,274,252,500
Foundation Giving in the Midwest
Granted
6.32%
Granted
5.66%
Granted
6.06%
Granted
5.28%
Granted
8.64%
Granted
6.71%
Granted
6.12%
Foundation Center, 2014 Data
IncourageBased in Wisconsin Rapids and serving the surrounding communities, Incourage was established in 1994 as a community foundation. Since that time, and in response to numerous community challenges, Incourage has evolved from a traditional grantmaker into a values-led, user-centered and place-based organization stewarding and connecting all forms of capital – moral, social, human, intellectual, reputational, financial and natural – toward a powerful shared vision: a community that works well for all people.
Earlier this year Incourage was recognized by HUD for Blueprints for Tomorrow – an Incourage-led and USDA-supported program. According to Incourage CEO Kelly Ryan, the program is “designed to build networks, vision and skills to lead a new regional economy based upon the values of equity, opportunity, and shared stewardship.”
Blueprints' curriculum consists of four integrated tracks of learning that have been designed in partnership with national thought leaders. These include adaptive leadership; impact investing and financing; collaborative development practices; and local, inclusive, sustainable economies.
When accepting HUD’s Secretary’s Award for Public-Philanthropic Partnerships, Ryan commented, “Blueprints is helping the community’s institutions do business in new and different ways, ensuring that they are prepared to support an entrepreneurial culture shaped by resident participation.”
The program currently consists of six organizational teams committed to both collaboration and entrepreneurialism. These teams include City of Wisconsin Rapids, Wood County, South Wood County YMCA, Wisconsin Rapids Housing Authority, Central Rivers Farmshed and Incourage.
“There is a tangible feeling that any project coming out of this collaboration has a stronger chance of real world success,” said Adam Tegen, City of Wisconsin Rapids Director of Planning & Economic Development and Blueprints participant. Tegen highlighted the partnerships that are emerging from Blueprints training as teams are looking beyond their own priorities to see how they align with other teams and the community at large.
MEMBER SPOTLIGHTM
idw
est G
ivin
g

2016 Wisconsin Gives Report | 13
A Corporate Foundation is a private foundation that derives its grantmaking funds primarily from the contributions of a profit- making business.
The company-sponsored foundation often maintains close ties with the donor company, but it is a legally separate organization, sometimes with its own endowment, and is subject to the same rules and regulations as other private foundations.
Because it is a separate organization, a corporate foundation is typically a more flexible charitable vehicle than a corporate giving program.
A Corporate Giving Program is a grantmaking program established and administered within a profit-making company. Gifts or grants go directly to charitable organizations from the corporation.
Corporate giving programs do not have a separate endowment; their expense is planned as part of the company’s annual budgeting process and usually is funded with pre-tax income.
Corporate Giving
of survey respondents were from corporate foundations and/or corporate giving programs.29%
Types of Support were:A significant difference in the corporate respondents related to the type of support they provide.
Top3!
}
}
}
Standard grants - Restricted (specific program/project/purpose)
Sponsorships
Employee matching gifts
Non-Grant/In-Kind Support provided by corporate funders:
}
}
}
}
Subject matter/field of expertise advice
Convenings and gatherings (organizing, participating in, providing space, etc.)
Provide volunteers/board service
Donations of equipment and supplies
Largest Corporate Foundations in Wisconsin by Total Giving (2014)
Top10!
Foundation Total Giving
1 Northwestern Mutual Foundation, Inc. $18,110,867
2 Anheuser-Busch Foundation $15,653,812
3 Johnson Controls Foundation, Inc. $8,667,835
4 We Energies Foundation, Inc. $6,478,562
5 Rockwell Automation Charitable Corp. $5,569,679
6 Marshall & Ilsley Foundation, Inc. $3,974,500
7 Sentry Insurance Foundation, Inc. $3,707,138
8 The Wanek-Vogel Foundation, Ltd. $3,694,824
9 The Harley-Davidson Foundation, Inc. $3,370,901
10 Windhover Foundation, Inc. $3,359,266
Foundation Center, 2016
WPN Grantmaker Survey
In early January 2016, IEG issued its 31st annual industry review and forecast of corporate sponsorship spending. Sponsorship spending in North America reached $21.4 billion in 2015, approximately 4.1 percent higher than the previous year.GIVING USA 2016, Giving USA FoundationTM
Top4!
MEMBER SPOTLIGHTCorporate G
iving
14 | 2016 Wisconsin Gives Report
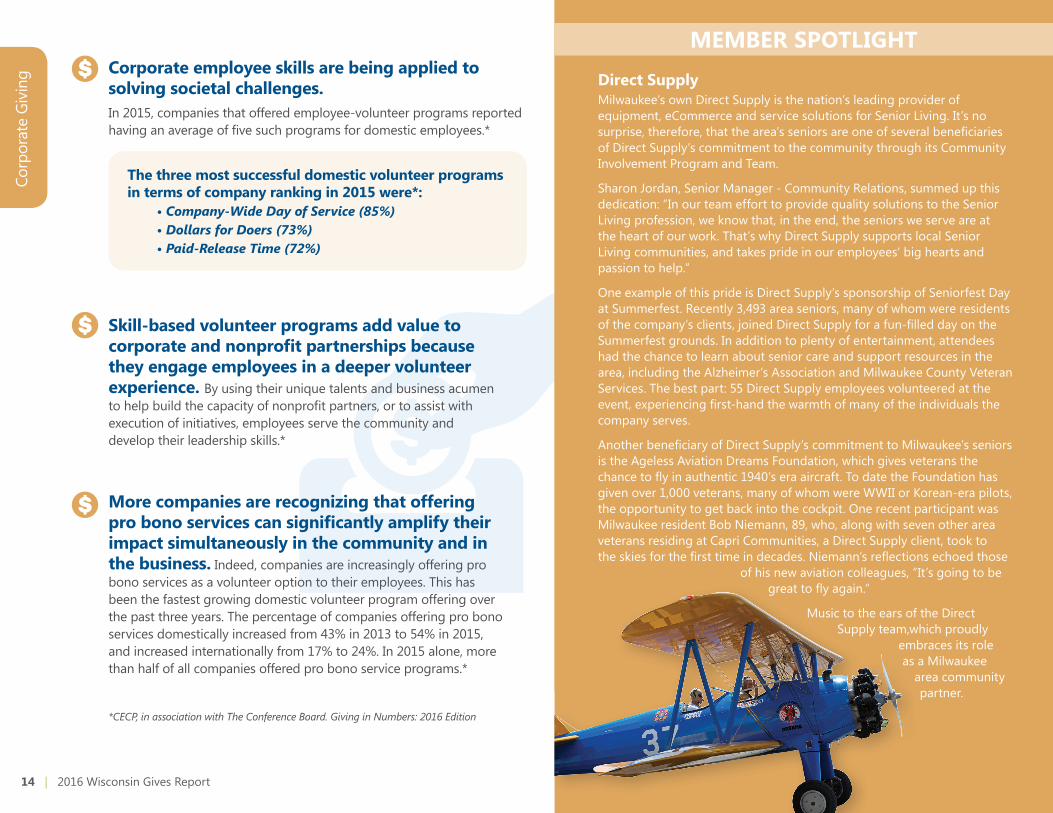
Direct SupplyMilwaukee’s own Direct Supply is the nation’s leading provider of equipment, eCommerce and service solutions for Senior Living. It’s no surprise, therefore, that the area’s seniors are one of several beneficiaries of Direct Supply’s commitment to the community through its Community Involvement Program and Team.
Sharon Jordan, Senior Manager - Community Relations, summed up this dedication: “In our team effort to provide quality solutions to the Senior Living profession, we know that, in the end, the seniors we serve are at the heart of our work. That’s why Direct Supply supports local Senior Living communities, and takes pride in our employees’ big hearts and passion to help.”
One example of this pride is Direct Supply’s sponsorship of Seniorfest Day at Summerfest. Recently 3,493 area seniors, many of whom were residents of the company’s clients, joined Direct Supply for a fun-filled day on the Summerfest grounds. In addition to plenty of entertainment, attendees had the chance to learn about senior care and support resources in the area, including the Alzheimer’s Association and Milwaukee County Veteran Services. The best part: 55 Direct Supply employees volunteered at the event, experiencing first-hand the warmth of many of the individuals the company serves.
Another beneficiary of Direct Supply’s commitment to Milwaukee’s seniors is the Ageless Aviation Dreams Foundation, which gives veterans the chance to fly in authentic 1940’s era aircraft. To date the Foundation has given over 1,000 veterans, many of whom were WWII or Korean-era pilots, the opportunity to get back into the cockpit. One recent participant was Milwaukee resident Bob Niemann, 89, who, along with seven other area veterans residing at Capri Communities, a Direct Supply client, took to the skies for the first time in decades. Niemann’s reflections echoed those
of his new aviation colleagues, “It’s going to be great to fly again.”
Music to the ears of the Direct Supply team,which proudly
embraces its role as a Milwaukee
area community partner.
More companies are recognizing that offering pro bono services can significantly amplify their impact simultaneously in the community and in the business. Indeed, companies are increasingly offering pro bono services as a volunteer option to their employees. This has been the fastest growing domestic volunteer program offering over the past three years. The percentage of companies offering pro bono services domestically increased from 43% in 2013 to 54% in 2015, and increased internationally from 17% to 24%. In 2015 alone, more than half of all companies offered pro bono service programs.*
Corporate employee skills are being applied to solving societal challenges. In 2015, companies that offered employee-volunteer programs reported having an average of five such programs for domestic employees.*
Skill-based volunteer programs add value to corporate and nonprofit partnerships because they engage employees in a deeper volunteer experience. By using their unique talents and business acumen to help build the capacity of nonprofit partners, or to assist with execution of initiatives, employees serve the community and develop their leadership skills.*
*CECP, in association with The Conference Board. Giving in Numbers: 2016 Edition
The three most successful domestic volunteer programs in terms of company ranking in 2015 were*: • Company-Wide Day of Service (85%) • Dollars for Doers (73%) • Paid-Release Time (72%)
Corp
orat
e G
ivin
gMEMBER SPOTLIGHT

2016 Wisconsin Gives Report | 15
CECP, in association with The Conference Board. Giving in Numbers: 2016 Edition
49%
46% 4% 50%
33% 18%
42% 23% 35%
39% 27% 34%
40% 34% 26%
45% 31% 24%
77% 10% 13%
54% 39% 7%
51% 44% 5%
53% 44% 3%
61% 37% 2%
All Companies
Communications
Consumer Staples
Health Care
Consumer Discretionaly
Technology
Energy
Materials
Industrials
Financials
Utilities
Direct Cash Foundation Cash Non-Cash
Industry Breakdown of Total Giving by Funding Type, Average Percentages, 2015
Within the Global CSR Study, most of the surveyed American consumers indicated that they would have a positive image of a company that supports a societal or environmental issue (91 percent) and would be willing to trust or be loyal to the company (both 87 percent). According to the 2015 Cone Communications Millennial CSR Study, Millennials are strong supporters of CSR efforts. The vast majority (91 percent) of surveyed Millennials reported that they would switch brands in support of one associated with a cause if both brands had similar price and quality.
Overall, the study revealed that how customers perceive a company’s motivation for CSR engagement strongly affects customers’ perception of price fairness. Specifically, when customers consider a company’s CSR activities being driven by intrinsic, altruistic motives, they tend to perceive a higher price fairness. This perception, in turn, leads to higher customer loyalty. By communicating the budget source of CSR involvement, companies help alleviate the negative effects that extrinsically motivated CSR engagement has on customers’ perception of price fairness.
Giving by corporations is estimated to have increased by 3.9 percent in 2015, totaling $18.45 billion (an increase of 3.8 percent, adjusted for inflation). Corporate giving includes cash and in-kind contributions made through corporate giving programs, as well as grants and gifts made by corporate foundations. Corporate foundation grantmaking is estimated to have totaled $5.43 billion in 2015, which was an increase of 5.4 percent (in current dollars) from 2014.*
Corporate Social Responsibility (CSR)
Eighty-four percent of Millennial employees made a charitable donation in 2014, 22 percent of whom reported that the gift was in response to a solicitation from employers. Seventy percent of Millennial employees volunteered in 2014, 45 percent of whom reported that these volunteer opportunities were either offered or promoted by employers.*
Industry Breakdown of Total Giving by Funding Type,Average Percentages, 2015
*GIVING USA 2016, Giving USA FoundationTM
GIVING USA 2016, Giving USA FoundationTM
Corporate Giving

16 | 2016 Wisconsin Gives Report
Wisconsin’s community foundations are one of our state’s best kept secrets. With a focus on addressing important needs in the areas they serve, their goal is to help their communities maintain and strengthen the quality of life for future generations.
It takes the generosity of many benefactors for these organizations to thrive. However, as a northern tier state with many of its residents either migrating elsewhere for the winter or moving away altogether, it can be troubling to see the state’s wealth leaving as well.
With that in mind, Wisconsin Philanthropy Network (WPN) is proud to be spearheading Endow Wisconsin, an exciting statewide initiative designed to enhance individual and corporate support at each of Wisconsin’s 19 nationally accredited community foundations.
Community foundations achieve National Standards for U.S. Community Foundations accreditation when they demonstrate adherence to best practices and effectiveness. It is rigorous, and a point of pride for the 19 that have earned this distinction. Donors can trust in these foundations to deliver with integrity.
Proposed as a tax credit, Endow Wisconsin is designed to encourage donors to keep dollars in Wisconsin, providing a valuable incentive for Wisconsinites to share a portion of their hard-earned assets with their home communities. Individuals and corporations who elect to contribute directly to a nationally accredited Wisconsin community foundation will receive a 25% tax credit for doing so.
Why does Wisconsin need to incentivize its residents to give? The snowbird effect is real: Demographic shifts can result in assets being channeled to other states rather than used to strengthen our state’s hometowns and neighborhoods. And, with approximately $687 billion projected to pass from one generation of Wisconsinites to the next over the next 50 years, keeping a portion of this wealth in Wisconsin through a powerful tax credit incentive presents a unique opportunity to grow assets that will enhance our communities.
Adoption of the tax credit has the potential to raise significant dollars for use in Wisconsin while requiring only a modest investment from
state revenue. Specifically, a three-million-dollar investment from the State of Wisconsin will leverage twelve million dollars to permanent endowments that support nonprofit organizations throughout our state.
Mirrored after the success of similar programs in other states – most notably Iowa – this is one of the most exciting opportunities ever created to build community foundation endowments, which, in turn, strengthen the nonprofits in our communities. Since its inception in 2003 – Endow Iowa has leveraged $191,585,801 in support of its statewide nonprofits though contributions made to permanent endowments at their community foundations.
Implementation of the Endow Wisconsin tax credit will:• Incent Wisconsinites to give more and have long-lasting impact
in our state.• Keep money in Wisconsin to address pressing needs of our residents.• Build nonprofit sustainability and support their charitable missions.• Strengthen the quality of life for Wisconsin residents.
Several members of WPN’s Endow Wisconsin taskforce met recently with Governor Scott Walker to discuss the benefits of implementing the tax credit in Wisconsin. Governor Walker, recognizing the significance of a program that would propel philanthropy in Wisconsin, pledged to support the inclusion of the Endow Wisconsin tax credit in the upcoming 2017 biennial budget. This is truly great news for Wisconsin and its residents as our state strives to remain a place where its residents, as well as future generations will choose to live, work and thrive!
Jill Van Calster President and CEO, Wisconsin Philanthropy Network
Curt Detjen President and CEO, Community Foundation for the Fox Valley Region Board Member, Wisconsin Philanthropy Network
For more information on the Endow Wisconsin Initiative, contact Jill Van Calster, WPN President and CEO; Caty Bulgrin, WPN Operations and Research Director, or a representative at your local, accredited community foundation. More information will be available after details of the 2017 biennial budget are released.
Philanthropy is a great thing. Philanthropy that pays the donor back is even better.
Com
mun
ity F
ound
atio
n G
ivin
g

2016 Wisconsin Gives Report | 17
We strengthen our communityfor current and future generations
by helping people make adifference in the lives of others.
Through the generosity of the people of Wisconsin’s Fox Valley Region, we have been able to award grants to nonprofit organizations totaling $240 million since 1986. People like the Stumpf family, who use their fund to buy electronics for students with disabilities. Our donors’ strong desire to give back has made us the second-largest certified community foundation in Wisconsin and among the top 10% nationally. We are fortunate to work with so many talented and caring people at certified community foundations across the state. In each of our communities, we work to make the quality of life the best it can be, now and for future generations.
Get in
cffoxvalley.org/Loop
A Community Foundation is a tax-exempt charitable organization that provides support primarily for the needs of the geographic community or region where it is based from funds that it maintains and administers on behalf of multiple donors.
Like a public charity, community foundations seek support from the general public, but like private foundations, they also provide grants. Due to their broad public support, however, the IRS does not consider community foundations to be private foundations.
Challenges community foundations feel their grantees have*:
}
}
}
Meeting needs/interests of clients/members
Recruiting new donors
Partnerships/collaborations with other nonprofits
Top3!
Largest Community Foundations in Wisconsin by Total Giving (2014)
Foundation Total Giving
1 Greater Milwaukee Foundation $32,497,642
2 Community Foundation for the Fox Valley Region, Inc. $16,287,944
3 Madison Community Foundation $9,977,107
4 Greater Green Bay Community Foundation, Inc. $4,197,891
5 Oshkosh Area Community Foundation $4,057,085
6 La Crosse Community Foundation $3,914,325
7 Racine Community Foundation, Inc. $2,598,756
8 Community Foundation of Southern Wisconsin, Inc. $2,137,193
9 St. Croix Valley Foundation $1,652,485
10 Community Foundation of North Central Wisconsin, Inc. $1,497,517
Foundation Center, 2016
Top10!
of WPN Grantmaker Survey respondents were from community foundations. All community foundations that responded indicated the importance of collaborating with other funders to achieve greater impact.26%
• In 2015, giving by community foundations increased 7.4 percent.
• Community foundations benefited from an increase of roughly 8.0 percent in their assets in 2014, as well as a similar increase in gifts received.GIVING USA 2016, Giving USA FoundationTM
*WPN Grantmaker Survey
18 | 2016 Wisconsin Gives Report
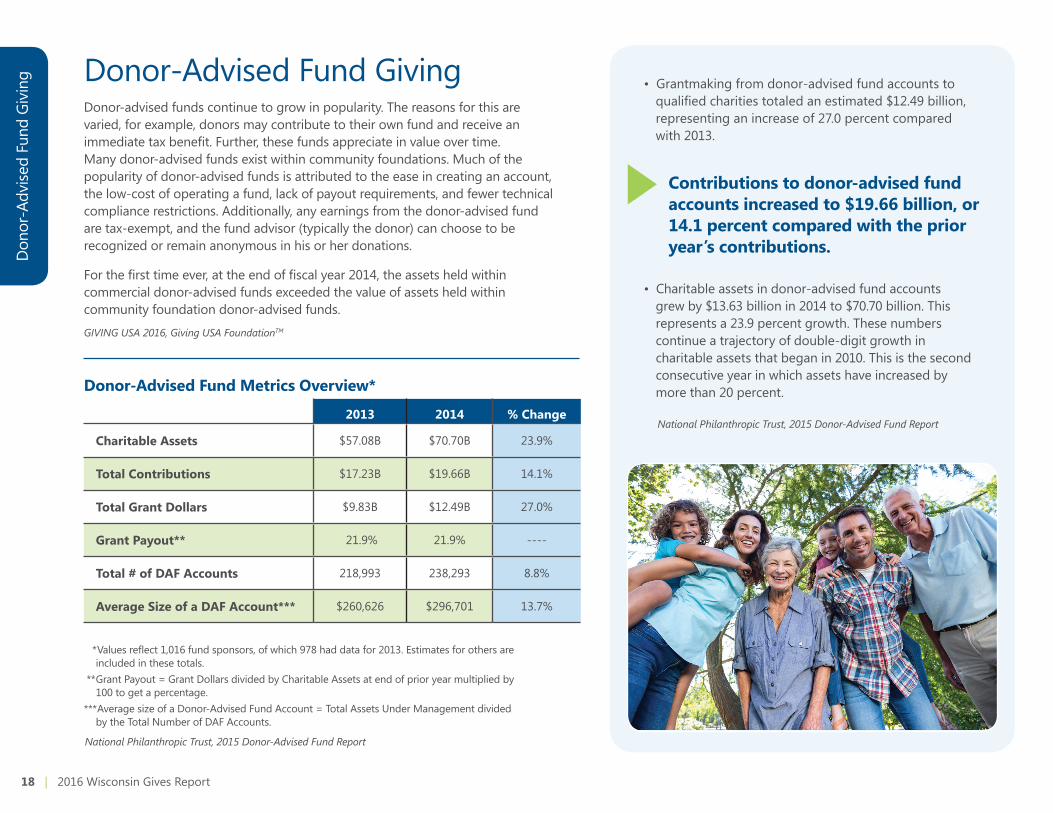
Donor-advised funds continue to grow in popularity. The reasons for this are varied, for example, donors may contribute to their own fund and receive an immediate tax benefit. Further, these funds appreciate in value over time. Many donor-advised funds exist within community foundations. Much of the popularity of donor-advised funds is attributed to the ease in creating an account, the low-cost of operating a fund, lack of payout requirements, and fewer technical compliance restrictions. Additionally, any earnings from the donor-advised fund are tax-exempt, and the fund advisor (typically the donor) can choose to be recognized or remain anonymous in his or her donations.
For the first time ever, at the end of fiscal year 2014, the assets held within commercial donor-advised funds exceeded the value of assets held within community foundation donor-advised funds.
Donor-Advised Fund Metrics Overview*
Don
or-A
dvise
d Fu
nd G
ivin
g Donor-Advised Fund Giving
2013 2014 % Change
Charitable Assets $57.08B $70.70B 23.9%
Total Contributions $17.23B $19.66B 14.1%
Total Grant Dollars $9.83B $12.49B 27.0%
Grant Payout** 21.9% 21.9% ----
Total # of DAF Accounts 218,993 238,293 8.8%
Average Size of a DAF Account*** $260,626 $296,701 13.7%
*Values reflect 1,016 fund sponsors, of which 978 had data for 2013. Estimates for others are included in these totals.
** Grant Payout = Grant Dollars divided by Charitable Assets at end of prior year multiplied by 100 to get a percentage.
*** Average size of a Donor-Advised Fund Account = Total Assets Under Management divided by the Total Number of DAF Accounts.
Contributions to donor-advised fund accounts increased to $19.66 billion, or 14.1 percent compared with the prior year’s contributions.
GIVING USA 2016, Giving USA FoundationTM
National Philanthropic Trust, 2015 Donor-Advised Fund Report
National Philanthropic Trust, 2015 Donor-Advised Fund Report
• Grantmaking from donor-advised fund accounts to qualified charities totaled an estimated $12.49 billion, representing an increase of 27.0 percent compared with 2013.
• Charitable assets in donor-advised fund accounts grew by $13.63 billion in 2014 to $70.70 billion. This represents a 23.9 percent growth. These numbers continue a trajectory of double-digit growth in charitable assets that began in 2010. This is the second consecutive year in which assets have increased by more than 20 percent.
2016 Wisconsin Gives Report | 19
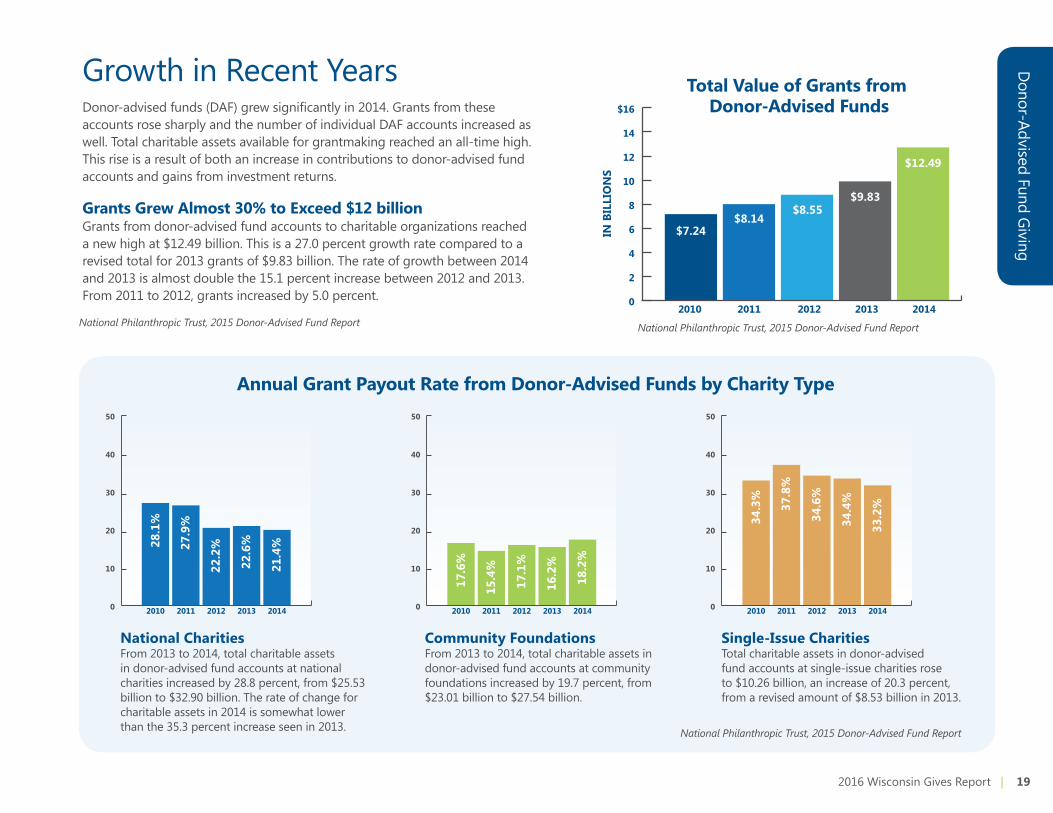
Growth in Recent YearsDonor-advised funds (DAF) grew significantly in 2014. Grants from these accounts rose sharply and the number of individual DAF accounts increased as well. Total charitable assets available for grantmaking reached an all-time high. This rise is a result of both an increase in contributions to donor-advised fund accounts and gains from investment returns.
Donor-Advised Fund G
iving
Grants Grew Almost 30% to Exceed $12 billionGrants from donor-advised fund accounts to charitable organizations reached a new high at $12.49 billion. This is a 27.0 percent growth rate compared to a revised total for 2013 grants of $9.83 billion. The rate of growth between 2014 and 2013 is almost double the 15.1 percent increase between 2012 and 2013. From 2011 to 2012, grants increased by 5.0 percent.
Annual Grant Payout Rate from Donor-Advised Funds by Charity Type
National CharitiesFrom 2013 to 2014, total charitable assets in donor-advised fund accounts at national charities increased by 28.8 percent, from $25.53 billion to $32.90 billion. The rate of change for charitable assets in 2014 is somewhat lower than the 35.3 percent increase seen in 2013.
Community FoundationsFrom 2013 to 2014, total charitable assets in donor-advised fund accounts at community foundations increased by 19.7 percent, from $23.01 billion to $27.54 billion.
Single-Issue CharitiesTotal charitable assets in donor-advised fund accounts at single-issue charities rose to $10.26 billion, an increase of 20.3 percent, from a revised amount of $8.53 billion in 2013.
28.1
%
27.9
%
22.2
%
22.6
%
21.4
%
2010 2011 2012 2013 2014
50
40
30
20
10
0
17.6
%
15.4
%
17.1
%
16.2
%
18.2
%
2010 2011 2012 2013 2014
50
40
30
20
10
0
34.3
%
37.8
%
34.6
%
34.4
%
33.2
%
2010 2011 2012 2013 2014
50
40
30
20
10
0
National Philanthropic Trust, 2015 Donor-Advised Fund Report
Total Value of Grants from Donor-Advised Funds
2010 2011 2012 2013 2014
$7.24$8.14
$8.55$9.83
$12.49
$16
14
12
10
8
6
4
2
0
IN B
ILLI
ON
S
National Philanthropic Trust, 2015 Donor-Advised Fund ReportNational Philanthropic Trust, 2015 Donor-Advised Fund Report

20 | 2016 Wisconsin Gives Report
Marshfield Area Community FoundationEstablished in 1993 by sisters Anne and Bette Adler, the Marshfield Area Community Foundation (MACF) has been improving the quality of life in Marshfield and its surrounding communities for 23 years. The long-term impact has been significant: To date the Foundation has provided $7.3 million in support of funds for the arts, education, the environment, animals, sports and leisure, youth development, human services and community development.
Nothing, however, had come close to the scope of the recently completed Marshfield Library and Community Center project. Identified as a need back in 1996 – the library needed more space and no longer supported current technology demands, while the existing senior center needed updating and more room – an ambitious plan emerged to replace the library with a state of the art facility, allowing the existing structure to be renovated into a multi-generational, multi-use community facility.
The price tag, however, was daunting: $9 million. Thus began Marshfield’s greatest ever community endeavor. The City pledged $3M; the rest would need to come from private donations. A grassroots committee was formed, and, in 2012, sought the expertise and support of MACF. Recognizing the value to the community, the Foundation board made it a priority, providing funding for several aspects of the program.
The response has been nothing short of phenomenal. To date, with 2,700 gifts ranging from $1-$1.3 million, over $6 million has been raised. After breaking ground 15 months ago, the technology-rich library celebrated its grand opening on November 13. The redesign for the community center is well underway, ultimately bringing the dream of the Marshfield Public Library and Community Center to fruition: a multi-use and integrated complex to address and meet the needs of Marshfield’s educational, social, personal and community development now and for future generations. And, perhaps most importantly, it exemplifies the collaborative role the MACF can play with the community to achieve a very ambitious goal.
Community FoundationsFrom 2013 to 2014, total charitable assets in donor-advised fund accounts at community foundations increased by 19.7 percent, from $23.01 billion to $27.54 billion.
Single-Issue CharitiesTotal charitable assets in donor-advised fund accounts at single-issue charities rose to $10.26 billion, an increase of 20.3 percent, from a revised amount of $8.53 billion in 2013.
Total Value of Charitable Assets in Donor-Advised Funds by Charity Type
National CharitiesFrom 2013 to 2014, total charitable assets in donor-advised fund accounts at national charities increased by 28.8 percent, from $25.53 billion to $32.90 billion. The rate of change for charitable assets in 2014 is somewhat lower than the 35.3 percent increase seen in 2013.
National Philanthropic Trust, 2015 Donor-Advised Fund Report
$12.
52 $15.
44 $18.
87
$25.
53
$32.
90
2010 2011 2012 2013 2014
$14.
85
$15.
64
$18.
42 $23.
01 $27.
54
2010 2011 2012 2013 2014
$6.2
4
$7.0
8
$7.5
5
$8.5
3
$10.
26
2010 2011 2012 2013 2014
Don
or-A
dvise
d Fu
nd G
ivin
gMEMBER SPOTLIGHT
35
30
25
20
15
10
5
0
35
30
25
20
15
10
5
0
35
30
25
20
15
10
5
0

Giving by independent foundations increased 6.0%GIVING USA 2016, Giving USA FoundationTM
2016 Wisconsin Gives Report | 21
Largest Independent Foundations in Wisconsin by Total Giving (2014)
Foundation Total Giving
1 The Lynde and Harry Bradley Foundation, Inc. $40,558,023
2 The Kern Family Foundation, Inc. $38,249,724
3 W. Jerome Frautschi Foundation $10,884,751
4 Bader Philanthropies $10,279,317
5 Reiman Foundation, Inc. $9,484,847
6 Fund for Wisconsin Scholars, Inc. $8,703,728
7 Theodore W. Batterman Family Foundation, Inc. $5,636,863
8 The Argosy Foundation $5,331,523
9 The Ronald & Joyce Wanek Foundation, Ltd. $5,101,307
10 Pat and Jay Baker Foundation, Inc. $4,771,000
Foundation Center, 2016
Top10!
Independent Foundation GivingIndependent Foundations are private foundations that often begin as a family foundation but are no longer controlled by the benefactor or the benefactor’s family. Most of the country’s largest foundations fall into this category.
Foundations with assets above $1 million distributed 7.2 percent of their assets, and foundations with assets less than $1 million distributed 13.2 percent.
Greater Green Bay Community FoundationCollective Impact: Organizations from different sectors solving a specific social problem using a common agenda. That was the goal of the Greater Green Bay Community Foundation (GGBCF) two years ago when it spearheaded the Achieve Brown County (ABC) collective impact initiative. GGBCF created the initiative following a study that concluded that improvements were needed if area K-12 graduates were to be more college and career ready.
GGBCF, together with the Brown County United Way and the Greater Green Bay Chamber of Commerce, brought together leaders in public and private Brown County schools, technical colleges and four-year colleges for this cradle to career initiative. Recognizing the solution would require resources beyond education, additional stakeholders were included representing health care, non-profits, businesses, and philanthropy with interests in workforce development, early childhood, and social welfare for all children.
The outcome of this partnership, ABC, amplifies the impact of existing organizations committed to helping children in Brown County. It provides a common framework for working together to measurably improve the safety, health and education of children from birth until they enter their careers. The program has a multisector governance system that provides an accountability structure focused on outcomes.
“It’s a more focused and aligned community effort on educational achievement, starting with early childhood and moving toward career readiness,” stated David Pamperin, GGBCF President and CEO. “The initiative is about changing the ways we do our work with all Brown County youth, which is what collective impact is all about. And, in our case, affecting change and continuous improvement to address children and efforts to help them become more successful in pursuing education and career goals, thus benefitting all in the community.”
The ABC website echoes this philosophy, “When kids are supported early on, the investment pays well into the future. When we provide stronger support for all children, we create a strong, more sustainable community.”
Collective impact at its best!
GIVING USA 2016, Giving USA FoundationTM
MEMBER SPOTLIGHT
22 | 2016 Wisconsin Gives Report
Wisconsin Philanthropy Network plays an important role in helping to build the capacity of its members. In turn, many WPN members award grants to nonprofit organizations to help them develop the institutional strength they need to perform effectively and produce results. Such grants vary in purpose: some support specialized training and technical assistance; some enable organizations to add staff, plan for succession, or measure performance; and still others focus on educating and engaging nonprofit board members in fundraising and policy governance.
Grants that support basic operations and administration are sometimes undervalued by funders as a means to build organizational capacity, yet general operating support may be the most fundamental way to invest in the capacity of nonprofits. Grants of this kind allow nonprofits to use the funds where they are most needed. General operating grants can lead to stronger organizations, improved performance, and better results.
Thanks to grantmaker associations like WPN and, more recently, GuideStar and Charity Navigator, appreciation of the actual value of general operating support is growing. Many individual and institutional donors are paying less attention to “overhead costs” and more attention to accountability and effectiveness. Recognizing that restricted project support seldom covers the actual cost of delivering high quality programs, more funders are making general operating grants. Yet, even as unrestricted funding strengthens organizations, some funders remain uneasy, largely because it is hard to monitor and measure the impact of such grants.
Decades ago, Paul Brest advanced the notion of “negotiated operating support.” Then the head of the William and Flora Hewlett Foundation,
Brest proposed “an approach to reconciling” the interests of nonprofits in maximizing flexible use of funds, and the interests of foundations in ensuring accountability and impact. His basic idea is this: in exchange for the freedom to decide how to deploy grant funds, the nonprofit organization establishes an explicit agreement with the funder about expected results and how they will be documented.
Of course, it takes energy and expertise to spell out expected results and reporting requirements. At the Zilber Family Foundation, however, we have found the investment of time and knowledge more than worthwhile. We have found that the grant negotiating process builds our capacity and that of the nonprofit organizations we support. We also have found that candid conversations about expectations, on both sides of the philanthropic table, helps reinforce the reciprocity and trust that are essential to good grantmaking.
Negotiated Operating Support Erin Frederick and Susan Lloyd, Ph.D. | Zilber Family Foundation
Fam
ily F
ound
atio
n G
ivin
g

2016 Wisconsin Gives Report | 23
Estimated charitable giving by individuals (and households) was $264.58 billion in 2015, an increase of 3.8% from 2014 (in current dollars). Adjusted for inflation, giving by individuals increased 3.7% in 2015.
Family Foundation GivingA Family Foundation is a private foundation that is usually created by a single individual or family and is governed at least in part by the donor or the donor’s family, descendants, or close associates. The foundation generally supports the donor’s personal charitable interests. Family foundations make up the largest proportion of grantmaking organizations, by far.
Family Foundation G
iving
Largest Family Foundations (Excluding Independent Foundations) in Wisconsin by Total Giving (2014)
Foundation Total Giving
1 Pollybill Foundation, Inc. $4,576,500
2 Joseph J. and Vera Zilber Family Foundation $4,406,903
3 David and Julia Uihlein Charitable Foundation, Inc. $4,326,500
4 The Nelson Family Foundation, Inc. $4,286,669
5 D.B. and Marjorie A. Reinhart Family Foundation $4,285,566
6 Rath Foundation, Inc. $3,937,491
7 J. J. Keller Foundation, Inc. $3,573,857
8 Eugene J. Eder Charitable Foundation, Inc. $3,400,000
9 The Cottrell Foundation $3,337,600
10 Fotsch Family Foundation $2,965,000
Foundation Center, 2016
Top10!
Individuals on the Forbes 400 are getting younger, with six more Millennials joining the ranks in 2015. In fact, there were 17 billionaires under the age of 40 on the list. Of the newcomers, one-third gained wealth through technology entrepreneurship.GIVING USA 2016, Giving USA FoundationTM
GIVING USA 2016, Giving USA FoundationTM
In 2015, the National Center for Family Philanthropy released results of the First National Benchmark Survey of Family Foundations. The center surveyed 341 family foundations about their size, structure, values, governance, and investment strategies. Results of the survey revealed that the majority of these foundations (70 percent) are relatively new, having been established after 1990. Younger foundations established after 2010 were more likely to report focusing on issues rather than geography in terms of their grantmaking. About 80 percent of family foundations created before 1970 reported making place-based grants, compared with 40 percent of newer family foundations.
GIVING USA 2016, Giving USA FoundationTM
Donors born before 1965 (Baby Boomers and older) continue to account for almost 70 percent of giving from individuals.
24 | 2016 Wisconsin Gives Report
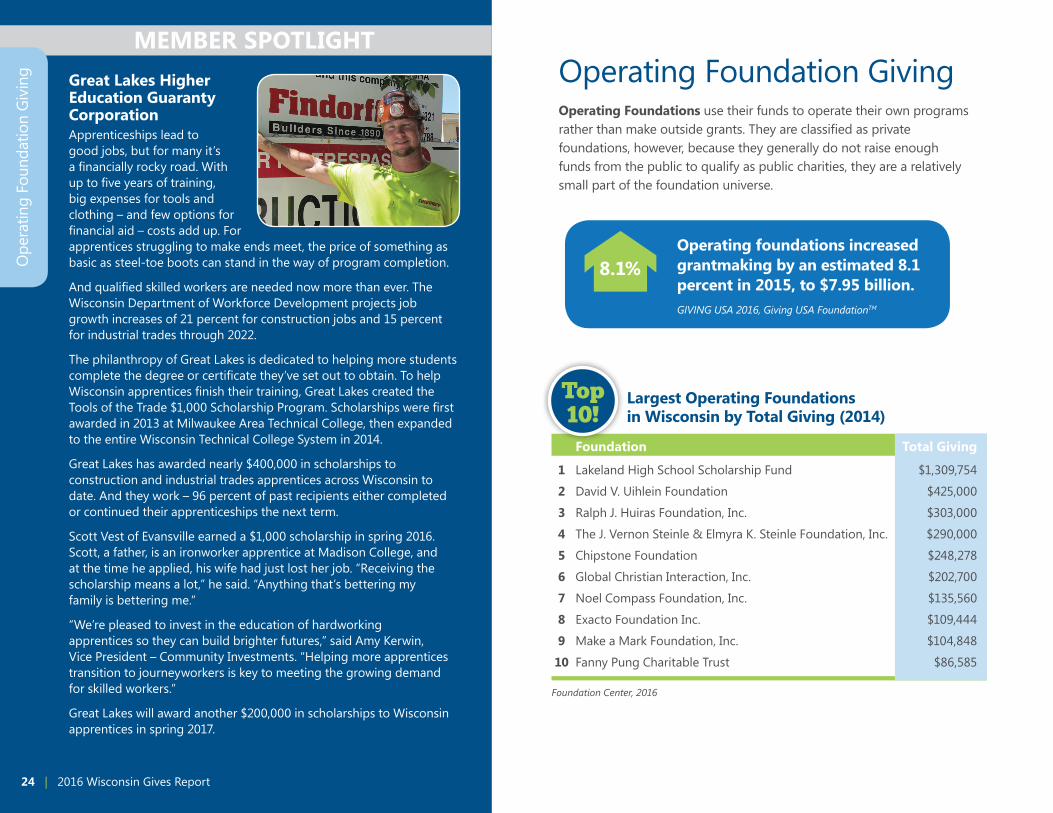
Great Lakes Higher Education Guaranty CorporationApprenticeships lead to good jobs, but for many it’s a financially rocky road. With up to five years of training, big expenses for tools and clothing – and few options for financial aid – costs add up. For apprentices struggling to make ends meet, the price of something as basic as steel-toe boots can stand in the way of program completion.
And qualified skilled workers are needed now more than ever. The Wisconsin Department of Workforce Development projects job growth increases of 21 percent for construction jobs and 15 percent for industrial trades through 2022.
The philanthropy of Great Lakes is dedicated to helping more students complete the degree or certificate they’ve set out to obtain. To help Wisconsin apprentices finish their training, Great Lakes created the Tools of the Trade $1,000 Scholarship Program. Scholarships were first awarded in 2013 at Milwaukee Area Technical College, then expanded to the entire Wisconsin Technical College System in 2014.
Great Lakes has awarded nearly $400,000 in scholarships to construction and industrial trades apprentices across Wisconsin to date. And they work – 96 percent of past recipients either completed or continued their apprenticeships the next term.
Scott Vest of Evansville earned a $1,000 scholarship in spring 2016. Scott, a father, is an ironworker apprentice at Madison College, and at the time he applied, his wife had just lost her job. “Receiving the scholarship means a lot,” he said. “Anything that’s bettering my family is bettering me.”
“We’re pleased to invest in the education of hardworking apprentices so they can build brighter futures,” said Amy Kerwin, Vice President – Community Investments. “Helping more apprentices transition to journeyworkers is key to meeting the growing demand for skilled workers.”
Great Lakes will award another $200,000 in scholarships to Wisconsin apprentices in spring 2017.
Operating Foundation GivingOperating Foundations use their funds to operate their own programs rather than make outside grants. They are classified as private foundations, however, because they generally do not raise enough funds from the public to qualify as public charities, they are a relatively small part of the foundation universe.
GIVING USA 2016, Giving USA FoundationTM
Operating foundations increased grantmaking by an estimated 8.1 percent in 2015, to $7.95 billion.
8.1%
Top10!
Largest Operating Foundations in Wisconsin by Total Giving (2014)
Foundation Total Giving
1 Lakeland High School Scholarship Fund $1,309,754
2 David V. Uihlein Foundation $425,000
3 Ralph J. Huiras Foundation, Inc. $303,000
4 The J. Vernon Steinle & Elmyra K. Steinle Foundation, Inc. $290,000
5 Chipstone Foundation $248,278
6 Global Christian Interaction, Inc. $202,700
7 Noel Compass Foundation, Inc. $135,560
8 Exacto Foundation Inc. $109,444
9 Make a Mark Foundation, Inc. $104,848
10 Fanny Pung Charitable Trust $86,585
Foundation Center, 2016
MEMBER SPOTLIGHTO
pera
ting
Foun
datio
n G
ivin
g

2016 Wisconsin Gives Report | 25
National Trends
• Total estimated charitable giving in the United States rose 4.1 percent between 2014 and 2015 (4.0 percent, adjusted for inflation), to $373.25 billion. This increase reflects growth in giving by all sources and all but one of the major recipient subsectors.*
• Giving by foundations increased 6.5 percent, to an estimated $58.46 billion in 2015 (an increase of 6.3 percent, adjusted for inflation).*
*GIVING USA 2016, Giving USA FoundationTM
4.1%
6.5%
National Trends
Sources of Contribution(in billions)
71%
16%
9%5%
Foundations$58.46
Individuals$264.58
Bequests$31.76
Corporations$18.45
3.8% Giving by Individuals$264.58 billion
6.5% Giving by Foundations$58.46 billion
2.1% Giving by Bequests$31.76 billion
3.9% Giving by Corporations$18.45 billion
GIVING USA 2016, Giving USA FoundationTM
(Reflects 101% due to rounding.)
Percent Increase in Giving by Source
The single largest contributor to the increase in total giving was $9.77 billion in Giving By Individuals (67 percent of the total change).

26 | 2016 Wisconsin Gives Report
Nat
iona
l Tre
nds
Giving to environmental and animal organizations is estimated to have increased 6.2 percent between 2014 and 2015, to $10.68 billion. Adjusted for inflation, donations to the environment/animals subsector increased 6.1 percent.*
120,136 total Charitable Foundations as
of May 2016 in the US.
As of May 2016, Foundation Search noted the existence of 120,136 charitable foundations. Of these foundations, 88,147 were private foundations and 1,074 were community foundations. The number of private foundations identified in Foundation Search’s database declined 2.7 percent since May 2015, and the number of community foundations declined 1.7 percent. An additional 1,447 foundations were company sponsored, while the remaining organizations were counted as public charities.
7.0%
Giving to foundations is typically volatile from year to year, reflecting both the economic climate and contributions of exceptionally large gifts by both living donors and estates. Revised giving estimates show that giving to foundations totaled $43.95 billion in 2014, rising 7.0 percent over 2013. This increase in giving to foundations follows an increase of 3.0 percent between 2012 and 2013 and a very large increase of 32.2 percent between 2011 and 2012.*
7.0%
6.2%
6.0%
Giving to public-society benefit organizations increased by an estimated 6.0 percent between 2014 and 2015, to $26.95 billion. Adjusted for inflation, giving to public-society benefit organizations grew 5.9 percent.*
GIVING USA 2016, Giving USA FoundationTM
*GIVING USA 2016, Giving USA FoundationTM
Giving to arts, culture, and humanities is estimated to have increased 7.0 percent between 2014 and 2015, to $17.07 billion. Adjusted for inflation, giving to the arts, culture, and humanities subsector increased 6.8 percent.*

2016 Wisconsin Gives Report | 27
For more than a century, National Guardian Life Insurance Company (NGL) has demonstrated our commitment to offer high-quality insurance products for people throughout the nation.
At NGL, our focus is people – from policyholders and their families to our employees and the communities in which we live and work.
Caring for our community is an important part of NGL’s business philosophy. We believe in giving back and making a difference through corporate and employee financial support and volunteer efforts.
Headquartered in Madison, Wis., NGL has been committed to guiding our customers as they plan for their financial future. We understand how important it is to have the right type insurance when it’s needed most.
As one of America’s most successful, independent mutual life insurance companies, NGL is licensed to do business in 49 states and the District of Columbia. Today, we operate in select niche markets, including preneed, individual life and annuities, as well as group markets, including specialty and student insurance.
To learn more about NGL, visit: nglic.com
WPN Board OfficersChairKaren WilkenKern Family Foundation
Vice ChairSteve Goldberg CUNA Mutual Group Foundation
SecretaryErin FrederickZilber Family Foundation
TreasurerKen RobertsonGreater Milwaukee Foundation
WPN Board DirectorsJulie BauerAlliant Energy Foundation
Marybeth CottrillNorthern Trust
Curt DetjenCommunity Foundation for the Fox Valley Region
Lisa HillerBader Philanthropies, Inc.
Amy KerwinGreat Lakes Higher Education Guaranty Corporation
Jason KohoutFoley & Lardner LLP
Kathryn LeverenzBrookhill Institute of Mathematics
Mary Anne Martiny – Past ChairFormerly of The Harley-Davidson Foundation
Jay ScottR.A. Stevens Foundation Prairie Springs: The Paul Fleckenstein Trust
National Guardian Life Insurance Company is not affiliated with The Guardian Life Insurance Company of America a/k/a The Guardian or Guardian Life. CIWGR102016

The 2016 Wisconsin Gives Report was generously supported by:
15850 W. Bluemound Road, Suite 204, Brookfield, WI 53005Ph: 262.317.6000 | Fx: 262.317.6001 | www.wiphilanthropy.org
![GivinG in indiana - Indiana Philanthropy Alliance · Indiana Philanthropy Alliance [Table 1-5] Top 10 Indiana Community foundations by Total Giving, 2011 Foundation Name City County](https://static.fdocuments.in/doc/165x107/5f818ef635b2c3400b096c48/giving-in-indiana-indiana-philanthropy-alliance-indiana-philanthropy-alliance.jpg)