
Capturing the Effects of Liquefaction- Induced Ground ... · Capturing the Effects of...
37
www.geerassociation.org Capturing the Effects of Liquefaction- Induced Ground Deformation Jonathan D. Bray, Ph.D., P.E., NAE Faculty Chair in Earthquake Engineering Excellence University of California, Berkeley
Transcript of Capturing the Effects of Liquefaction- Induced Ground ... · Capturing the Effects of...

www.geerassociation.org
Capturing the Effects of Liquefaction-Induced Ground Deformation
Jonathan D. Bray, Ph.D., P.E., NAE
Faculty Chair in Earthquake Engineering ExcellenceUniversity of California, Berkeley

Effects of the 1999 Kocaeli
Earthquake:Adapazari

Adapazari

City of Adapazari
Post-EQsSurveys
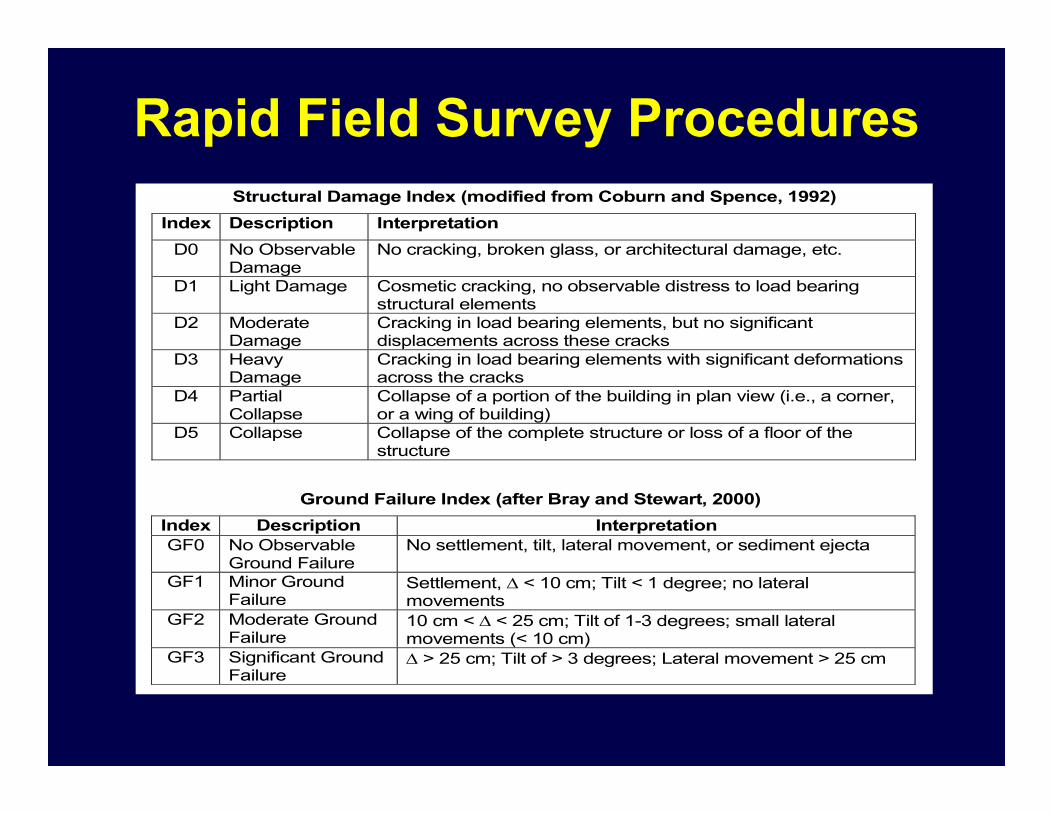
Rapid Field Survey Procedures
Structural Damage Index (modified from Coburn and Spence, 1992) Index Description Interpretation
D0 No Observable Damage
No cracking, broken glass, or architectural damage, etc.
D1 Light Damage Cosmetic cracking, no observable distress to load bearing structural elements
D2 Moderate Damage
Cracking in load bearing elements, but no significant displacements across these cracks
D3 Heavy Damage
Cracking in load bearing elements with significant deformations across the cracks
D4 Partial Collapse
Collapse of a portion of the building in plan view (i.e., a corner, or a wing of building)
D5 Collapse Collapse of the complete structure or loss of a floor of the structure
Ground Failure Index (after Bray and Stewart, 2000)
Index Description Interpretation GF0 No Observable
Ground Failure No settlement, tilt, lateral movement, or sediment ejecta
GF1 Minor Ground Failure
Settlement, < 10 cm; Tilt < 1 degree; no lateral movements
GF2 Moderate Ground Failure
10 cm < < 25 cm; Tilt of 1-3 degrees; small lateral movements (< 10 cm)
GF3 Significant Ground Failure
> 25 cm; Tilt of > 3 degrees; Lateral movement > 25 cm

0
1
2
3
2.6 2.8 3.0 3.2 3.4 3.6 3.8 4.0 4.2Distance (km)
Gro
und
Failu
re In
dex
West East
0
1
2
3
4
5St
ruct
ural
Dam
age
Inde
x
West East
1 Story
2 Stories
3 Stories
4 Stories
5 Stories
6 Stories
Damage Distribution along Line 1(60 Structures)
Bray & Stewart 2000
Collapse
Partial Collapse
Significant SE Damage
Minor SE Damage
Architectural Damage
No Damage
Severe Ground Failure ( > 25 cm)
Moderate Ground Failure (10 < < 25 cm)
Minor Ground Failure ( < 10 cm)
No Ground Failure

Sandy/Silty Boils
Unknown Depth, Thickness, Characteristics, and Lateral Extent of
Subsurface Soils
Surveys of building damage
Observations of ground failure
?
&
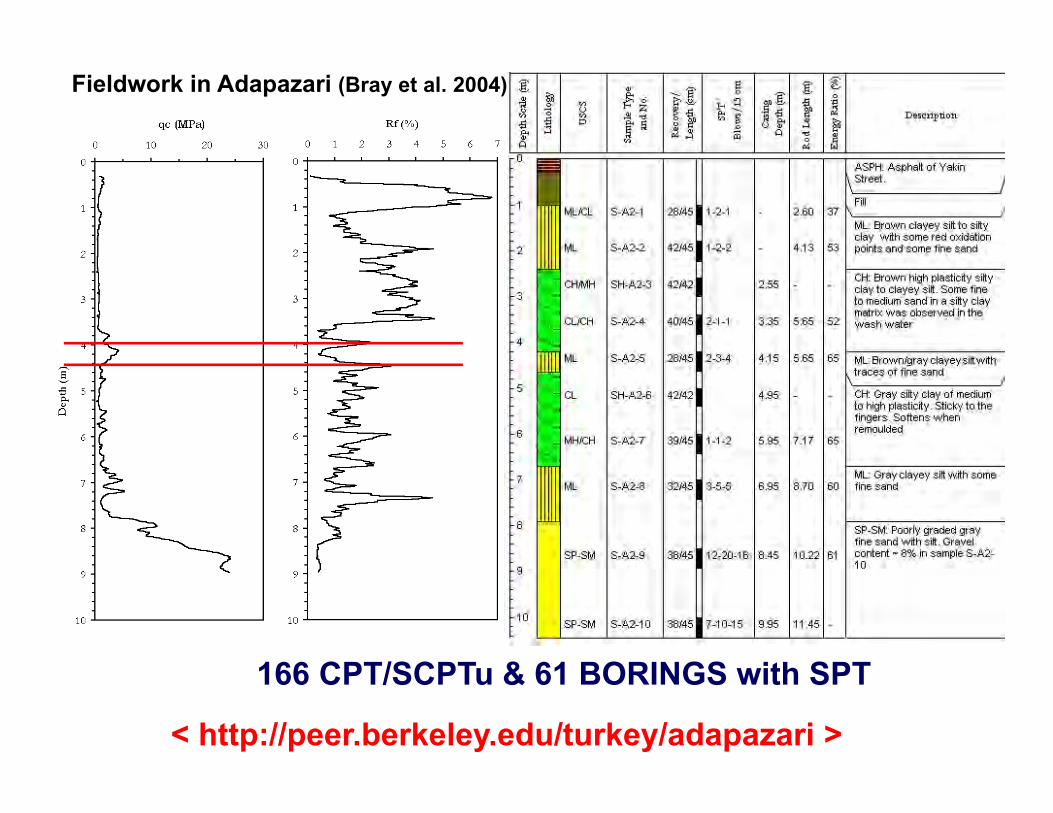
166 CPT/SCPTu & 61 BORINGS with SPT
< http://peer.berkeley.edu/turkey/adapazari >
Fieldwork in Adapazari (Bray et al. 2004)

FillML
CH/CL with some ML/SM layers
SM/ML
CLML CH CH
FillFillFill
CH/CL with some ML/SM layers
CH/CL with some ML/SM layers
Dense SP Dense SP
Dense SP
CL/ML
ML/CL
Generalized Soil Profiles of AdapazariType 1
Liq / LiqType 2
Liq / No LiqType 3
No Liq / LiqType 4No Liq
Sancio et al. 2002

Type 3
Soil
Type 4Type 1

0
1
2
3
2.6 2.8 3.0 3.2 3.4 3.6 3.8 4.0 4.2Distance (km)
Gro
und
Failu
re In
dex
West East
0
1
2
3
4
5St
ruct
ural
Dam
age
Inde
x
West East
1 Story
2 Stories
3 Stories
4 Stories
5 Stories
6 Stories
Damage Distribution along Line 1(60 Structures)Bray & Stewart 2000
Type 3 Type 4 Type 1(Liquefiable at Depth) (Not Liquefiable) (Liquefiable)

20
30
40
50
60
70
0 10 20 30 40 50 60 70Percent weight corresponding to 5m
Liqu
id L
imit
SusceptibleModerate SusceptibilityNot Susceptible
Susceptible if wc > 0.9LL
Not SusceptibleChinese Criteria
(Seed and Idriss 1982
in Youd et al. 2001)
New Liquefaction Susceptibility Criteria
PI & wc/LL Criteria(Bray & Sancio 2006)
Susceptible:
PI 12 & wc/LL ≥ 0.85
Moderate Susceptibility:
wc/LL > 0.8 & 12 < PI 20 0
10
20
30
40
50
0.4 0.6 0.8 1.0 1.2 1.4wc/LL
Pla
stic
ity In
dex
Susceptible to LiquefactionModerate SusceptibilityNot Susceptible

Effects of Ground Failure on Buildings – 2010 Chile EQ (Mw= 8.8)
Hospital in Curanilahue
from Building Plans

Building Displacement Measurements
Bray, Arduino, Hutchinson, & Maureira

Effects of Ground Failure on Buildings – 2010 Chile EQFour 8-Story Condominiums, Concepcion
Building Plans

Foundation Settlement and Building Damage
1o
Bray, Arduino, Hutchinson, & Maureira
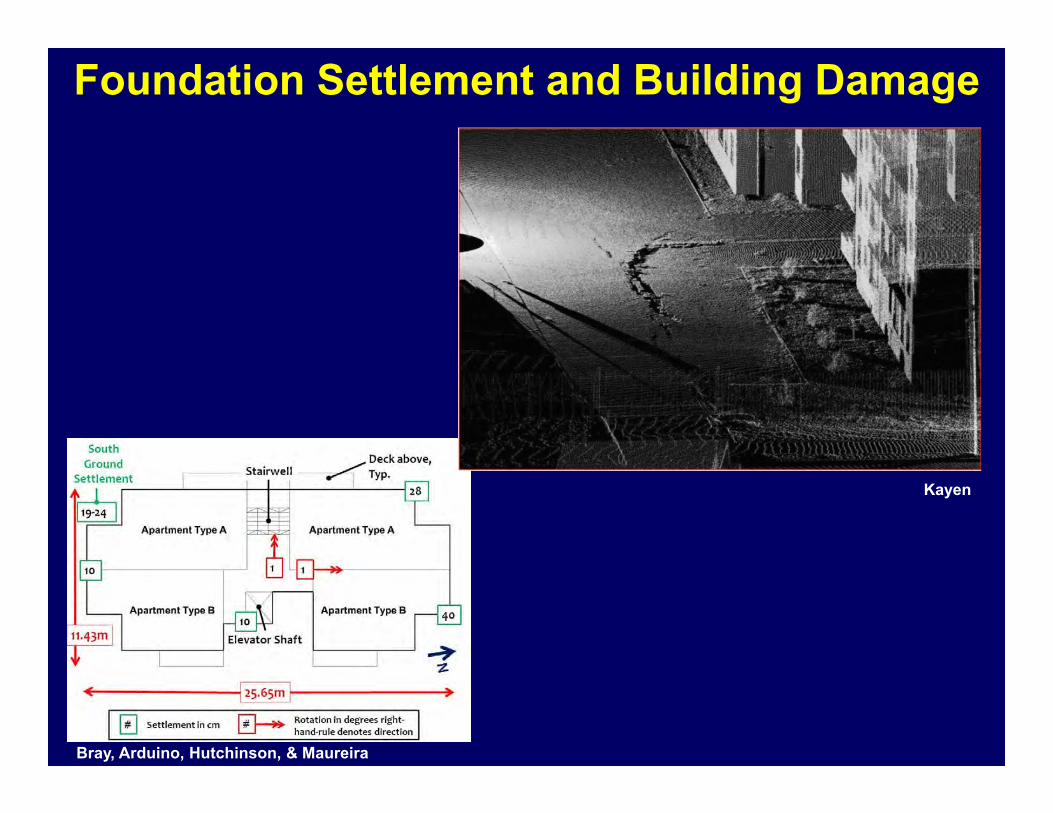
Foundation Settlement and Building Damage
Bray, Arduino, Hutchinson, & Maureira
Kayen

Liquefaction-Induced Building Movements2011 Tohoku, Japan EQ (Mw = 9.0)
Tokimatsu et al. & GEER ( Ashford et al. 2011)
30 cm 70 cm = 30 cm + 40 cm
40 cm

2010-11 Canterbury EQs: Widespread Liquefaction
Cubrinovski, Bray, Green, O’Rourke, Zupan, Taylor, Bradley et al.

Liquefaction Effects in Christchurch
From M. Cubrinovski

Permanent Ground Displacements (LiDAR)
Cubrinovski et al.

Ground Surveying Measurements (GSM)
Reference point
Displacement relative to the reference point
Captures details of local spreading features within 150 m (200 m) from the river.
Cubrinovski et al.

Liquefaction Effects on Structures
15 cm
1.8o
Tilting and Sliding of Buildings Settlement of Ground next to Piled Bldg.
30 cm
= 1/70
Cracking due to Differential Settlement Uniform Settlement of Building

CTUC BuildingLiquefaction-Induced Differential Settlement Induces Distress
GEER: Bray, Cubrinovski et al.
Building Settlement
Ejecta
Cracked Beam

CTUC BuildingLiquefaction-Induced Differential Settlement
GEER: Bray, Cubrinovski et al.
Building Settlement (cm)Maximum Angular Distortion ≈ 1 / 50
490
7811206
31
0
Settlement (cm)

CTUC Building: Christchurch EQ
2011 Christchurch EQ: Robertson & Wride (1998)
N
C C’

SSI Analyses of CTUC Building
FLAC Analyses with PM4Sand (Luque & Bray 2017)
Bearing Capacity Type of Failure
Shallow Loose SM/ML Layer
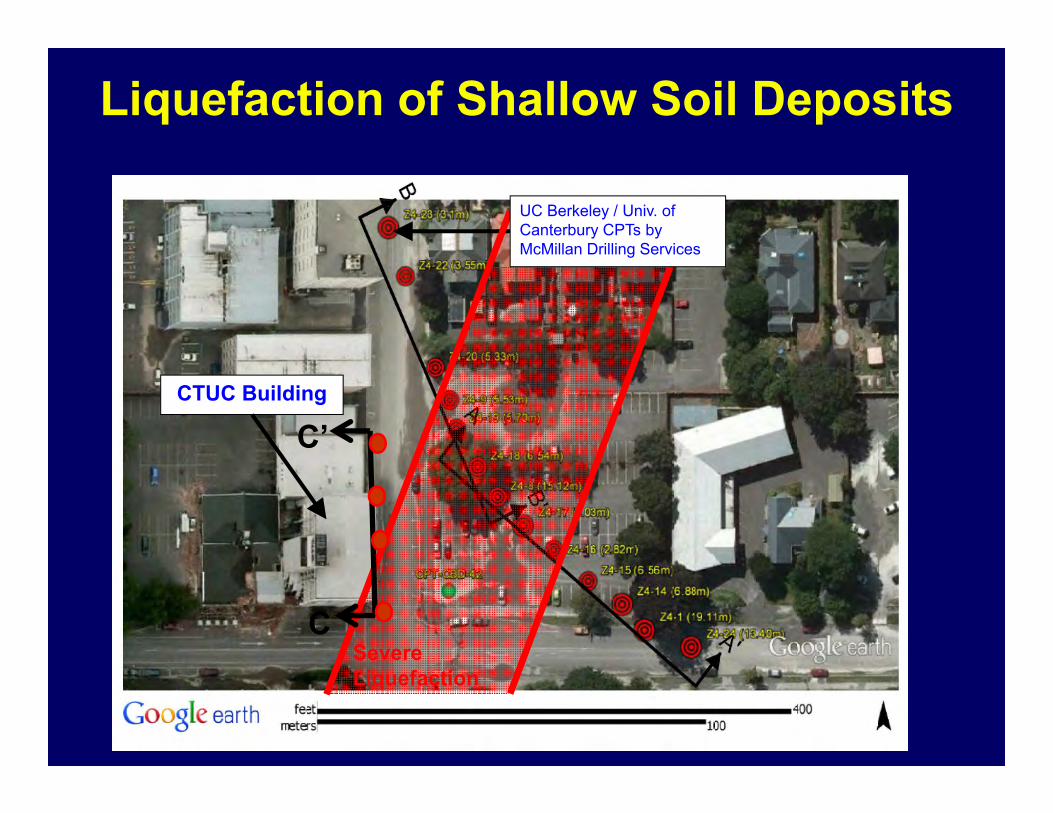
Liquefaction of Shallow Soil Deposits
CTUC Building
UC Berkeley / Univ. of Canterbury CPTs by McMillan Drilling Services
Severe Liquefaction
C
C’
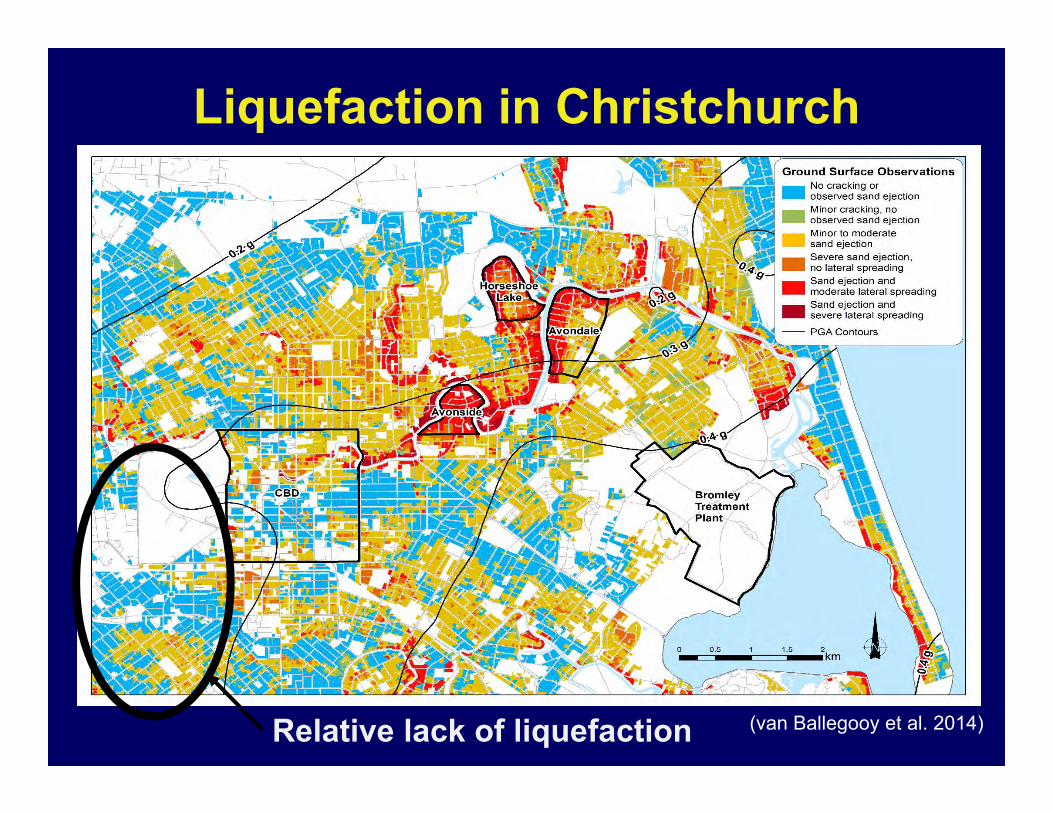
Liquefaction in Christchurch
(van Ballegooy et al. 2014)Relative lack of liquefaction

Non-Liquefaction of Silty Soil Sites
site where no liquefaction effects were observed;yet simplified procedures indicate liquefaction was expected
(from R. Wentz, Wentz-Pacific)
Site 23

Depositional Environment (Beyzaei et al.)
RAKAIA RIVER
WAIMAKARIRI RIVER
PORT HILLS
Canterbury Plains
1918 Photo from Christchurch: Swamp to City

Liquefaction Effects on Ports2016 Kaikoura EQ – CentrePort Wellington
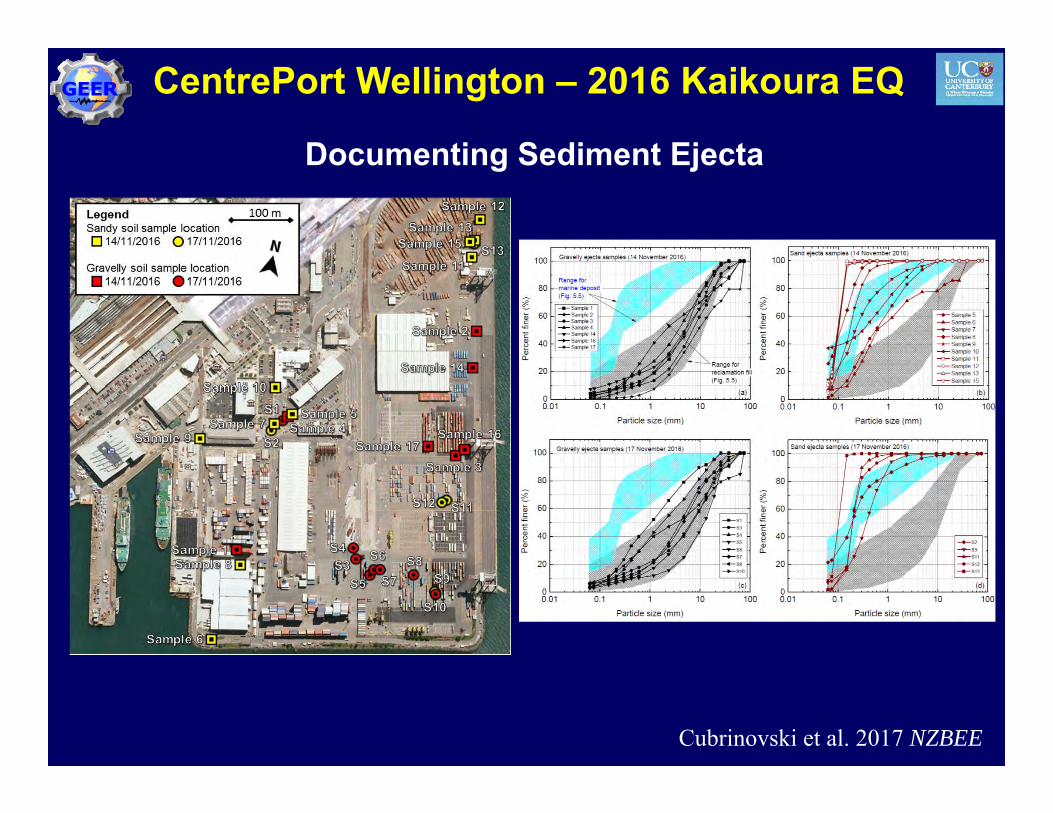
CentrePort Wellington – 2016 Kaikoura EQ
Documenting Sediment Ejecta
Cubrinovski et al. 2017 NZBEE

CentrePort Wellington – 2016 Kaikoura EQ Aerial Survey - Structure from Motion (Cardno)
Cubrinovski et al. 2017 NZBEE

CentrePort Wellington – 2016 Kaikoura EQ
Ground Survey – LiDAR (M. Olsen OSU)
2.5
2.7
2.9
3.1
3.3
3.5
3.7
3.9
‐60 ‐50 ‐40 ‐30 ‐20 ‐10 0
Elevation (m
)
Distance from Eastern Edge of Wharf Deck (m)
Cubrinovski et al. 2017 NZBEE

CentrePort Wellington – 2016 Kaikoura EQ Ground Surveys of Liquefaction-Induced Lateral Movements
02004006008001000
050100150200250300
Lateral G
roun
d Disp.
(mm)
Distance from Bulkhead (m)
TCW‐1
TCW‐2a
TCW‐2b
Cubrinovski et al. 2017 NZBEE

CentrePort Wellington – 2016 Kaikoura EQ Documenting Liquefaction-Induced Building Damage
Cubrinovski et al. 2017 NZBEE
survey by Bray & de la Torre


