Capture Pilot Final Report - ukccsrc.ac.uk
107
` Pre‐Feasibility Study for Establishing a Carbon Capture Pilot Plant in Mexico (World Bank Contract 7175527) Final Report by Nexant, Inc. In partnership with: Bechtel Corporation May 18, 2016
Transcript of Capture Pilot Final Report - ukccsrc.ac.uk

`
Pre‐Feasibility Study for Establishing a Carbon Capture Pilot Plant in Mexico (World Bank Contract 7175527)
Final Report
by Nexant, Inc.
In partnership with: Bechtel Corporation
May 18, 2016

Final Report: Pre‐Feasibility Study for Establishing a Carbon Capture Pilot Plant in Mexico 2
Disclaimer
This study report was prepared by Nexant under a contract with the World Bank. Neither Nexant nor any of its employees or team members make any warranty, express or implied, or assume any legal liability or responsibility for the accuracy, completeness, or usefulness of any information, apparatus, product, or process disclosed, or represent that its use would not infringe upon privately own rights. Reference herein to any specific commercial process, product or service by trade name, trademark, manufacturer, or otherwise, does not necessarily constitute or imply its endorsement, recommendation, or favoring by any entity identified herein.
Task 1, the Technology Evaluation Study, was performed, in part, based on information that was provided to Nexant under the terms of Non-Disclosure Agreements with several technology licensors. No third-party proprietary information and/or data are directly revealed in the report. In performing the study, Nexant had to adjust some of the data and fill in any missing information, thus rendering the study results and conclusions as only Nexant’s interpretation of the technologies.
While it is believed that the information contained in this report will be reliable under the conditions and subject to the limitations set forth herein, Nexant cannot guarantee the accuracy thereof. The views and opinions expressed herein and, in particular, in the documentation that constitute this study are specifically those of the authors of this study. The use of this report or any information contained therein shall be at the user’s own risk.

Executive Summary
Final Report: Pre‐Feasibility Study for Establishing a Carbon Capture Pilot Plant in Mexico 3
EXECUTIVE SUMMARY
E.1 PROJECT BACKGROUND
The subject study was performed as part of an ongoing World Bank funded project to develop
capacity for carbon capture, utilization and storage technology (CCUS) in Mexico. This project has
the overall objective of supporting Mexico’s Secretaria de Energia (SENER) and other Government of
Mexico (GoM) stakeholders with the implementation of the Mexican CCUS roadmap. The ultimate
goal is to successfully develop and deploy CCUS in the electricity and oil and gas industries in Mexico
as well as in others, such as iron and steel, cement and chemical industries.
An integral and critical part of this Mexican CCUS roadmap is the design, construction, and operation
of a CO2 capture pilot plant, which would demonstrate the potential and feasibility of capturing CO2
from natural gas combined cycle (NGCC) power plants in Mexico. This endeavor will create a
knowledge base for the various stakeholders and the experience gained from this study will
hopefully allow them to develop larger projects in the future and further advance the application of
CCUS in Mexico.
E.2 STUDY OBJECTIVES
The Nexant team was tasked to carry out a pre‐feasibility study to: 1) assess and recommend the
most appropriate commercially‐available post‐combustion capture technology for NGCC power
plants in Mexico, and 2) develop a conceptual design of a capture pilot plant to be located at the
250 MW Poza Rica NGCC generating station in the State of Veracruz. The pilot plant conceptual
design was to be developed with sufficient process details in order to enable the preparation of a
front end engineering design (FEED) package as part of a Phase II activity for the project. The FEED
preparation is not part of the current pre‐feasibility study.
It should be noted that initially another power plant, Dos Bocas, which is also located in the state of
Veracruz, was identified as a potential site for the study as well. However, the project team was
later informed that Dos Bocas would not be a suitable site, as the power plant is scheduled to be
shut down in 2018.
E.3 WORK SCOPE AND DELIVERABLES
The project work scope consists of five major tasks as follows:
Task 1 – Technology Selection, Evaluation and Recommendation of Best Available NGCC Post‐
Combustion CO2 Capture (PCC) Technologies
Subtask 1.1 ‐ Plant and Site Data Requisition and Preparation of a Study Design Basis
Subtask 1.2 – Project Kickoff Meeting and Site Visit
Subtask 1.3 – Technology Survey Questionnaire Preparation
Subtask 1.4 – Technology Screening, Evaluation and Selection
Task 2: Interim Report Meeting with Recommendations
Task 3: Pilot Plant Feasibility Design

Executive Summary
Final Report: Pre‐Feasibility Study for Establishing a Carbon Capture Pilot Plant in Mexico 4
Subtask 3.1 – CO2 Capture Pilot Plant Process Design
Subtask 3.2 – NGCC/PCC Integration
Task 4: Final Report
Task 5: Workshop
A copy of the Project Work Scope/Terms of Reference, as amended on September 25, 2015, is
included in Appendix B.
The Task 1 Report (delivered as part of Task 2) summarizes all work performed under Task 1. The
Task 1 results were presented at a project review meeting and workshop, which were organized by
the World Bank and SENER on January 27‐29, 2016.
The Task 3 report describes the work performed under Task 3 ‐ Pilot Plant Feasibility Design.
A final Workshop for the project, as Task 5 activity, was given to the World Bank and the GoM
stakeholders on May 11, 2016.
E.4 TASK 1 – TECHNOLOGY SELECTION, EVALUATION AND RECOMMENDATION OF BEST AVAILABLE PCC TECHNOLOGIES
E.4.1 Pre‐Screening and Selection of PCC Technologies
Based on previous work conducted by the US Department of Energy (USDOE) and Electric Power
Research Institute (EPRI) assessing the technology readiness level (TRL) of different types of PCC
technologies, as well as Nexant’s own assessment of current state‐of‐the‐art PCC technologies, the
Nexant team recommended to the World Bank that the pre‐feasibility design should be focused on
solvent‐based absorption processes. This recommendation was made in order to meet the World
Bank and the GoM team’s desire to build and complete operation of the Poza Rica NGCC pilot plant
by 2019, based on commercially‐available PCC technology for near term deployment. This
recommendation was discussed and accepted by the World Bank, SENER and the Comisión Federal
de Electricidad (CFE) representatives at the Project Kickoff (KO) meeting in the CFE office on October
27, 2015. A list of ten potential advanced solvent‐based absorption PCC technology
developers/licensors were collectively identified, selected and asked to participate in the study. Of
the ten PCC licensors contacted, six responded positively and were willing to participate while four
declined, for various reasons. Table E‐1 summarizes the PCC licensors’ responses.
Nexant developed a study Design Basis, based in part on the Poza Rica plant data that were provided
by CFE. Based on the study Design Basis, a Technology Survey Questionnaire was prepared to
collect process information from the six PCC technology developers. The responses received from
the questionnaire, supplemented with Nexant team’s in‐house knowledge, formed the basis for the
technology screening, evaluation and comparison of the processes.
Table E‐1 List of PCC Licensors Participation Responses

Executive Summary
Final Report: Pre‐Feasibility Study for Establishing a Carbon Capture Pilot Plant in Mexico 5
Accepted to Participate Declined to Participate
Alstom (Advanced Amine Process)
BASF
Fluor
HTC
MHI
Shell Cansolv
Aker Solutions
CO2 Solutions
Hitachi
Siemens
E.4.2 Overall NGCC Performance Before and After Full‐Scale PCC Retrofit
Nexant developed a reference generic 30% MEA‐based PCC process design to serve as a benchmark
for comparing the performance of the six PCC technologies participated in the study, assessing their
claimed improvement and filling in any missed data that are needed for their full‐scale Poza Rica
retrofit analysis. A companion power train model was also developed for the Poza Rica NGCC plant
to estimate its performance before and after full‐scale PCC retrofit. Figure E‐1 shows a simplified
flow scheme of the retrofitted plant and its PCC interfacing requirements.
Table E‐2 summarizes the overall Poza Rica plant performance and power balance before and after
PCC retrofitting, for the generic 30% MEA design, as well as the six proprietary PCC technologies. All
six of the proprietary amine‐based PCC technologies show a lower heat of regeneration compared
to generic 30% MEA, by about 20 to 25%. Within the group, however, the difference is rather small,
only ± 3%. As a result, all six technologies show an improvement in overall efficiency over the
generic 30% MEA based retrofitted Poza Rica plant – a loss of plant efficiency ranging from 8.4 to 9.3
percentage points instead of 9.9 percentage points.
E.4.3 Poza Rica NGCC PCC Retrofit Economic Evaluation Results
The six PCC technologies were compared and ranked using the Cost of Electricity (COE) as the figure‐
of‐merit to estimate Poza Rica’s potential economic penalty with CO2 capture. COE is a measure of
the revenue received per net MWh that provides the stipulated internal rate of return on equity
over the entire economic analysis period.
Table E‐3 shows the incremental COE for each of the PCC technologies retrofitted into the Poza Rica
NGCC plant. The various PCC licensors’ technologies were ranked for comparative purposes
according to their incremental COEs; the lower the incremental COE, the higher the ranking.

Executive Summary
Final Report: Pre‐Feasibility Study for Establishing a Carbon Capture Pilot Plant in Mexico 6
Figure E‐1 Post‐PCC Retrofit Poza Rica NGCC Simplified BFD
Existing NGCC, No Change Design & Cost by Nexant Design & Cost by PCC Licensor Design & Cost by Others
3 IdenticalSteam Turbines
Single GT/HRSG
HP SH Steam
CO2-Rich Flue Gas
Post-PCC Retrofit Poza Rica NGCC
GT/HRSG:1. 163 MW Siemen/Westinghouse GT2. 1,595 MMBtu(LHV)/Hr NG Firing3. 900 MMBtu/Hr HRSG Abs Duty4. 580,000 #/Hr HP Stm
Three Identical Siemen Stm Turb:1. 192,000 #/Hr HP SH Stm Each2. 1,100 psig/975 F HP SH Stm3. 27 MW Gross Pre-PCC Each
PCC Plant CO2 Recovery
PCC Plant CO2
Compression
LP CO2
S/CCO2
CO2-Lean Flue Gas Vent from Absorber top
Flue Gas Booster Blower
Other NGCC Plant Modifications:1. CW/CT Systems2. Raw & Filtered Water Systems3. RO/De-Ionized Water System 4. Electrical Distribution Systems5. Inter-Connecting Pipings
Super-CriticalCO2 to EOR Via
Pipeline
BP Power Recovery Turbine
LP Sat SteamCondensat
De-Superheater

Executive Summary
Final Report: Pre‐Feasibility Study for Establishing a Carbon Capture Pilot Plant in Mexico 7
Table E‐2 Poza Rica NGCC Pre‐PCC vs Post‐PCC Retrofit Performance Summary
See Note 1 Pre‐PCCGeneric 30%
MEA PCCAlstom BASF Fluor
HTC
PurenergyMHI Shell CanSolv
NGCC CO2 Emissions, MTPD (STPD) 2297 (2532) 345 (380) 328 (362) 344 (379) 229 (252) 346 (381) 346 (381) 342 (377)
Recovered CO2 Product, MTPD (STPD) 0 (0) 1952 (2152) 1969 (2170) 1953 (2153) 2068 (2280) 1951 (2151) 1951 (2151) 1955 (2155)
% CO2 Capture 0 85% 86% 85% 90% 85% 85% 85%
Power Balance, MW
Generation
Gas Turbine Gross Output 166.6 166.6 166.6 166.6 166.6 166.6 166.6 166.6
Steam Turbine Gross Output 82.5 39.6 49.6 49.4 46.0 46.7 49.2 49.4
Back Pressure Turbine 0 21.6 17 17 18 18 17 16.7
Total Gross Output 249.1 227.8 232.8 232.7 231.0 231.3 232.6 232.7
Auxiliary Consumption
Existing NGCC Plant Parasitic Loads 7.2 7.2 7.2 7.2 7.2 7.2 7.2 7.2
Flue Gas Blower 0 8.8 8.8 8.8 8.8 8.8 8.8 8.8
PCC + CO2 Compression + Plant Mods 0 16.1 17.3 14.1 16.6 14.0 15.7 14.2
Total New PCC Parasitic Load 7.2 32.0 33.3 30.1 32.5 29.9 31.7 30.1
Net Power Plant Export, MW 241.9 195.8 199.5 202.6 198.4 201.4 200.9 202.5
Delta Plant Export, MW ‐46.1 ‐42.4 ‐39.3 ‐43.4 ‐40.5 ‐41.0 ‐39.3
% Plant Export Reduction ‐19% ‐18% ‐16% ‐18% ‐17% ‐17% ‐16%
Net Plant Heat Rate, MJ/kWh (Btu/kWh) 6.94 (6584) 8.57 (8134) 8.42 (7984) 8.28 (7860) 8.46 (8025) 8.33 (7907) 8.35 (7926) 8.29 (7862)
Net Plant Efficiency, % LHV 51.8 42.0 42.7 43.4 42.5 43.2 43.1 43.4
Delta Plant Efficiency, percentage pt ‐9.9 ‐9.1 ‐8.4 ‐9.3 ‐8.7 ‐8.8 ‐8.4
Incremental Water Import, lpm (gpm) 0 (0) 1537 (406) 3058 (808) 1718 (454) 1618 (427) 1328 (351) 2561 (676) 1580 (417) Note 1: Values presented here are Nexant’s interpretation of the data provided by the PCC licensors.

Executive Summary
Final Report: Pre‐Feasibility Study for Establishing a Carbon Capture Pilot Plant in Mexico 8
Table E‐3 Incremental PCC Costs for Various Licensors
Generic
30% MEA
PCC Design Alstom
BASF /
Linde Fluor
HTC
Purenergy MHI
Shell
CanSolvCAPEX Estimate, $MM US USGCPCC Plant + CO2 Compression
[Note 2] 181.4 234.7 187.7 181.9 194.5 178.8 194.9
Flue Gas Blower 14.2 14.2 14.2 14.2 14.2 14.2 14.2
Poza Rica Plant Modifications 32.8 32.4 30.4 31.9 29.1 30.9 30.4
TOTAL 228.4 281.4 232.3 228.0 237.8 223.9 239.5
O&M Estimate, $MM US
Variable Costs [Note 3] 7.6 7.6 7.6 7.5 7.3 7.5 7.5
Fixed Costs 11.0 13.3 11.1 10.9 11.4 10.8 11.6
TOTAL 18.5 21.0 18.7 18.5 18.7 18.3 19.1
37.6 41.4 35.3 36.5 36.2 35.1 36.0N/A 6 2 5 4 1 3Ranking based on COE
Estimated Post‐Combustion CO2 Capture Costs
Incremental Costs to Poza Rica
NGCC without CO2 Capture
[Note 1]
Estimated Cost of Electricity
(COE), $/MWh [Note 4]
Note 1 ‐ Values presented here are Nexant’s interpretation of the data provided by the PCC licensors.
Note 2 ‐ All figures except Nexant’s 'Generic 30% MEA Design' are based on vendor‐provided data, which are considered proprietary.
Note 3 ‐ Major component is the amine replacement costs, which are considered proprietary.
Note 4 ‐ Incremental to estimated existing Poza Rica NGCC COE of $40.69/MWh

Executive Summary
Final Report: Pre‐Feasibility Study for Establishing a Carbon Capture Pilot Plant in Mexico 9
Figure E‐2 Incremental COEs for Various Licensors after CO2 Capture Rate Adjustment for Fluor
36.5
35.1 35.3 36.0 36.2
41.4
35.0
25
30
35
40
45
Fluor MHI BASF Shell CanSolv HTC Purenergy Alstom
Increm
ental COE, $/M
Wh
Incremental COE based on Licensors' DataIncremental COE Adjusted for 85% CO2 Capture for Fluor

Executive Summary
Final Report: Pre‐Feasibility Study for Establishing a Carbon Capture Pilot Plant in Mexico 10
E.4.4 Economic Evaluation Results after CO2 Capture Rate Adjustments
Table E‐2 shows the comparison of the six PCC technologies against 30% MEA, all at about 85% CO2
capture – except for Fluor. While Nexant’s questionnaire specified for a PCC design from the six
developers to capture 85% of the CO2 from Poza Rica plant flue gas, Fluor provided data based on a
capture rate of 90%. Nexant made the adjustments by pro‐rating Fluor’s total CO2 regeneration duty
from 90% to 85%; revising the PCC auxiliary power consumption, CO2 compression power
requirements and cooling duty; and reducing its costs accordingly. Figure E‐2 presents the revised
COEs graphically, before and after the CO2 capture rate adjustment for Fluor. With the adjustment,
the estimated COE is lower for Fluor compared to the other five PCC developers.
E.4.5 Conclusions and Recommendations
Within the level of data accuracy for the study, it would be reasonable to conclude that the top five
proprietary PCC technologies all have similar economic performance and it cannot be determined,
with certainty, that one is clearly superior to the others. If three ‘top of class’ candidates must be
chosen from the list based on their COE results, then these would have to be Fluor, MHI, and BASF,
as shown in Figure E‐2. However, final technology selection for future Poza Rica PCC implementation
would most likely need to take into other factors for consideration, such as process guarantee,
technology licensing fee, willingness to work with the GoM stakeholders to take on an active role in
the project, etc., as required.
The original Task 1 PCC technology evaluation objective was to select the best technology and then
have the technology licensor design and build a pilot plant to test the selected PCC process. This
means that only the selected amine technology can be tested due its proprietary nature. The Task 1
study results showed that it is not possible to choose the best PCC technology with any certainty
because there is very little performance and cost differences among the top few technologies. In
addition, there are almost no data regarding trace contaminant emissions, which can potentially
shut down a PCC process regardless of its performance or economic advantages.
Since none of the top proprietary PCC technologies stands out among the rest, and all of them are
amine‐based technologies that operate along the same basic principles as an MEA plant, therefore,
in order to proceed with the pilot plant design in Task 3, Nexant proposed that it be designed for
generic MEA, but with additional design features that grants it flexibility to allow for the testing and
validation of other amine‐based technologies. This recommendation was accepted by the World
Bank team, which subsequently amended the Terms of Reference (TOR) to accept a pilot plant
process design package based on generic MEA for Task 3, as shown in Appendix B.
E.5 TASK 3 – CO2 CAPTURE PILOT PLANT FEASIBILITY STUDY
E.5.1 Pilot Plant Size Selection
In order to proceed with the pilot plant design, an initial project task was to come up with a pilot
plant size agreeable to all parties. To facilitate that effort, Nexant performed an analysis and
presented the results showing the impacts of PCC pilot plant size on the Poza Rica NGCC plant

Executive Summary
Final Report: Pre‐Feasibility Study for Establishing a Carbon Capture Pilot Plant in Mexico 11
performance and its various support facility demands, at the Oct 5, 2015 meeting at CFE’s office in
Mexico City. Since the general consensus is that MEA‐based PCC is the least efficient option out of
the six near‐commercial PCC technologies which are all amine‐based, a pilot plant designed for MEA
should be able to accommodate testing the other technologies with minimal pre‐investment
modifications to the capture plant design.
After reviewing the integration requirement for PCC pilot plant sizes ranging from treating 1% to up
to 25% of the flue gas from the Poza Rica NGCC gas turbine (GT), Nexant recommended that the PCC
pilot plant be sized to treat no more than 5% of the GT flue gas flow based on maximum utilization
of existing NGCC support facilities without adding new capacities.
Nexant provided its recommendation and rationale for the 5% pilot plant size selection to the World
Bank on January 27, 2016. Because actual pilot plant capital cost can only be developed after pilot
plant size is defined and its design is carried out, only an estimated relative capital cost curve was
provided during the preliminary size selection evaluation. In addition, since pilot plant funding and
operational length were not defined at the January 27 meeting, Nexant’s 5% pilot plant size
recommendation was based only on the plant’s technical viability and its potential impacts on the
Poza Rica plant operations. While it is desirable to have a relatively large pilot plant with the ability
to better assess technology scale up, it was also recognized that costs (both CAPEX and O&M) can
be prohibitive with a large scale pilot plant.
After the January meeting, subsequent discussions between the World Bank and the Mexican
entities consisting of Instituto de Investigaciones Eléctricas (IIE), SENER, and CFE were held and, with
potential project funding constraints in mind, a decision was made to size the PCC pilot plant to
treat 1% of the Poza Rica plant flue gas.
E.5.2 MEA PCC Pilot Plant System Design
A PCC pilot plant for Poza Rica was designed as a Task 3 activity. The design is fully integrated into
the Poza Rica plant operations. The pilot plant process design package contains sufficient definition
to facilitate FEED preparation during Phase II of this project by an experienced engineering,
procurement, and construction (EPC) company to validate the feasibility of the pilot facility. The
pilot plant design includes only the CO2 capture facility, plus support facilities and modifications
needed for the existing Poza Rica NGCC plant to support the PCC pilot plant operations. Captured
CO2 is to be vented, so a CO2 compression facility is not included.
The PCC pilot plant is designed to treat 1% of the Poza Rica NGCC flue gas and recover 85% of the
contained CO2. A feasibility study process design package was developed containing the following:
Simplified process flow diagram and description
Major stream flow heat, material and utility balances
Preliminary plot plan
Major equipment list and preliminary datasheets
Executive Summary
Final Report: Pre‐Feasibility Study for Establishing a Carbon Capture Pilot Plant in Mexico 12
Specification of effluents
Description of integration requirements into the Poza Rica NGCC plant, and
Preliminary capital and operating cost estimates, including all catalysts and chemicals and utility
consumption estimates.
The pilot plant process scheme consists of three major processing steps: (1) Flue Gas Feed
Scrubbing, (2) Flue Gas CO2 Absorption, and (3) Amine Solution Regeneration. A total of three
operating scenarios were carried out. These were:
Design Case (Des) to size almost all pilot plant equipment. This represents an easily achievable
MEA operation that results in conservative equipment sizes.
Expected Operation Case (Exp) for expected pilot plant performances. This represents a
projected best achievable MEA operation based on Nexant’s past experiences with commercial
amine plants.
Absorber Inter‐Cooled Operation Case (IC) to size absorber inter‐cooling equipment. This
represents a projected achievable MEA operation based on a colder absorber bottom
temperature due to absorber interstage cooling.
The pilot plant process design details are summarized in the Task 3 Report and presented in Sections
8 through 13 of this Final Report.
E.5.3 Overall NGCC Performance Before and After PCC Pilot Plant Operation
The overall power balance, CW and CT loads of the Poza Rica NGCC with the PCC pilot plant design
case are summarized in Table E‐4. The existing pre‐PCC performance is shown for comparison
purposes. As can be seen from the summary table, due to the small size (1% flue gas slipstream) of
the pilot plant, the impact on overall NGCC plant operation is minimal.

Executive Summary
Final Report: Pre‐Feasibility Study for Establishing a Carbon Capture Pilot Plant in Mexico 13
Table E‐4 Overall NGCC Balance and Performance
Pre PCC
Post-PCC (Design
Operation)Flue Gas Feed and CO2 Recovery Rates: Flue Gas Feed Rate, mTPD (STPD) N/A 387 (427) CO2 in Pilot PCC Feed Gas, mTPD (STPD) N/A 23 (25) CO2 in Recovered, mTPD (STPD) N/A 20 (22) CO2 Recovery Rate, % 0 85%Steam Consumption Rates: Reboiler Steam (4.1bara/151°C), mTPD (STPD) N/A 40 (45) Reboiler Steam, ton/ton CO2 Recovered N/A 2.07Output at Generator Outlet, kW: Existing Siemens/Westinghouse GT 166,570 166,570 Existing Siemens Steam Turbine (Total for 3 operating) 82,500 82,272 Total Gross Generation 249,070 248,842Parasitic Loads, kW: Existing NGCC Loads 7,213 7,213 PCC Pilot Plant CO2 Capture Loads 0 162Total NGCC/PCC Electrical Loads 7,213 7,375
Net Poza Rica Power Export, kW 241,857 241,467 Power Export, kW -- -391
Poza Rica CW/CT Duty Breakdown: MEA PCC Pilot Plant Pre PCC
Post-PCC (Design
Operation)Existing NGCC CW/CT Duty, GJ/hr (MMBtu/hr) 666 (631) 662 (628)New PCC CW/CT Duty, GJ/hr (MMBtu/hr) 0 6 (5)Total Poza Rica CW/CT Duty, GJ/hr (MMBtu/hr) 666 (631) 668 (633)
Overall Poza Rica NGCC Performance: MEA PCC Pilot Plant
E.5.4 Emissions and Discharges
Air Emissions
The PCC pilot plant will emit treated flue gas from the top of the absorber column and separated
CO2 from the stripper overhead drum. Both of these gases may potentially contain VOC emissions,
stemming from the amine and its degradation products. A water wash section was designed at the
top of the absorber using all the recycled reboiler condensate as the washing medium to reduce the
amine content of the treated flue gas to less than 1 ppmV. The PCC pilot plant is designed to be able
to reduce the wash water flow in order to test the minimum wash water quantity required to meet
the amine emissions limit.

Executive Summary
Final Report: Pre‐Feasibility Study for Establishing a Carbon Capture Pilot Plant in Mexico 14
Nitrosamines and nitramines, both degradation products, are known carcinogens. The exact
concentrations of these degradation products in the emissions are unknown due to the lack of
published data. However, the pilot plant is set up to test for their concentrations in the treated flue
gas and CO2 vent with systems in place where gas samples can be taken for analytical measurement
to determine the emission levels.
Liquid Discharges
The PCC pilot plant uses steam from the NGCC plant to provide the reboiling duty to strip off the CO2
from the rich amine solution in the stripper column. The reboiler steam condensate is not returned
to the power plant, but rather used as wash water for the absorber and ultimately purged to the
waste water treatment facility. To operate the pilot plant, additional makeup water is required and
it has to go through the NGCC plant’s existing filtration and electrodialysis (ED) water treatment
systems, generating incremental waste that is also purged to the existing waste water facility for
treatment.
The reboiler condensate that is used for water wash removes most of the volatile and entrained
MEA in the treated flue gas. The wash water is expected to contain about 8 kg/h (18 lb/h) of MEA.
This water, depending on the power plant operator’s willingness, can be used as water makeup to
the MEA storage tank and/or as makeup water to the CT.
Solid Waste Discharge
The solid waste generated by the PCC pilot plant consists of reclaimer waste, spent activated carbon
and the spent filter media. These waste products are assumed to be hazardous and have to be
disposed of appropriately, most likely via incineration. A hazardous waste disposal company can be
contracted to collect and transport the solid waste to an incineration facility. It is recommended that
the PCC pilot plant operator approach PEMEX, which most likely has experience hiring waste
disposal companies to remove hazardous waste from their refineries, to gain access to such disposal
companies.
E.5.5 Poza Rica NGCC PCC Pilot Plant Cost Estimation
The capital cost of the MEA‐based PCC pilot plant is estimated, with a target accuracy of +/‐ 30
percent, using a major equipment (ME) factored estimation approach. Table E‐5 summarizes the
estimated capital cost for the PCC pilot plant.
The total capital cost includes cost allowances for the associated NGCC plant modifications and pilot
plant support facilities, which include the control and laboratory testing equipment plus trailer
costs. These are reported as single line cost items in in the cost estimate. Factoring in all of the
above‐mentioned costs, the estimated total plant cost (TPC) for the PCC pilot plant is about $22.1
million.

Executive Summary
Final Report: Pre‐Feasibility Study for Establishing a Carbon Capture Pilot Plant in Mexico 15
Table E‐5 MEA PCC Pilot Plant Estimated Total Plant Cost
Costs, $1,000 Total
Major Equipment Costs
Columns and Internals 1,794Vessels and Tanks 78Heat Exchangers 233Blowers 522Pumps and Drivers 234Others – MEA Filter Package 78Others – Soda Ash Package 10Others – Ductwork 194Freight 125
Total Major Equipment Costs 3,268Bulk Material Costs 5,938Total Direct Costs 9,206Construction Indirect Costs 1,818Total Field Costs 11,025
Startup Vendor Repre 272Home Office Costs 2,288Plant Mod Allowance 400Control, Lab and Admin Trailer Allowance 3,000
Total Constructed Cost w/o Contingency 16,985Contingency (30%) 5,096Total Plant Cost 22,081
The operating and maintenance (O&M) costs for the MEA PCC pilot plant are allocated as either
fixed or variable operating costs. Fixed O&M costs are essentially independent of the actual capacity
factor, number of hours of plant operation or amount of kilowatts produced. They consist mainly of
costs of employee salaries, taxes and insurances. Variable O&M costs are directly proportional to
the PCC pilot plant throughputs and include the purchase costs of the pilot plant’s process
consumables, catalysts and chemicals. Table E‐6 summarizes the estimated annual O&M costs and
percentage breakdown MEA PCC pilot plant.
The PCC pilot plant’s annual O&M cost is $2.5 million. The fixed O&M costs, at $2.1 million, make up
the bulk of these costs, at 84% of the total O&M costs. About half of the fixed O&M costs stem from
the operating labor and overhead costs, consisting of the wages paid to the PCC plant operators and
other staff. These costs total $1.1 million, equivalent to 53% of the total fixed O&M costs. The
remaining 47% of the fixed O&M costs consist of the maintenance labor and material, insurance and
property taxes, which are estimated based on a percentage of the PCC pilot plant’s capital cost.
The variable O&M costs make up the remaining 16% of the total incremental O&M costs, at about
$0.41 million. The process consumables total $0.16 million, while the catalysts and chemicals cost
$0.25 million. The export power losses make up almost all (98.5%) of the process consumables
costs. The costs of the other process consumables, i.e. the raw water import and waste water

Executive Summary
Final Report: Pre‐Feasibility Study for Establishing a Carbon Capture Pilot Plant in Mexico 16
disposal costs, are minimal (1.5%) compared to the export power losses. Similarly, the bulk of the
catalysts and chemicals costs consist of amine/additive makeup and disposal costs (89%), while the
water treatment chemicals and filter replacements are relatively minor costs (11%).
Table E‐6 Estimated O&M Costs for PCC Pilot Plant Operation
$1,000/year %
PROCESS CONSUMABLE COSTS (VARIABLE):
River Water Import 2.2 0.1
Process Waste Water Disposal 0.1 0.0
CO2 Product Export - -
Export Power Losses 156.2 6.1
TOTAL PROCESS CONSUMABLES 158.5 6.2
CATALYSTS & CHEMICAL COSTS (VARIABLE):
Water Treating Chemicals 18.7 0.7
PCC Amine/Additives Makeup & Disposal 223.1 8.8
PCC Carbon/Filters/Dessicant Replace & Disposal 7.4 0.3
TOTAL CAT & CHEMICALS 249.3 9.8
FIXED COSTS:
Operating Labor 744.0 29.2
Maintenance Labor 331.2 13.0
Maintenance Material 220.8 8.7
Overhead Charges 400.0 15.7
Insurance & Property Tax 441.6 17.3
TOTAL FIXED COSTS 2,137.6 84.0
TOTAL OPERATING & MAINTENANCE COST 2,545.4 100.0
Post-PCC (Design Operation)
Annual Operating Cost: MEA PCC Pilot Plant
Table of Contents
Final Report: Pre‐Feasibility Study for Establishing a Carbon Capture Pilot Plant in Mexico 17
EXECUTIVE SUMMARY ................................................................................................................... 3
E.1 PROJECT BACKGROUND .................................................................................................................. 3 E.2 STUDY OBJECTIVES ........................................................................................................................ 3 E.3 WORK SCOPE AND DELIVERABLES ............................................................................................... 3 E.4 TASK 1 – TECHNOLOGY SELECTION, EVALUATION AND RECOMMENDATION OF BEST AVAILABLE PCC TECHNOLOGIES ........................................................................................................... 4
E.4.1 Pre‐Screening and Selection of PCC Technologies ......................................................... 4 E.4.2 Overall NGCC Performance Before and After Full‐Scale PCC Retrofit ............................ 5 E.4.3 Poza Rica NGCC PCC Retrofit Economic Evaluation Results .......................................... 5 E.4.4 Economic Evaluation Results after CO2 Capture Rate Adjustments ............................ 10 E.4.5 Conclusions and Recommendations ............................................................................ 10
E.5 TASK 3 – CO2 CAPTURE PILOT PLANT FEASIBILITY STUDY ......................................................... 10 E.5.1 Pilot Plant Size Selection .............................................................................................. 10 E.5.2 MEA PCC Pilot Plant System Design ............................................................................ 11 E.5.3 Overall NGCC Performance Before and After PCC Pilot Plant Operation .................... 12 E.5.4 Emissions and Discharges ............................................................................................ 13 E.5.5 Poza Rica NGCC PCC Pilot Plant Cost Estimation ......................................................... 14
TASK 1 – TECHNOLOGY SELECTION, EVALUATION AND RECOMMENDATION OF BEST AVAILABLE PCC TECHNOLOGIES
1. INTRODUCTION ............................................................................................................ 26
1.1 PROJECT BACKGROUND ................................................................................................................ 26 1.2 STUDY OBJECTIVES ...................................................................................................................... 26 1.3 WORK SCOPE ............................................................................................................................. 26
2. PRE‐SCREENING OF CO2 CAPTURE TECHNOLOGIES ........................................................ 28
2.1 OVERVIEW OF CO2 CAPTURE TECHNOLOGY DEVELOPMENT ................................................................. 28 2.2 PRE‐SCREENING PCC TECHNOLOGIES .............................................................................................. 28 2.3 SELECTION OF PCC TECHNOLOGIES FOR DETAILED PROCESS EVALUATION ............................................... 32 2.4 PARTICIPATING PCC TECHNOLOGY LICENSORS .................................................................................. 33 2.5 QUESTIONNAIRE TO PARTICIPATING PCC LICENSORS .......................................................................... 33 2.6 QUESTIONNAIRE RESPONSES BY PCC LICENSORS ............................................................................... 34
3. DESIGN BASIS ............................................................................................................... 35
3.1 OBJECTIVE ................................................................................................................................. 35 3.2 OVERVIEW OF RETROFITTING POZA RICA NGCC FOR PCC .................................................................. 35 3.3 SITE‐RELATED CONDITIONS ........................................................................................................... 37 3.4 METEOROLOGICAL DATA .............................................................................................................. 37 3.5 PCC FEED AND PRODUCT PROPERTIES ............................................................................................ 37 3.6 PCC UTILITY REQUIREMENTS ........................................................................................................ 39 3.7 PROCESS WASTE STREAMS ........................................................................................................... 42 3.8 ENVIRONMENTAL AND EMISSIONS REQUIREMENTS ............................................................................ 42
4. TECHNOLOGY DESCRIPTION OF INTERESTED PCC LICENSORS ........................................ 43
4.1 ALSTOM ADVANCED AMINE PROCESS (AAP) ................................................................................... 43 4.2 BASF OASE® BLUE PROCESS ........................................................................................................ 46 4.3 FLUOR ECONAMINE FG PLUSSM ..................................................................................................... 50 4.4 HTC PURENERGY ........................................................................................................................ 53 4.5 MHI KM‐CDR PROCESS .............................................................................................................. 56 4.6 SHELL CANSOLV CO2 CAPTURE TECHNOLOGY ................................................................................... 59
Table of Contents
Final Report: Pre‐Feasibility Study for Establishing a Carbon Capture Pilot Plant in Mexico 18
5. INTEGRATION METHODOLOGY FOR FULL‐SCALE PCC WITH POZA RICA NGCC ............... 63
5.1 INTRODUCTION ........................................................................................................................... 63 5.2 EVALUATION METHODOLOGY ........................................................................................................ 65 5.3 EXISTING (PRE‐PCC RETROFIT) POZA RICA NGCC MODEL PERFORMANCE ............................................ 66
5.3.1 Steam Cycle Performance ............................................................................................ 66 5.3.2 Overall NGCC Balance and Performance ..................................................................... 68
5.4 PCC DESIGN BASIS AND QUESTIONNAIRE TO SELECTED LICENSORS ....................................................... 69 5.5 FULL‐SIZE 30% GENERIC MEA‐BASED PCC AND CO2 COMPRESSION DESIGN ........................................ 69 5.6 POST‐PCC RETROFIT POZA RICA NGCC MODEL PERFORMANCE .......................................................... 70
5.6.1 Steam Cycle Performance ............................................................................................ 70 5.6.2 Overall NGCC Balance and Performance ..................................................................... 72
5.7 NGCC PLANT MODIFICATIONS REQUIRED FOR PCC RETROFIT ............................................................. 73 5.8 PRELIMINARY POST‐30% MEA PCC RETROFIT PLOT LAYOUTS ............................................................ 74
5.8.1 Preliminary PCC Plot Layouts ....................................................................................... 74 5.8.2 PCC Equipment Placement/Integration Guidelines ..................................................... 75
5.9 POZA RICA NGCC PCC RETROFIT ECONOMIC EVALUATION BASIS ........................................................ 79 5.9.1 Incremental Capital Cost ............................................................................................. 79 5.9.2 Incremental Operating Cost ........................................................................................ 80 5.9.3 Economic Evaluation Figure‐of‐Merit .......................................................................... 82 5.9.4 Poza Rica NGCC Economics for Full‐Size Licensor PCC Retrofit .................................... 84
6. RESULTS OF FULL‐SCALE PCC INTEGRATION WITH POZA RICA NGCC ............................. 85
6.1 POZA RICA NGCC PRE‐ AND POST‐30% MEA PCC RETROFIT PERFORMANCE ....................................... 85 6.2 POZA LICENSOR RESPONSES CHECK AGAINST GENERIC 30% MEA ....................................................... 86 6.3 POZA RICA NGCC POST‐PCC RETROFIT PERFORMANCE EVALUATION FOR ALL LICENSORS ........................ 87 6.4 POZA RICA NGCC PCC RETROFIT ECONOMIC EVALUATION RESULTS .................................................... 90 6.5 ECONOMIC EVALUATION RESULTS AFTER CO2 CAPTURE RATE ADJUSTMENTS ......................................... 93 6.6 ECONOMIC EVALUATION RESULTS SENSITIVITY TO PCC CAPEX ........................................................... 96 6.7 ECONOMIC EVALUATION RESULTS SENSITIVITY TO REBOILING DUTY ...................................................... 98 6.8 ECONOMIC EVALUATION RESULTS SENSITIVITY TO NATURAL GAS PRICES ............................................. 100 6.9 ECONOMIC EVALUATION RESULTS SENSITIVITY TO ANNUAL ON‐STREAM FACTOR (AOF) ........................ 100 6.10 ESTIMATED PCC PLOT SPACE REQUIREMENTS ................................................................................ 103
7. SUMMARY AND CONCLUSIONS .................................................................................. 104
7.1 SUMMARY AND CONCLUSIONS ................................................................................................... 104 7.1.1 Design Analysis of Retrofitting Poza Rica Plant for Generic 30% MEA‐Based PCC .... 104 7.1.2 Comparison of Six Advanced Amine‐based PCC Technologies .................................. 105
7.2 PCC TECHNOLOGY LICENSORS’ REVIEW AND COMMENT .................................................... 106
TASK 3 – PILOT PLANT FEASIBILITY DESIGN
8. INTRODUCTION .......................................................................................................... 108
8.1 PROJECT BACKGROUND .............................................................................................................. 108 8.2 STUDY OBJECTIVES .................................................................................................................... 108 8.3 WORK SCOPE ........................................................................................................................... 108
9. DELIVERABLES ............................................................................................................ 110
10. PILOT PLANT DESIGN BASIS ........................................................................................ 111
10.1 OBJECTIVE ............................................................................................................................... 111 10.2 OVERVIEW OF RETROFITTING POZA RICA NGCC FOR PCC ................................................................ 111

Table of Contents
Final Report: Pre‐Feasibility Study for Establishing a Carbon Capture Pilot Plant in Mexico 19
10.3 SITE‐RELATED CONDITIONS ......................................................................................................... 113 10.4 METEOROLOGICAL DATA ............................................................................................................ 113 10.5 PCC FEED AND PRODUCT PROPERTIES .......................................................................................... 113 10.6 PCC UTILITY REQUIREMENTS ...................................................................................................... 115 10.7 PROCESS WASTE STREAMS ......................................................................................................... 118 10.8 ENVIRONMENTAL AND EMISSIONS REQUIREMENTS .......................................................................... 119
11. PILOT PLANT SIZE RECOMMENDATION ....................................................................... 121
11.1 INTRODUCTION .................................................................................................................... 121 11.2 PILOT PLANT INTEGRATION ARRANGEMENT AND SIZE SELECTION CRITERIA ........................ 121 11.3 DISCUSSIONS ........................................................................................................................ 123
11.3.1 Pilot Reboiler Steam Demands vs. HRSG IP and LP Steam Generation Capacity Consideration ....................................................................................................................... 123 11.3.2 Incremental Pilot PCC CW Loads vs. Existing NGCC CW/CT Capacity Consideration . 124 11.3.3 Net Power Export Loss ............................................................................................... 125 11.3.4 Incremental Raw Water Import Consideration ......................................................... 126 11.3.5 Pilot Plant Absorber Diameter vs. Transportation Limitation Consideration ............ 127 11.3.6 Relative Pilot Plant Capital Cost ................................................................................ 128 11.3.7 Pilot‐to‐Full Size PCC Plant Scale‐Up Factor Consideration ....................................... 129 11.3.8 Power and Potential CO2 Product Off‐take Option .................................................... 129
11.4 NEXANT’S RECOMMENDATIONS ................................................................................................... 129 11.5 FINAL PILOT PLANT SIZE ............................................................................................................. 130
12. PCC PILOT PLANT INTEGRATION METHODOLOGY AND EXISTING POZA RICA NGCC PERFORMANCE .......................................................................................................................... 131
12.1 INTRODUCTION ......................................................................................................................... 131 12.2 METHODOLOGY ........................................................................................................................ 131 12.3 EXISTING (PRE‐PCC RETROFIT) POZA RICA NGCC MODEL PERFORMANCE .......................................... 132
12.3.1 Steam Cycle Performance .......................................................................................... 132 12.3.2 Overall NGCC Balance and Performance ................................................................... 134
13. MEA PCC PILOT PLANT SYSTEM DESIGN ..................................................................... 136
13.1 INTRODUCTION ......................................................................................................................... 136 13.2 PCC PILOT PLANT OBJECTIVE ...................................................................................................... 136 13.3 PCC PILOT PLANT DESIGN CRITERIA AND ASSUMPTIONS .................................................................. 137 13.4 PCC PILOT PLANT RETROFIT ARRANGEMENT .................................................................................. 138 13.5 PCC PILOT PLANT PROCESS DESIGN METHODOLOGY ....................................................................... 140
13.5.1 Design (Des) Case Pilot Plant Operation .................................................................... 140 13.5.2 Expected (Exp) Case Pilot Plant Operation ................................................................ 146 13.5.3 Absorber Inter‐cooled (IC) Case Pilot Operation ........................................................ 152
13.6 PCC PILOT PLANT PROCESS FLOW DESCRIPTION ............................................................................. 158 13.7 DESIGN CASE EQUIPMENT DESCRIPTION ........................................................................................ 161 13.8 PROCESS DATA SHEETS FOR DESIGN CASE OPERATION ..................................................................... 171 13.9 PRELIMINARY PILOT PLANT SUPPORT FACILITY DESIGN ..................................................................... 171
13.9.1 Conceptual Pilot Plant Control Center ....................................................................... 171 13.9.2 Conceptual Pilot Plant Laboratory Facility ................................................................ 173
13.10 NGCC PLANT MODIFICATIONS REQUIRED FOR PCC PILOT PLANT INSTALLATION ................................... 174 13.11 PRELIMINARY PCC PILOT PLANT PLOT PLAN .................................................................................. 175
13.11.1 PCC Equipment Placement/Integration Guidelines .............................................. 175 13.11.2 Preliminary PCC Pilot Plant Layout ...................................................................... 175
Table of Contents
Final Report: Pre‐Feasibility Study for Establishing a Carbon Capture Pilot Plant in Mexico 20
14. OVERALL PILOT PLANT PERFORMANCE AND COST ESTIMATES ................................... 179
14.1 POZA RICA NGCC PERFORMANCE WITH PCC PILOT PLANT OPERATION .............................................. 179 14.1.1 Steam Cycle Performance .......................................................................................... 179 14.1.2 Overall NGCC Balance and Performance ................................................................... 181 14.1.3 Overall Water Balances ............................................................................................. 182 14.1.4 Emissions and Discharges .......................................................................................... 182
14.2 POZA RICA NGCC PCC PILOT PLANT COST ESTIMATION .................................................................. 183 14.2.1 Cost Estimation Basis ................................................................................................. 183 14.2.2 Capital Cost................................................................................................................ 184 14.2.3 Operating and Maintenance Costs ............................................................................ 187
14.3 PRELIMINARY ASSESSMENT OF SOCIAL, ENVIRONMENTAL AND HEALTH IMPACTS OF THE PCC PILOT PLANT 189 14.3.1 Operational and Social Impacts ................................................................................. 189 14.3.2 Environmental Impacts .............................................................................................. 190
15. PCC PILOT PLANT SPECIAL OPERATIONS DESCRIPTIONS .............................................. 192
15.1 STARTUP ................................................................................................................................. 192 15.2 HOT STANDBY OPERATION.......................................................................................................... 193 15.3 COLD STANDBY OPERATION ........................................................................................................ 194 15.4 SHUTDOWN ............................................................................................................................. 194
APPENDIX A ACRONYMS AND ABBREVIATIONS ...................................................................... 199
APPENDIX B PROJECT WORK SCOPE AND TERMS OF REFERENCE ............................................ 203
APPENDIX C QUESTIONNAIRE TO PCC LICENSORS ................................................................... 211
APPENDIX D DESIGN BASIS DOCUMENT .................................................................................. 223
APPENDIX E SUMMARY OF PCC LICENSORS’ QUESTIONNAIRE RESPONSES ............................. 271
APPENDIX F 30% MEA‐BASED PCC PLANT DESIGN FOR POZA RICA NGCC ................................ 285
APPENDIX G ALSTOM’S COMMENTS ....................................................................................... 291
APPENDIX H EQUIPMENT DATASHEETS ................................................................................... 292

Table of Contents
Final Report: Pre‐Feasibility Study for Establishing a Carbon Capture Pilot Plant in Mexico 21
FIGURES AND TABLES List of Tables Table E‐1 List of PCC Licensors Participation Responses .............................................................................. 4 Table E‐2 Poza Rica NGCC Pre‐PCC vs Post‐PCC Retrofit Performance Summary ........................................ 7 Table E‐3 Incremental PCC Costs for Various Licensors ................................................................................ 8 Table E‐4 Overall NGCC Balance and Performance .................................................................................... 13 Table E‐5 MEA PCC Pilot Plant Estimated Total Plant Cost ......................................................................... 15 Table E‐6 Estimated O&M Costs for PCC Pilot Plant Operation ................................................................. 16 Table 2‐1 DOE Technology Readiness Level (TRL) and Descriptions .......................................................... 29 Table 2‐2 List of PCC Licensors Participation Responses ............................................................................ 33 Table 3‐1 Site Conditions ............................................................................................................................ 37 Table 3‐2 Meteorological Data ................................................................................................................... 37 Table 3‐3 Poza Rica NGCC Flue Gas Composition and Flow Rate ............................................................... 38 Table 3‐4 Recovered CO2 Properties ........................................................................................................... 38 Table 3‐5 Poza Rica NGCC Plant Steam Conditions .................................................................................... 40 Table 3‐6 Poza Rica Cooling Tower Design Conditions ............................................................................... 41 Table 3‐7 Poza Rica Process Water Supply Conditions ............................................................................... 42 Table 3‐8 Environmental Targets ................................................................................................................ 42 Table 4‐1 Alstom AAP Operating Experience .............................................................................................. 44 Table 4‐2 BASF OASE® blue Operating Experience ..................................................................................... 47 Table 4‐3 Fluor’s Econamine FG PlusSM Operating Experience ................................................................... 50 Table 4‐4 HTC Purenergy PCC Operating Experience ................................................................................. 53 Table 4‐5 MHI KM‐CDR Process Operating Experience .............................................................................. 57 Table 4‐6 Shell Cansolv CO2 Capture Technology Operating Experience ................................................... 60 Table 5‐1 Existing Poza Rica NGCC Overall Balance and Performance ....................................................... 68 Table 5‐2 Post‐PCC Retrofit Poza Rica NGCC Overall Balance and Performance ....................................... 72 Table 5‐3 Generic 30% MEA‐based PCC Retrofit Capital Costs................................................................... 80 Table 5‐4 Generic 30% MEA‐based PCC Operating Costs ........................................................................... 81 Table 5‐5 Generic 30% MEA‐based PCC Retrofit CAPEX + 7 Year OPEX BEP .............................................. 82 Table 5‐6 Generic 30% MEA‐based PCC Retrofit COE ................................................................................. 83 Table 5‐7 Economic Assumptions Used to Determine CCF ........................................................................ 84 Table 6‐1 Poza Rica NGCC Pre‐PCC vs Post‐30% MEA PCC Retrofit Performance Summary ...................... 86 Table 6‐2 Selected Summary of PCC Licensor Responses Relative to Nexant 30% MEA PCC Case ............ 87 Table 6‐3 Poza Rica NGCC Pre‐PCC vs Post‐PCC Retrofit Performance Summary ...................................... 89 Table 6‐4 Incremental PCC Costs for Various Licensors .............................................................................. 91 Table 6‐5 Incremental PCC Costs for Various Licensors after CO2 Capture Rate Adjustment for Fluor ..... 94 Table 6‐6 Estimated PCC Plot Space Requirements .................................................................................. 103 Table 10‐1 Site Conditions ........................................................................................................................ 113 Table 10‐2 Meteorological Data ............................................................................................................... 113 Table 10‐3 Poza Rica NGCC Flue Gas Slipstream Composition and Flow Rate ......................................... 114 Table 10‐4 Recovered CO2 Properties ....................................................................................................... 115 Table 10‐5 Poza Rica NGCC Plant Steam Conditions ................................................................................ 117

Table of Contents
Final Report: Pre‐Feasibility Study for Establishing a Carbon Capture Pilot Plant in Mexico 22
Table 10‐6 Poza Rica Cooling Tower Design Conditions ........................................................................... 118 Table 10‐7 Poza Rica Process Water Supply Conditions ........................................................................... 118 Table 10‐8 Environmental Targets ............................................................................................................ 119 Table 12‐1 Existing Poza Rica NGCC Overall Balance and Performance ................................................... 134 Table 13‐1 Poza Rica NGCC MEA‐Based PCC Pilot Plant H&MB Table – Design Case Operation ............. 142 Table 13‐2 Poza Rica NGCC MEA‐Based PCC Pilot Plant Utility Consumption Summary Table – Design Case Operation ......................................................................................................................................... 144 Table 13‐3 Poza Rica NGCC MEA‐Based PCC Pilot Plant Catalysts and Chemicals Consumption Summary – Design Case Operation .............................................................................................................................. 145 Table 13‐4 Poza Rica NGCC MEA‐Based PCC Pilot Plant H&MB Table – Expected Case Operation ......... 148 Table 13‐5 Poza Rica NGCC MEA‐Based PCC Pilot Plant Utility Consumption Summary Table – Expected Case Operation ......................................................................................................................................... 150 Table 13‐6 Poza Rica NGCC MEA‐Based PCC Pilot Plant Catalysts and Chemicals Consumption Summary – Expected Case Operation .......................................................................................................................... 151 Table 13‐7 Poza Rica NGCC MEA‐Based PCC Pilot Plant HMB Table ‐ Absorber Inter‐Cooled Operation 154 Table 13‐8 Poza Rica NGCC MEA‐Based PCC Pilot Plant Utility Consumption Summary Table – Absorber Inter‐Cooled Operation ............................................................................................................................. 156 Table 13‐9 Poza Rica NGCC MEA‐Based PCC Pilot Plant Catalysts and Chemicals Consumption Summary – Absorber Inter‐Cooled Operation ............................................................................................................. 157 Table 13‐10 PCC Pilot Plant Major Equipment List ................................................................................... 162 Table 14‐1 Post‐PCC Pilot Plant Poza Rica NGCC Overall Balance and Performance ............................... 181 Table 14‐2 MEA PCC Pilot Plant Estimated Total Plant Cost ..................................................................... 186 Table 14‐3 Estimated O&M Costs for PCC Pilot Plant Operation ............................................................. 189

Table of Contents
Final Report: Pre‐Feasibility Study for Establishing a Carbon Capture Pilot Plant in Mexico 23
List of Figures
Figure E‐1 Post‐PCC Retrofit Poza Rica NGCC Simplified BFD ....................................................................... 6 Figure E‐2 Incremental COEs for Various Licensors after CO2 Capture Rate Adjustment for Fluor.............. 9 Figure 2‐1 EPRI Assessment of PCC Technologies....................................................................................... 31 Figure 2‐2 EPRI’s PCC TRL Ranking .............................................................................................................. 32 Figure 3‐1 Poza Rica NGCC Flow Configuration (with PCC and CO2 Compression/Dehydration) ............... 36 Figure 3‐2 Poza Rica NGCC HRSG/Steam Turbine Configuration ................................................................ 39 Figure 3‐3 Poza Rica NGCC Plant Existing Cooling Tower Arrangement ..................................................... 41 Figure 4‐1 Simplified Process Schematic of the Alstom AAP ...................................................................... 45 Figure 4‐2 Simplified Process Schematic of the BASF OASE® blue Process ................................................ 48 Figure 4‐3 Simplified Process Schematic of the Fluor Econamine FG PlusSM Process................................. 51 Figure 4‐4 Simplified Process Schematic of the HTC LCDesignTM ............................................................... 54 Figure 4‐5 Simplified Process Schematic of the HTC delta Reclaimer System ............................................ 56 Figure 4‐6 Simplified Process Schematic of the MHI KM‐CDR Process® ..................................................... 58 Figure 4‐7 Simplified Process Schematic of the Shell Cansolv PCC Plant ................................................... 61 Figure 5‐1 Post‐PCC Retrofit Poza Rica NGCC Simplified BFD ..................................................................... 64 Figure 5‐2 Existing Poza Rica NGCC Operation ........................................................................................... 67 Figure 5‐3 Existing Poza Rica NGCC Overall Water Balance ....................................................................... 69 Figure 5‐4 Post‐PCC Retrofit Poza Rica NGCC Operation ............................................................................ 71 Figure 5‐5 Post‐PCC Retrofit Poza Rica NGCC Overall Water Balance ........................................................ 73 Figure 5‐6 30% MEA PCC Plot Layout – Flue Gas Blower, MEA Tankage and CO2 Absorption Sections .... 76 Figure 5‐7 30% MEA PCC Plot Layout – CO2 Regeneration and Compression/Dehydration Section ......... 77 Figure 5‐8 Retrofitted Poza Rica NGCC with 30% MEA PCC Plot Plan ........................................................ 78 Figure 6‐1 Incremental PCC COEs for Various Licensors ............................................................................. 92 Figure 6‐2 Incremental COEs for Various Licensors after CO2 Capture Rate Adjustment for Fluor ........... 95 Figure 6‐3 Incremental COEs for Various Licensors with ±10% PCC CAPEX ............................................... 97 Figure 6‐4 Incremental COEs for Various Licensors after CO2 Regeneration Duty Adjustments ................ 99 Figure 6‐5 COE Sensitivity to Natural Gas Prices for Various PCC Licensors ............................................. 101 Figure 6‐6 COE Sensitivity to Annual On‐Stream Factor for Various PCC Licensors ................................. 102 Figure 10‐1 Poza Rica NGCC Flow Configuration (with PCC Pilot Plant) ................................................... 112 Figure 10‐2 Poza Rica NGCC HRSG/Steam Turbine Configuration ............................................................ 116 Figure 10‐3 Poza Rica NGCC Plant Existing Cooling Tower Arrangement ................................................. 118 Figure 11‐1 Conceptual PCC/NGCC Integration Scheme .......................................................................... 122 Figure 11‐2 CO2 Recovery vs Pilot Plant Size ............................................................................................ 123 Figure 11‐3 Reboiler Steam Extraction vs Pilot Plant Size ........................................................................ 124 Figure 11‐4 CW Loads vs Pilot Plant Size .................................................................................................. 125 Figure 11‐5 NGCC Export Power Loss vs. Pilot Plant Size ......................................................................... 126 Figure 11‐6 Incremental Raw Water Import vs Pilot Plant Size ................................................................ 127 Figure 11‐7 Absorber Diameter vs Pilot Plant Size ................................................................................... 128 Figure 11‐8 Relative Capital Cost vs Pilot Plant Size ................................................................................. 129 Figure 12‐1 Existing Poza Rica NGCC Operation ....................................................................................... 133 Figure 12‐2 Existing Poza Rica NGCC Overall Water Balance ................................................................... 135 Figure 13‐1 Post‐PCC Retrofit Poza Rica NGCC Simplified BFD ................................................................. 139 Figure 13‐2 Poza Rica NGCC MEA‐Based PCC Pilot Plant PFD – Design Case Operation .......................... 141 Figure 13‐3 Poza Rica NGCC MEA‐Based PCC Pilot Plant PFD – Expected Case Operation ...................... 147

Table of Contents
Final Report: Pre‐Feasibility Study for Establishing a Carbon Capture Pilot Plant in Mexico 24
Figure 13‐4 Poza Rica NGCC MEA‐Based PCC Pilot Plant PFD – Absorber Inter‐Cooled Operation ......... 153 Figure 13‐5 PCC Pilot Plant Control Room and Administration Trailers ................................................... 172 Figure 13‐6 PCC Pilot Plant Laboratory Trailers ........................................................................................ 174 Figure 13‐7 PCC Pilot Plant Layout ............................................................................................................ 177 Figure 13‐8 Aerial View of Poza Rica NGCC with PCC Pilot Plant .............................................................. 178 Figure 14‐1 Poza Rica NGCC Steam Cycle Performance with MEA PCC Pilot Plant in Operation (Design Case) .......................................................................................................................................................... 180 Figure 14‐2 Post‐PCC Retrofit Poza Rica NGCC Overall Water Balance .................................................... 182 Figure 15‐1 PCC Pilot Plant Startup Flow Diagram ................................................................................... 196 Figure 15‐2 PCC Pilot Plant Hot Standby Flow Diagram ........................................................................... 197 Figure 15‐3 PCC Pilot Plant Shutdown Flow Diagram ............................................................................... 198

Final Report: Pre‐Feasibility Study for Establishing a Carbon Capture Pilot Plant in Mexico 25
Task 1 – Technology Selection, Evaluation and
Recommendation of Best Available PCC Technologies

Task 1 Technology Selection and Evaluation
Final Report: Pre‐Feasibility Study for Establishing a Carbon Capture Pilot Plant in Mexico 26
1. INTRODUCTION
1.1 PROJECT BACKGROUND
The subject study is being performed as part of an ongoing World Bank funded project to develop
capacity for the carbon capture, utilization and storage technology (CCUS) in Mexico. The project
has the overall objective of supporting Mexico’s Secretaria de Energia (SENER) and other
Government of Mexico (GoM) stakeholders with implementation of the Mexican CCUS roadmap.
The ultimate goal is to successfully develop and deploy CCUS in the electricity, and oil and gas
industries in Mexico. An integral part of this Mexican CCUS roadmap is the design, construction, and
operation of a CO2 capture pilot plant, which would demonstrate the potential and feasibility of
capturing CO2 from natural gas combined cycle (NGCC) power plants in Mexico. This endeavor will
create a knowledge base for the various stakeholders and the experience gained from this study will
hopefully allow them to develop larger projects in the future and further advance the application of
CCUS in the Mexico.
1.2 STUDY OBJECTIVES
The Nexant team is tasked to carry out a pre‐feasibility study 1) to assess and recommend the most
appropriate commercially‐available post‐combustion capture technology for NGCC power plants in
Mexico, and 2) to develop a conceptual design of a capture pilot plant to be located at the 250 MW
Poza Rica NGCC generating station in the State of Veracruz. The pilot plant conceptual design is to
be developed with sufficient process details in order to enable the preparation of a front end
engineering design (FEED) package as a Phase II activity for the project. The FEED preparation is not
part of the current pre‐feasibility study.
It should be noted that initially, another power plant located in the State of Veracruz, Dos Bocas,
was also identified as a potential site for the study. However, the project team was later informed
that it would not be a suitable site, as it is scheduled to be shut down in 2018.
1.3 WORK SCOPE
The project work scope consists of the 4 major tasks. This report covers work completed under Task
1 and 2. To facilitate ease of reading, the report is structured differently from the task/subtask
orders. However, the section in the report that addresses each task/subtask is stated in parentheses
below:
Task 1 – Technology Selection, Evaluation and Recommendation of Best Available NGCC Post‐
Combustion CO2 Capture (PCC) Technologies
Subtask 1.1 ‐ Plant & Site Data Requisition and Preparation of a Study Design Basis
(Section 3)
Subtask 1.2 – Project Kickoff Meeting and Site Visit

Task 1 Technology Selection and Evaluation
Final Report: Pre‐Feasibility Study for Establishing a Carbon Capture Pilot Plant in Mexico 27
Subtask 1.3 – Technology Survey Questionnaire Preparation (Section 2 and Appendix C)
Subtask 1.4 – Technology Screening, Evaluation and Selection (Section 4, Section 5, Section 6,
Appendix D and Appendix E)
Task 2: Interim Report Meeting with Recommendation
Task 3: Pilot Plant Feasibility Study
Subtask 3.1 – CO2 Capture Pilot Plant Process Design
Subtask 3.2 – NGCC/PCC Integration
Task 4: Final Report
Task 5: Workshop

Task 1 Technology Selection and Evaluation
Final Report: Pre‐Feasibility Study for Establishing a Carbon Capture Pilot Plant in Mexico 28
2. PRE‐SCREENING OF CO2 CAPTURE TECHNOLOGIES
2.1 OVERVIEW OF CO2 CAPTURE TECHNOLOGY DEVELOPMENT
Over the last decade, there have been significant carbon capture and storage activities being
undertaken worldwide in both government and private sectors, with major programs taking place in
North America and Europe. A great deal of research and development (R&D) efforts have been
spent on developing advanced post‐combustion capture (PCC) technologies with the promise of
reducing the overall capture energy penalty and costs in comparison to the current state‐of‐the‐art
amine‐based 30% MEA (monoethanolamine) absorption technology.
In the U.S., for example, the Department of Energy (DOE) has a very active Carbon Capture Program
with the goals to develop second‐generation capture technologies that are ready for large‐scale
testing in 2020 and transformational technologies that are ready for large‐scale testing in 2030. A
good source of information regarding the current status of these R&D efforts can be found in a
recent U.S. DOE report1. Technologies that have been or are currently being investigated include not
only PCC processes, but CO2 capture processes associated with pre‐combustion and oxy‐combustion
systems as well. The knowledge gained and lessons learned from these findings could serve as a
valuable source of information, for both the World Bank and the GoM, to help with implementation
of the Mexican CCUS roadmap.
Electric Power Research Institute (EPRI), in close cooperation with U.S. DOE, is also very active in
PCC technologies, especially with the evaluation and status monitoring of various technologies that
were/are under development. EPRI published a report in 2007 entitled “Assessment of Post‐
Combustion Carbon Capture Technology Developments”2 in which it assessed the various PCC
technologies and processes that were under development. The technologies investigated included
absorption, adsorption, membrane, mineralization and biological capture. These assessments are
updated on a regular basis, the latest being a 2014 report3. This report is available at no cost to
EPRI’s funding members, or for a fee to the general public. Throughout the years, EPRI has also
reported their findings in various workshops and conferences4,5.
2.2 PRE‐SCREENING PCC TECHNOLOGIES
In their PCC technology development and evaluation, both the U.S. DOE and EPRI use the
Technology Readiness Level (TRL) as a scale to gauge a technology’s maturity and readiness for
1 Brickett, L., Shailesh, V., Indrikanti, P., et al. DOE/NETL Advanced Carbon Dioxide Capture R&D Program: Technology Update. May 2013 2 Freeman, B. Assessment of Post‐Combustion Carbon Capture Technology Developments, EPRI Report 1012796, Technical Update. February 2007 3 Post Combustion CO2 Capture Technology Development: 2014 Update, EPRI Report 002004592. October 2014 4 Rhudy, R. CO2 Capture Primer and Industry/EPRI Initiatives, SECARB Annual Meeting at Atlanta, GA, March 2009 5 Bhown, A. Carbon Capture R&D at EPRI. Carbon Capture Workshop, Stanford University, May 2011

Task 1 Technology Selection and Evaluation
Final Report: Pre‐Feasibility Study for Establishing a Carbon Capture Pilot Plant in Mexico 29
potential commercial deployment. In their 2012 Technology Readiness Assessment6, the U.S. DOE
defined the TRL methodology as a “systematic metric/measurement system that supports
assessments of the maturity of a particular technology and the consistent comparison of maturity
between different types of technology”. TRLs do not establish a pass/fail grade, but rather yield an
assessment of the technology development spanning progress from early research on basic
principles through service conditions and size needed for the technology to perform when it is
deployed or put into use. TRLs are particularly useful in establishing a consistent set of terminology
and a supporting evaluation process that can be used to benchmark a technology’s current state of
progress. By more clearly understanding the current state and assessing the degree of development,
the TRL methodology emerges as a useful tool in the planning of future research and development
activities.
The TRL approach was originally developed by the U.S. National Aeronautics and Space
Administration (NASA) for its Space Shuttle program and later adapted by the U.S. Department of
Defense (DoD) for use in its defense systems acquisition. Similarly, the U.S. DOE adapted the TRL
methodology to provide a comprehensive and consistent process for assessing the maturity of the
diverse portfolio of technologies currently under development. Table 2‐1 provides the TRL
definitions and descriptions used in the assessment.
Table 2‐1 DOE Technology Readiness Level (TRL) and Descriptions
TRL DOE Definition DOE Description 1 Basic principles observed and
reported
Lowest level of technology readiness. Scientific research begins to be
translated into applied R&D. Examples include paper studies of a
technology’s basic properties.
2 Technology concept and/or
application formulated
Invention begins. Once basic principles are observed, practical applications
can be invented. Applications are speculative and there may be no proof
or detailed analysis to support the assumptions. Examples are still limited
to analytic studies.
3 Analytical and experimental critical
function and/or characteristic proof
of concept
Active R&D is initiated. This includes analytical and laboratory‐scale
studies to physically validate the analytical predictions of separate
elements of the technology (e.g., individual technology components have
undergone laboratory‐scale testing using bottled gases to simulate major
flue gas species at a scale of less than 1 scfm).
4 Component and/or system
validation in a laboratory
environment
Bench‐scale prototype has been developed and validated in the laboratory
environment. Prototype is defined as less than 5% final scale (e.g.,
complete technology process has undergone bench‐scale testing using
synthetic flue gas composition at a scale of approximately 1–100 scfm).
5 Laboratory‐scale similar‐system
validation in a relevant environment
Basic technological components are integrated so that the system
configuration is matches the final application in almost all respects.
Prototype is defined as less than 5% final scale (e.g., complete technology
has undergone bench‐scale testing using actual flue gas composition at a
6 US DOE Office of Fossil Energy Clean Coal Research Program. 2012 Technology Readiness Assessment. December 2013

Task 1 Technology Selection and Evaluation
Final Report: Pre‐Feasibility Study for Establishing a Carbon Capture Pilot Plant in Mexico 30
scale of approximately 1–100 scfm).
6 Engineering/pilot‐scale prototypical
system demonstrated in a relevant
environment
Engineering‐scale models or prototypes are tested in a relevant
environment. Pilot or process‐development‐unit scale is defined as being
between 0 and 5% final scale (e.g., complete technology has undergone
small pilot‐scale testing using actual flue gas composition at a scale
equivalent to approximately 1,250–12,500 scfm)
7 System prototype demonstrated in
a plant environment
This represents a major step up from TRL 6, requiring demonstration of an
actual system prototype in a relevant environment. Final design is virtually
complete. Pilot or process‐development‐unit demonstration of a 5–25%
final scale or design and development of a 200–600 MW plant (e.g.,
complete technology has undergone large pilot‐scale testing using actual
flue gas composition at a scale equivalent to approximately 25,000–62,500
scfm).
8 Actual system completed and
qualified through test and
demonstration in a plant
environment
The technology has been proven to work in its final form and under
expected conditions. In almost all cases, this TRL represents the end of
true system development. Examples include startup, testing, and
evaluation of the system within a 200–600 MW plant CCS/CCUS operation
(e.g., complete and fully integrated technology has been initiated at full‐
scale demonstration including startup, testing, and evaluation of the
system using actual flue gas composition at a scale equivalent to
approximately 200 MW or greater).
9 Actual system operated over the full
range of expected conditions
The technology is in its final form and operated under the full range of
operating conditions. The scale of this technology is expected to be 200–
600 MW plant CCS/CCUS operations (e.g., complete and fully integrated
technology has undergone full‐scale demonstration testing using actual
flue gas composition at a scale equivalent to approximately 200 MW or
greater).
In their PCC technology assessment efforts, EPRI uses a virtually identical TRL methodology to rank
the commercial deployment readiness of a technology, also using a scale of 1 to 9. As illustrated in
Figure 2‐1 a TRL of 1 to 3 is indicative that the technology is only at its infancy, i.e., concept
development and laboratory testing; with a TRL of 4 to 7, it may have gone through bench‐scale
testing; and only at a TRL of 8 to 9 has the technology proved itself with a large‐scale pilot plant
testing and is deemed commercially deployable.

Task 1 Technology Selection and Evaluation
Final Report: Pre‐Feasibility Study for Establishing a Carbon Capture Pilot Plant in Mexico 31
Figure 2‐1 EPRI Assessment of PCC Technologies
In its assessment of over 129 PCC technologies, at various levels of development, EPRI concluded
that: (a) most of the technologies are only at a TRL scale of 2 to 4, and (b) only a handful of the
technologies evaluated are ranked at a TRL 7, meaning that these are potentially deployable in the
near‐term. As shown in Figure 2‐2, the higher TRL ranked technologies are predominantly advanced
amine‐based absorption processes. In their assessment, it is noted that few mineralization and
biofixation technologies also have a TRL of 7; but it is Nexant’s opinion that these technologies are
not ready for near‐term commercial deployment.

Task 1 Technology Selection and Evaluation
Final Report: Pre‐Feasibility Study for Establishing a Carbon Capture Pilot Plant in Mexico 32
Figure 2‐2 EPRI’s PCC TRL Ranking
In their 2012 report7, the Global CCS Institute (GCCSI) defined near‐term PCC technologies as those
that have been tested at scale of slip streams no larger than 5‐25 MWe. It reported that all near‐
term PCC technologies are predominantly solvent‐based absorption processes involving either
ammonia or proprietary amines. The distinction between these technologies is specific capture
chemistry and, to some extent, the process configuration and integration into the power plant. It
specifically pointed out Fluor’s Econamine FG+, Mitsubishi Heavy Industries KS solvent, Shell Cansolv
Technologies, Aker Clean Carbon, and Alstom’s Chilled Ammonia Process (CAP) as near‐term
technologies. All of these use either aqueous pure amines or amine blends, with the exception of
Alstom’s CAP, which uses aqueous ammonia.
2.3 SELECTION OF PCC TECHNOLOGIES FOR DETAILED PROCESS EVALUATION
On the basis of (a) Section 2.2’s technology assessment and pre‐screening background, (b) Nexant’s
own assessment of the current state‐of‐the‐art PCC technologies, and (c) the interest of the World
Bank and the GoM team to build and complete operation of the Poza Rica NGCC pilot plant by 2019,
based on commercially‐available PCC technology for near‐term deployment, the Nexant team
recommended to the World Bank that the pre‐feasibility design should be focused on solvent‐based
absorption processes. This recommendation was discussed and accepted by the World Bank, SENER
and Comisión Federal de Electricidad (CFE) representatives at the Project Kickoff meeting in June
2015. Potential advanced solvent‐based absorption PCC technology developers/licensors were
collectively identified, selected and asked to participate in the study. These included:
7 Global CCS Institute. CO2 Capture Technologies, Post Combustion Capture (PCC), January 2012

Task 1 Technology Selection and Evaluation
Final Report: Pre‐Feasibility Study for Establishing a Carbon Capture Pilot Plant in Mexico 33
Alstom
Aker Solutions
BASF/Linde
CO2 Solutions
Fluor
Hitachi
HTC Purenergy
MHI
Shell Cansolv
Siemens
2.4 PARTICIPATING PCC TECHNOLOGY LICENSORS
Of the ten PCC licensors contacted, six responded positively and were willing to participate, while
four declined, for various reasons. Table 2‐2 summarizes the PCC licensors’ responses:
All of the licensors who indicated interest in participating represented amine‐based PCC
technologies. It should be noted that although Alstom does offer the CAP technology for PCC, which
uses ammonia as the solvent instead of amines, it also offers an advanced amine‐based PCC
technology (Alstom AAP). For the particular PCC application at the Poza Rica NGCC, Alstom proposed
using the amine‐based AAP technology over its chilled ammonia process.
Table 2‐2 List of PCC Licensors Participation Responses
Accepted to Participate Declined to Participate
Alstom (Advanced Amine Process)
BASF
Fluor
HTC
MHI
Shell Cansolv
Aker Solutions
CO2 Solutions
Hitachi
Siemens
2.5 QUESTIONNAIRE TO PARTICIPATING PCC LICENSORS
To obtain data from the PCC licensors on their technologies so that Nexant could proceed with the
integration of the full‐scale PCC into the Poza Rica plant to assess its potential impact, a
questionnaire was created requesting information from each of the technology providers. The
information requested includes:

Task 1 Technology Selection and Evaluation
Final Report: Pre‐Feasibility Study for Establishing a Carbon Capture Pilot Plant in Mexico 34
Commercial, demonstration, and pilot plant operating experience
Treated gas and CO2 product gas flow rates, conditions and composition
PCC reboiling steam import and cooling duty requirements
PCC auxiliary power consumption
Makeup and waste water demands/production
Plot area requirements
Solvent makeup costs
Estimated capital costs
The full list of questions can be found in Appendix C.
A design basis document was also issued as part of the questionnaire to the PCC technology
licensors interested in participating in the study. This document contained key Poza Rica NGCC
battery limit (B/L) interface information, which defined the feed and product specifications, utility
and offsite interface commodity specifications. The purpose of issuing a design basis with B/L
information to the PCC licensors was to ensure that these licensors designed their systems
consistently and specifically to the Poza Rica NGCC for integration into the retrofit design.
Information on the design basis can be found in Section 3 and Appendix D.
2.6 QUESTIONNAIRE RESPONSES BY PCC LICENSORS
Nexant is grateful to all the participating PCC licensors for taking time out of their schedules to
respond to the Nexant’s questionnaire, providing information on their technology at no cost.
The PCC licensors indicated to Nexant that their questionnaire responses were proprietary and
confidential, and Nexant had to sign a non‐disclosure agreement (NDA) with each of the licensors in
order to have access to their data. However, the World Bank and the Mexican entities involved in
this project do not have any NDAs in effect with the licensors. Thus, only limited information (e.g.
information from open publications and/or conference presentations that the licensors presented as
their questionnaire responses) can be divulged in this report.
A summary of the various licensors’ responses is shown in Appendix E. None of the data from the
licensors is reported directly due to the confidentiality issues stated above. Any responses, if
provided by the licensors, are stated as “Y”, indicating they have disclosed information to a
particular question. If the opposite is true i.e. the licensors did not provide an answer to the
question, then an “N” is indicated.
Furthermore, Nexant had to interpret the data provided by the licensors for consistency in order to
use it in the integration exercise to evaluate the overall cost and performance of retrofitting the
Poza Rica plant with PCC. Thus, the results are only Nexant’s “interpretation” of the various
technologies’ performances and are reported in a format such that no confidential information
directly from the questionnaire is divulged.

Task 1 Technology Selection and Evaluation
Final Report: Pre‐Feasibility Study for Establishing a Carbon Capture Pilot Plant in Mexico 35
3. DESIGN BASIS
3.1 OBJECTIVE
The design basis pulls together information on a variety of project parameters. Its objective is to
establish the criteria which the retrofitted Poza Rica NGCC with PCC should be designed to.
Nexant generated an overall design basis document based on the design and operating data of the
Poza Rica NGCC plant provided by CFE. The initial draft of this document was submitted to CFE for
review prior to Nexant’s visit of the Poza Rica NGCC plant in October 2015. Following Nexant’s visit
to the Poza Rica plant, the design basis was updated based on Nexant’s better understanding of the
plant’s operation. Information from the overall design basis was used to model the existing Poza
Rica NGCC performance and subsequently the integration of the various PCC technologies into the
retrofitted Poza Rica NGCC to determine their overall performances.
A separate design basis document was issued as part of the questionnaire to the PCC technology
licensors interested in participating in the study. This document is a subset of the overall design
basis and contains key Poza Rica NGCC B/L interface information, which defined the feed and
product specifications, utility and offsite interface commodity specifications. This was to ensure that
the PCC licensors designed their systems consistently and specifically to the Poza Rica NGCC for
integration into the retrofit design.
This section lists some of the key design basis information used in the study. The full design basis
document and its list of references can be found in Appendix D.
3.2 OVERVIEW OF RETROFITTING POZA RICA NGCC FOR PCC
The existing Poza Rica NGCC plant consists of one natural gas‐fired Siemens/Westinghouse model
W501F gas turbine (GT) producing a nominal 160 MWe of electricity. It is equipped with a heat
recovery steam generator (HRSG) to recover waste heat from the GT exhaust and generate
superheated steam feeding three 27 MWe steam turbines to produce additional power. The power
plant’s total generating capacity is 243 MWe nominal.
The PCC plant was designed as an add‐on to the Poza Rica NGCC power plant. New process/utilities
tie‐ins and retrofit to the NGCC power plant were added as required. Projected largest‐single train
size equipment was used to maximize economy‐of‐scale. Equipment was designed for a 30‐year
plant life. Rotating equipment critical to the continuous plant operation was spared to support the
high availability required of the NGCC operations. Where sparing was not feasible, alternate PCC
operation was identified to maintain continuous NGCC power plant operation. Figure 3‐1 shows the
interface between the existing NGCC power plant and the add‐on PCC and CO2
compression/dehydration plants.

Task 1 Technology Selection and Evaluation
Final Report: Pre‐Feasibility Study for Establishing a Carbon Capture Pilot Plant in Mexico 36
Figure 3‐1 Poza Rica NGCC Flow Configuration (with PCC and CO2 Compression/Dehydration)
W501F Gas Turbine160 MWe Nominal
Siemens Steam Turbine No. 1
( 27 MWe Nominal )
Hear Recovery Steam
Generator (HRSG)
HP SH Steam
IP SH Steam
LP SH Steam
BFW
Natural Gas
Air
Stack
POZA RICA NGCC Plant
PCC Plant
Condensate
CO2 Absorber
Solvent Regen‐eration
FG Fans
To CO2 Compression
NNF
LP Steam
Cooling Water
Steam Condensate Return
Cooling Water Return
Treated Flue Gas Vent
CO2
Waste Water
Solid Waste
Power
LP Steam
Siemens Steam Turbine No. 2
( 27 MWe Nominal )
Siemens Steam Turbine No. 3
( 27 MWe Nominal )
louvers(added)
CO2 Compression & Dehydration
CO2
CompressionCondensate
Return
To Interstage Cooling
IP Steam
Compressed
CO2 to EOR Pipeline
CO2
Purification Vent

Task 1 Technology Selection and Evaluation
Final Report: Pre‐Feasibility Study for Establishing a Carbon Capture Pilot Plant in Mexico 37
3.3 SITE‐RELATED CONDITIONS
Table 3‐1 lists the site‐related conditions of the Poza Rica NGCC plant for retrofit with PCC.
Table 3‐1 Site Conditions
Location Poza Rica, Veracruz, Mexico
Elevation above sea level
50 m (164 ft)
Topography Level
Seismic Zone 0
Transportation Road and Rail
Water From Canal de Llamada
Access Access by road and rail
CO2 Specification 85% recovery and compressed to 152.7 bara (2,215 psia) for Enhanced Oil Recovery (EOR). (Study scope limited to delivery at compression system battery limit only)
3.4 METEOROLOGICAL DATA
Summer design ambient conditions were used for the NGCC and PCC design and performance
evaluation. These conditions were provided by CFE and are shown in Table 3‐2.
Table 3‐2 Meteorological Data
Description Summer Design
Barometric Pressure 1.013 bara (14.69 psia)
Dry Bulb Temperature 32 °C (90 °F)
Wet Bulb Temperature 25.3 °C (77.5 °F)
Relative Humidity, % 57%
3.5 PCC FEED AND PRODUCT PROPERTIES
3.5.1 PCC Feed (NGCC Flue Gas) Properties
Flue gas from the Poza Rica NGCC power plant HRSG outlet is routed through a blower to boost its
pressure before delivering to the new PCC plant. The estimated PCC flue gas feed composition and
flow rate for the nominal 160 MWe gas turbine gross outputs operating at 32 °C (90 °F) ambient
temperature and 57% relative humidity are shown in Table 3‐3.
The flue gas composition and conditions shown are at the NGCC HRSG outlet for delivery to the PCC
battery limit. This is after the flue gas has undergone a pressure boost through the new blower. Any
additional flue gas conditioning required by the PCC licensor, such as feed temperature, sulfur and
moisture control to meet PCC process requirements, are to be provided by the PCC licensor, as
needed.
For the purpose of absorbent or solvent degradation estimation, the NOx concentration shown is
assumed to be 95% NO and 5% NO2.

Task 1 Technology Selection and Evaluation
Final Report: Pre‐Feasibility Study for Establishing a Carbon Capture Pilot Plant in Mexico 38
Table 3‐3 Poza Rica NGCC Flue Gas Composition and Flow Rate
PCC Design Flue Gas composition, mole %
CO2 3.81
O2 12.32
N2 73.26
Ar 0.89
H2O 9.72
SO2 11 ppmv
NOx 60 ppmv
Total 100.00
Conditions:
Pressure at PCC B/L, bara (psia) 1.15 (16.7)
Temperature at PCC B/L, °C (°F) 107.8 (226)
Mass Flow, kg/s (lb/hr) 447.9 (3,554,770)
Molar Flow, kgmol/hr (lbmol/hr) 57,080 (125,828)
3.5.2 Recovered CO2 Properties
The full‐scale PCC plant is designed to recover 85% of CO2 in the NGCC flue gas. Recovered CO2 from
the PCC unit is sent to a separate CO2 compression unit, where it is compressed and dehydrated
before being delivered to the NGCC/PCC plant battery limit for EOR applications. CO2 gas pipeline
specifications are shown in Table 3‐4 and are based on U.S. NETL/DOE EOR specifications.
The CO2 product leaving the PCC plant battery limit is expected to meet all specifications in Table 3‐4
except for H2O content, pressure and temperature. These are adjusted in an external CO2
compression unit based on Nexant’s design.
Table 3‐4 Recovered CO2 Properties
Product CO2 Specification (for EOR, NETL/DOE)
CO2 95.0 wt% (min)
N2 1.0 vol% (max)
O2 100 ppmV (max)
H2O* 800 ppmV (max)
Ar 1.0 vol% (max)
CH4 1.0 vol% (max)
CO 35 ppmV (max)
H2 1.0 vol% (max)
Pressure, bara (psia)* 152.8 (2215)
Temperature, oC (oF)* 37.8 (100)
* The H2O content and the recovered CO2 pressure and temperature shown in Table 3‐4 are the CO2 product conditions
exiting the CO2 compression/dehydration unit.

Task 1 Technology Selection and Evaluation
Final Report: Pre‐Feasibility Study for Establishing a Carbon Capture Pilot Plant in Mexico 39
3.6 PCC UTILITY REQUIREMENTS
3.6.1 Poza Rica NGCC Plant Steam Pressure Levels
The Poza Rica NGCC plant uses three (3) Siemens steam turbines, each nominally generating 27
MWe of power for a total of 81 MWe nominal. It has a single HRSG that generates steam at three
pressure levels, high pressure (HP), intermediate pressure (IP), and low pressure (LP). The saturated
steam from the HRSG evaporators is superheated and distributed to the three steam turbines for
power production. Figure 3‐2 shows a simplified process flow diagram (PFD), which illustrates the
configuration of the Poza Rica NGCC plant’s HRSG and steam turbine arrangement.
Figure 3‐2 Poza Rica NGCC HRSG/Steam Turbine Configuration
Hot Flue Gas
HP Steam
IP Steam LP Steam
CW
CW
CW
Condensate
IP LP
IP LP
HRSG
Stack
VentedFlue Gas
STG #1
STG #2
STG #3
Table 3‐5 shows the conditions of the steam generation levels in the Poza Rica NGCC plant’s HRSG
unit.
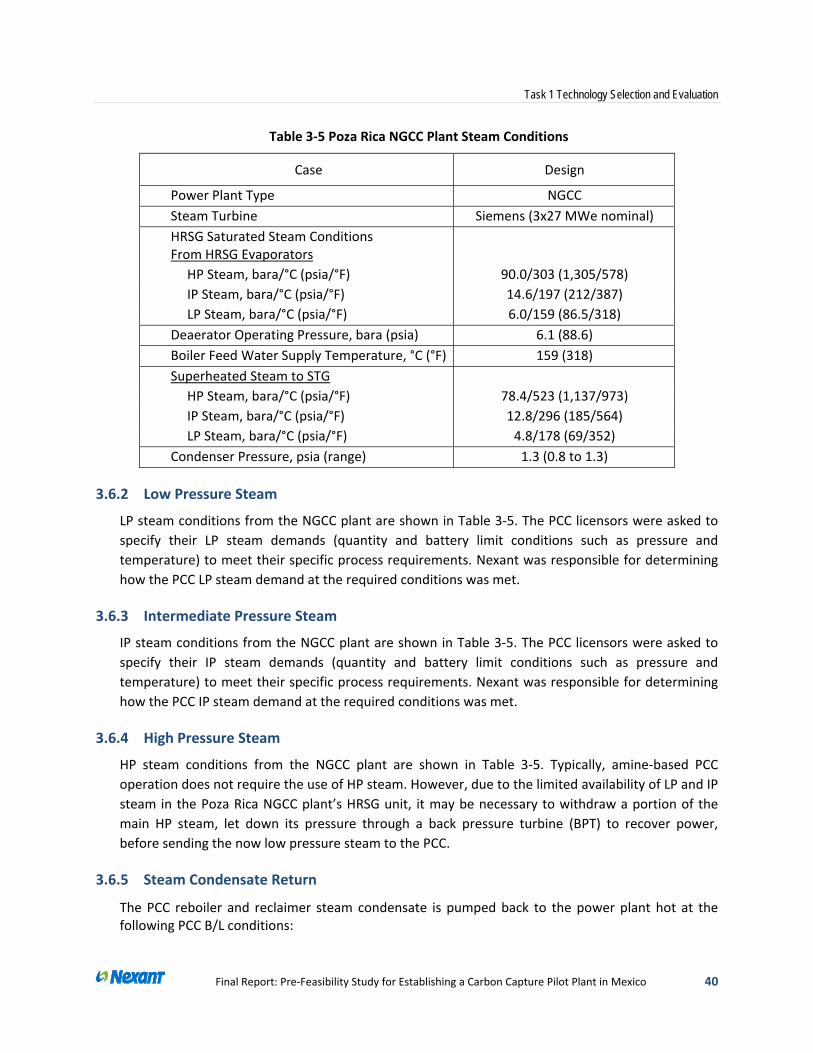
Task 1 Technology Selection and Evaluation
Final Report: Pre‐Feasibility Study for Establishing a Carbon Capture Pilot Plant in Mexico 40
Table 3‐5 Poza Rica NGCC Plant Steam Conditions
Case Design
Power Plant Type NGCC
Steam Turbine Siemens (3x27 MWe nominal)
HRSG Saturated Steam Conditions From HRSG Evaporators
HP Steam, bara/°C (psia/°F) 90.0/303 (1,305/578)
IP Steam, bara/°C (psia/°F) 14.6/197 (212/387)
LP Steam, bara/°C (psia/°F) 6.0/159 (86.5/318)
Deaerator Operating Pressure, bara (psia) 6.1 (88.6)
Boiler Feed Water Supply Temperature, °C (°F) 159 (318)
Superheated Steam to STG
HP Steam, bara/°C (psia/°F) 78.4/523 (1,137/973)
IP Steam, bara/°C (psia/°F) 12.8/296 (185/564)
LP Steam, bara/°C (psia/°F) 4.8/178 (69/352)
Condenser Pressure, psia (range) 1.3 (0.8 to 1.3)
3.6.2 Low Pressure Steam
LP steam conditions from the NGCC plant are shown in Table 3‐5. The PCC licensors were asked to
specify their LP steam demands (quantity and battery limit conditions such as pressure and
temperature) to meet their specific process requirements. Nexant was responsible for determining
how the PCC LP steam demand at the required conditions was met.
3.6.3 Intermediate Pressure Steam
IP steam conditions from the NGCC plant are shown in Table 3‐5. The PCC licensors were asked to
specify their IP steam demands (quantity and battery limit conditions such as pressure and
temperature) to meet their specific process requirements. Nexant was responsible for determining
how the PCC IP steam demand at the required conditions was met.
3.6.4 High Pressure Steam
HP steam conditions from the NGCC plant are shown in Table 3‐5. Typically, amine‐based PCC
operation does not require the use of HP steam. However, due to the limited availability of LP and IP
steam in the Poza Rica NGCC plant’s HRSG unit, it may be necessary to withdraw a portion of the
main HP steam, let down its pressure through a back pressure turbine (BPT) to recover power,
before sending the now low pressure steam to the PCC.
3.6.5 Steam Condensate Return
The PCC reboiler and reclaimer steam condensate is pumped back to the power plant hot at the following PCC B/L conditions:

Task 1 Technology Selection and Evaluation
Final Report: Pre‐Feasibility Study for Establishing a Carbon Capture Pilot Plant in Mexico 41
Min Pressure, bara (psia) 9.0 (130) ** Temperature, °C (°F) PCC Licensor to Specify
** Based on deaerator pressure of 89 psia + 40 psi ∆P allowance for head and line drops
3.6.6 Cooling Water
The Poza Rica NGCC plant utilizes three mechanical draft and evaporative recirculating wet cooling
towers (CT). Each CT, which consists of three cooling cells, is dedicated to one of the three steam
turbine surface condensers, as illustrated in Figure 3‐3. The cooling water (CW) supply and return
conditions at the PCC B/L conditions are shown in Table 3‐6.
Figure 3‐3 Poza Rica NGCC Plant Existing Cooling Tower Arrangement
STG #1Surface Condenser
Existing Cooling Tower #1
STG #2Surface Condenser
Existing Cooling Tower #2
STG #3Surface Condenser
Existing Cooling Tower #3
Table 3‐6 Poza Rica Cooling Tower Design Conditions
Maximum CW Supply Temperature, oC (oF) 27.5 (81.5)
Water Circulation Rate, gpm (lpm) 11,000 (41,600)/cell 33,000 (124,800)/tower
CT Design Duty, GJ/hr (MMBtu/hr) 311.8 (295.5)
Estimated Maximum CW Return Temperature, oC (oF) 37.5 (99.5)
There is a configuration for the post‐PCC retrofit Poza Rica NGCC plant operation, whereby it is
possible to shut off one of the three steam turbines due to a large quantity of HP steam being
extracted for PCC, leaving only the other two steam turbines in operation. This could potentially free
up one of the three existing CTs to provide some of the PCC cooling duty.
However, after Nexant’s visit to the Poza Rica NGCC plant, it was understood that CFE would like to
retain maximum operational flexibility after PCC retrofit by keeping all three steam turbines and

Task 1 Technology Selection and Evaluation
Final Report: Pre‐Feasibility Study for Establishing a Carbon Capture Pilot Plant in Mexico 42
their respective CTs available. It is therefore established that the PCC cooling duty will be supplied
by new CTs similar in design to that described in Table 3‐6.
3.6.7 Process Water
Process water for PCC water wash and solvent reclamation is available from the NGCC plant steam
condensate system at the following conditions shown in Table 3‐7.
Table 3‐7 Poza Rica Process Water Supply Conditions
Temperature, oC (oF) 43.3 (110)
Pressure, bara (psia) 13.2 (191.7)
Quantity Licensor to Specify
3.7 PROCESS WASTE STREAMS
3.7.1 Process Condensates
The PCC plant is designed to minimize purging of solvent‐containing process condensates. Any
solvent‐containing process condensate is recycled within the PCC as makeup water for replacement
solvent solutions. Non‐solvent containing purge water is used as makeup to the CT.
3.7.2 Reclaimer Byproducts
Amine‐based PCC plants sometimes produce a sludge byproduct from the amine reclaimer. The
material is considered hazardous, and is assumed that it is trucked offsite for incineration by a third
party. An allowance is used to account for the cost of disposing the reclaiming waste.
3.8 ENVIRONMENTAL AND EMISSIONS REQUIREMENTS
Table 3‐8 lists the assumed emissions limits for the Poza Rica NGCC plant. PCC Licensors were asked
if they could meet these emissions criteria.
Table 3‐8 Environmental Targets
Pollutant NOM‐085‐SEMARNAT Limit (Mexico)
NOx 110 µmole/mole (ppmV)
SO2 N/A
Particulate Matter (PM) N/A
VOC 0.0025lb/MMBtu (0.0011gm/MJ) [EPA limits for PC Boilers]

Task 1 Technology Selection and Evaluation
Final Report: Pre‐Feasibility Study for Establishing a Carbon Capture Pilot Plant in Mexico 43
4. TECHNOLOGY DESCRIPTION OF INTERESTED PCC LICENSORS
As stated in Section 2.5, each of the six interested PCC licensors were issued a questionnaire, shown
in Appendix C, requesting information pertaining to their PCC technology. The licensors were also
provided a copy of the Design Basis, similar to that presented in Section 3, in which the feed and
product specifications, utilities and other B/L interface specifications were clearly defined. This was
done to ensure that all licensors would provide the necessary process design information in
accordance to the Poza Rica NGCC’s specifications and minimize any inconsistencies among them.
Within the questionnaire, Nexant also requested the PCC licensors to provide published articles on
their technology, complete with process descriptions, in order to better understand their design
operation. A separate section of the questionnaire also asked the PCC licensors to list their
technology’s operating experience, ranging from process design package preparation to actual
commercial operation. The licensors were also asked specifically to provide operating experience, if
any, of capturing CO2 from NGCC flue gas.
This section provides a brief description of each participating PCC licensor’s technology, based on
publicly available articles published by the licensor. Also shown in this section is a summary of the
operating experience achieved by each technology.
4.1 ALSTOM ADVANCED AMINE PROCESS (AAP)
4.1.1 Introduction
Alstom Power and The Dow Chemical Company have jointly developed an Advanced Amine Process
(AAP)8,9 ,10 with UCARSOLTM FGC‐3000 amine solvent for the capture of CO2 from fossil fuel power
plant‐generated flue gas. The AAP has been optimized for application towards combustion flue gas
under atmospheric pressure from power plant operations. Alstom claims that its process presents
less solvent degradation compared to conventional MEA and is designed for stringent emissions
mitigation and control.
4.1.2 Operating Experience
Note: ND = Not Disclosed by licensor other than citing the total packages referenced below.
8 Baburao, B., et al. Advanced Amine Process Technology Operations and Results from Demonstration Facility at EDF Le Havre. Greenhouse Gas Control Technologies (GHGT)‐12 9 Chopin, F. Results of the CO2 Capture Demonstration Facility at EDF’s Le Havre Power Plant: Status of ALSTOM’s Advanced Amines Process. PowerGen Europe 2014, Cologne, Germany 10 Vitse, F., Baburao, B., et al. Technology and pilot plant results of the advanced amine process. GHGT‐10

Task 1 Technology Selection and Evaluation
Final Report: Pre‐Feasibility Study for Establishing a Carbon Capture Pilot Plant in Mexico 44
Table 4‐1 Alstom AAP Operating Experience
NGCC Coal‐Fired Others Total
Commercial Plants 0 0 0 0
Demonstration Plants 0 0 0 0
Pilot Plants 0 2 2 4
FEED Packages Prepared ND ND ND 2
Process Design Packages Prepared ND ND ND 6
Largest Pilot Plant Operating Experience
Location: Le Havre, France
Flue gas source: Coal
CO2 recovery rate: 90%
CO2 recovered, Nm3/hr: 0.75
Current operating status: Shutdown
Largest FEED Package Prepared
Location: Belchatow, Poland
Flue gas source: Lignite coal
CO2 recovery rate: 90%
CO2 recovered, Nm3/hr 117,000
Current status: FEED completed; Project terminated by client
Largest Process Design Package Prepared
4.1.3 Process Description
Alstom’s Advanced Flow Scheme (AFS) process configuration tested at the CO2 Capture
Demonstration Facility at Électricité de France’s (EDF) Le Havre Power Plant is a proprietary design,
developed to provide minimal energy consumption leading to reduced operating costs. The carbon
capture facility is based on Alstom’s AAP technology, which Alstom has jointly developed with The
Dow Chemical Company. The process uses UCARSOL™ FGC 3000, an amine based solvent supplied
by Dow. Alstom plans to offer the AAP technology for large scale commercial fossil fuel power
plants, based upon successfully demonstrated experience at the Charleston pilot plant in West
Virginia, USA and the current Le Havre project in France.
Location: Karlsruhe, Germany
Flue gas source: Coal
CO2 recovery rate: 90%
CO2 recovered, Nm3/hr 295,000
Current status: Package completed; No actual project

Task 1 Technology Selection and Evaluation
Final Report: Pre‐Feasibility Study for Establishing a Carbon Capture Pilot Plant in Mexico 45
The process features an absorber column equipped with an integrated water wash section, a
regeneration column equipped with an integrated direct contact cooler (DCC), associated heat
management equipment, an oxygen stripper and an electrodialysis reclaimer unit. Figure 4‐1 shows
a simplified schematic of the AAP process.
Figure 4‐1 Simplified Process Schematic of the Alstom AAP
Exhaust gas after flue gas conditioning to reduce the SOx content below 20 ppmv and cooling is
introduced to the absorber column at below 40 °C. A booster fan (not shown in Figure 4‐1) provides
the pressure necessary to drive the gas through the CO2 absorber. In the absorber, the CO2 in the
flue gas reacts with the lean amine solution flowing counter‐current from the top. The treated gas
exits the top of the column after flowing through a water wash section to minimize amine vapor
losses. The absorber columns contain structured packing layered in several beds and selected for
optimal mass transfer and hydraulic characteristics. Within the absorber section, there is heat
management equipment in place to control the temperature to maximize the CO2 loading in the rich
solvent, hence reducing solvent flow rate.
The rich amine exiting the CO2 absorber is sent to the regenerator column via a heat exchanger
network. In the regenerator column, the CO2 is desorbed and the amine is regenerated to be sent
back to the absorber for further absorption. The regenerator is a packed column and is thermally
driven with stripping steam. The rich solution flows down the regenerator counter‐currently to
rising steam produced by boiling the lean solution exiting the bottom of the column in a reboiler

Task 1 Technology Selection and Evaluation
Final Report: Pre‐Feasibility Study for Establishing a Carbon Capture Pilot Plant in Mexico 46
unit fed with saturated steam. The regenerator includes heat integration features that minimize
saturated steam consumption.
After flowing through the rich‐lean solvent cross heat exchanger, the lean solution returning from
the bottom of the regenerator is further cooled in a lean cooler before it is introduced to the top of
the absorber.
The exiting CO2 gas product is saturated with water and is cooled in a top section located in the
regenerator where most of the water is condensed. The condensed water is then sent back to the
amine loop or to the make‐up water system to ensure neutral water balance. The CO2 product is
suitable for further compression and pipeline transportation.
Amine solvent management is achieved via the use of mechanical filters and an activated carbon
bed filter. Heat stable salts (HSS) are formed from trace acid gas products in the flue gas and from
oxidation degradation products. These have to be removed to prevent buildup within the amine
loop. Caustic soda is used during the amine reclamation process to neutralize any heat stable salts
during the filtration process.
The amine solvent loop is also equipped with an oxygen stripper (not shown in Figure 4‐1) to reduce
amine oxidative degradation due to oxygen absorbed from the flue gas. The oxygen stripper treats
the rich amine solvent exiting the CO2 absorber, where it is exposed to a reduced pressure
environment to promote desorption of oxygen gas. The oxygen stripper is designed to extract most
of the absorbed oxygen from the amine solvent stream with minimal impacts on solvent
composition or CO2 loading of the solvent.
4.2 BASF OASE® BLUE PROCESS
4.2.1 Introduction
OASE® blue11,12,13,14,15 was jointly developed by BASF and Linde, specifically as an optimized large‐
scale PCC technology. BASF believes that its technology can offer significant benefits compared to
other solvent‐based processes as it aims to reduce the regeneration energy requirements by using
novel solvents that are very stable under coal‐fired power plant feed gas conditions. With low
11 Stoffregen, T., Rigby, S., et al. Pilot‐scale demonstration of an advanced aqueous amine‐based post‐combustion capture technology for CO2 capture from power plant flue gases. GHGT‐12 12 Krishnamurthy, K. Slipstream pilot plant demonstration of an amine‐based post‐combustion capture technology for CO2 capture from coal‐fired power plant flue gas. 2012 NETL CO2 Capture Technology Meeting, Pittsburgh, PA 13 Moser, P., Sieder, G., et al. Enabling Post Combustion Capture Optimization – The Pilot Plant Project at Niederaussem. GHGT‐09 14 Moser, P., Sieder, G., et al. The post‐combustion capture pilot plant Niederaussem – Results of the first half of the testing programme. GHGT‐10 15 Moser, P., Sieder, G., et al. Enhancement and long‐term testing of optimized post‐combustion capture technology – Results of the second phase of the testing programme at the Miederaussem pilot plant. GHGT‐11

Task 1 Technology Selection and Evaluation
Final Report: Pre‐Feasibility Study for Establishing a Carbon Capture Pilot Plant in Mexico 47
energy consumption, low solvent losses and an exceptionally flexible operating range, BASF claims
that the OASE® blue technology is the paramount technology for use in flue gas carbon capture from
sources such as fossil power generation plants.
4.2.2 Operating Experience
Note: ND = Not Disclosed by licensor
Table 4‐2 BASF OASE® blue Operating Experience
NGCC Coal‐Fired Others Total
Commercial Plants 0 0 0 0
Demonstration Plants 0 1 0 1
Pilot Plants 0 1 0 1
FEED Packages Prepared 0 1 0 1
Process Design Packages Prepared ND ND ND 6
Largest Demonstration Plant Operating Experience
Location: NCCC at Wilsonville, Alabama, USA
Flue gas source: Coal
CO2 recovery rate: 80‐95%
CO2 recovered, Nm3/hr: 380‐810
Current operating status: In operation
Largest Pilot Plant Operating Experience
Location: Niederaussem, Germany
Flue gas source: Lignite coal
CO2 recovery rate: 90%
CO2 recovered, Nm3/hr: 160
Current operating status: In operation
Largest FEED Package Prepared
Location: Germany
Flue gas source: Lignite coal
CO2 recovery rate: 90%
CO2 recovered, Nm3/hr 363,000
Current status: Project cancelled
Largest Process Design Package Prepared
Location: Texas, USA
Flue gas source: Coal
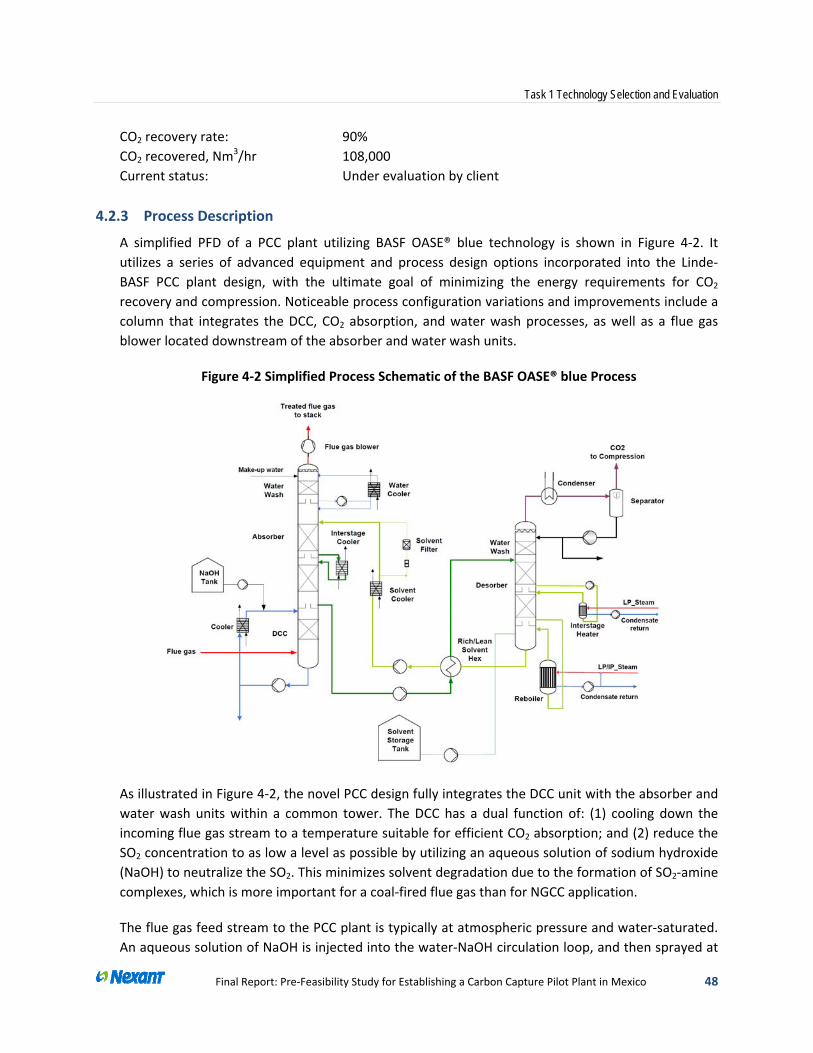
Task 1 Technology Selection and Evaluation
Final Report: Pre‐Feasibility Study for Establishing a Carbon Capture Pilot Plant in Mexico 48
4.2.3 Process Description
A simplified PFD of a PCC plant utilizing BASF OASE® blue technology is shown in Figure 4‐2. It
utilizes a series of advanced equipment and process design options incorporated into the Linde‐
BASF PCC plant design, with the ultimate goal of minimizing the energy requirements for CO2
recovery and compression. Noticeable process configuration variations and improvements include a
column that integrates the DCC, CO2 absorption, and water wash processes, as well as a flue gas
blower located downstream of the absorber and water wash units.
Figure 4‐2 Simplified Process Schematic of the BASF OASE® blue Process
As illustrated in Figure 4‐2, the novel PCC design fully integrates the DCC unit with the absorber and
water wash units within a common tower. The DCC has a dual function of: (1) cooling down the
incoming flue gas stream to a temperature suitable for efficient CO2 absorption; and (2) reduce the
SO2 concentration to as low a level as possible by utilizing an aqueous solution of sodium hydroxide
(NaOH) to neutralize the SO2. This minimizes solvent degradation due to the formation of SO2‐amine
complexes, which is more important for a coal‐fired flue gas than for NGCC application.
The flue gas feed stream to the PCC plant is typically at atmospheric pressure and water‐saturated.
An aqueous solution of NaOH is injected into the water‐NaOH circulation loop, and then sprayed at
CO2 recovery rate: 90%
CO2 recovered, Nm3/hr 108,000
Current status: Under evaluation by client

Task 1 Technology Selection and Evaluation
Final Report: Pre‐Feasibility Study for Establishing a Carbon Capture Pilot Plant in Mexico 49
the top of the DCC unit. The liquid from the bottom of the DCC bed is fed to a circulating pump; the
excess water, condensed from the flue gas, and along with dissolved Na2SO3, is withdrawn from the
loop and sent to an acid neutralization and water treatment facility. It is expected that an integrated
cooling water system is used to supply cooling water to all process units, including the PCC and CO2
compression plants.
The CO2‐lean BASF OASE® blue amine‐based solvent solution flows down through the absorber bed
and absorbs CO2 from the flue gas, which flows counter‐current to the solvent flow and into the
water wash unit. The absorption process of CO2 with amine‐based solvents is exothermic and
increases the temperature of the flue gas, which consequently reduces the equilibrium content of
CO2 in the liquid‐phase. It is important to maintain a low, relatively constant temperature
throughout the entire absorber. This is achieved by cooling the CO2‐lean amine solvent solution
within an external cooler before it is injected to the top of the absorber.
Additionally, the temperature rise within the column can be suppressed via inter‐stage cooling, as
shown in Figure 4‐2. Linde has developed a patent‐protected, gravity‐driven inter‐stage cooler
design that eliminates the need for an external pump and consequently leads to a simplified design
and reduced cost for the absorber with inter‐stage cooler.
The Linde‐BASF PCC technology utilizes advanced structured packing for the absorber to promote
efficient hydraulic contact of gas and liquid phases. The packing increases CO2 reaction rates with
BASF's OASE® blue solvent, while also facilitating a fast approach to equilibrium CO2 concentration
in the liquid‐phase. The capacity of the absorber is consequently increased. In addition, the
advanced structured packing reduces the pressure drop across the column, which in turn leads to
reduced flue gas blower requirements.
The CO2‐rich solvent, heated up in the rich/lean heat exchanger, is injected at the top of the solvent
stripper column section consisting of two packed beds. The reboiler at the bottom of the stripper
column uses the heat of condensation of LP steam to vaporize CO2 and water from the concentrated
solvent, which is directed to the lean/rich solvent heat exchanger. A small fraction of carried solvent
from the top of the stripper bed is removed from the CO2 stream in the wash section above the
stripper bed. The CO2 stream leaving the top of the stripper column is saturated with water and
cooled in the condenser. The vapor phase, containing more than 95% CO2, is separated from the
liquid phase inside the separator and routed to the CO2 compression section.
The most energy intensive aspect of amine‐based CO2 capture is LP steam consumption within the
reboiler for solvent regeneration. BASF's OASE® blue solvent claims to reduce significantly the
energy demand for solvent regeneration. This minimizes power plant efficiency loss and ultimately
decreases the cost of produced electricity. The Linde‐BASF advanced PCC technology also
incorporates an option to heat the solvent within the stripper by employing an inter‐stage heater.
The heater can use lower temperature steam than the reboiler, and thus reduce LP steam demand
from the steam turbines.

Task 1 Technology Selection and Evaluation
Final Report: Pre‐Feasibility Study for Establishing a Carbon Capture Pilot Plant in Mexico 50
4.3 FLUOR ECONAMINE FG PLUSSM
4.3.1 Introduction
As cited, Fluor has built or licensed 29 amine plants worldwide based on its proprietary Econamine
FG PlusSM (EFG+)16,17,18,19 technology. The EFG+ technology is a proven, cost‐effective process for the
removal of CO2 from low pressure gases containing oxygen, such as flue gases derived from coal,
fuel oil, natural gas boilers, and gas turbine exhaust.
The EFG+ technology was one of the first processes to gain extensive proven operating experience in
the removal of CO2 from high oxygen content flue gases. The EFG+ technology is well known from its
success at the Bellingham plant in Bellingham, Massachusetts. The Bellingham plant operated with a
90% CO2 recovery from a very challenging flue gas: 3.5 vol% (dry) CO2 and up to 15 vol% (dry) O2.
4.3.2 Operating Experience
Note: ND = Not Disclosed by licensor
Table 4‐3 Fluor’s Econamine FG PlusSM Operating Experience
NGCC Coal‐Fired Others Total
Commercial Plants ND ND ND 29
Demonstration Plants ND ND ND ND
Pilot Plants ND ND ND 2
FEED Packages Prepared ND ND ND 9
Process Design Packages Prepared ND ND ND 29
Largest Commercial Plant Operating Experience
Location: Bellingham, Massachusetts
Flue gas source: NGCC
CO2 recovery rate: 80%‐85%
CO2 recovered, Nm3/hr: 7,000
Current operating status: Shutdown (In operation from 1991‐2005)
16 Radgen, P., Rode H., Reddy, S., Yonkoski, J.: Lessons Learned from the Operation of a 70 Tonne per Day Post Combustion Pilot Plant at the Coal Fired Power Plant in Wilhelmshaven, Germany. GHGT‐12 17 Reddy, S., Bhakta, M., Gilmartin, J., Yonkoski, J.: Cost Effective CO2 Capture from Flue Gas for Increasing Methanol Plant Production. GHGT‐12 18 Scherffius, J., Reddy, S., Klympyan, J., Armpriester, A. Large‐Scale CO2 Capture Demonstration Plant Using Fluor’s Econamine FG PlusSM Technology at NRG’s WA Parish Electric Generating Station. GHGT‐11 19 Scherffius, J., Reddy, S., Yonkoski, J., Radgen, P. Initial Results from Fluor’s CO2 Capture Demonstration Plant Using Econamine FG Plus
SM Technology at E.ON Kraftwerke’s Wilshelmshaven Power Plant. GHGT‐11
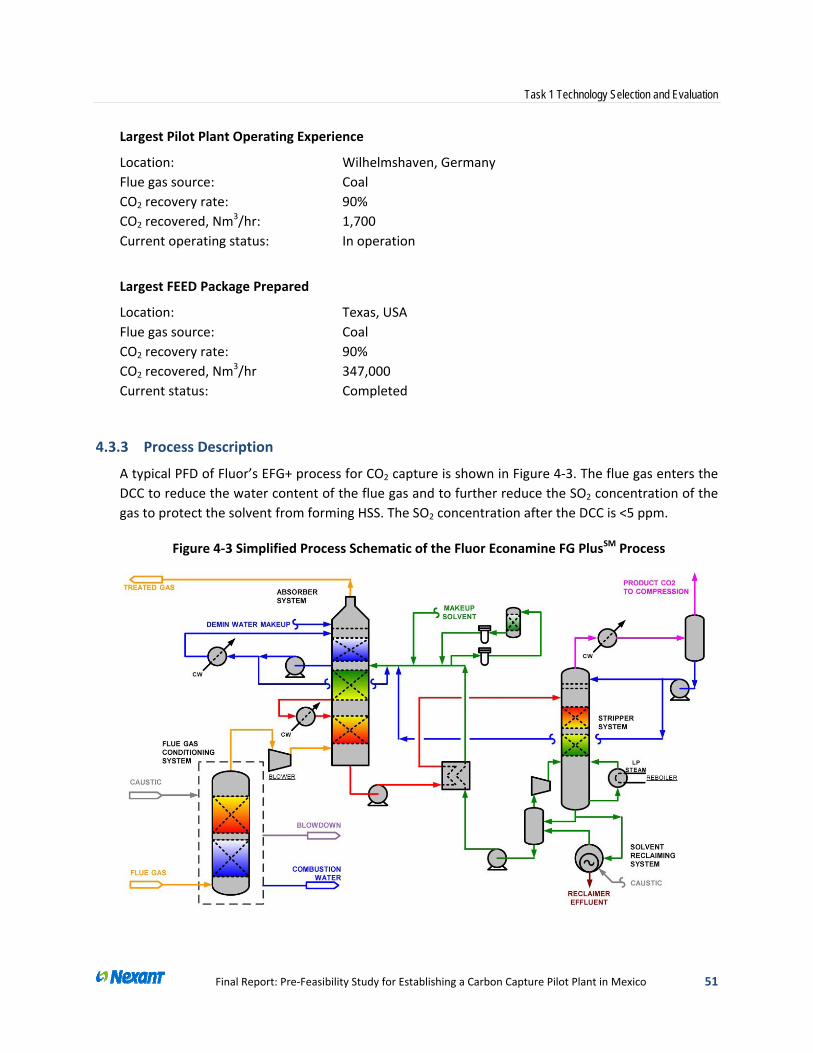
Task 1 Technology Selection and Evaluation
Final Report: Pre‐Feasibility Study for Establishing a Carbon Capture Pilot Plant in Mexico 51
Largest Pilot Plant Operating Experience
Location: Wilhelmshaven, Germany
Flue gas source: Coal
CO2 recovery rate: 90%
CO2 recovered, Nm3/hr: 1,700
Current operating status: In operation
Largest FEED Package Prepared
Location: Texas, USA
Flue gas source: Coal
CO2 recovery rate: 90%
CO2 recovered, Nm3/hr 347,000
Current status: Completed
4.3.3 Process Description
A typical PFD of Fluor’s EFG+ process for CO2 capture is shown in Figure 4‐3. The flue gas enters the
DCC to reduce the water content of the flue gas and to further reduce the SO2 concentration of the
gas to protect the solvent from forming HSS. The SO2 concentration after the DCC is <5 ppm.
Figure 4‐3 Simplified Process Schematic of the Fluor Econamine FG PlusSM Process

Task 1 Technology Selection and Evaluation
Final Report: Pre‐Feasibility Study for Establishing a Carbon Capture Pilot Plant in Mexico 52
The EFG+ technology uses a chemical solvent for the capture of the CO2 from the flue gas. In the
absorber column, CO2 is absorbed into the solvent. This is an exothermic reaction and causes the
temperature inside the column to increase as the CO2 is absorbed from the flue gas. This
temperature increase lowers the equilibrium CO2 loading in the solvent, which lowers the rich
solvent loading and increases the solvent circulation rate.
Absorber intercooling is included for solvent flow rate optimization. With the absorber intercooling
configuration, heat is removed near the bottom of the absorber column via an external cooler. The
location of the intercooler was selected to maintain high reaction rates near the top and middle of
the absorber, while maximizing the solvent CO2‐carrying capacity near the absorber bottom. By
removing much of the heat of reaction in this location, higher rich solvent loadings are achieved i.e.
the amount of CO2 carried by a given amount of solvent can be increased. This results in a lower
solvent circulation rate requirement. Besides reducing the solvent pump power demands, since
some of the regeneration energy demand for solvent stripping is the sensible heating of the
circulating solvent, a lower solvent circulation rate also results in a lower energy requirement for the
plant. The removal of the heat of reaction and the reduced solvent flow rate also mean that the size
of the absorber can be reduced, which translates to either lower capital cost for a fixed CO2 capture
rate or a higher capture rate for a fixed absorption column diameter. For absorption columns that
handle large flows from coal or NGCC based flue gas, reductions in column diameter are critical to
avoid the use of multiple absorber trains.
In the regeneration column, lean vapor compression is implemented to reduce the overall energy
demand for stripping CO2 from the rich solvent. In this configuration, lean solvent from the bottom
of the regeneration column is flashed at near atmospheric pressure. The resulting steam that is
flashed off the lean solvent is compressed by the Lean Vapor Compressor and returned to the sump
of the column as additional stripping steam. In this way, more heat is applied to the bottom of the
column, which reduces the steam extracted from the power plant’s steam system and increasing the
efficiency of the stripping process.
The EFG+ solvent, like all chemical solvents, forms HSS in the presence of strong acids, such as SO2.
When the solvent is degraded, its ability to bind CO2 from the flue gas is reduced, effectively
lowering the concentration and CO2 carrying capacity of the circulating solvent. Furthermore, high
concentrations of HSS are known to cause increased rates of corrosion in the capture plant. As such,
the HSS products must be removed from solution.
The EFG+ process achieves this by the reclaiming process, whereby the solvent is heated in the
presence of a base to free the solvent from the strong acid, thus recovering and returning to the
process a majority of the solvent. For the EFG+ solvent, it is reclaimed at a relatively low
temperature, making reclaiming a good solution for the removal of HSS. Furthermore, Fluor has
developed an advanced reclaiming configuration that reclaims at a lower pressure and lower
temperature than typical reclaiming systems. With this configuration, the solvent degradation and
losses that are associated with the reclaiming procedure are reduced, as are the waste production
and disposal costs.

Task 1 Technology Selection and Evaluation
Final Report: Pre‐Feasibility Study for Establishing a Carbon Capture Pilot Plant in Mexico 53
4.4 HTC PURENERGY
4.4.1 Introduction
As cited, HTC Purenergy offers an advanced amine CO2 capture technology, which embraces several
new concepts in post combustion capture. The system has been engineered to reduce capital and
operating costs while at the same time delivering superior performance; reducing energy usage,
lowering emissions, and improving the quality of CO2 product captured.
HTC has taken all of its knowledge from designing large coal‐fired, medium‐sized steam generators
and smaller industrial grade CO2 capture systems, and combined them into a product that has the
capability to meet the production capacity and the emissions to atmosphere at reduced capital and
operating costs. The Low Cost Design (LCDesign™)20,21,22 includes several features that contribute to
lowering the costs such as modular design approach, optimized process flow, formulated solvents,
and optimized operating parameters.
4.4.2 Operating Experience
Note: ND = Not Disclosed by licensor
Table 4‐4 HTC Purenergy PCC Operating Experience
NGCC Coal‐Fired Others Total
Commercial Plants 0 0 0 0
Demonstration Plants ND ND ND 3
Pilot Plants ND ND ND 4
FEED Packages Prepared ND ND ND 7
Process Design Packages Prepared ND ND ND 29
Largest Demonstration Plant Operating Experience
Location: Ferrybridge Power Station, UK
Flue gas source: Coal
CO2 recovery rate: 90%
CO2 recovered, Nm3/hr: 2,400
Current operating status: Shutdown
20 ElMoudir, W., Aboudheir, A., Fairchild, J.: HTC Solvent Reclaimer System at Searles Valley Minerals Facility in Trona, California. GHGT‐12 21 ElMoudir, W., Aboudheir, A.: Design Parameters Affecting the Commercial Post Combustion CO2 Capture Plants. GHGT‐11 22 ElMoudir, W., Aboudheir, A.: Performance of Formulated Solvent in Handling of Enriched CO2 Flue Gas Stream. GHGT‐10

Task 1 Technology Selection and Evaluation
Final Report: Pre‐Feasibility Study for Establishing a Carbon Capture Pilot Plant in Mexico 54
Largest Pilot Plant Operating Experience
Location: ASCO Test Center, Switzerland
Flue gas source: Natural Gas Boiler
CO2 recovery rate: 90%
CO2 recovered, Nm3/hr: 150
Current operating status: In operation
Largest FEED Package Prepared
Location: Norway
Flue gas source: NGCC
CO2 recovery rate: 90%
CO2 recovered, Nm3/hr 69,000
Current status: Completed
4.4.3 Process Description
Figure 4‐4 shows the recommended overall HTC LCDesignTM PFD for large‐scale CO2 capture plants.
Figure 4‐4 Simplified Process Schematic of the HTC LCDesignTM

Task 1 Technology Selection and Evaluation
Final Report: Pre‐Feasibility Study for Establishing a Carbon Capture Pilot Plant in Mexico 55
The flue gas rate is handled in the PCC unit consisting of three major sections: DCC, absorption
column, and stripper column. DCC is mainly required to condition and cool the flue gas temperature
before entering to the absorber section. The DCC will produce excess water from water
condensation during the cooling process, which can be used for water make‐up after filtration
process to remove any fly ash or solid fine particles, as in the case for a coal‐fired flue gas. In the
current HTC LCDesignTM process configuration, the excess water from the DCC is sent to the top of
the washing section as a water make‐up and to wash/cool the off‐gas in order to reduce the solvent
loss considerably (> 98%) and to maintain the plant in water balance. The reflux water is directed to
the bottom of the absorber. This imparts some benefits on the overall energy utilization and the
capital/operation cost reduction.
Not shown in Figure 4‐4 is HTC’s delta Reclaimer (ΔReclaimer™) system, which is a patented
technology based on a simple vacuum unit operation. HTC claims that the ΔReclaimer™ has the
capability to reclaim single and mixed amines or glycol solvents more efficiently at minimum capital
and operating costs. It is designed to remove all high‐boiling degradation products, ionic species,
impurities and fine suspended solids from the chemical solvents. It is also designed to operate
continuously by feeding the contaminated solvent to the delta Reclaimer as a slipstream or from a
storage tank.
Figure 4‐5 depicts the ΔReclaimer™ process unit operation. It consists of an inline mixer unit for
mixing the feed solvent with chemical solutions, solvent evaporator unit with sidearm heater to
maintain the solvent at specified temperature, condenser unit with liquid/gas separator to recover
the solvent, vacuum pump unit to maintain the required operating pressure, and solvent
condensate pump.
Sodium hydroxide, 50% NaOH, and sodium carbonate, 28% Na2CO3, have been used as the bases to
successfully liberate the amines from the accumulated HSS in the feed solvent. The amount of
chemical injection in the inline mixer depends on the HSS concentration and the feed rate. The main
utilities used to operate the reclaimer are a small slipstream of saturated steam at 2.8 barg (40 psig),
cooling water at average temperature of 25 °C (77 °F), process water, and instrument air.
In the evaporator of the ΔReclaimer™, the concentration of the salts and the high‐boiling organic
compounds (degradation products) increases as reclaimed solvent is evaporated, condensed and
then returned to the CO2 plant for reuse. When the wastes reach a high concentration, darkening
the accumulated fluid, part of the accumulated waste is withdrawn from the bottom of the
evaporator, while the reclaimer remains in continuous operation. Any non‐condensable gases,
which are in very small amounts, are removed by the vacuum pump.

Task 1 Technology Selection and Evaluation
Final Report: Pre‐Feasibility Study for Establishing a Carbon Capture Pilot Plant in Mexico 56
Figure 4‐5 Simplified Process Schematic of the HTC delta Reclaimer System
4.5 MHI KM‐CDR PROCESS
4.5.1 Introduction
MHI is known to offer large‐scale, high‐performance and reliable CO2 recovery plants for application
in a wide variety of industries. MHI has developed an advanced, commercially available CO2 recovery
process: the Kansai Mitsubishi Carbon Dioxide recovery (KM CDR) Process23,24,25,26, which delivers
economic performance for plants of wide ranging capacities.
The MHI CO2 recovery process utilizes "KS‐1™", an advanced hindered amine solvent, in conjunction
with a line of special proprietary equipment. The technology was developed through cooperation
between MHI and Kansai Electric Power Company, Inc. (KANSAI). It is based on an advanced and
23 Tsujiuchi, T., Yonekawa, T., Miyamoto, O., et al.: Project Update of the Development of the KM CDR Process. 3rd Post Combustion Capture Conference (PCCC3) 24 Iijima, M., Nagayasu, T., et al.: MHI’s Energy Efficient Flue Gas CO2 Capture Technology and Large Scale CCS Demonstration Test at Coal‐Fire Power Plants in USA. Mitsubishi Heavy Industries Technical Review Vol. 48 No. 1 (March 2011) 25 Hirata, T., Yonekawa, T., Tsujiuchi, T., et al.: Current Status of MHI CO2 Capture Plant technology, 500 TPD CCS Demonstration of Test Results and Reliable Technologies Applied to Coal Fired Flue Gas. GHGT‐12 26 Endo, T., Kajiya, Y., Nagayasu, H., Iijima, M., et al: Current Status of MHI CO2 Capture Plant technology, Large Scale Demonstration project and Road Map to Commercialization for Coal Fired Flue Gas Application. GHGT‐10

Task 1 Technology Selection and Evaluation
Final Report: Pre‐Feasibility Study for Establishing a Carbon Capture Pilot Plant in Mexico 57
proven technology for recovering CO2 from various flue gas sources. MHI claims that users who
adopt the KM CDR process will see tangible benefits such as lower energy consumption, lower
solvent degradation and low corrosion rates.
4.5.2 Operating Experience
Note: ND = Not Disclosed by licensor
Table 4‐5 MHI KM‐CDR Process Operating Experience
NGCC Coal‐Fired Others Total
Commercial Plants ND ND ND 11
Demonstration Plants 0 1 0 1
Pilot Plants ND ND ND 3
FEED Packages Prepared 3 5 1 9
Process Design Packages Prepared ND ND ND 23
Largest Commercial Plant Operating Experience
Location: NRG WA Parish Power Plant, Thompsons, Texas, USA
Flue gas source: Coal
CO2 recovery rate: 90%
CO2 recovered, Nm3/hr: 92,000
Current operating status: Startup due in 4th quarter 2016
Largest Demonstration Plant Operating Experience
Location: Mobile, Alabama, USA
Flue gas source: Coal
CO2 recovery rate: 90%
CO2 recovered, Nm3/hr: 13,000
Current operating status: In operation
Largest Pilot Plant Operating Experience
Location: Osaka, Japan
Flue gas source: Simulated NGCC
CO2 recovery rate: 85‐90%
CO2 recovered, Nm3/hr: 22
Current operating status: In operation
Largest FEED Package Prepared
Location: Not Disclosed
Flue gas source: NGCC
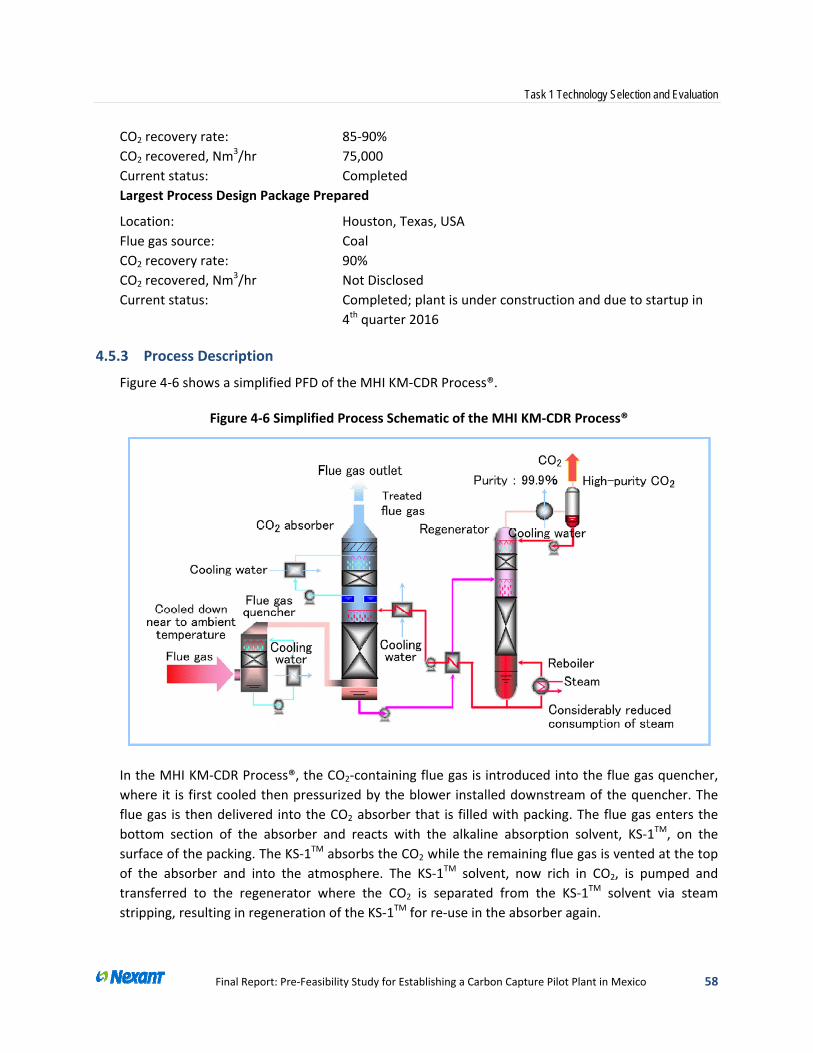
Task 1 Technology Selection and Evaluation
Final Report: Pre‐Feasibility Study for Establishing a Carbon Capture Pilot Plant in Mexico 58
CO2 recovery rate: 85‐90%
CO2 recovered, Nm3/hr 75,000
Current status: Completed
Largest Process Design Package Prepared
Location: Houston, Texas, USA
Flue gas source: Coal
CO2 recovery rate: 90%
CO2 recovered, Nm3/hr Not Disclosed
Current status: Completed; plant is under construction and due to startup in
4th quarter 2016
4.5.3 Process Description
Figure 4‐6 shows a simplified PFD of the MHI KM‐CDR Process®.
Figure 4‐6 Simplified Process Schematic of the MHI KM‐CDR Process®
In the MHI KM‐CDR Process®, the CO2‐containing flue gas is introduced into the flue gas quencher,
where it is first cooled then pressurized by the blower installed downstream of the quencher. The
flue gas is then delivered into the CO2 absorber that is filled with packing. The flue gas enters the
bottom section of the absorber and reacts with the alkaline absorption solvent, KS‐1TM, on the
surface of the packing. The KS‐1TM absorbs the CO2 while the remaining flue gas is vented at the top
of the absorber and into the atmosphere. The KS‐1TM solvent, now rich in CO2, is pumped and
transferred to the regenerator where the CO2 is separated from the KS‐1TM solvent via steam
stripping, resulting in regeneration of the KS‐1TM for re‐use in the absorber again.

Task 1 Technology Selection and Evaluation
Final Report: Pre‐Feasibility Study for Establishing a Carbon Capture Pilot Plant in Mexico 59
The cost of the steam used to regenerate the absorption solvent comprises the greatest portion of
operating costs of CO2 recovery plants. MHI and KANSAI constructed a pilot test plant with a
capacity of 2 metric tons of CO2 per day at the Nanko Power Plant of Kansai Electric Power Co., Inc.
near Osaka, with testing commencing in 1991. These activities conducted at this pilot plant led to
the development and commercialization of the KS‐1™ absorption solvent. Moreover, MHI has been
working to develop new absorption solvents and optimize the process operation in order to fulfil its
goal of further reducing PCC energy consumption.
With regards to emissions and the generation of waste streams, MHI, through numerous amine
emission test campaigns in its small pilot plant and laboratory scale test, discovered that solvent
emissions increased significantly with SO3 concentration in the flue gas at the CO2 absorber inlet, a
problem that is more relevant to coal‐fired flue gas.
MHI has since developed an amine emission reduction system for the KM‐CDR® process and the
system was evaluated at its demonstration plant at Plant Barry in Mobile, Alabama. At the
demonstration plant, a sulfur burner was installed to supply SO3 to the flue gas. In the case of using
the conventional washing and demister system in the CO2 absorber, the test data showed that
amine emissions clearly increased with SO3 concentration at the quencher inlet. However, when
MHI’s amine emission reduction technology was tested, amine emissions were significantly reduced
to less than 1/10 compared with the conventional system. MHI also measured total Volatile Organic
Compound (VOC) emissions and verified that the emissions level of the commercial scale CO2
capture plant using KM‐CDR® Process were acceptable.
4.6 SHELL CANSOLV CO2 CAPTURE TECHNOLOGY
4.6.1 Introduction
The Shell Cansolv PCC process utilizes Cansolv DC‐20127,28,29,30 as the absorbent. It is a regenerable
solvent, which Shell claims to have higher loading capacity and requires lower steam consumption
compared to conventional absorbents in PCC applications.
The Shell Cansolv technology is ideal for use in coal‐fired and natural gas power plants, where
enormous amounts of CO2 are generated. It is also suitable for capturing CO2 from boiler flue gas in
smaller scale applications in the mining and chemical industries. The pure CO2 product output by the
Shell Cansolv technology enables EOR or CCUS downstream of the plant.
27 Stephenne, K.: Start‐Up of World’s First Commercial Post‐Combustion Coal Fired CCS Project: Contribution of Shell Cansolv to SaskPower Boundary Dam ICCS Project. GHGT‐12 28 Singh, A, Stephenne, K.: Shell Cansolv CO2 capture technology: Achievement from First Commercial Plant. GHGT‐12 29 Campbell, M.: Technology Innovation & Advancements for Shell Cansolv CO2 capture solvents. GHGT‐12 30 Shaw, D.: Cansolv CO2 Capture: The Value of Integration. GHGT‐9

Task 1 Technology Selection and Evaluation
Final Report: Pre‐Feasibility Study for Establishing a Carbon Capture Pilot Plant in Mexico 60
4.6.2 Operating Experience
Note: ND = Not Disclosed by licensor
Table 4‐6 Shell Cansolv CO2 Capture Technology Operating Experience
NGCC Coal‐Fired Others Total
Commercial Plants 0 2 1 3
Demonstration Plants ND ND ND ND
Pilot Plants 1 4 4 9
FEED Packages Prepared 1 2 1 4
Process Design Packages Prepared ND ND ND 10
Largest Commercial Plant Operating Experience
Location: Estevan, Saskatchewan, Canada
Flue gas source: Coal
CO2 recovery rate: 90%
CO2 recovered, Nm3/hr: 64,000
Current operating status: In operation
Largest FEED Package Prepared
Location: Aberdeen, Scotland
Flue gas source: NGCC
CO2 recovery rate: 90%
CO2 recovered, Nm3/hr 64,000
Current status: Pre‐Final Investment Decision
4.6.3 Process Description
Figure 4‐7 shows a preliminary simplified PFD of the Shell Cansolv capture plant. The Cansolv CO2
capture plant is comprised of the following major components: (1) Pre‐scrubber: to sub‐cool flue gas
and decrease the SO2 level to below 5 ppmv; (2) CO2 Absorber: to absorb the CO2 in Cansolv DC‐201
solvent; (3) CO2 Stripper: to regenerate the solvent and release CO2, producing a high‐purity CO2
product stream; and (4) Amine purification unit: to remove HSS and degradation products from the
Cansolv solvent and minimize solvent makeup.

Task 1 Technology Selection and Evaluation
Final Report: Pre‐Feasibility Study for Establishing a Carbon Capture Pilot Plant in Mexico 61
Figure 4‐7 Simplified Process Schematic of the Shell Cansolv PCC Plant
Prior to entering the CO2 absorber, the flue gas is passed through the pre‐scrubber to be cooled in a
cooling column and decrease the flue gas SO2 content. This is achieved by a cooled water circulation
loop entering at the top of the cooling column and caustic injection equipped with packing and
counter currently cooling the flue gas.
The flue gas is then ducted to the CO2 absorber, where CO2 is absorbed from the flue gas by
countercurrent contact with the Cansolv DC‐201 solvent in a vertical multi‐level packed‐bed tower.
The gas entering the absorption section of the column will have sufficient pressure to overcome the
pressure drop in the packing. The treated flue gas leaving the top of the CO2 absorption section will
pass through an advanced wash section to maintain water balance and control emissions to the
atmosphere before being released through the stack.
Lean absorbent pumps deliver CO2‐lean absorbent from tankage through the lean absorbent cooler
to the top of the CO2 absorber. The lean absorbent is cooled to enhance the CO2 removal
performance of the absorbent.
The rich absorbent is collected in the bottom sump of the CO2 absorber and is pumped by the rich
absorbent pumps and heated in the CO2 lean/rich heat exchangers to recover heat from the hot lean
absorbent from the stripper bottoms. Rich absorbent is piped to the top of the stripping section of
the CO2 stripper for absorbent regeneration and CO2 recovery. The rich absorbent enters the column
under the CO2 reflux rectification packing section and flows onto a gallery tray that allows for vapor

Task 1 Technology Selection and Evaluation
Final Report: Pre‐Feasibility Study for Establishing a Carbon Capture Pilot Plant in Mexico 62
disengagement from the rich absorbent before it flows down to two stripping packing sections.
Steam generated in the stripper reboilers, flowing counter‐currently to the rich absorbent, is used to
strip the rich absorbent of CO2.
Steam in the stripper, carrying the stripped CO2, flows up the stripper column into the rectification
packing section at the top, where a portion of the vapor is condensed by recycled reflux to enrich
the overhead CO2 gas stream. The CO2 stripper overhead gas is partially condensed in the CO2
stripper overhead condensers. The two‐phase mixture then flows to the CO2 reflux accumulator
where the CO2 is separated from water. The reflux water is collected and returned to the CO2
stripper, while the CO2 product gas is sent to the CO2 compression unit.
The Cansolv absorbent can accumulate HSS, as well as various degradation products over time,
which must be removed from the absorbent to maintain the guaranteed system performance. The
Shell Cansolv process uses an ion exchange package, thermal reclaimer unit, and CO2 absorbent
filters to remove the contaminants.
A small fraction of the lean solvent flow is circulated through the ion exchange package to remove
ionic degradation products. For the non‐ionic species, the thermal reclaimer unit is used to separate
them from the active absorbent. It distills the absorbent under vacuum conditions to separate the
principle constituents of the absorbent; water and absorbent, leaving the degradation products and
other contaminants in the bottom. Finally, cartridge type filter units are used depending on the
amount of particulate and trace metal contaminants present in the absorbent.

Task 1 Technology Selection and Evaluation
Final Report: Pre‐Feasibility Study for Establishing a Carbon Capture Pilot Plant in Mexico 63
5. INTEGRATION METHODOLOGY FOR FULL‐SCALE PCC WITH POZA RICA NGCC
5.1 INTRODUCTION
An objective of the Task 1 study is to select the top three candidates from the six near‐term
commercial‐ready PCC technologies identified in the Pre‐Screening exercise (described in Section 2)
for pilot plant testing within the next 3‐to‐5 years, followed by full‐scale PCC demonstration
implementation in the Poza Rica NGCC power plant 5‐to‐10 years after pilot testing. Both the pilot
and the full‐scale PCC retrofits will be fully integrated into the existing Poza Rica NGCC operation.
The technology selection criterion is to be based on minimum impact on the overall power plant
economics, including both performance and cost impacts, from retrofitting a full‐scale PCC into the
NGCC. The full‐scale PCC is to recover 85% of the CO2 from 100% of the flue gas leaving the NGCC
HRSG. The PCC retrofit scope includes all new systems and modifications of existing NGCC systems
necessary to deliver the captured CO2 to the power plant B/L at 152.7 bara (2,215 psia) for pipeline
transport to an EOR end‐user. The transport pipeline and the EOR designs will be done by other
parties and are outside the scope of this study.
Figure 5‐1 is a simplified block flow diagram showing the major new systems, as well as
modifications to the existing Poza Rica plant, resulting from the PCC retrofit. The major changes
include the following:
1. New flue gas booster compression system
2. New post‐combustion CO2 capture system
3. New CO2 compression and dehydration system
4. Modifications to the existing plant:
a. HRSG stack modifications for flue gas extraction
b. Modifications for steam extraction and power recovery
c. New PCC cooling tower
d. New PCC cooling water pump and circulation system
e. New PCC de‐ionized water system
f. Modified raw water supply & treatment systems
g. Additional interconnecting ducting and piping
Ideally, process H&M balances, equipment designs, performance estimations, operating and capital
costs development for process selection purpose should be done by a single party to ensure
consistency in design and cost estimation philosophy and methodology. This philosophy is carried
out to the maximum extent possible for the Task 1 study. With the exception of the PCC system
(Item 2 in the list above), the design and cost estimates for all other systems listed were carried out
by Nexant on a consistent basis. The PCC systems are proprietary, and their corresponding designs
and cost estimations are carried out by the individual PCC licensors.

Task 1 Technology Selection and Evaluation
Final Report: Pre‐Feasibility Study for Establishing a Carbon Capture Pilot Plant in Mexico 64
Figure 5‐1 Post‐PCC Retrofit Poza Rica NGCC Simplified BFD
Existing NGCC, No Change Design & Cost by Nexant Design & Cost by PCC Licensor Design & Cost by Others
3 IdenticalSteam Turbines
Single GT/HRSG
HP SH Steam
CO2-Rich Flue Gas
Post-PCC Retrofit Poza Rica NGCC
GT/HRSG:1. 163 MW Siemen/Westinghouse GT2. 1,595 MMBtu(LHV)/Hr NG Firing3. 900 MMBtu/Hr HRSG Abs Duty4. 580,000 #/Hr HP Stm
Three Identical Siemen Stm Turb:1. 192,000 #/Hr HP SH Stm Each2. 1,100 psig/975 F HP SH Stm3. 27 MW Gross Pre-PCC Each
PCC Plant CO2 Recovery
PCC Plant CO2
Compression
LP CO2
S/CCO2
CO2-Lean Flue Gas Vent from Absorber top
Flue Gas Booster Blower
Other NGCC Plant Modifications:1. CW/CT Systems2. Raw & Filtered Water Systems3. RO/De-Ionized Water System 4. Electrical Distribution Systems5. Inter-Connecting Pipings
Super-CriticalCO2 to EOR Via
Pipeline
BP Power Recovery Turbine
LP Sat SteamCondensat
De-Superheater

Task 1 Technology Selection and Evaluation
Final Report: Pre‐Feasibility Study for Establishing a Carbon Capture Pilot Plant in Mexico 65
5.2 EVALUATION METHODOLOGY
The evaluation methodology used to determine the overall NGCC economic impact from the
addition of the full‐size PCC consisted of the following:
1. Developed a ThermoFlex model of the existing Poza Rica NGCC to serve as the basis for all PCC integration cases to be evaluated against. The predicted overall NGCC performance is benchmarked against the performance provided by Poza Rica to ensure accuracy of the model.
2. Developed overall balances on power generation/consumption, cooling water loads, and de‐ionized water/filtered water/raw river water demands to define existing NGCC plant support facility capacities. These served as the bases to determine post‐PCC retrofit modifications, and new system additions requirements.
3. Developed a common PCC plant design basis to be used by all licensors to design their respective PCC packages. The design basis identified the following metrics, which are identical for all licensors:
flue gas feed flow, composition, pressure and temperature conditions,
degree of CO2 recovery,
treated flue gas vent emission specifications,
interface utility and offsite commodity supply and return conditions, and
timeframe and location of the provided PCC capital cost.
4. Developed a preliminary generic 30% MEA‐based PCC design to serve as a benchmark for comparison to ensure PCC licensor replies are reasonable. The preliminary generic 30% MEA‐based PCC design includes heat and material balances (HMB), equipment sizing, major equipment (ME) factored cost estimates, and estimated PCC chemical consumptions and costs.
In view of a) the short amount of time available for the PCC licensors to respond to the questionnaire, b) the fact that their responses were provided voluntarily without compensation, and c) the proprietary nature of the PCC licensor data, Nexant anticipated that some of the licensors may not be able to provide all of the interface information necessary for NGCC integration evaluation. The generic MEA design thus provides a means to estimate the missing licensor data needed for NGCC integration.
5. Developed designs and ME factored cost estimates for the new flue gas booster compressor, and the CO2 compression and dehydration systems to fully define the overall NGCC interface requirements of the 30% MEA‐based PCC process systems.
6. Revised the existing Poza Rica NGCC ThermoFlex model to integrate the generic 30% MEA PCC process interface steam/condensate demands to determine post PCC‐retrofit overall steam cycle operation and power generation.

Task 1 Technology Selection and Evaluation
Final Report: Pre‐Feasibility Study for Establishing a Carbon Capture Pilot Plant in Mexico 66
7. Developed overall balances for the post‐PCC retrofitted Poza Rica power generation/ consumption, cooling water loads, and de‐ionized water/filtered water/raw river water demands to define plant modifications, and new system additions needed to support full‐size generic 30% MEA PCC technology.
8. Developed designs and cost estimations of plant modifications and additions needed to support post PCC‐Retrofit Poza Rica operations.
9. Prepared preliminary plot layouts to determine PCC plant locations and to estimate inter‐connecting pipe runs and costs.
10. Estimated incremental overall operating costs between pre‐ and post‐PCC retrofitted NGCC operations.
11. Determined the impact on overall cost of electricity (COE) after integrating the full‐size 30% MEA PCC operations into the Poza Rica NGCC power plant based on the defined capital and operating costs.
12. Repeated above Steps 5 through 11 for each PCC technology based on capital cost and interface requirements provided by the respective PCC technology licensor or supplier.
13. Determined the relative economics of the PCC technologies based on least impact to the overall Poza Rica COE.
5.3 EXISTING (PRE‐PCC RETROFIT) POZA RICA NGCC MODEL PERFORMANCE
5.3.1 Steam Cycle Performance
Keeping the same firing rate of 1,680 GJ/hr [LHV31] (1,595 MMBtu/hr [LHV]) of natural gas, the
ThermoFlex‐modeled, single Siemens/Westinghouse W501F GT generates approximately 166 MWe
of power. Exhaust from the GT goes through a single HRSG and produces roughly 261,300 kg/hr
(576,000 lb/hr) of 79 bara/525 °C (1,152 psia/977 °F) HP steam, 19,400 kg/hr (42,800 lb/hr) of 14
bara/298 °C (198 psia/569 °F) IP steam, plus 14,900 kg/hr (32,800 lb/hr) of 5 bara/179 °C (72 psia/
354 °F) LP steam. Steam from the single HRSG goes to three identical STGs to generate 82.5 MWe of
power, or 27.5 MWe from each STG. Exhaust from each STG goes through an individual surface
condenser. Each condenser is cooled with cooling water (CW) from one dedicated cooling tower.
Figure 5‐2 summarizes the pre‐PCC retrofit Poza Rica NGCC design operation as predicted by the
ThermoFlex model.
31 LHV = Lower Heating Value

Task 1 Technology Selection and Evaluation
Final Report: Pre‐Feasibility Study for Establishing a Carbon Capture Pilot Plant in Mexico 67
Figure 5‐2 Existing Poza Rica NGCC Operation
POWER GENERATION:kW
Generation:
CW Return from Gas Turb Generation 166,570
STG Train 3 STG 2 & STG 3 Stm Turb Generation 82,500 Total Generation 249,070
RFI RFI CalcNatural Filtered GT CW Supply to
Gas Amb Air Exhaust STG 2 & STG 3Mol Wt Vol % Vol % Vol %
N2 28.01 1.01 75.99 73.26 from STG 3
O2 32.00 0.00 20.39 12.32 STG Train 2 One of Three Identical STG Units CO2 44.01 0.81 0.03 3.81 from STG 2 Argon 39.95 0.00 0.92 0.89 645,273 PPH H2S 34.08 0.0330 0.00 0.00 1.29 psia 1.29 psia
CH4 16.04 89.97 0.00 0.00 110 oF 110 deg F C2H6 30.07 6.65 0.00 0.00 32,588 PPH C3H8 44.10 1.04 0.00 0.00 90 deg F iC4 58.12 0.22 0.00 0.00 nC4 58.12 0.20 0.00 0.00 C5's 72.15 0.08 0.00 0.00 C6's 86.18 0.00 0.00 0.00 SO2 64.06 0.00 0.00 0.0011 192,055 PPH
Steam 18.02 0.00 2.67 9.72 1,117 psia 210.4 MMBtu/Hr
Total Vol % 100.00 100.00 100.00 975 deg F 200 PPH
Total MPH 4,355 121,261 125,840 84 psia
Total LB/Hr 77,694 3,477,073 3,554,768 316 deg F LHV, MMBtu/Hr 1,595 0 0 ppmW Sulfur 592 0 13
28.1 MW GrossNGCC Design Basis: 0.6 MW Gen Loss
1. Gas Turbine (GT) Exhaust Gas Temperature (EGT) of 1141 F, flue gas flow of 3,554,734 lb/hr, 27.5 MW Netand gross output of 162.8 MW are from HRSG Case 1 Specifications.
2. GT Air Compressor (AC) pressure ratio of 15.78 and discharge temperature of 788 F are from Siemen GT Startup Load Curve. These are used to back-calc the AC polytropic efficency.
3. HRSG steam & condensate flows are estimated from HRSG Case 1 heat and material balance (H&MB).
4. Steam drum blowdowns are assumed to be 5% of steam generation. Deaerator vent is assumed to be 200 lb/hr. 5. Natural gas and ambient air composition are taken from Request For Information (RFI) table filled by CFE. Exhaust composition are calculated. 32,786 PPH 32,786 PPH
72 psia 84 psia 84 psia 354 deg F 316 deg F 316 deg F
42,802 PPH 198 psia 569 deg F
677,860 PPH 110 deg F
1,302 psia649,916 PPH 84 psia 316 deg F
28,808 PPH
1,556 2003 GT Des Spec Sht 2,140 PPH1,595 MMBtu(LHV)/Hr 218 psia 84 psia
77,694 lbs/hr HRSG-1 316 deg F
474.7 psia 576,165 PPH 579,961
77 oF 1,152 psia 1172 604,974 PPH 977 deg F 976 3,554,768 Lbs/Hr
14.7 psia
195.1 deg F
1023 lb/sec Est @ 59 F Amb T from Flue Gas flow3,477,073 lb/hr @ Actual Amb T
14.7 psia Amb Pressure 14.5 psia Inlet Pressure 9,570 2003 GT Des Spec
89.6 oF Amb Temp 89.6 oF 9,570 Btu/kW-Hr GT Ht Rate57.0 % RH 44,942 PPH HRSG
Flue Gas
232 psia 229 psia 0 lbs/hr Mol Wt MPH Mol% Wet Mol% Dry
787 deg F 2229 deg F N2 28.01 92,188 73.26% 81.15%
166.6 MW O2 32.00 15,504 12.32% 13.65%
162.8 HRSG-1 CO2 44.01 4,793 3.81% 4.22% Argon 39.95 1,121 0.89% 0.99%
Steam 18.016 12,232 9.72%
------------------- -------- -------- --------
Total MPH 125,838 100.00% 100.00% Total LB/Hr 3,554,768
HRSG-13,554,734 3,554,388 lbs/hr
15.14 15.39 psia1,141 1,138 oF
0 2/19/2016 RCRev. Date BY
908 MMBtu/Hr (Flue Gas Cooling) Total5 MMBtu/Hr (Loss) Total Job Rev.
904 MMBtu/Hr (Absorbed) Total No. No.
1 Total Number of HRSGs66' H x 21' W x 49' L Dimensions per HRSG A02484 0
World Bank Mexican NGCC PCC Study
Existing (Pre-PCC Retrofit) POZA RICA NGCC Operation
DRAWING No.
Figure 5-2
Natural Gas Combine Cycle (NGCC) Process Flow DiagramPoza Rica HRSG Design Case (HRSG Case 1) : 32 C Amb T & 57% RH
1xW501F with 3,554,670 Lb/Hr 1141 F Flue Gas at 90 F Amb T & 57% RH
Issued for Task 1 ReportRevision
Nexant, Inc.San Francisco, California
C102MP Steam Drum
Stm Turbine Generator
GT Generator
Air Comp K101Gas Turbine
K102Steam Turbine
E101Heat Recovery Steam Generator (HRSG)
Ambient Air
CW Return
CW Supply
Deaerator Vent
Flue Gas
V-101Stack
C105BD Flash
Drum
GT Nat Gas
GT Combustor
C103LP Stm Drum
/ Dearator
BD To WWT
HP BD
MP BD
E102Surface
Condenser
De-ionized WaterTank
HP SH1HP EVAP
HP SH3 HP SH2
C101HP Steam Drum
MP SH1 MP EVAPMP ECON
LP EVAP MU WATER PREHTR
39
G102 A/BSurf Cond Pump
G102 A/B MP BFW Pumps
51
G103 A/BDIW Pump
22
34
37
15
704
701
19
7
1
G104 A/BCW Pump
LP SH
HP ECON 1
G101 A/B HP BFW Pumps
HP ECON 2 HP ECON 3
DesuperHt BFW
4 5
6
17
38
12
13
20
23
25
32
24
29 30
26
33
45
52
AC Inlet Filter
9
82
5
HP Econ 2 & 3 Bypass 11
34701 704
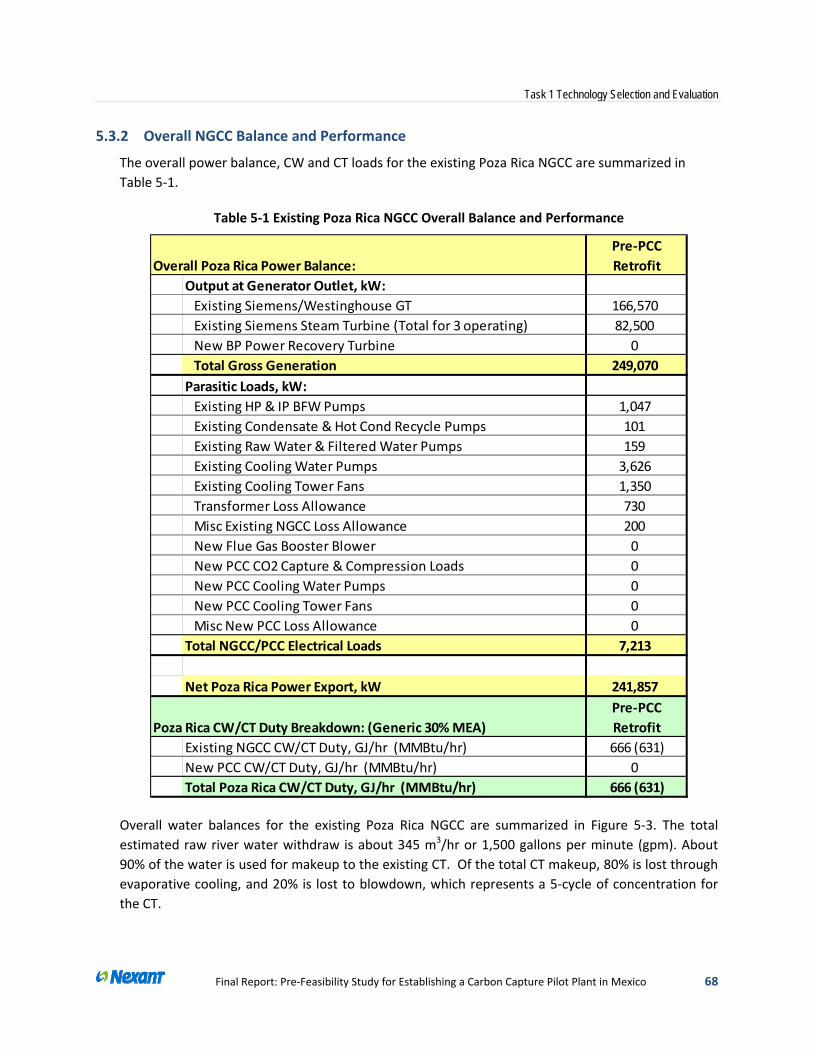
Task 1 Technology Selection and Evaluation
Final Report: Pre‐Feasibility Study for Establishing a Carbon Capture Pilot Plant in Mexico 68
5.3.2 Overall NGCC Balance and Performance
The overall power balance, CW and CT loads for the existing Poza Rica NGCC are summarized in
Table 5‐1.
Table 5‐1 Existing Poza Rica NGCC Overall Balance and Performance
Overall Poza Rica Power Balance:
Pre‐PCC
Retrofit
Output at Generator Outlet, kW:
Existing Siemens/Westinghouse GT 166,570
Existing Siemens Steam Turbine (Total for 3 operating) 82,500
New BP Power Recovery Turbine 0
Total Gross Generation 249,070
Parasitic Loads, kW:
Existing HP & IP BFW Pumps 1,047
Existing Condensate & Hot Cond Recycle Pumps 101
Existing Raw Water & Filtered Water Pumps 159
Existing Cooling Water Pumps 3,626
Existing Cooling Tower Fans 1,350
Transformer Loss Allowance 730
Misc Existing NGCC Loss Allowance 200
New Flue Gas Booster Blower 0
New PCC CO2 Capture & Compression Loads 0
New PCC Cooling Water Pumps 0
New PCC Cooling Tower Fans 0
Misc New PCC Loss Allowance 0
Total NGCC/PCC Electrical Loads 7,213
Net Poza Rica Power Export, kW 241,857
Poza Rica CW/CT Duty Breakdown: (Generic 30% MEA)
Pre‐PCC
Retrofit
Existing NGCC CW/CT Duty, GJ/hr (MMBtu/hr) 666 (631)
New PCC CW/CT Duty, GJ/hr (MMBtu/hr) 0
Total Poza Rica CW/CT Duty, GJ/hr (MMBtu/hr) 666 (631)
Overall water balances for the existing Poza Rica NGCC are summarized in Figure 5‐3. The total
estimated raw river water withdraw is about 345 m3/hr or 1,500 gallons per minute (gpm). About
90% of the water is used for makeup to the existing CT. Of the total CT makeup, 80% is lost through
evaporative cooling, and 20% is lost to blowdown, which represents a 5‐cycle of concentration for
the CT.

Task 1 Technology Selection and Evaluation
Final Report: Pre‐Feasibility Study for Establishing a Carbon Capture Pilot Plant in Mexico 69
Figure 5‐3 Existing Poza Rica NGCC Overall Water Balance
1,080 GPM
1,516 GPM 1,485 GPM 1,350 GPM 270 GPM
30 GPMCondenser Duty = 631 MMBtu/Hr
85 GPM Avg 20 GPM
50 GPM 0 1/21/2016 Initial Estimate for Task 2 RCRev. Date Revision BY
Job Rev.No. No.
A02484 0
DRAWING No.
PFD-Water Bal-101
POZA RICA 240 MW NGCCPCC RETROFIT STUDY
OVERALL WATER BALANCE DIAGRAM
Pre-PCC Operation at 100% GT Output
Existing Cooling Tower
(5 Cycles of Conc.)
Pre PCC Retrofit NGCC Simplified Overall Water Balance Diagram
Existing NGCC ACF/RO/ED System 1x200 GPM ACF/RO
+2x88 GPM ED
1. Existing river water pumps and supply pipeline max capacity is is 1550 gpm.
CT BlowdownRiver Water
CT Evaporation Loss for dissipating Surface Cond
Loads
CT Blowdowns to
WWT & Disposal
Feed Water Treatment:
Clarifier & Filter
Misc NGCC Makeup
Allowance
Exist ACF/RO/ED Purge
Feed Water Treat Purge
5.4 PCC DESIGN BASIS AND QUESTIONNAIRE TO SELECTED LICENSORS
These were discussed previously in Sections 2 and 3. The Design Basis and the request for
information Questionnaire are provided for reference in Appendices D and C respectively.
5.5 FULL‐SIZE 30% GENERIC MEA‐BASED PCC AND CO2 COMPRESSION DESIGN
The simplified PFDs for the full‐size generic 30% MEA PCC and CO2 compression design, together
with the major stream HMBs are presented in Appendix F.
The 30% MEA PCC Plant includes the following major equipment:
• Feed Blower
• Feed Scrubber (direct contact cooler)
• Absorber
• Regenerator/Reboiler/Condenser System
• Rich/Lean Exchanger
• Lean MEA Cooler
• Rich and Lean MEA Pumps
• MEA Filtration and Reclaiming Packages
• MEA Storage Tank
The CO2 Compression Plant includes the following major equipment:
Task 1 Technology Selection and Evaluation
Final Report: Pre‐Feasibility Study for Establishing a Carbon Capture Pilot Plant in Mexico 70
• CO2 Compression with Inter‐stage and After‐Coolers and KO Drums
• Supercritical CO2 Pump, Surge Drum, & After‐Cooler
• CO2 Dehydration Package
Major equipment lists for the MEA PCC Plant and CO2 Compression Plant are also presented in
Appendix F.
5.6 POST‐PCC RETROFIT POZA RICA NGCC MODEL PERFORMANCE
5.6.1 Steam Cycle Performance
Figure 5‐4 summarizes the post‐PCC retrofit Poza Rica NGCC steam cycle operation and
performance, based on using full‐size generic 30% MEA PCC technology, as predicted by the
ThermoFlex model.
The single Siemens/Westinghouse W501F GT is operating at the same throughput as the pre‐PCC
retrofit case, firing 1,680 GJ (LHV)/hr (1,595 MMBtu [LHV]/hr) of natural gas. Based on the model, it
generates approximately 166 MW of power. Exhaust from the GT goes through the single HRSG and
produces roughly 261,000 kg/hr (577,000 lb/hr) of 78 barg/525 °C (1150 psig/975 °F) HP steam,
18,000 kg/hr (40,000 lb/hr) of 12 barg/300 °C (170 psig/570 °F) IP steam, plus 13,000 kg/hr (28,000
lb/hr) of 2 barg/170 °C (30 psig/340 °F) LP steam.
For post‐PCC retrofit operation, roughly 50% of the HP steam from the HRSG is routed to the PCC
plant for amine regeneration uses. As a result, the three existing STGs now only receive roughly half
of the pre‐PCC retrofit HP steam flow. Based on sliding pressure STG operation, HP steam pressure
after each STG’s inlet control stop valve (CSV) drops from the pre‐PCC retrofit value of 76 barg
(1,100 psig) down to roughly 50 barg (730 psig). Power production from each STG drops from 27
MW down to about 13 MW. Each of the three existing surface condenser duties and its associated
CW load also drops to roughly 50% of the pre‐PCC retrofit value.
Since HRSG HP steam generation is the same as pre‐PCC retrofit operation, the pressure exiting the
HRSG HP superheater is essentially the same as pre‐PCC retrofit. The existing STG CSV serves as
backpressure controller between the HRSG outlet and the STG inlet, which should provide
protection against potential excessive differential pressure damage within the HRSG HP steam
generation circuit during post‐PCC retrofit operations. The HRSG IP and LP steam pressure floats on
the STG pressure and will drop slightly from the pre‐PCC retrofit level due to lower STG pressure.
Because the generic 30% MEA PCC regeneration only requires saturated steam at 3 barg (45 psig),
the extraction steam is routed through a new Back Pressure Turbine (BPT) generator to recover
some power from HP steam depressurization. Roughly 50% of the power loss from the three existing
STG is recovered by the BPT. Exhaust from the BPT is de‐superheated with condensate to near
saturation temperature before the steam is sent to PCC regeneration.

Task 1 Technology Selection and Evaluation
Final Report: Pre‐Feasibility Study for Establishing a Carbon Capture Pilot Plant in Mexico 71
Figure 5‐4 Post‐PCC Retrofit Poza Rica NGCC Operation
POWER GENERATION:kW
Generation:
CW Return from Gas Turb Generation 166,550
STG Train 3 STG 2 & STG 3 Stm Turb Generation 39,625 BP Turb Generation 21,617
RFI RFI Calc Total Generation 227,792Natural Filtered GT CW Supply to
Gas Amb Air Exhaust STG 2 & STG 3Mol Wt Vol % Vol % Vol %
N2 28.01 1.01 75.99 73.26 from STG 3
O2 32.00 0.00 20.39 12.32 STG Train 2 One of Three Identical STG Units CO2 44.01 0.81 0.03 3.81 from STG 2 Argon 39.95 0.00 0.92 0.89 342,997 PPH H2S 34.08 0.0330 0.00 0.00 0.83 psia .83 psia
CH4 16.04 89.97 0.00 0.00 96 oF 96 deg F C2H6 30.07 6.65 0.00 0.00 110,143 PPH C3H8 44.10 1.04 0.00 0.00 90 deg F iC4 58.12 0.22 0.00 0.00 nC4 58.12 0.20 0.00 0.00 C5's 72.15 0.08 0.00 0.00 C6's 86.18 0.00 0.00 0.00 SO2 64.06 0.00 0.00 0.0011 92,671 PPH
Steam 18.02 0.00 2.67 9.72 742 psia 114.8 MMBtu/Hr
Total Vol % 100.00 100.00 100.00 955 deg F 200 PPH
Total MPH 4,355 121,261 125,840 60 psia
Total LB/Hr 77,694 3,477,073 3,554,768 292 deg F LHV, MMBtu/Hr 1,595 0 0 ppmW Sulfur 592 0 13
65,380 PPH
13.5 MW Gross 96 deg F
NGCC Design Basis: 0.3 MW Gen Loss1. Gas Turbine (GT) Exhaust Gas Temperature (EGT) of 1141 F, flue gas flow of 3,554,734 lb/hr, 13.2 MW Net
and gross output of 162.8 MW are from HRSG Case 1 Specifications.
2. GT Air Compressor (AC) pressure ratio of 15.78 and discharge temperature of 788 F are from Siemen GT Startup Load Curve. These are used to back-calc the AC polytropic efficency.
3. HRSG steam & condensate flows are estimated from HRSG Case 1 heat and material balance (H&MB). 285,044 PPH
4. Steam drum blowdowns are assumed to be 5% of steam generation. Deaerator vent is assumed to be 200 lb/hr. 175 psia5. Natural gas and ambient air composition are taken from Request For Information (RFI) table filled by CFE. 28,053 PPH 28,053 PPH 256 deg F
Exhaust composition are calculated. 46 psia 60 psia 60 psia 342 deg F 292 deg F 292 deg F
297,418 PPH 40,375 PPH 1,131 psia 185 psia 976 deg F 569 deg F
453,140 PPH 96 deg F
1,295 psia646,598 PPH 60 psia
21.8 MW Gross 292 deg F
0.2 MW Gen Loss 21.6 MW Net
28,772 PPH
2,019 PPH1,595 MMBtu(LHV)/Hr 205 psia 60 psia
77,694 lbs/hr 292 deg F
474.7 psia 575,432 PPH
77 oF 1,145 psia 604,204 PPH 977 deg F
No Vent to Atm
1023 lb/sec Est @ 59 F Amb T from Flue Gas flow3,477,073 lb/hr @ Actual Amb T
14.7 psia Amb Pressure 14.5 psia Inlet Pressure
89.6 oF Amb Temp 89.6 oF 9,571 Btu/kW-Hr GT Ht Rate57.0 % RH 42,394 PPH HRSG
Flue Gas
232 psia 229 psia 0 lbs/hr Mol Wt MPH
787 deg F 2229 deg F N2 28.01 92,188
166.6 MW O2 32.00 15,504
CO2 44.01 4,793 3,554,768 Lbs/Hr Argon 39.95 1,121
14.7 psia Steam 18.016 12,232
195.1 deg F ------------------- --------
Total MPH 125,838 Total LB/Hr 3,554,768
3,554,383 lbs/hr15.39 psia1,138 oF
0 2/19/2016 RCRev. Date BY
908 MMBtu/Hr (Flue Gas Cooling) Total5 MMBtu/Hr (Loss) Total Job Rev.
904 MMBtu/Hr (Absorbed) Total No. No.
1 Total Number of HRSGs66' H x 21' W x 49' L Dimensions per HRSG A02484 0
Nexant, Inc.San Francisco, California
World Bank Mexican NGCC PCC Study
Post-PCC Retrofit POZA RICA NGCC Operation
Issued for Task 1 ReportRevision
DRAWING No.
Figure 5-3
Natural Gas Combine Cycle (NGCC) Process Flow DiagramPoza Rica HRSG Design Case (HRSG Case 1) : 32 C Amb T & 57% RH
1xW501F with 3,554,670 Lb/Hr 1141 F Flue Gas at 90 F Amb T & 57% RH 30 Wt% Generic MEA-Based PCC
C102MP Steam Drum
Stm Turbine Generator
GT Generator
Air Comp K101Gas Turbine
K102Steam Turbine
E101Heat Recovery Steam Generator (HRSG)
Ambient Air
CW Return
CW Supply
Deaerator Vent
Flue Gas
V-101Stack
C105BD Flash
Drum
GT Nat Gas
GT Combustor
C103LP Stm Drum
/ Dearator
BD To WWT
HP BD
MP BD
E102Surface
Condenser
De-ionized WaterTank
HP SH1HP EVAP
HP SH3 HP SH2
C101HP Steam Drum
MP SH1 MP EVAPMP ECON
LP EVAP MU WATER PREHTR
39
G102 A/BSurf Cond Pump
G102 A/B MP BFW Pumps
51
G103 A/BDIW Pump
22
34
37
15
704
701
19
7
1
G104 A/BCW Pump
LP SH
HP ECON 1
G101 A/B HP BFW Pumps
HP ECON 2 HP ECON 3
DesuperHt BFW
4 5
6
17
38
12
13
20
23
25
32
24
29 30
26
33
45
52
AC Inlet Filter
9
82
5
HP Econ 2 & 3 Bypass 11
34701 704
Process Condensate
De-SuperheaterLP Sat Steam to PCC
Regeneration
BP Power Recovery Turbine
PCC Regeneration
PCC Regeneration
PCC Regeneration Return Condensate
PCC Makeup WaterPCC Wash Water Makeup
Flue Gas to PCC
BPT CSV
ExistSTG CSV
Flue Gas Booster Blower

Task 1 Technology Selection and Evaluation
Final Report: Pre‐Feasibility Study for Establishing a Carbon Capture Pilot Plant in Mexico 72
5.6.2 Overall NGCC Balance and Performance
The overall power balance, CW and CT loads for the post‐PCC retrofit Poza Rica NGCC are
summarized in Table 5‐2 for the generic 30% MEA PCC operation. Existing pre‐PCC retrofit
performances are shown for comparison purposes.
Table 5‐2 Post‐PCC Retrofit Poza Rica NGCC Overall Balance and Performance
Overall PR NGCC Power Balance: (Generic 30% MEA)
Pre‐PCC
Retrofit
Post‐PCC
Retrofit
Output at Generator Outlet, kW:
Existing Siemen/Westinghouse GT 166,570 166,550
Existing Siemen Steam Turbine (Total for 3 operating) 82,500 39,625
New BP Power Recovery Turbine 0 21,617
Total Gross Generation 249,070 227,792
Parasitic Loads, kW:
Existing HP & IP BFW Pumps 1,047 1,060
Existing Condensate & Hot Cond Recycle Pumps 101 53
Existing Raw Water & Filtered Water Pumps 159 206
Existing Cooling Water Pumps 3,626 3,626
Existing Cooling Tower Fans 1,350 1,350
Transformer Loss Allowance 730 667
Misc Existing NGCC Loss Allowance 200 200
New Flue Gas Booster Blower 0 8,768
New PCC CO2 Capture & Compression Loads 0 11,902
New PCC Cooling Water Pumps 0 3,292
New PCC Cooling Tower Fans 0 900
Misc New PCC Loss Allowance 0 0
Total NGCC/PCC Electrical Loads 7,213 32,025
Net Poza Rica Power Export, kW 241,857 195,768
Poza Rica CW/CT Duty Breakdown: (Generic 30% MEA) Pre‐PCC Post‐PCC
Existing NGCC CW/CT Duty, GJ/hr (MMBtu/hr) 666 (631) 363 (344)
New PCC CW/CT Duty, GJ/hr (MMBtu/hr) 0 466 (441)
Total Poza Rica CW/CT Duty, GJ/hr (MMBtu/hr) 666 (631) 829 (786)
The overall water balance for post‐PCC Poza Rica NGCC operation based on generic 30% MEA is
summarized in Figure 5‐5. The total estimated raw river water withdraw is about 430 m3/hr or 1,900
gpm. Approximately 80% of the water is used for makeup to the existing CT and the new PCC CT. Of
the total CT makeup, 80% is lost through evaporative cooling, and 20% is lost to blowdown which
represents a 5‐cycle of concentration for the CT.
Compared to the existing water usage shown in Figure 5‐3, the generic 30% MEA retrofit will
increase the overall Poza Rica raw water import by about 90 m3/hr or 400 gpm. Since the existing
river water withdraw is already near the maximum allowed, a new river water withdraw permit may
be required before PCC retrofit can proceed.

Task 1 Technology Selection and Evaluation
Final Report: Pre‐Feasibility Study for Establishing a Carbon Capture Pilot Plant in Mexico 73
Figure 5‐5 Post‐PCC Retrofit Poza Rica NGCC Overall Water Balance
755 GPM
809 GPM 189 GPM
135 GPM
PCC Cooling Duty =
441 MMBtu/Hr
1,922 GPM589 GPM
336 GPM
1,883 GPM 1,545 GPM 737 GPM 147 GPM
38 GPMCondenser Duty = 344 MMBtu/Hr
20 GPM
48 GPM135 GPM
204 GPM 156 GPM 131 GPM
84 GPM Avg
0 1/21/2016 RC
Rev. Date BY
25 GPM
50 GPM
Job Rev.No. No.
A02484 0
DRAWING No.
PFD-Water Bal-102
Initial Estimate for Task 2
Revision
1/0/1900
30% MEA PCC RETROFIT STUDY
OVERALL WATER BALANCE DIAGRAM
Post-PCC Operation at 100% GT Output
PCC Cooling Towers (5 Cycles of
Conc)
New PCC ACF/RO/ED Systems
(77% Recovery)DM Water
PCC CT Blowdown
PCC MEA Absorber
Incremental BFW MU for PCC Stm
Injection
PCC CT Evaporation Loss for dissipating PCC Cooling Loads
New PCC ACF/RO/ED Purge
Makeup Wash Water
Post PCC Retrofit NGCC Simplified Overall Water
Balance Diagram
Existing CT Blowdown
CT Blowdowns to WWT & Disposal
PCC MEA-free Cond Purge
PCC MEA Feed
Scrubber
CT Evaporat'n Loss for dissipating Surface Condenser Cooling
L d
Existing Cooling Tower (5 Cycles of Conc.)
River Water
1. Existing river water pumps and supply pipeline max capacity is is 1550 gpm.
Feed Water Treatment: Clarifier & Filter
Existing NGCC AFC/RO/DM System1x200 GPM RO
+2x88 GPM ED
Misc NGCC Makeup
Allowance
Exist ACF/RO/ED Purge
Feed Water Treat Purge
5.7 NGCC PLANT MODIFICATIONS REQUIRED FOR PCC RETROFIT
The NGCC plant modifications major equipment list is presented in Appendix F. The major units and
summaries of their functions are presented below:
Louvers to the Existing HRSG Stack – Two sets of these flap‐type dampers are installed in the
existing stack. One set, installed near the top of the stack, is designed to be closed when the PCC is
in operation to prevent the untreated flue gas from exiting. The second set is installed at the base of
the HRSG in the ducting that leads to the absorber. This damper will be opened during PCC
operation to allow the flue gas flow to the absorber. A cost allowance for an additional (third) louver
is included for HRSG low‐pressure protection.
Flue Gas Ducting – New ductwork is required to route the flue gas leaving the HRSG to the PCC
facilities. The treated flue gas is vented to the atmosphere from the top of the absorber and is not
routed back to the existing stack, so no return ducting is necessary.
Letdown Steam Turbine – A portion of the superheated HP steam is extracted from the main steam
line to supply the PCC regeneration steam demand. Since the HP steam pressure is much higher
than what the PCC plant requires, a BPT generator is installed upstream of the PCC plant to recover
Task 1 Technology Selection and Evaluation
Final Report: Pre‐Feasibility Study for Establishing a Carbon Capture Pilot Plant in Mexico 74
some power from the HP extraction steam before it is exhausted at the pressure required for the
PCC plant.
Desuperheater – The exhaust steam leaving the BPT is still superheated and too hot for PCC reboiler
operation. A water spray desuperheater is installed to cool the BPT steam exhaust to near saturation
before feeding to the PCC.
Piping Modifications – Piping is installed to route the superheated HP steam to the BPT and from
the BPT to the CO2 regenerator column’s reboiler. The reboiler condensate is also piped back to the
deaerator located in the steam plant.
PCC Cooling Tower – After Nexant’s visit to the Poza Rica NGCC plant, it was understood that CFE
would like to retain maximum operational flexibility after PCC retrofit by keeping all three steam
turbines and their respective CTs available. One new CT, consisting of six (6) cooling cells, is required
to handle the 30% MEA PCC plant’s additional cooling loads. Underground concrete CW piping
associated with the new CT is included to route the CW to and from the PCC CW consumers.
New Deionization Unit – Due to additional deionized (DI) water requirements for MEA absorber
water wash and larger BFW makeup water demand, a new reverse osmosis (RO)/DI unit is added to
the existing RO/DI system.
Miscellaneous Pumps – These are the pumps associated with the new CT, new RO/DI unit, DI water
flowing to the water wash section of the CO2 absorber, and the additional raw river water required
to be pumped from Canal de Llamada.
5.8 PRELIMINARY POST‐30% MEA PCC RETROFIT PLOT LAYOUTS
5.8.1 Preliminary PCC Plot Layouts
The 30% MEA‐based PCC plant is divided into 5 sections: Flue Gas Blower, MEA tankage, CO2
absorption, CO2 regeneration, and CO2 compression. Figure 5‐6 shows a preliminary layout of the
flue gas blower, MEA tankage and CO2 absorption sections, while Figure 5‐7 shows the CO2
regeneration and CO2 compression/dehydration sections. The estimated dimensions for each of the
major process areas are:
Flue Gas Booster Blower: 30 ft x 30 ft (~ 9 m x 9 m)
CO2 Absorption: 190 ft x 100 ft (~ 58 m x 31 m)
CO2 Regeneration: 150 ft x 320 ft (~ 46 m x 98 m)
CO2 Compression: 150 ft x 130 ft ( ~ 46 m x 40 m)
MEA Tankage: 100 ft x 80 ft (~ 31 m x 24 m)
Based on these figures, the total estimated plot space required for the 30% MEA‐based PCC
including flue gas blower and CO2 compression/dehydration but excluding plant modifications is

Task 1 Technology Selection and Evaluation
Final Report: Pre‐Feasibility Study for Establishing a Carbon Capture Pilot Plant in Mexico 75
about 9,000 m2 (96,000 ft2). Plant modification included a new cooling tower, which adds
approximately 1,594 m2 (17,000 ft2) into the overall plot space required.
5.8.2 PCC Equipment Placement/Integration Guidelines
The flue gas blower and PCC absorber tower locations are most critical due to the significant and
sizeable flue gas ducting interconnection and exhaust/stack features. These components need to be
located as close as possible to each other and to the existing stack to minimize the ductwork
requirements and the associated pressure drop.
The PCC regeneration facilities and CO2 compressors, while being significant components with
sizeable footprints, can have more flexibility for placement and distance since the interconnection
with the absorber towers are piping connections and not ductwork. The regeneration and
compressor facilities are located so as to make best use of available plot area while providing for
suitable construction, operations and maintenance access.
Per the description in Section 5.7, a new cooling tower is required for the PCC facilities. The cooling
tower requirements for the PCC facilities are not insignificant, as can be seen by the relative size of
the proposed PCC cooling tower shown on the site layout. The cooling tower is placed in available
space while respecting their need to be oriented with the prevailing wind directions for proper
performance.
Figure 5‐8 shows the preliminary, aerial view of the Poza Rica NGCC after 30% MEA PCC retrofit. The
white boxes represent the plot areas that are available for the retrofit PCC equipment and NGCC
plant modifications. This figure clearly shows that there is sufficient plot space required for a 30%
MEA‐based PCC retrofit. The major interconnecting pipe lengths were estimated based on this plot
plan.

Task 1 Technology Selection and Evaluation
Final Report: Pre‐Feasibility Study for Establishing a Carbon Capture Pilot Plant in Mexico 76
Figure 5‐6 30% MEA PCC Plot Layout – Flue Gas Blower, MEA Tankage and CO2 Absorption Sections
G-106
K-101
MEA Absorber
C-10146' ID
G-101 A & B
PIP
EW
AY
MEA TANKAGE
CO2 ABSORPTION
G-100 A & B
FLUE GAS DUCT
G-103 A & B
To
Am
ine
Reg
ener
atio
n
FG Blower
E-105
E-100
Feed Scrubber
C-10044' ID
MEA Storage Tank
D-10158' ID

Task 1 Technology Selection and Evaluation
Final Report: Pre‐Feasibility Study for Establishing a Carbon Capture Pilot Plant in Mexico 77
Figure 5‐7 30% MEA PCC Plot Layout – CO2 Regeneration and Compression/Dehydration Section
PIPEWAY
C-103
C-1
06
CO2 COMPRESSION
C-302
E-104A
E-104B
E-104C
E-104D
E-1
04
E
E-1
04
F
E-1
04
G
E-1
04
H
D-102&
G-107
E-102 A
E-102 B
E-102 C
E-102 D
G-102 A & B
G-104 A & B
E-101 B
E-101 C
E-101 D
E-101 E
E-101 A
K-301CO2 Compressor
K-301Motor
K-301Lube & Seal
Oil Skid
C-301
E-301 A / E-302 A
E-301 B / E-302 B
G-301 A & B
E-303 A / E-304 A
E-303 B / E-304 B
C-304
C-303
G-302 A & B
PIPEWAY
PIP
EW
AY
PIP
EW
AY
PIP
EW
AY
E-1
06
E-102 A
E-102 B
E-102 C
E-102 D
E-102 E
E-102 F
E-102 G
E-1
03
Dehydration Skid
MEA REGENERATION
BP
T
C-10211' ID (Top) x 16' ID (Btm)
Stripper

Task 1 Technology Selection and Evaluation
Final Report: Pre‐Feasibility Study for Establishing a Carbon Capture Pilot Plant in Mexico 78
Figure 5‐8 Retrofitted Poza Rica NGCC with 30% MEA PCC Plot Plan
250 ft
240 ft
175 ft
150 ft
150 ft
150 ft
900 ft
600 ft
Flue Gas Blower MEA Storage TankCO2 Absorption Plant CO2 Regeneration Plant CO2 Compression Plant
75 ft
90 ft
CW Pumphouse
BPT
New Cooling Tower
Makeup Water Line(Above Ground)
New CT CW Line(Below Ground)
PCC Pipe Rack PCC Steam/Condensate Line
Available Plot Space
Task 1 Technology Selection and Evaluation
Final Report: Pre‐Feasibility Study for Establishing a Carbon Capture Pilot Plant in Mexico 79
5.9 POZA RICA NGCC PCC RETROFIT ECONOMIC EVALUATION BASIS
5.9.1 Incremental Capital Cost
Each PCC licensor provided the design and the capital cost of the CO2 absorption/regeneration
plants associated with their respective proprietary PCC technology. Nexant developed the design
and capital cost of the CO2 absorption/regeneration plants for the generic 30% MEA‐based PCC
plant. In addition, Nexant also developed the designs and the capital costs for all of the other non‐
solvent related systems that are integral to NGCC PCC retrofitting, for the generic MEA technology,
and for all of the licensed PCC technologies. These non‐solvent related systems include: the flue gas
feed booster compression unit, CO2 compression/dehydration unit, and NGCC plant modifications.
In doing so, each PCC licensor’s responsibility/input is limited specifically to its technology,
minimizing any potential non‐PCC technology related interferences and inconsistencies associated
with technology comparison.
Capital costs for the Nexant‐designed systems were major‐equipment (ME) factored estimates for
U.S. Gulf Coast (USGC) locations with a target accuracy of ± 30 percent. For ME factored estimates,
equipment material and labor costs were developed from equipment sizes, quantities, and other
applicable design parameters. Bulk material and labor costs were factored from the ME costs. The
sum of the ME and bulk material costs, including shipping costs, forms the Total Direct Cost (TDC).
Construction indirect cost, factored from total direct labor cost, is added to the TDC to arrive at the
Total Field Cost (TFC). Vendor startup support cost (factored from ME cost), Home Office cost
(factored from TFC), and contingency (factored from TFC) are added to the TFC to come up with the
Total Plant Cost (TPC). The CAPEX reported in this study is at the TPC level. For the Nexant‐designed
systems, a contingency of 30% was added to cover uncertainties associated with scale‐up, missing
equipment and facilities associated with turndown, startup, normal/emergency shutdown, and
other transient operations not yet defined with a conceptual design.
Table 5‐3 summarizes the estimated capital cost for the generic MEA‐based PCC plants. The
estimated capital cost of the existing NGCC is included for comparison and to facilitate economic
evaluation via calculation of cost of electricity, described in greater detail in Section 6.3. Capital cost
of the existing NGCC is estimated assuming an installed cost of $1000/kW gross output.
Values listed in Table 5‐3 are January 2015 capital costs for USGC locations. Based on Nexant’s in‐
house historical data, the installed cost for Mexico location can vary anywhere from 80% to 120% of
the USGC cost. For this study, it is assumed that Mexico installed costs are the same as USGC
installed costs. For those non‐USGC capital costs provided by PCC licensors, they were adjusted to
USGC costs using Nexant’s in‐house historical location cost factors.

Task 1 Technology Selection and Evaluation
Final Report: Pre‐Feasibility Study for Establishing a Carbon Capture Pilot Plant in Mexico 80
Table 5‐3 Generic 30% MEA‐based PCC Retrofit Capital Costs
Total Poza Rica NGCC Capital Costs, $MM Jan 2015: (Generic 30% MEA)
Pre‐PCC
Retrofit
Post‐PCC
Retrofit
Existing Poza Rica NGCC * 249 249
Flue Gas Booster Blower 0 14
PCC CO2 Capture & Compression/Dehydration 0 181
NGCC Plant Modifications 0 33
Total NGCC/PCC CapEx, $MM Jan 2015 at PR 249 477
Total Incremental CapEx, $MM Jan 2015 at PR Base 228
* Assumed existing Poza Rica NGCC CapEx at $1000 per gross kW
5.9.2 Incremental Operating Cost
Operating and maintenance (O&M) costs for retrofitting the Poza Rica NGCC with PCC is allocated as
either fixed and variable operating costs.
Fixed operating costs are essentially independent of actual capacity factor, number of hours of plant
operation, or amount of kilowatts produced. It consists mainly of costs for employee salaries, taxes
and insurances. For this study, the following are assumed for all cases:
1. 3 new 24/7 (operator) positions at 4.66 shifts/position for 14 total additional employees at
$40,000/year salary plus benefits
2. 3 new 8/5 (administrative) employees at $40,000/year salary plus benefits
3. Maintenance material and labor equal to 2.5% of CAPEX
4. Annual operating cost allowance for insurance at 1% of CAPEX
5. Annual operating cost allowance for property tax at 1% of CAPEX.
Variable operating costs are directly proportional to the power plant throughputs, and include
purchase costs for process consumables, catalysts and chemicals. Process consumables are feeds
directly used for power generation such as natural gas and raw water imports, plus disposal cost for
waste water discharges. Process consumables also include sale revenue (or disposal cost) associated
with the captured CO2 product. Catalysts and chemicals are primarily used for water treatments
(feed water, BFW, CW and waste water treatments), plus PCC amine, additive and filters
replacement and disposal costs. For this study, variable costs are estimated assuming:
Natural gas is priced at $2.37/GJ (LHV) or $2.50/MMBtu (LHV)
Raw river water is priced at $74/1000 m3 or $0.28/1000 gallons
Treated waste water is discharged back to the river at $7.4/1000 m3 or $0.028/1000 gallons
Annual on‐stream factor (AOF) of 8,000 hours per year (91.3%)
CO2 has zero worth (no renewable credits nor sale of CO2 for EOR purposes)
Amine makeup/disposal, as well as filter replacement/disposal costs for all cases are the
same as that for 30% generic MEA.

Task 1 Technology Selection and Evaluation
Final Report: Pre‐Feasibility Study for Establishing a Carbon Capture Pilot Plant in Mexico 81
Due to the lack of PCC licensors’ responses relating to makeup costs for their proprietary solvents,
identical amine makeup costs are assumed for this study. While licensors are claiming significant
reduced solvent degradation losses compared to generic MEA, past Nexant studies on advanced
amines for PCC services had shown that the higher solvent prices tend to offset the savings on
reduced solvent losses, hence the overall amine makeup costs are about the same.
Table 5‐4 summarizes the estimated annual operating costs for the Poza Rica NGCC before and after
full‐size generic 30% MEA‐based PCC retrofit. It should be noted that the actual chemical
consumptions and costs information are not available from the Poza Rica plant. Values shown in
Table 5‐4 are typical treating requirements from past projects. Compared to the PCC contributions
of roughly $6.89 MM/year, these estimated water treating chemical costs highlight the relatively
minor contribution (roughly $0.58 MM/year or 10%) to the incremental catalysts & chemical costs
for PCC‐retrofit.
Table 5‐4 Generic 30% MEA‐based PCC Operating Costs
ANNUAL OPERATING COSTS, $MM/Year: (Generic 30% MEA)
Pre‐PCC
Retrofit
Post‐PCC
Retrofit
PROCESS CONSUMABLE COSTS (VARIABLE):
Natural Gas Feed 31.85 31.85
River Water Import 0.28 0.35
CO2 Product Export ‐ ‐
Process Waste Water Disposal 0.01 0.01
TOTAL PROCESS CONSUMABLES 32.13 32.21
CATALYSTS & CHEMICAL COSTS (VARIABLE): ***
Water Treating Chemicals 2.56 3.14
PCC Amine/Additives Makeup & Disposal * ‐ 6.47
PCC Carbon/Filters/Dessicant Replace & Disposal * ‐ 0.42
TOTAL CAT & CHEMICALS 2.56 10.03
FIXED COSTS:
Operating Labor ** 2.79 3.35
Maintenance Labor 3.74 7.16
Maintenance Material 2.49 4.77
Overhead Charges 2.40 2.52
Insurance & Property Tax 4.98 9.55
TOTAL FIXED COSTS 16.40 27.35
TOTAL OPERATING & MAINTENANCE COST 51.09 69.59
* Cost includes disposal allowance.
** Assumed 3 additional operating positions at 4.65 shifts per position.
*** Chemical usages are typical from past projects and do not necessary represent actual Poza Rica usages

Task 1 Technology Selection and Evaluation
Final Report: Pre‐Feasibility Study for Establishing a Carbon Capture Pilot Plant in Mexico 82
5.9.3 Economic Evaluation Figure‐of‐Merit
The PCC process economic evaluation was conducted based on the overall performance (net power
export) of the Poza Rica NGCC with PCC retrofit, total capital expenditure (CAPEX) and operating
expenditure (OPEX). The overall economic performance of the Poza Rica NGCC with PCC was
evaluated using two figures‐of‐merit that took into account the abovementioned parameters. The
figures‐of‐merit are:
CAPEX + 7 Year OPEX Breakeven Electricity Price;
Cost of Electricity (COE)
CAPEX + 7 Year OPEX Breakeven Electricity Price (BEP)
This was the evaluation method recommended in the original study proposal. It is the required
electricity selling price required to recoup the capital expenditure plus 7 years’ worth of operating
expense. The formula for this breakeven price (BEP) is:
where AOF is the Annual On‐stream Factor. In order to calculate the BEP, it is necessary to include
the CAPEX and OPEX of the existing Poza Rica NGCC plant. These costs were shown under the “Pre‐
PCC” columns in Table 5‐3 and Table 5‐4. Using the same formula, Nexant estimated the CAPEX + 7
year OPEX BEP of the existing Poza Rica NGCC without PCC. The calculated pre‐PCC COE was then
used as the baseline cost in order to calculate the incremental BEP. The incremental BEP is the
difference between the post‐PCC BEP and the pre‐PCC BEP.
Table 5‐5 summarizes the estimated BEP for the generic MEA‐based PCC plants. The impact of CO2
product price on BEP is also shown. Revenue from the sale of CO2 decreases the electricity sale price
needed to breakeven on costs. The greater the CO2 product price, the lower the BEP. It is shown in
Table 5‐5 that a CO2 sale price of around $99 per metric ton (MT) or $90 per short ton (ST) is
required in order for the post‐PCC retrofit BEP to be the same as the pre‐PCC BEP.
Table 5‐5 Generic 30% MEA‐based PCC Retrofit CAPEX + 7 Year OPEX BEP

Task 1 Technology Selection and Evaluation
Final Report: Pre‐Feasibility Study for Establishing a Carbon Capture Pilot Plant in Mexico 83
Cost of Electricity (COE)
The COE is the metric used by the U.S. DOE to evaluate power plants with CO2 capture. It is the
revenue received per net MWh that provides the stipulated internal rate of return on equity over
the entire economic analysis period. A simplified formula for the COE applies a capital charge factor
(CCF) to the CAPEX, which is based on a certain set of economic assumptions. These assumptions are
listed in Table 5‐7.
The formula for calculating the COE is:
where the CCF = 0.111 for NGCC plants with CO2 capture.
Again, Nexant estimated the pre‐PCC Poza Rica NGCC’s COE and used it as the baseline cost to
calculate the incremental COE. The incremental COE is the difference between the post‐PCC COE
and the pre‐PCC COE. Table 5‐6 summarizes the estimated COE for the generic MEA‐based PCC
plant:
Table 5‐6 Generic 30% MEA‐based PCC Retrofit COE
Cost Of Electricity (COE), $/MWh: (Generic 30% MEA)
Pre‐PCC
Retrofit
Post‐PCC
Retrofit
Capital Charge Factor (CCF) 0.111 0.111
Annual Onstream Factor (AOF) @ 8,000 hrs/yr 91.3% 91.3%
CapEx, $MM 249 477
Fixed OpEx, $MM/yr 16.4 27.4
AOF*Variable OpEx, $MM/yr 2.8 10.4
AOF*NG Cost, $MM/yr 31.8 31.8
AOF*Annual Net Power Export, MWh/yr 1,934,860 1,566,141
Calc COE, $/MWh 40.7 78.3
Incremental COE, $/MWh Base 37.6
* COE=(CCFxCapEx+Fix OpEx+AOF*Variable OpEx+AOF*NG Cost)/(AOF*Annual Net Power Export)

Task 1 Technology Selection and Evaluation
Final Report: Pre‐Feasibility Study for Establishing a Carbon Capture Pilot Plant in Mexico 84
Table 5‐7 Economic Assumptions Used to Determine CCF
38% Effective Tax Rate
20 years, 150% declining balance
None
None
30 years
None
None
3.60%
Construction Period 3 years
10%, 60%, 30%
Zero for all parameters
100%
3.00%
Type of Security
Debt
Equity
TAXES
Income Tax Rate
FINANCING TERMS
Repayment Term of Debt
Grace Period on Debt Repayment
Capital Depreciation
Investment Tax Credit
Tax Holiday
Distribution of Total Overnight Capital over the Capital Expenditure
Period (before escalation)
Working Capital
% of Total Overnight Capital that is Depreciated
Debt Reserve Fund
TREATMENT OF CAPITAL COSTS
Capital Cost Escalation During Construction (nominal annual rate)
45
55
INFLATION
RSP, O&M, Fuel Escalation (nominal annual rate)
FINANCIAL STRUCTURE (HIGH RISK INVESTOR OWNED UTILITY)
Percent of Total
5.9.4 Poza Rica NGCC Economics for Full‐Size Licensor PCC Retrofit
The economic evaluation methodology described in this section was repeated for each of the
licensed PCC technology using data supplied by the respective PCC licensor. The results are
discussed in further detail in Section 6.

Task 1 Technology Selection and Evaluation
Final Report: Pre‐Feasibility Study for Establishing a Carbon Capture Pilot Plant in Mexico 85
6. RESULTS OF FULL‐SCALE PCC INTEGRATION WITH POZA RICA NGCC
6.1 POZA RICA NGCC PRE‐ AND POST‐30% MEA PCC RETROFIT PERFORMANCE
As mentioned in the evaluation methodology presented in Section 5, Nexant modeled the existing
(i.e. pre‐PCC retrofit) Poza Rica NGCC performance based on its operation information/data
provided by CFE. Nexant then developed a conceptual design of a full‐scale PCC plant based on a
generic 30 wt% MEA process, and modeled the full‐scale effect of retrofitting it onto the Poza Rica
plant. The 30 wt% MEA PCC design was based on Nexant’s in‐house data, and retrofitting it onto the
Poza Rica plant serves the purpose of providing a preliminary independent assessment of the impact
of CO2 capture on the Poza Rica plant performance. It also helps to establish a reference design from
which to evaluate and compare the six selected PCC technologies.
The pre‐PCC retrofit Poza Rica NGCC CO2 emission rate is estimated to be 2,297 mTPD (2,532 STPD),
for a net power output of 242 MW. The required CO2 capture, as stated in the design basis, is 85%,
or 1,952 mTPD (2,152 STPD) of CO2.
Table 6‐1 summarizes and compares the Poza Rica plant performance before and after retrofitting
for CO2 capture, based on the generic 30 wt% MEA‐process design. As shown, significant plant
performance penalty is expected. The plant experiences a net power export reduction of about 46
MW, or 19%, from 242 MW to 196 MW. This corresponds to a net plant efficiency drop from 51.8%
to 42.0%, a loss of almost 10 percentage points. The majority of the power reduction is due to the
reduced output from the steam turbines and the auxiliary power requirements to run the PCC plant.

Task 1 Technology Selection and Evaluation
Final Report: Pre‐Feasibility Study for Establishing a Carbon Capture Pilot Plant in Mexico 86
Table 6‐1 Poza Rica NGCC Pre‐PCC vs Post‐30% MEA PCC Retrofit Performance Summary
Pre‐PCC RetrofitPost‐PCC
Retrofit
NGCC CO2 Emissions, MTPD (STPD) 2297 (2532) 345 (380)
Recovered CO2 Product, MTPD (STPD) 0 (0) 1952 (2152)
% CO2 Capture 0 85%
Power Balance, MW
Generation
Gas Turbine Gross Output 166.6 166.6
Steam Turbine Gross Output 82.5 39.6
Back Pressure Turbine 0 21.6
Total Gross Output 249.1 227.8
Auxiliary Consumption
Existing NGCC Plant Parasitic Loads 7.2 7.2
Flue Gas Blower 0 8.8
PCC + CO2 Compression + Plant Mods 0 16.1
Total New PCC Parasitic Load 7.2 32.0
Net Power Plant Export, MW 241.9 195.8
Delta Plant Export, MW ‐46.1
% Plant Export Reduction ‐19%
Net Plant Heat Rate, MJ/kWh (Btu/kWh) 6.94 (6584) 8.57 (8134)
Net Plant Efficiency, % LHV 51.8 42.0
Delta Plant Efficiency, percentage pt ‐9.9
Incremental Water Import, lpm (gpm) 0 (0) 1537 (406)
6.2 POZA LICENSOR RESPONSES CHECK AGAINST GENERIC 30% MEA
The different PCC technology licensors were responsible for providing the PCC B/L performance and
cost data in order for Nexant to perform the overall Poza Rica full‐scale retrofit evaluation. As a
check against posting or interpretation errors, selected licensor responses are compared against the
generic 30% MEA design. These are summarized in Table 6‐2. Due to the proprietary nature of the
data, the information is expressed as a percentage relative to the Nexant in‐house 30% MEA
Reference Design values, so that the actual data would remain confidential.
As shown in Table 6‐2, all advanced amine‐based PCC technology licensors’ design were based on
85% CO2 recovery except for Fluor which was based on 90% CO2 recovery. Due to time constraints,
Fluor was not able to provide the design for 85% CO2 recovery.

Task 1 Technology Selection and Evaluation
Final Report: Pre‐Feasibility Study for Establishing a Carbon Capture Pilot Plant in Mexico 87
Relative heat of regeneration per unit CO2 captured from PCC licensors indicate about 20‐25% lower
than that for generic 30% MEA, which is consistent with typical claims by advanced amine providers.
Within the group, the differences cited are rather small.
Relative cooling loads (total for amine plus CO2 compression) are generally higher than that for
generic 30% MEA design. While one would expect lower cooling loads for the advanced PCC due to
lower regeneration heat input, the higher cooling loads could be a result of lower absorber feed
temperatures compared to the generic 30% MEA design.
Relative PCC auxiliary power consumption varies between 50% and 150% of the 30% MEA design.
These variations are inherent to the values provided by the licensors themselves. It is noted that
HTC did not provide the auxiliary power consumption of their PCC unit. In order to calculate the
HTC’s PCC performance, Nexant assumed that the auxiliary power consumption is 80% of the
generic MEA PCC power consumption, proportionate to the PCC regeneration heat.
Except for Alstom, all of the PCC licensor‐quoted CAPEXs are within about 10% of the estimate
CAPEX for the generic MEA design. This is remarkably consistent considering the potentially
different design philosophies, estimation details and methodology used among the PCC licensors.
The quoted CAPEXs were used directly in the economic evaluations. Relative ranking sensitivity to
PCC CAPEXs was carried out and results are discussed in Section 6.6.
Table 6‐2 Selected Summary of PCC Licensor Responses Relative to Nexant 30% MEA PCC Case
See Note 1Reference
30% MEA PCC
Design
Alstom
Advanced
Amine
BASF/Linde
PCC
Fluor
Econamine
Plus HTC Purenergy
MHI KS‐1
Process Shell CanSolv
CO2 Capture Rate 85% 86% 85% 90% 85% 85% 85%
PCC Regeneration Heat Relative to 100% 74% 74% 77% 80% 75% 73%
30% MEA
Cooling Load Relative to 30% MEA 100% 134% 107% 115% 88% 120% 115%
PCC Auxiliary Power Consumption 100% 155% 54% 109% N/A 59% 45%
Relative to 30% MEA (assume ~80%)
Reported CAPEX Reference USGC Western USGC USGC Canada USGC USGC
Location Europe
CAPEX (USGC) Relative to 100% 141% 107% 102% 112% 98% 112%
30% MEA Note 1: Values presented here are Nexant’s interpretation of the data provided by the PCC licensors and relative to
Nexant’s in‐house 30% MEA design.
6.3 POZA RICA NGCC POST‐PCC RETROFIT PERFORMANCE EVALUATION FOR ALL LICENSORS
For this study, Nexant was responsible for integrating the PCC plant into the existing Poza Rica NGCC
plant in order to evaluate the overall Poza Rica NGCC performance after PCC retrofit for each of the
CO2 capture technologies. Each respective PCC technology provider’s responsibility was limited to

Task 1 Technology Selection and Evaluation
Final Report: Pre‐Feasibility Study for Establishing a Carbon Capture Pilot Plant in Mexico 88
providing their PCC B/L performance and cost estimation. Nexant provided the design of other units
integral to retrofitting the Poza Rica NGCC with PCC. These include: the flue gas feed blower, CO2
compression and dehydration unit, and NGCC plant modifications for PCC retrofit. By providing a
consistent design for each of these non‐proprietary units for all six retrofit cases, Nexant minimized
the relative overall design and cost estimation inconsistency and uncertainty.
Table 6‐3 summarizes and compares the Poza Rica NGCC performance before and after PCC for each
of the CO2 capture technologies. With regards to auxiliary power consumption, the PCC power
consumption provided by each PCC licensor is combined with Nexant’s CO2
compression/dehydration and plant modifications power consumption. This ensures that the
proprietary, PCC licensor‐provided auxiliary power consumption data remains confidential.
From Table 6‐3, it can be seen that all six PCC technologies claim improvement in efficiency over the
30% MEA design, ranging from 8.4 to 9.3 percentage point loss, compared to 9.9 percentage point
loss in efficiency for the 30% MEA design. It should be noted that there is no peer reviewed data in
the public domain to compare the claims of the various technologies in comparison to the 30%
generic amine case. Pilot plant testing would be required to confirm any efficiency claims.

Task 1 Technology Selection and Evaluation
Final Report: Pre‐Feasibility Study for Establishing a Carbon Capture Pilot Plant in Mexico 89
Table 6‐3 Poza Rica NGCC Pre‐PCC vs Post‐PCC Retrofit Performance Summary
See Note 1 Pre‐PCCGeneric 30%
MEA PCCAlstom BASF Fluor
HTC
PurenergyMHI Shell CanSolv
NGCC CO2 Emissions, MTPD (STPD) 2297 (2532) 345 (380) 328 (362) 344 (379) 229 (252) 346 (381) 346 (381) 342 (377)
Recovered CO2 Product, MTPD (STPD) 0 (0) 1952 (2152) 1969 (2170) 1953 (2153) 2068 (2280) 1951 (2151) 1951 (2151) 1955 (2155)
% CO2 Capture 0 85% 86% 85% 90% 85% 85% 85%
Power Balance, MW
Generation
Gas Turbine Gross Output 166.6 166.6 166.6 166.6 166.6 166.6 166.6 166.6
Steam Turbine Gross Output 82.5 39.6 49.6 49.4 46.0 46.7 49.2 49.4
Back Pressure Turbine 0 21.6 17 17 18 18 17 16.7
Total Gross Output 249.1 227.8 232.8 232.7 231.0 231.3 232.6 232.7
Auxiliary Consumption
Existing NGCC Plant Parasitic Loads 7.2 7.2 7.2 7.2 7.2 7.2 7.2 7.2
Flue Gas Blower 0 8.8 8.8 8.8 8.8 8.8 8.8 8.8
PCC + CO2 Compression + Plant Mods 0 16.1 17.3 14.1 16.6 14.0 15.7 14.2
Total New PCC Parasitic Load 7.2 32.0 33.3 30.1 32.5 29.9 31.7 30.1
Net Power Plant Export, MW 241.9 195.8 199.5 202.6 198.4 201.4 200.9 202.5
Delta Plant Export, MW ‐46.1 ‐42.4 ‐39.3 ‐43.4 ‐40.5 ‐41.0 ‐39.3
% Plant Export Reduction ‐19% ‐18% ‐16% ‐18% ‐17% ‐17% ‐16%
Net Plant Heat Rate, MJ/kWh (Btu/kWh) 6.94 (6584) 8.57 (8134) 8.42 (7984) 8.28 (7860) 8.46 (8025) 8.33 (7907) 8.35 (7926) 8.29 (7862)
Net Plant Efficiency, % LHV 51.8 42.0 42.7 43.4 42.5 43.2 43.1 43.4
Delta Plant Efficiency, percentage pt ‐9.9 ‐9.1 ‐8.4 ‐9.3 ‐8.7 ‐8.8 ‐8.4
Incremental Water Import, lpm (gpm) 0 (0) 1537 (406) 3058 (808) 1718 (454) 1618 (427) 1328 (351) 2561 (676) 1580 (417) Note 1: Values presented here are Nexant’s interpretation of the data provided by the PCC licensors.

Task 1 Technology Selection and Evaluation
Final Report: Pre‐Feasibility Study for Establishing a Carbon Capture Pilot Plant in Mexico 90
6.4 POZA RICA NGCC PCC RETROFIT ECONOMIC EVALUATION RESULTS
Table 6‐4 shows the economic evaluation results, including incremental CAPEX + 7 year breakeven
electricity price and incremental COE for each of the PCC technologies retrofitted into the Poza Rica
NGCC plant. With regard to PCC cost estimates, the PCC plant CAPEX that was provided by each PCC
licensor is combined with Nexant’s CO2 compression/dehydration plant CAPEX. This ensures that the
licensor‐provided PCC plant capital cost data remain confidential.
Based on the economic figures‐of‐merit, the various PCC licensors’ technologies are ranked for
comparative purposes. The lower the incremental CAPEX + 7 year breakeven electricity price/
incremental COE, the higher the ranking. As shown in Table 6‐5, for both methodologies, the PCC
licensors’ rankings are in the same order. Hence, we can use COE as the sole figure‐of‐merit in
ranking the various PCC technologies.
Figure 6‐1 shows a graphical representation of the COEs for the six PCC technology licensors. It
should be noted that with the exception of Alstom all other PCC technologies have very similar
COEs, being within a range of $1.3/MWh, or 4% of one another.

Task 1 Technology Selection and Evaluation
Final Report: Pre‐Feasibility Study for Establishing a Carbon Capture Pilot Plant in Mexico 91
Table 6‐4 Incremental PCC Costs for Various Licensors
Generic 30%
MEA PCC
Design Alstom BASF / Linde Fluor
HTC
Purenergy MHI Shell CanSolv
CAPEX Estimate, $MM US USGC
PCC Plant + CO2 Compression
[Note 2] 181.4 234.7 187.7 181.9 194.5 178.8 194.9
Flue Gas Blower 14.2 14.2 14.2 14.2 14.2 14.2 14.2
Poza Rica Plant Modifications 32.8 32.4 30.4 31.9 29.1 30.9 30.4
TOTAL 228.4 281.4 232.3 228.0 237.8 223.9 239.5
O&M Estimate, $MM US
Variable Costs [Note 3] 7.6 7.6 7.6 7.5 7.3 7.5 7.5
Fixed Costs 11.0 13.3 11.1 10.9 11.4 10.8 11.6
TOTAL 18.5 21.0 18.7 18.5 18.7 18.3 19.1
43.2 47.9 40.7 42.0 41.7 40.4 41.5
N/A 6 2 5 4 1 3
37.6 41.4 35.3 36.5 36.2 35.1 36.0
N/A 6 2 5 4 1 3Ranking based on COE
Estimated Post‐Combustion CO2 Capture Costs
Incremental Costs to Poza Rica
NGCC without CO2 Capture [Note
1]
CAPEX +7 Yr OPEX Breakeven
Electricity Price, $/MWh [Note 4]:
Ranking based on Breakeven Price
Estimated Cost of Electricity (COE),
$/MWh [Note 5]
Note 1 ‐ Values presented here are Nexant’s interpretation of the data provided by the PCC licensors.
Note 2 ‐ All figures except Nexant’s 'Generic 30% MEA Design' are based on vendor‐provided data, which are considered proprietary.
Note 3 ‐ Major component is the amine replacement costs, which are considered proprietary.
Note 4 ‐ Incremental to estimated existing Poza Rica NGCC CAPEX + 7 Year OPEX Breakeven Price of $44.79/MWh
Note 5 ‐ Incremental to estimated existing Poza Rica NGCC COE of $40.69/MWh

Task 1 Technology Selection and Evaluation
Final Report: Pre‐Feasibility Study for Establishing a Carbon Capture Pilot Plant in Mexico 92
Figure 6‐1 Incremental PCC COEs for Various Licensors
35.1 35.3 36.0 36.2
36.5
41.4
25
30
35
40
45
MHI BASF Shell CanSolv HTC Purenergy Fluor Alstom
Increm
ental COE, $/M
Wh
Incremental COE based on Licensors' Data

Task 1 Technology Selection and Evaluation
Final Report: Pre‐Feasibility Study for Establishing a Carbon Capture Pilot Plant in Mexico 93
6.5 ECONOMIC EVALUATION RESULTS AFTER CO2 CAPTURE RATE ADJUSTMENTS
While Nexant’s questionnaire specified for PCC design to capture 85% of the Poza Rica plant’s CO2,
Fluor provided data based on a capture rate of 90%. The design for higher CO2 capture rate requires
a larger reboiling duty, which results in a larger steam extraction rate and consequently lower power
output from the steam turbine. The larger quantity of CO2 captured also increases the CO2
compression horsepower and costs. It is recognized that Fluor’s data would need to be adjusted to
ensure an apples‐to‐apples comparison with the other technologies.
Nexant made the estimated adjustments by: firstly, pro‐rated Fluor’s total CO2 regeneration duty
from 90% to 85%. The PCC auxiliary power consumption, CO2 compression power requirements and
cooling duty were also revised down accordingly. Finally, Fluor’s PCC plant CAPEX was reduced by
5% to account for the smaller absorber size.
Table 6‐5 shows the estimated PCC costs and ranking after adjusting for Fluor’s CO2 capture rate.
Rank values in green indicate that the technology has moved up in ranking while values in red mean
that the technology has slid down from the initial evaluation. Rankings in blue are unchanged from
the initial economic evaluation. Figure 6‐2 is the graphical representation of the COEs, adjusted for
Fluor’s 85% CO2 capture rate.
Based on the adjustments made to account for 85% CO2 capture rate for Fluor, its COE is now
$35.0/MWh, or about a $1.5/MWh decrease from the initial evaluation.

Task 1 Technology Selection and Evaluation
Final Report: Pre‐Feasibility Study for Establishing a Carbon Capture Pilot Plant in Mexico 94
Table 6‐5 Incremental PCC Costs for Various Licensors after CO2 Capture Rate Adjustment for Fluor
Generic 30%
MEA PCC
Design Alstom BASF / Linde Fluor
HTC
Purenergy MHI Shell CanSolv
CAPEX Estimate, $MM US USGC
PCC Plant + CO2 Compression [Note
2] 181.4 234.7 187.7 174.0 194.5 178.8 194.9
Flue Gas Blower 14.2 14.2 14.2 14.2 14.2 14.2 14.2
Poza Rica Plant Modifications 32.8 32.4 30.4 31.4 29.1 30.9 30.4
TOTAL 228.4 281.4 232.3 219.7 237.8 223.9 239.5
O&M Estimate, $MM US
Variable Costs [Note 3] 7.6 7.6 7.6 7.5 7.3 7.5 7.5
Fixed Costs 11.0 13.3 11.1 10.9 11.4 10.8 11.6
TOTAL 18.5 21.0 18.7 18.4 18.7 18.3 19.1
37.6 41.4 35.3 35.0 36.2 35.1 36.0
N/A 6 3 1 5 2 4Ranking based on COE
Estimated Post‐Combustion CO2 Capture Costs
Incremental Costs to Poza Rica NGCC
without CO2 Capture [Note 1]
Estimated Cost of Electricity (COE),
$/MWh [Note 4]
Note 1 ‐ Values presented here are Nexant’s interpretation of the data provided by the PCC licensors.
Note 2 ‐ All except Nexant 'Generic 30% MEA Design' are based on vendor‐provided data, which are considered proprietary.
Note 3 ‐ Major component is the amine replacement costs, which are considered proprietary.
Note 4 ‐ Incremental to estimated existing Poza Rica NGCC COE of $40.69/MWh

Task 1 Technology Selection and Evaluation
Final Report: Pre‐Feasibility Study for Establishing a Carbon Capture Pilot Plant in Mexico 95
Figure 6‐2 Incremental COEs for Various Licensors after CO2 Capture Rate Adjustment for Fluor
36.5
35.1 35.3 36.0 36.2
41.4
35.0
25
30
35
40
45
Fluor MHI BASF Shell CanSolv HTC Purenergy Alstom
Increm
ental COE, $/M
Wh
Incremental COE based on Licensors' DataIncremental COE Adjusted for 85% CO2 Capture for Fluor

Task 1 Technology Selection and Evaluation
Final Report: Pre‐Feasibility Study for Establishing a Carbon Capture Pilot Plant in Mexico 96
6.6 ECONOMIC EVALUATION RESULTS SENSITIVITY TO PCC CAPEX
As mentioned in Section 6.3, the PCC capital costs were provided by each of the PCC licensors as a
single value based on potentially different design philosophies, estimation details and methodology.
While the quoted CAPEXs are fairly consistent against the generic MEA CAPEX, each can easily vary
by ±10%.
To determine the sensitivity of the relative economic ranking to potential CAPEX variations, the
COEs were re‐evaluated for each PCC at 90% and 110% of the quoted PCC CAPEX. The Nexant‐
designed systems (flue gas blower, CO2 capture and compression, and NGCC plant modifications)
CAPEXs were not changed because they were designed and estimated on a consistent basis.
The bar‐chart in Figure 6‐3 shows the COEs for the six PCC technologies at the baseline and ±10%
PCC plant costs, for CO2 capture rates of 85%. The first bar (in blue) represents incremental COE
based on 100% of the licensor quoted CAPEX for the licensed amine plant. The second bar (in tan)
represents incremental COE based on 110% of the licensor quoted CAPEX. Lastly, the third bar (in
green) represents incremental COE based on 90% of the licensor quoted CAPEX.
The data show that at this level of accuracy, it cannot be determined if any one of the top 5 (all
except Alstom) technologies stands out among the rest. For example, Fluor may have the lowest
COE (blue bar) based on its quoted CAPEX (after adjustment to 85% CO2 capture), but just a 10%
increase in its PCC CAPEX would cause its COE (tan bar) to go up to $36.4/MWh, which would be
higher than the highest COE based on quoted CAPEX by HTC (blue bar, $36.2/MWh). Conversely, the
Fluor COE of $35.0/MWh (blue bar) at the licensor‐quoted CAPEX is higher than the highest COE
based on 90% of HTC’s quoted CAPEX (green bar, $34.6/MWh).
Within the licensors’ provided CAPEX accuracy, it would therefore be difficult to establish a relative
ranking of the top five PCC candidates with certainty.
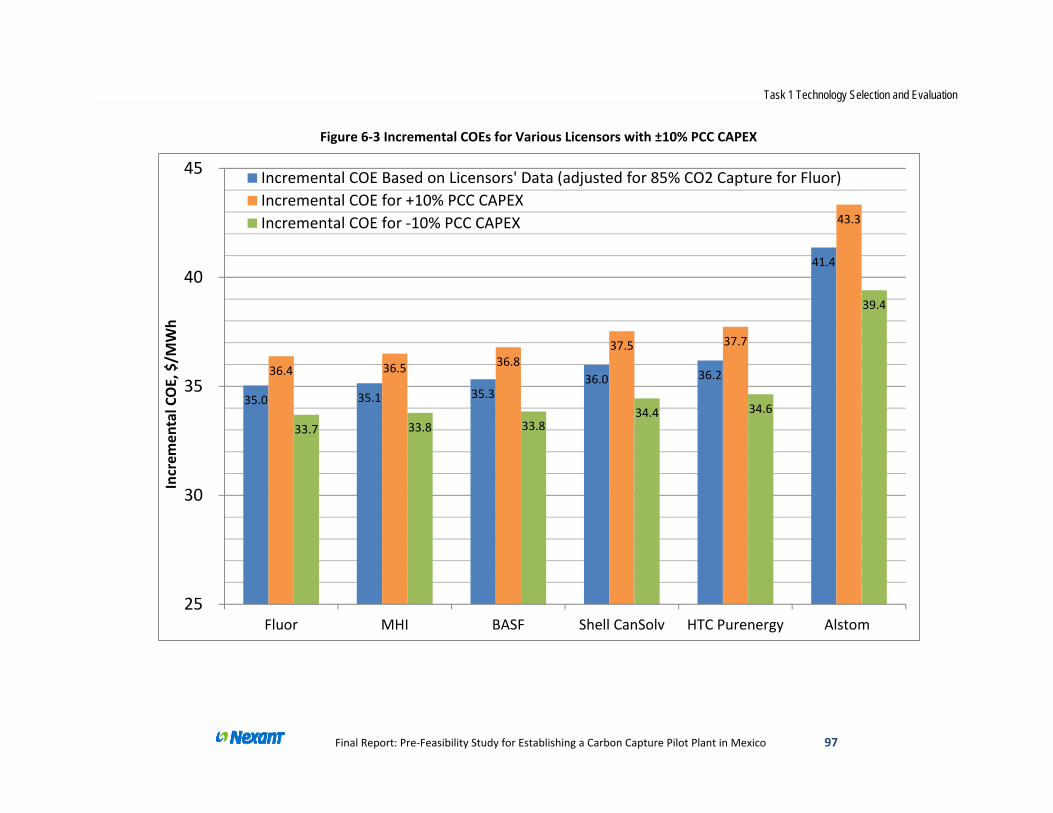
Task 1 Technology Selection and Evaluation
Final Report: Pre‐Feasibility Study for Establishing a Carbon Capture Pilot Plant in Mexico 97
Figure 6‐3 Incremental COEs for Various Licensors with ±10% PCC CAPEX
35.0 35.1 35.3 36.0 36.2
41.4
36.4 36.5 36.8 37.5 37.7
43.3
33.7 33.8 33.8 34.4 34.6
39.4
25
30
35
40
45
Fluor MHI BASF Shell CanSolv HTC Purenergy Alstom
Increm
ental COE, $/M
Wh
Incremental COE Based on Licensors' Data (adjusted for 85% CO2 Capture for Fluor)
Incremental COE for +10% PCC CAPEX
Incremental COE for ‐10% PCC CAPEX

Task 1 Technology Selection and Evaluation
Final Report: Pre‐Feasibility Study for Establishing a Carbon Capture Pilot Plant in Mexico 98
6.7 ECONOMIC EVALUATION RESULTS SENSITIVITY TO REBOILING DUTY
In the questionnaire to the PCC licensors, besides asking for the CO2 regeneration duties for treating
the full‐size Poza Rica NGCC flue gas, the licensors were also requested to provide a typical
regeneration duty per unit of CO2 captured for both NGCC and coal‐fired flue gases, from either
their pilot or demonstration plant units. With the exception of Shell, all the licensors provided
typical duties from processing coal‐fired flue gases. A few of these licensors provided data from
pilot testing on NGCC flue gases.
Based on Nexant’s experience from past studies, the low concentration of CO2 in an NGCC flue gas
(around 4%) can adversely affect the CO2 pickup of the amine solvent, resulting in increased CO2
regeneration duty, in the order of about 15‐20% more than the corresponding duty for CO2 capture
from coal‐fired flue gas, which typically contains about 12% CO2. Part of the higher duty can be
reduced through process design adjustments such as colder feed gas or absorber inter‐stage cooling,
but these adjustments tend to result in trade‐offs in the form of higher capital costs.
From the licensors’ responses, it was noted that some of the quoted CO2 regeneration duties for the
Poza Rica NGCC were unexpectedly low compared to their stated results from coal‐fired flue gas test
runs. On a normalized basis, BASF, Fluor and HTC each showed CO2 regeneration duties for the Poza
Rica NGCC that are only 5‐7% more than what their test data for coal‐fired flue gas showed. Since
the amine plant designs were proprietary, it was not possible to determine the extent of process
adjustments and cost trade‐offs that were included in these licensor quotes.
Nexant thus performed a sensitivity check to determine the impact on relative ranking in case the
regeneration duty is higher than stated. Nexant re‐evaluated the COE by adjusting BASF, Fluor, and
HTC’s NGCC CO2 regeneration duties to 115% of their stated coal‐fired flue gas test data duties.
Figure 6‐4 shows the COEs for the various PCC technologies at their reported reboiling duties and
after the aforementioned adjustments to BASF, Fluor and HTC’s duties. Differences in COE among
the top five candidates are still small and within the accuracy of the study.

Task 1 Technology Selection and Evaluation
Final Report: Pre‐Feasibility Study for Establishing a Carbon Capture Pilot Plant in Mexico 99
Figure 6‐4 Incremental COEs for Various Licensors after CO2 Regeneration Duty Adjustments
35.0 35.1 35.3 36.0 36.2
41.4
35.7 35.9 36.7
25
30
35
40
45
Fluor MHI BASF Shell CanSolv HTC Purenergy Alstom
Increm
ental COE, $/M
Wh
Incremental COE Based on Licensors' Data (adjusted for 85% CO2 Capture for Fluor)
Incremental COE Based on Adjusted CO2 Regeneration Duties

Task 1 Technology Selection and Evaluation
Final Report: Pre‐Feasibility Study for Establishing a Carbon Capture Pilot Plant in Mexico 100
6.8 ECONOMIC EVALUATION RESULTS SENSITIVITY TO NATURAL GAS PRICES
Figure 6‐5 shows the sensitivity of the COEs for the six PCC technologies to natural gas price ranging
from $1/GJ ($1.06/MMBtu) to $10/GJ ($10.55/MMBtu). The baseline gas price used for all PCC
technologies in the evaluations is $2.37/GJ ($2.50/MMBtu).
Consistent with the results presented in Section 6.6, the COEs for the top five technologies are very
close to one another and it cannot be determined if any one of them stands out among the rest, be
it at high ($10/GJ) or low ($1/GJ) gas prices. However, it should be noted that the COE for Fluor’s
PCC technology increases at a greater rate than the other technologies due to its lower net plant
efficiency. At about $5/GJ ($5.28/MMBtu), the MHI and BASF PCC technologies, which have slightly
higher efficiencies than Fluor, now have an equal COE with Fluor. At the highest natural gas price
($10/GJ) evaluated in this sensitivity analysis, BASF’s technology has the lowest COE ($45.6/MWh) of
the six licensors.
6.9 ECONOMIC EVALUATION RESULTS SENSITIVITY TO ANNUAL ON‐STREAM FACTOR (AOF)
Figure 6‐6 shows the sensitivity of the COEs for the six PCC technologies to the power plant’s AOF
ranging from 75% to 100%. The baseline AOF used for all PCC technologies in the evaluations is
91.3%, or 8,000 hours per year.
Consistent with the results presented in Section 6.6 and 6.8, the COEs for the top five technologies
are bunched very closely together and no one technology stands out among the others, regardless
of a high or low AOF.

Task 1 Technology Selection and Evaluation
Final Report: Pre‐Feasibility Study for Establishing a Carbon Capture Pilot Plant in Mexico 101
Figure 6‐5 COE Sensitivity to Natural Gas Prices for Various PCC Licensors
32
37
42
47
52
0.0 2.0 4.0 6.0 8.0 10.0 12.0
COE, $/M
Wh
Natural Gas Price, $/GJ
Alstom BASF Fluor (85% Capture) HTC Purenergy MHI Shell Cansolv
Baseline NG price at $2.37/GJ

Task 1 Technology Selection and Evaluation
Final Report: Pre‐Feasibility Study for Establishing a Carbon Capture Pilot Plant in Mexico 102
Figure 6‐6 COE Sensitivity to Annual On‐Stream Factor for Various PCC Licensors
31
36
41
46
51
75.0 80.0 85.0 90.0 95.0 100.0
COE, $/M
Wh
Annual On‐Stream Factor, %
Alstom BASF Fluor (85% Capture) HTC Purenergy MHI Shell Cansolv
Baseline AOF of 91.3%(8,000 hours per year)

Task 1 Technology Selection and Evaluation
Final Report: Pre‐Feasibility Study for Establishing a Carbon Capture Pilot Plant in Mexico 103
6.10 ESTIMATED PCC PLOT SPACE REQUIREMENTS
Figure 5‐8 in Section 5.8.2 shows the preliminary, aerial view of the Poza Rica NGCC after 30% MEA
PCC retrofit. The figure clearly shows that there is sufficient plot space required for a PCC retrofit. In
the questionnaire to the PCC licensors, Nexant requested the dimensions of the different PCC
sections. Based on the licensors’ responses, together with Nexant’s estimate for the area of the CO2
compression section, the total plot space requirements for each technology’s PCC plant, including
the flue gas blower and CO2 compression/dehydration units but excluding plant modifications, are
tabulated in Table 6‐6.
Table 6‐6 Estimated PCC Plot Space Requirements
PCC Technology
Total Plot Space Requirements, including
Flue Gas Blower & CO2
Compression/Dehydration excluding
Plant Mods, m2 (ft2)
30% MEA 9,000 (96,000)
Alstom 14,000 (150,000)
BASF 11,000 (120,000)
Fluor 6,300 (68,000)
HTC Purenergy 17,000 (180,000)
MHI 6,700 (72,000)
Shell Cansolv 6,900 (74,000)
The estimated total available plot space at the Poza Rica plant, not including space available for
plant modifications, is 24,500 m2 (264,000 ft2). This is much larger than the corresponding plot space
required by any one of the PCC technologies evaluated in this study.
The bulk of the plot space taken up by plant modifications, per the 30% MEA case, is the new
cooling tower and CW pump house, as depicted in Figure 5‐8. The estimated area occupied by these
units is about 1,950 m2 (21,000 ft2). Although several of the PCC licensors’ technologies require
larger CW flows than the 30% MEA‐based PCC, they are expected to require no more than two
additional cooling cells. Figure 5‐8 shows that there should be sufficient space around the new PCC
cooling tower to extend it by the two additional cooling cells required to accommodate the
increased CW demands.
Based on this analysis, the Poza Rica plant is expected to have sufficient area to support any one of
the six PCC technologies evaluated.

Task 1 Technology Selection and Evaluation
Final Report: Pre‐Feasibility Study for Establishing a Carbon Capture Pilot Plant in Mexico 104
7. SUMMARY AND CONCLUSIONS
7.1 SUMMARY AND CONCLUSIONS
A preliminary carbon capture technology assessment and screening exercise was carried out with
the objective to identify the most appropriate, commercially‐available post‐combustion carbon
capture (PCC) technology for NGCC power plants in Mexico. This was to be followed by a more
detailed evaluation of the selected technology, which would serve as the basis for the development
of a conceptual design of a carbon capture pilot plant to be located at Poza Rica power station in
Veracruz. The World Bank’s and GoM’s desire is to design, build and operate the Poza Rica pilot
plant by 2019. Against that near‐term objective and the preliminary assessment performed, Nexant
recommends that the technology of interest should be focused on amine solvent‐based absorption
processes, of which (1) CO2 capture from an NGCC flue gas has already been in commercial practice,
albeit at a small scale, and (2) there are several well‐respected companies that are currently
developing second‐generation amine absorption CO2 capture processes, which promise better
energy efficiency and lower costs when compared with current state‐of‐the‐art 30% MEA
technology.
The current state‐of‐the‐art amine PCC technology for NGCC application is represented by that of
the Bellingham plant, located in Massachusetts, in the USA. The plant was engineered, constructed
and operated by Fluor Corporation. It was operated from 1991 to 2005, capturing CO2 not for
greenhouse gas mitigation purposes, but for industrial usage. During its operation, it captured about
350 STPD of CO2 from a slip stream of flue gas from a 320 MW NGCC power plant.
Six well‐known amine solvent‐based PCC technology licensors participated in the study and provided
data for Nexant to perform a more detailed technology evaluation, based on a full‐scale design
analysis of retrofitting the Poza Roca NGCC plant for CO2 capture. The six advanced amine capture
processes were compared against a generic state‐of‐the‐art amine design that was developed by
Nexant, based on 30 wt% MEA.
7.1.1 Design Analysis of Retrofitting Poza Rica Plant for Generic 30% MEA‐Based PCC
As would be expected, retrofitting Poza Rica for CO2 capture will significantly impact the plant’s
performance and economics. The retrofitted Poza Rica NGCC’s net power export is expected to be
reduced by 46 MW, or 19%, from 242 MW to 196 MW. The corresponding net plant efficiency would
decrease from 51.8% to 42.0%, a loss of almost 10 percentage points, as shown in Table 6‐1.
With respect to the economic impact, a COE increase in the order of $37.6/MWh is to be expected.
This represents a 92.4% increase in COE, meaning that the COE of the retrofitted Poza Rica plant
with PCC is almost double that of the existing operation without capture.
It should also be noted that retrofitting a power plant for post‐combustion CO2 capture is very much
site and configuration specific. This study is for Poza Rica with the configuration of a

Task 1 Technology Selection and Evaluation
Final Report: Pre‐Feasibility Study for Establishing a Carbon Capture Pilot Plant in Mexico 105
Siemens/Westinghouse W501F gas turbine feeding into three small 27 MWe steam turbines.
Specific retrofit requirements may not be the same under different conditions.
7.1.2 Comparison of Six Advanced Amine‐based PCC Technologies
Nexant reviewed and analyzed the data provided by the various technology licensors. To the best of
its abilities and using sound engineering reasoning, Nexant adjusted and filled in missing data in the
evaluation process to ensure reasonable levels of consistency. Thus, the final assessment only
presents Nexant’s interpretation of the various technologies. Nexant makes no claims as to the
accuracy of the data provided (or lack thereof) as the basis for the study, nor the relative ranking as
a true representation of the technology status.
All six advanced amine‐based PCC technologies show a lower heat of regeneration compared to
generic 30% MEA, by about 20 to 25%. Within the group, however, the difference is small, only ±
3%. As a result, all six technologies show an improvement in overall efficiency over the generic 30%
MEA based retrofitted Poza Rica plant – a loss of plant efficiency ranging from 8.4 to 9.3 percentage
point instead, of 9.9, shown in Table 6‐2and Table 6‐3.
Per the agreed‐upon methodology, all six technologies were ranked based on COE as the economic
indicator, of which the licensor‐provided PCC plant CAPEX have a significant contribution. The
CAPEXs provided for the stand‐alone PCC plant from the various licensors, after making necessary
adjustments to bring the cost basis to a common USGC location, are within a reasonable range of
one other. The only exception is the PCC CAPEX from Alstom, which is about 41% higher than that
estimated for Nexant’s generic MEA design. The CAPEXs for the rest of the PCC technologies fall
within 98% to 112% of Nexant’s estimate. The Alstom provided cost was used, as is, in Nexant’s
economic evaluation.
Based on the calculated incremental increase in COE as the economic indicator, all of the advanced
PCC technologies under development show an improvement over the generic Nexant reference
MEA design. The only exception is Alstom because of its high CAPEX. The differences in COE among
the top five licensors, however, are within 4% of one another.
Within the level of data accuracy for the study, it would be reasonable to conclude that the top five
PCC technologies all have similar economic performances and it cannot be determined, with
certainty, that one is clearly superior to the rest. If three ‘top of its class’ candidates must be
chosen from the list, based on the COE results, then these would have to be Fluor, MHI, and BASF,
as shown in Figure 6‐3 in Section 6.5.
Final technology selection for future Poza Rica PCC implementation would, most likely, need to take
into other factors into consideration, such as process guarantee, technology licensing fee,
willingness to work with the GoM stakeholders to take on active role of participation into the
project, etc., as required.

Task 1 Technology Selection and Evaluation
Final Report: Pre‐Feasibility Study for Establishing a Carbon Capture Pilot Plant in Mexico 106
7.2 PCC TECHNOLOGY LICENSORS’ REVIEW AND COMMENT
A copy of the drafted report, after the World Bank’s review and with its comments incorporated,
was provided to all six of the PCC technology licensors for their review and comment. This was done
on March 16, 2016 with a request to reply no later than April 1, 2016. Of the six licensors, only MHI
and Alstom replied. MHI’s comments, mainly on Section 4.5, have been incorporated. Alstom’s
comments are incorporated in Appendix G.

107
Task 3 – Pilot Plant Feasibility Design