CAPS-1 and CAPS-2 Are Essential Synaptic Vesicle Priming ...
13
CAPS-1 and CAPS-2 Are Essential Synaptic Vesicle Priming Proteins Wolf J. Jockusch, 1 Dina Speidel, 1,3 Albrecht Sigler, 2,4 Jakob B. Sørensen, 2 Frederique Varoqueaux, 1 Jeong-Seop Rhee, 1, * and Nils Brose 1, * 1 Max Planck Institute of Experimental Medicine, Department of Molecular Neurobiology, Hermann-Rein-Str. 3, D-37075 Go ¨ ttingen, Germany 2 Max Planck Institute of Biophysical Chemistry, Department of Membrane Biophysics, Am Faßberg 11, D-37077 Go ¨ ttingen, Germany 3 Present address: Lund University, Department of Clinical Sciences Malmo ¨ , UMAS Ing 72, CRC 91-11, S-20502 Malmo ¨ , Sweden. 4 Present address: University of British Columbia, Kinsman Laboratory of Neurological Research, 2255 Wesbrook Mall, Vancouver, V6T 1Z3, Canada. *Correspondence: [email protected] (J.-S.R.), [email protected] (N.B.) DOI 10.1016/j.cell.2007.11.002 SUMMARY Before transmitter-filled synaptic vesicles can fuse with the plasma membrane upon stimula- tion they have to be primed to fusion compe- tence. The regulation of this priming process controls the strength and plasticity of synaptic transmission between neurons, which in turn determines many complex brain functions. We show that CAPS-1 and CAPS-2 are essential components of the synaptic vesicle priming machinery. CAPS-deficient neurons contain no or very few fusion competent synaptic vesicles, which causes a selective impairment of fast pha- sic transmitter release. Increases in the intra- cellular Ca 2+ levels can transiently revert this defect. Our findings demonstrate that CAPS proteins generate and maintain a highly fusion competent synaptic vesicle pool that supports phasic Ca 2+ triggered release of transmitters. INTRODUCTION Synaptic transmission is triggered by SNARE-mediated fusion of synaptic vesicles (SVs). Typically, only primed SVs can fuse with the plasma membrane upon stimula- tion. The underlying priming reaction is essential for syn- aptic transmission (Augustin et al., 1999; Varoqueaux et al., 2002). Its regulation determines synaptic strength and short-term plasticity, which in turn controls many important brain functions ranging from sensory adaptation to sound localization and cortical gain control (Junge et al., 2004; Rhee et al., 2002). SV priming is dependent on members of the Munc13/Unc-13 family of presynaptic active zone proteins (Varoqueaux et al., 2002), which reg- ulate the t-SNARE Syntaxin (Betz et al., 1997; Gracheva et al., 2006; McEwen et al., 2006; Richmond et al., 2001; Stevens et al., 2005). aRIMs, which anchor and regulate Munc13s at synapses, modulate SV priming (Andrews- Zwilling et al., 2006; Betz et al., 2001; Dulubova et al., 2005). Apart from Munc13s and aRIMs, the components of the SV priming machinery are unknown, and its molec- ular mode of action has remained elusive. CAPS-1 and CAPS-2 are candidate vesicle priming proteins as they contain a sequence stretch with homol- ogy to the priming domain of Munc13s (Basu et al., 2005; Koch et al., 2000; Stevens et al., 2005). CAPS-1 is thought to be a specific regulator of large dense-core ves- icle (LDCVs) fusion (Rupnik et al., 2000; Sadakata et al., 2007, 2004; Speese et al., 2007; Tandon et al., 1998), although SV and LDCV secretion processes have many features and most other protein components in common (Morgan and Burgoyne, 1997). CAPS-1 was initially dis- covered as a regulator of Ca 2+ -triggered LDCV fusion (Walent et al., 1992). Subsequent studies on brain synap- tosomes and on synaptic transmission in C. elegans mutants lacking the CAPS homolog Unc-31 indicated that CAPS-1/Unc-31 might specifically regulate LDCV but not SV exocytosis (Gracheva et al., 2007; Speese et al., 2007; Tandon et al., 1998). SV fusion at Drosophila neuromuscular synapses is reduced in mutants lacking the CAPS homolog Unc-31, but this phenotype was inter- preted to be the consequence of a primary defect in LDCV secretion (Renden et al., 2001). Similarly, C. elegans unc- 31 mutants exhibit uncoordinated locomotor activity and reduced neuromuscular synaptic transmission, but this phenotype was also interpreted to result from an indirect effect of altered LDCV function (Gracheva et al., 2007; Speese et al., 2007). CAPS-1 deletion mutant mice exhibit perturbations of catecholamine uptake into LDCVs and of LDCV fusion (Speidel et al., 2005), and deletion of CAPS-2 in mice causes abnormal cerebellar development and short-term synaptic plasticity (Sadakata et al., 2007). Essentially, all currently available data would be com- patible with the current model of an LDCV-specific role of CAPS proteins. However, CAPS-1 and CAPS-2 are enriched in presynaptic compartments of neurons, which contain mostly SVs and only very few LDCVs (Sadakata 796 Cell 131, 796–808, November 16, 2007 ª2007 Elsevier Inc.
Transcript of CAPS-1 and CAPS-2 Are Essential Synaptic Vesicle Priming ...

CAPS-1 and CAPS-2 Are EssentialSynaptic Vesicle Priming ProteinsWolf J. Jockusch,1 Dina Speidel,1,3 Albrecht Sigler,2,4 Jakob B. Sørensen,2 Frederique Varoqueaux,1
Jeong-Seop Rhee,1,* and Nils Brose1,*1Max Planck Institute of Experimental Medicine, Department of Molecular Neurobiology, Hermann-Rein-Str. 3,
D-37075 Gottingen, Germany2Max Planck Institute of Biophysical Chemistry, Department of Membrane Biophysics, Am Faßberg 11,D-37077 Gottingen, Germany3Present address: Lund University, Department of Clinical Sciences Malmo, UMAS Ing 72, CRC 91-11, S-20502 Malmo, Sweden.4Present address: University of British Columbia, Kinsman Laboratory of Neurological Research, 2255 Wesbrook Mall, Vancouver,
V6T 1Z3, Canada.*Correspondence: [email protected] (J.-S.R.), [email protected] (N.B.)
DOI 10.1016/j.cell.2007.11.002
SUMMARY
Before transmitter-filled synaptic vesicles canfuse with the plasma membrane upon stimula-tion they have to be primed to fusion compe-tence. The regulation of this priming processcontrols the strength and plasticity of synaptictransmission between neurons, which in turndetermines many complex brain functions. Weshow that CAPS-1 and CAPS-2 are essentialcomponents of the synaptic vesicle primingmachinery. CAPS-deficient neurons contain noor very few fusion competent synaptic vesicles,which causes a selective impairment of fast pha-sic transmitter release. Increases in the intra-cellular Ca2+ levels can transiently revert thisdefect. Our findings demonstrate that CAPSproteins generate and maintain a highly fusioncompetent synaptic vesicle pool that supportsphasic Ca2+ triggered release of transmitters.
INTRODUCTION
Synaptic transmission is triggered by SNARE-mediated
fusion of synaptic vesicles (SVs). Typically, only primed
SVs can fuse with the plasma membrane upon stimula-
tion. The underlying priming reaction is essential for syn-
aptic transmission (Augustin et al., 1999; Varoqueaux
et al., 2002). Its regulation determines synaptic strength
and short-term plasticity, which in turn controls many
important brain functions ranging from sensory adaptation
to sound localization and cortical gain control (Junge et al.,
2004; Rhee et al., 2002). SV priming is dependent on
members of the Munc13/Unc-13 family of presynaptic
active zone proteins (Varoqueaux et al., 2002), which reg-
ulate the t-SNARE Syntaxin (Betz et al., 1997; Gracheva
et al., 2006; McEwen et al., 2006; Richmond et al., 2001;
Stevens et al., 2005). aRIMs, which anchor and regulate
796 Cell 131, 796–808, November 16, 2007 ª2007 Elsevier Inc
Munc13s at synapses, modulate SV priming (Andrews-
Zwilling et al., 2006; Betz et al., 2001; Dulubova et al.,
2005). Apart from Munc13s and aRIMs, the components
of the SV priming machinery are unknown, and its molec-
ular mode of action has remained elusive.
CAPS-1 and CAPS-2 are candidate vesicle priming
proteins as they contain a sequence stretch with homol-
ogy to the priming domain of Munc13s (Basu et al.,
2005; Koch et al., 2000; Stevens et al., 2005). CAPS-1 is
thought to be a specific regulator of large dense-core ves-
icle (LDCVs) fusion (Rupnik et al., 2000; Sadakata et al.,
2007, 2004; Speese et al., 2007; Tandon et al., 1998),
although SV and LDCV secretion processes have many
features and most other protein components in common
(Morgan and Burgoyne, 1997). CAPS-1 was initially dis-
covered as a regulator of Ca2+-triggered LDCV fusion
(Walent et al., 1992). Subsequent studies on brain synap-
tosomes and on synaptic transmission in C. elegans
mutants lacking the CAPS homolog Unc-31 indicated
that CAPS-1/Unc-31 might specifically regulate LDCV
but not SV exocytosis (Gracheva et al., 2007; Speese
et al., 2007; Tandon et al., 1998). SV fusion at Drosophila
neuromuscular synapses is reduced in mutants lacking
the CAPS homolog Unc-31, but this phenotype was inter-
preted to be the consequence of a primary defect in LDCV
secretion (Renden et al., 2001). Similarly, C. elegans unc-
31 mutants exhibit uncoordinated locomotor activity and
reduced neuromuscular synaptic transmission, but this
phenotype was also interpreted to result from an indirect
effect of altered LDCV function (Gracheva et al., 2007;
Speese et al., 2007). CAPS-1 deletion mutant mice exhibit
perturbations of catecholamine uptake into LDCVs and of
LDCV fusion (Speidel et al., 2005), and deletion of CAPS-2
in mice causes abnormal cerebellar development and
short-term synaptic plasticity (Sadakata et al., 2007).
Essentially, all currently available data would be com-
patible with the current model of an LDCV-specific role
of CAPS proteins. However, CAPS-1 and CAPS-2 are
enriched in presynaptic compartments of neurons, which
contain mostly SVs and only very few LDCVs (Sadakata
.

Figure 1. Reduced Glutamate Release and RRP Size in
CAPS-1 KO and CAPS DKO Neurons
(A) EPSCs traces (left panel) and release induced by the application of
0.5 M sucrose solution for 6 s (right panel).
(B) Mean EPSC amplitudes measured in WT and CAPS-1 KO cells and
in CAPS-2 KO and CAPS DKO cells (gray box), respectively.
(C) Mean RRP sizes as estimated by the charge integral measured after
release induced by application of 0.5 M sucrose solution.
(D) Calculated mean Pvr (calculated by dividing the charge transfer dur-
ing a single EPSC by the charge transfer measured during RRP release).
(E) Distribution of Pvr values shown in (D) (calculated by dividing the
charge transfer during a single EPSC by the charge transfer measured
during RRP release).
(F) mEPSC activity recorded at a holding potential of �70 mV.
(G) mEPSC amplitude distribution of WT and CAPS-1 KO neurons. The
inset shows the averaged absolute (top) and normalized (bottom)
mEPSC traces (n = 59–90).
C
et al., 2006; Speese et al., 2007; Speidel et al., 2003). The
latter observation raises the question as to whether CAPS
proteins may also have a function in SV exocytosis.
RESULTS
Defective SV Priming and Transmitter Releasein the Absence of CAPSWe examined CAPS function in SV exocytosis by studying
glutamatergic synaptic transmission in individual hippo-
campal neurons in autaptic culture (Bekkers and Stevens,
1991) taken from wild-type (WT), CAPS-1 KO (Stevens
et al., 2005), CAPS-2 KO (Figure S1 in the Supplemental
Data available with this article online), and CAPS-1/
CAPS-2 double KO mice (CAPS DKO). We detected no
morphological or functional differences between WT, het-
erozygous CAPS-2 KO, and homozygous CAPS-2 KO
neurons in our analyses (data not shown), and therefore
used CAPS-2 KO cells as controls in experiments with
CAPS DKO neurons. Evoked excitatory postsynaptic cur-
rent (EPSCs) amplitudes in CAPS-1 KO neurons were re-
duced to about 51% of WT values (Figures 1A and 1B,
and Table 1), and 12% of all measured CAPS-1 KO cells
showed no detectable EPSCs at all. This EPSC reduction
was due to a parallel reduction in the size of the pool of
fusion-competent and primed - or readily releasable -
SVs (RRP), whose release can be triggered by the applica-
tion of a hypertonic buffer containing 0.5 M sucrose (Rose-
nmund and Stevens, 1996; Stevens and Tsujimoto, 1995).
CAPS-1 KO neurons showed a drastic reduction in RRP
size to 42% of WT levels (Figure 1C and Table 1). The
CAPS-1 KO cells that showed no detectable evoked
EPSCs also failed to release transmitter in response to
hypertonic buffer. The vesicular release probability Pvr,
which we calculated by dividing the charge transfer during
a single EPSC by the charge transfer measured during
RRP release, was not different between WT and CAPS-1
KO neurons (Figure 1D and Table 1). In a total of 39%
(165/423) of CAPS DKO neurons we were unable to elicit
EPSCs or transmitter release in response to stimulation
with hypertonic buffer. EPSC amplitudes and RRP sizes
in the remaining active neurons were reduced to 32%
and 15% of control levels, respectively (Figures 1A–
1C and Table 1), while the Pvr was not changed
(Figure 1D and Table 1). A detailed analysis of Pvr data
from all cells of all genotypes showed that irrespective of
the genotype most cells exhibited Pvr values of 6%–8%
(Figure 1E), which indicates that the SV pools released in
(H) mEPSC amplitude distribution of CAPS-2 KO and CAPS DKO neu-
rons. The inset shows the averaged absolute (top) and normalized
(bottom) mEPSC traces (n = 56–66).
(I) Mean mEPSC amplitudes.
(J) Mean mEPSC frequencies.
Numbers in or above bars indicate the number of cells. Numbers in/over
gray bars in (B) indicate cells with measurable EPSCs per total numer of
cells measured. Stars above two bars indicate a statistically significant
difference. Error bars indicate standard error of the mean (SEM).
ell 131, 796–808, November 16, 2007 ª2007 Elsevier Inc. 797

Table 1. Synaptic Transmission in CAPS-1 KO and CAPS DKO Neurons
WT CAPS-1 KO CAPS-2 KO CAPS DKO
EPSC amplitude 3.3 ± 0.2 nA, n = 273 1.7 ± 0.1 nA, n = 187/213 2.7 ± 0.1 nA, n = 410 0.9 ± 0.1 nA, n = 258/423
RRP size 0.45 ± 0.04 nC, n = 125 0.19 ± 0.02 nC, n = 72 0.39 ± 0.04 nC, n = 140 0.06 ± 0.02 nC, n = 51
Vesicular release
probability (Pvr)
8.61% ± 0.04%, n = 125 7.1% ± 0.6%, n = 72 9.9% ± 0.4%, n = 140 8.3% ± 0.7%, n = 51
mEPSC amplitude 22.1 ± 0.6 pA, n = 90 17.5 ± 0.8 pA, n = 59 20.3 ± 0.8 pA, n = 66 15 ± 1 pA, n = 56
mEPSC frequency 2.7 ± 0.3 Hz, n = 90 1.2 ± 0.3 Hz, n = 59 2.3 ± 0.3 Hz, n = 66 0.54 ± 0.09 Hz, n = 56
mEPSC rise time 0.86 ± 0.02 ms, n = 90 0.99 ± 0.04 ms, n = 90 0.87 ± 0.05 ms, n = 66 0.98 ± 0.3 ms, n = 56
mEPSC decay time 3.83 ± 0.07 ms, n = 90 3.9 ± 0.1 ms, n = 90 3.98 ± 0.08 ms, n = 66 4.1 ± 0.1 ms, n = 56
EPSC amplitude,recalculated with
reduced
quantal amplitude
2.1 ± 0.2 nA, n = 187/213 1.1 ± 0.1 nA, n = 258/423
RRP size,
recalculated with
reduced
quantal amplitude
0.24 ± 0.03 nC, n = 72 0.08 ± 0.02 nC, n = 51
EPSC amplitude in
absence of PDBU
2.2 ± 0.3 nA, n = 20 0.8 ± 0.23 nA, n = 19 2.5 ± 0.43 nA, n = 21 0.4 ± 0.13 nA, n = 23
EPSC amplitudein the presence
of 1 mM PDBU
3.6 ± 0.13 nA, n = 20 2.1 ± 0.4 nA, n = 19 4.0 ± 0.53 nA, n = 21 2.3 ± 0.33 nA, n = 23
EPSC potentiationratio induced by 1 mM
PDBU
1.8 ± 0.1, n = 20 3.4 ± 0.3, n = 19 1.8 ± 0.1, n = 21 10 ± 2, n = 23
Current amplitude3 mM GABA
2.7 ± 0.1 nA, n = 120 2.3 ± 0.2 nA, n = 74 2.4 ± 0.2 nA, n = 61 2.1 ± 0.2 nA, n = 51
Current amplitude
10 mM KA
0.27 ± 0.01 nA, n = 113 0.22 ± 0.02 nA, n = 64 0.22 ± 0.02 nA, n = 60 0.33 ± 0.07 nA, n = 46
Current amplitude
300 mM KA
8 ± 1 nA, n = 10 8 ± 1 nA, n = 11
Current amplitude
100 mM Glu
2.0 ± 0.3 nA, n = 16 1.7 ± 0.2 nA, n = 14 2.4 ± 0.3 nA, n = 18 2.1 ± 0.3 nA, n = 19
Total numberof synapses
871 ± 137, n = 23 717 ± 158, n = 16 720 ± 75, n = 33 759 ± 164, n = 26
Fraction of active
synapses
55% ± 5%, n = 23 61% ± 5%, n = 16 45% ± 3%, n = 33 49% ± 3%, n = 26
Normalized Munc13-1
expression level
(E18-E19 brain)
1.75 ± 0.09, n = 3 1.8 ± 0.1, n = 3 1.5 ± 0.1, n = 3 1.6 ± 0.3, n = 3
Normalized bMunc13-2
expression level
0.89 ± 0.05, n = 3 0.86 ± 0.05, n = 3 0.6 ± 0.2, n = 3 0.31 ± 0.05, n = 3
Percentage of Munc13-1 positive
Synaptobrevin-2
puncta
89% ± 2%, n = 6 87% ± 3%, n = 6
Fluorescence intensity
Munc 13-1 in
Synaptobrevin-2
positive puncta
75 ± 8, n = 6 68 ± 8, n = 6
798 Cell 131, 796–808, November 16, 2007 ª2007 Elsevier Inc.

the presence and absence of CAPS proteins have similar
release characteristics.
To test whether the secretory deficits in CAPS-1 KO and
CAPS DKO neurons are caused by aberrant SV filling and
Figure 2. Synapse Morphology and Synapse Density in CAPS
DKO Neurons(A) Ultrastructural analysis of CAPS-2 and CAPS DKO neurons. The
top panel shows example images of synapses from cells of the indi-
cated genotype. Arrows indicate the postsynaptic density with the
synaptic cleft, arrowheads indicate LDCVs, and a star indicates the
SV cluster. Scale bar, 250 nm. The bottom panel shows from left to
right the analysis of the basic synapse properties, the density of
LDCVs, and the subsynaptic distribution of SVs. The distribution of
SVs was measured using the orthogonal distance from the center
of SVs to the plasma membrane opposite of the PSD (i.e., values for
the 0–20 nm bin represent morphologically docked SVs). Numbers in
or above the bars indicate the numbers of synapses. PM, plasma
membrane; PSD, postsynaptic density; SA, synapse area.
(B) Examples of the fluorescence staining of autaptic neurons (red, fix-
able FM1-43; green, VGluT1; blue, MAP-2). Scale bar, 10 mm.
(C) Average total number of synapses in neurons determined by the
VGluT1-positive puncta. Numbers in the bars indicate the numbers
of cells.
(D) Averagepercentage ofactivesynapses in neurons determinedby the
ratio of VGluT1/FM1-43 double-positive puncta versus all VGluT1-
positive puncta. Numbers in the bars indicate the numbers of cells.
Error bars indicate standard error of the mean (SEM).
C
concomitantly reduced quantal size, we analyzed minia-
ture EPSCs (mEPSC). mEPSC amplitude and frequency
in CAPS-1 KO neurons were reduced to 79% and 45%
of control levels, respectively, while corresponding values
for CAPS DKO cells were 77% and 23% of control levels,
respectively (Figures 1F–1J and Table 1). Cumulative
probability analyses of mEPSC amplitudes in CAPS-1
KO cells versus WT cells and in CAPS-DKO cells versus
control cells revealed a uniform shift toward smaller
mEPSC amplitudes in CAPS-1 KO and CAPS DKO neu-
rons, while the kinetic characteristics of mEPSCs (i.e.,
rise and decay time constants) remained unaffected (Fig-
ures 1G and 1H, and Table 1). The uniform shift in EPSC
amplitudes, which is already evident for small amplitudes
(<15 pA), and the fact that mEPSC kinetics remain
unchanged in the absence of CAPS proteins indicate
that there is no selective defect in the release of a certain
(e.g., larger) class of SVs in CAPS-1 KO and CAPS DKO
cells. Responses of neurons to exogenously applied
kainate, glutamate, or GABA were very similar across all
genotypes (Table 1). As cell surface glutamate receptors,
and in particular AMPA-type receptors that mediate fast
synaptic transmission, are strongly enriched in postsyn-
aptic membranes (Palmer et al., 2005), this finding sup-
ports the notion that the reduced mEPSC amplitude
seen in CAPS-1 KO and CAPS DKO neurons (Figures
1G–1I) is mainly due to slightly reduced SV transmitter
content (Speidel et al., 2005) and not caused by severe
postsynaptic defects. An additional argument in support
of the notion that postsynaptic receptor sensitivity is un-
changed in CAPS DKO cells is provided by the fact that
absolute evoked EPSC amplitudes in CAPS DKO neurons
reach control levels after high-frequency stimulation
(Figure 3C). The fact that the reduction in mEPSC ampli-
tudes is similar in CAPS-1 KO and CAPS DKO cells
(Figure 1I) while the mEPSC frequency is much more se-
verely reduced in CAPS DKO cells (Figure 1J) indicates
that a presynaptic priming defect and not a deficiency in
SV filling is the main cause for the defective synaptic trans-
mission in CAPS-1 KO and CAPS DKO cells. Indeed, even
when we corrected our evoked EPSC amplitude and RRP
size data for the reduced mEPSC amplitudes measured
in CAPS-1 KO and CAPS DKO cells, the corresponding
values were still highly significantly reduced as compared
to the respective control condition (Table 1).
Normal Synaptic Ultrastructure and SynapseNumbers in the Absence of CAPSTo examine whether the priming defect in CAPS deficient
neurons is associated with altered synapse morphology,
we analyzed the ultrastructure of CAPS-2 KO and CAPS
DKO synapses. We did not detect any changes in the
width of the synaptic cleft or in the length of the postsyn-
aptic density in CAPS DKO neurons. The number of SVs
was slightly but not significantly decreased in CAPS
DKO synapses (Figure 2A), including the population of
morphologically docked SVs (Figure 2A bottom right; bin
covering 0–20 nm distance of SV center to plasma
ell 131, 796–808, November 16, 2007 ª2007 Elsevier Inc. 799

membrane). The density of LDCVs, which is very low in
synapses of cultured hippocampal neurons, was similar
in all genotypes tested (Figure 2A). These data indicate
that the secretion deficit in CAPS DKO neurons is not
caused by a major alteration of synapse morphology.
Figure 3. Short-Term Plasticity and Ca2+-Dependence of
Synaptic Transmission in CAPS-1 KO and CAPS DKO
Neurons
(A) Change of synaptic strength during and following high-frequency
stimulation. During a period of 0.2 Hz stimulation either a 2.5 Hz train
(top) or a 10 Hz train (bottom) was applied (50 stimuli). The interval
between the low- and high-frequency stimulation periods was 2 s.
Data are normalized to the average EPSC amplitude of the first six
data points obtained at 0.2 Hz stimulation (n = 28–70).
(B) Augmentation ratio after high-frequency stimulation from 2.5 Hz to
100 Hz (n = 21–196).
(C) Changes in absolute EPSC amplitudes induced by 40 Hz stimula-
tion. The interval between the low- and high-frequency stimulation
periods was 2 s. (n = 41–61). A sample trace from a CAPS DKO cell
is shown above the summary data.
(D) Mean absolute augmented EPSC amplitudes after high-frequency
stimulation from 2.5 Hz to 100 Hz (n = 21–196).
(E) EPSC traces triggered during the application of various external
Ca2+ concentrations [see (F)] and the respective control (4 mM Ca2+/
4 mM Mg2+).
(F) Apparent Ca2+ sensitivity of triggered release in CAPS-2 KO (black)
and CAPS-DKO (gray) cells. Absolute (triangles) and relative (circles)
EPSC amplitudes compared to the control condition are plotted as
a function of the external Ca2+ concentration (1 to 12 mM Ca2+, each
with 1 mM Mg2+; n = 12–15).
Error bars indicate standard error of the mean (SEM).
800 Cell 131, 796–808, November 16, 2007 ª2007 Elsevier Inc.
In addition, we determined the total number of synap-
ses and the number of activatable synapses in autaptic
neurons from the different CAPS genotypes by combining
stainings with an antibody to the presynaptic marker
VGluT1 and fixable FM1-43. During FM1-43 loading, syn-
apses were stimulated with 86 mM K+ (10 s), which causes
long lasting an large increases in [Ca2+]i. We found that
neither the total number of synapses nor the number of
synapses activatable by a 10 s treatment in the presence
of 86 mM K+ were altered in CAPS-1 KO or CAPS DKO
neurons (Figures 2B–2D). Thus, the reduced EPSC ampli-
tudes measured in CAPS-1 KO and CAPS DKO neurons
(Figures 1A and 1B) are likely caused by functional
changes in presynaptic processes that are not detectable
after massive stimulation in the prolonged presence of
86 mM K+ (see also additional data below) and that do
not directly affect the initial Pvr (Figures 1D and 1E).
Increases in [Ca2+]i Can Transiently Bypassthe Priming Defect Caused by CAPS DeletionWe next studied additional presynaptic transmitter re-
lease characteristics and short-term plasticity in CAPS
DKO neurons, using CAPS-2 KO cells as controls. As in
WT neurons, EPSC amplitudes in CAPS-2 KO neurons
depressed progressively during 2.5 Hz (50 stimuli) and
10 Hz (50 stimuli) stimulation trains to reach 80% and
60% of the pre-train amplitudes (Figure 3A and Table 2).
In contrast, EPSC amplitudes in CAPS DKO cells in-
creased 5-fold over baseline values during 2.5 Hz and
10 Hz stimulation (Figure 3A and Table 2). The paired pulse
depression ratios at these stimulation frequencies were
identical between CAPS DKO and CAPS-2 KO neurons
(Table 2), indicating that the frequency facilitation ob-
served in CAPS DKO neurons is not due to changes in
the initial release probability. Upon return from 10 Hz stim-
ulation to low stimulation frequency, EPSC amplitudes
were augmented up to 6-fold over baseline (Figures 3A
and 3B, and Table 2). This post-train augmentation was
more pronounced after 100 stimuli given at 40 Hz (10-
fold) or 100 Hz (15-fold) (Figure 3B) such that augmented
absolute EPSC amplitudes reached control values (Fig-
ures 3C and 3D, and Table 2). These data show that
high-frequency stimulation triggers a process that turns
poorly secreting CAPS DKO neurons transiently into neu-
rons that can release transmitter at WT levels. This facilita-
tion and augmentation effect is profound as early as 0.5–1
s and reaches WT levels 3 s after onset of high-frequency
stimulation. As intervals of 0.5–3 s are too short for the
complete glutamate loading of SVs, which takes several
minutes in vitro (Maycox et al., 1988) and is estimated to
take some 20 s in vivo (Takamori et al., 2006), these
data argue strongly against the possibility that the defi-
cit in transmitter release seen in CAPS DKO neurons
(Figure 1) is mainly due to an SV loading defect. Rather,
SVs seem to be loaded but require an additional boost
provided by the high-frequency stimulation in order to
become release-competent.
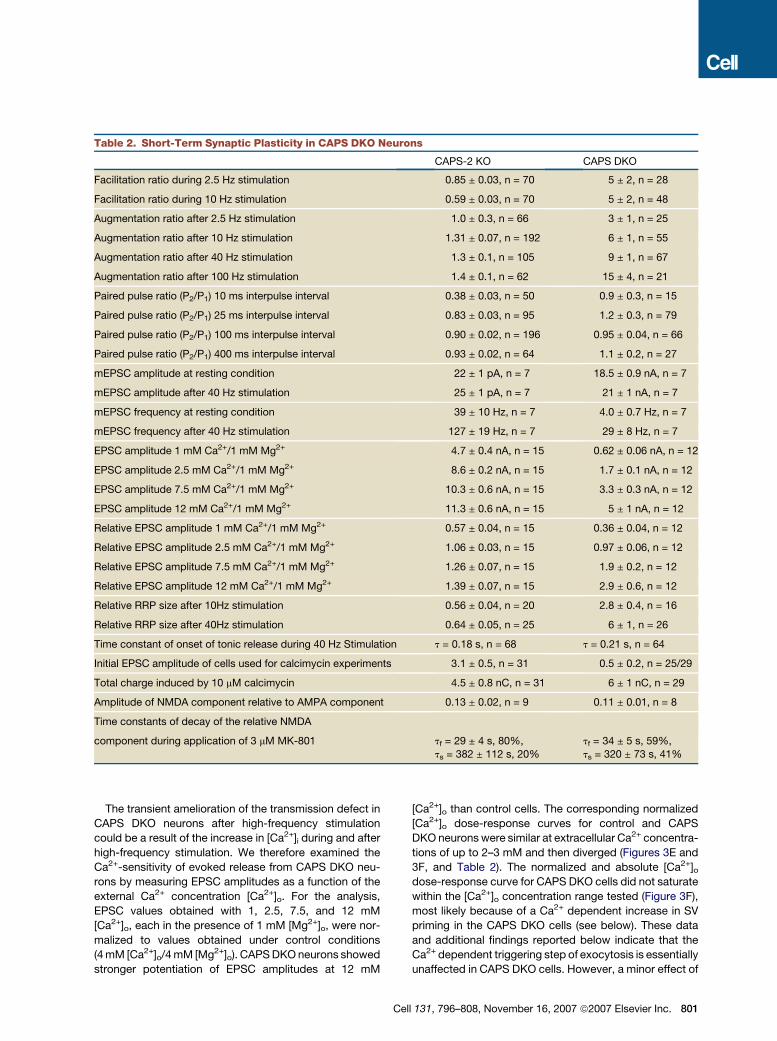
Table 2. Short-Term Synaptic Plasticity in CAPS DKO Neurons
CAPS-2 KO CAPS DKO
Facilitation ratio during 2.5 Hz stimulation 0.85 ± 0.03, n = 70 5 ± 2, n = 28
Facilitation ratio during 10 Hz stimulation 0.59 ± 0.03, n = 70 5 ± 2, n = 48
Augmentation ratio after 2.5 Hz stimulation 1.0 ± 0.3, n = 66 3 ± 1, n = 25
Augmentation ratio after 10 Hz stimulation 1.31 ± 0.07, n = 192 6 ± 1, n = 55
Augmentation ratio after 40 Hz stimulation 1.3 ± 0.1, n = 105 9 ± 1, n = 67
Augmentation ratio after 100 Hz stimulation 1.4 ± 0.1, n = 62 15 ± 4, n = 21
Paired pulse ratio (P2/P1) 10 ms interpulse interval 0.38 ± 0.03, n = 50 0.9 ± 0.3, n = 15
Paired pulse ratio (P2/P1) 25 ms interpulse interval 0.83 ± 0.03, n = 95 1.2 ± 0.3, n = 79
Paired pulse ratio (P2/P1) 100 ms interpulse interval 0.90 ± 0.02, n = 196 0.95 ± 0.04, n = 66
Paired pulse ratio (P2/P1) 400 ms interpulse interval 0.93 ± 0.02, n = 64 1.1 ± 0.2, n = 27
mEPSC amplitude at resting condition 22 ± 1 pA, n = 7 18.5 ± 0.9 nA, n = 7
mEPSC amplitude after 40 Hz stimulation 25 ± 1 pA, n = 7 21 ± 1 nA, n = 7
mEPSC frequency at resting condition 39 ± 10 Hz, n = 7 4.0 ± 0.7 Hz, n = 7
mEPSC frequency after 40 Hz stimulation 127 ± 19 Hz, n = 7 29 ± 8 Hz, n = 7
EPSC amplitude 1 mM Ca2+/1 mM Mg2+ 4.7 ± 0.4 nA, n = 15 0.62 ± 0.06 nA, n = 12
EPSC amplitude 2.5 mM Ca2+/1 mM Mg2+ 8.6 ± 0.2 nA, n = 15 1.7 ± 0.1 nA, n = 12
EPSC amplitude 7.5 mM Ca2+/1 mM Mg2+ 10.3 ± 0.6 nA, n = 15 3.3 ± 0.3 nA, n = 12
EPSC amplitude 12 mM Ca2+/1 mM Mg2+ 11.3 ± 0.6 nA, n = 15 5 ± 1 nA, n = 12
Relative EPSC amplitude 1 mM Ca2+/1 mM Mg2+ 0.57 ± 0.04, n = 15 0.36 ± 0.04, n = 12
Relative EPSC amplitude 2.5 mM Ca2+/1 mM Mg2+ 1.06 ± 0.03, n = 15 0.97 ± 0.06, n = 12
Relative EPSC amplitude 7.5 mM Ca2+/1 mM Mg2+ 1.26 ± 0.07, n = 15 1.9 ± 0.2, n = 12
Relative EPSC amplitude 12 mM Ca2+/1 mM Mg2+ 1.39 ± 0.07, n = 15 2.9 ± 0.6, n = 12
Relative RRP size after 10Hz stimulation 0.56 ± 0.04, n = 20 2.8 ± 0.4, n = 16
Relative RRP size after 40Hz stimulation 0.64 ± 0.05, n = 25 6 ± 1, n = 26
Time constant of onset of tonic release during 40 Hz Stimulation t = 0.18 s, n = 68 t = 0.21 s, n = 64
Initial EPSC amplitude of cells used for calcimycin experiments 3.1 ± 0.5, n = 31 0.5 ± 0.2, n = 25/29
Total charge induced by 10 mM calcimycin 4.5 ± 0.8 nC, n = 31 6 ± 1 nC, n = 29
Amplitude of NMDA component relative to AMPA component 0.13 ± 0.02, n = 9 0.11 ± 0.01, n = 8
Time constants of decay of the relative NMDA
component during application of 3 mM MK-801 tf = 29 ± 4 s, 80%,
ts = 382 ± 112 s, 20%
tf = 34 ± 5 s, 59%,
ts = 320 ± 73 s, 41%
The transient amelioration of the transmission defect in
CAPS DKO neurons after high-frequency stimulation
could be a result of the increase in [Ca2+]i during and after
high-frequency stimulation. We therefore examined the
Ca2+-sensitivity of evoked release from CAPS DKO neu-
rons by measuring EPSC amplitudes as a function of the
external Ca2+ concentration [Ca2+]o. For the analysis,
EPSC values obtained with 1, 2.5, 7.5, and 12 mM
[Ca2+]o, each in the presence of 1 mM [Mg2+]o, were nor-
malized to values obtained under control conditions
(4 mM [Ca2+]o/4 mM [Mg2+]o). CAPS DKO neurons showed
stronger potentiation of EPSC amplitudes at 12 mM
C
[Ca2+]o than control cells. The corresponding normalized
[Ca2+]o dose-response curves for control and CAPS
DKO neurons were similar at extracellular Ca2+ concentra-
tions of up to 2–3 mM and then diverged (Figures 3E and
3F, and Table 2). The normalized and absolute [Ca2+]odose-response curve for CAPS DKO cells did not saturate
within the [Ca2+]o concentration range tested (Figure 3F),
most likely because of a Ca2+ dependent increase in SV
priming in the CAPS DKO cells (see below). These data
and additional findings reported below indicate that the
Ca2+ dependent triggering step of exocytosis is essentially
unaffected in CAPS DKO cells. However, a minor effect of
ell 131, 796–808, November 16, 2007 ª2007 Elsevier Inc. 801

Figure 4. Ca2+-Dependent Transient Recovery of RRP and
EPSC Amplitudes in CAPS DKO Neurons
(A) Release induced by application of 0.5 M sucrose solution for 6 s be-
fore and after 40 Hz stimulation, recorded from a CAPS-2 KO (black)
and a CAPS DKO neuron (gray).
(B) Average ratios of the RRP sizes (after versus before 40 Hz train).
(C) Average time course of the charge transfer induced by double 40
Hz stimulations separated by a 2 s break. Insets show example traces
recorded during the double 40 Hz stimulation (first train, black or gray;
second train red or crimson).
(D) mEPSC amplitude before and 2–12 s after 40 Hz stimulation (n = 7).
(E) mEPSC frequency before and 2–12 s after 40 Hz stimulation (n = 7).
(F) Total charge transfer induced by the application of calcimycin for
100 s. The inset shows representative raw traces (CAPS-2 KO, black
trace;CAPSDKO,gray trace). Vertical lines at3s intervals representstim-
ulation artifacts resulting from intermittent monitoring of evoked EPSCs.
(G) Time course of the charge transfer induced by the application
of calcimycin, normalized to the last data point. The inset shows a
magnification of the first three seconds.
802 Cell 131, 796–808, November 16, 2007 ª2007 Elsevier Inc
the CAPS deficiency on the triggering step cannot be for-
mally excluded on the basis of the present data. We also
determined RRP sizes at 7.5 mM [Ca2+]o/1 mM [Mg2+]oand at 12 mM [Ca2+]o/1 mM [Mg2+]o, and calculated the
corresponding Pvr values, which were similar (�11%) in
CAPS DKO and control cells. This finding further supports
our conclusion that the Ca2+ dependent triggering step of
exocytosis is operating normally in CAPS DKO neurons.
To examine whether the augmentation induced by high-
frequency stimulation in CAPS DKO neurons is caused by
an increase in the RRP, we compared RRP measurements
before and 2 s after 10 Hz or 40 Hz stimulation trains (50
and 100 stimuli, respectively). In control cells, 10 Hz and
40 Hz stimulation reduced the RRP size to 56% and
64% of the pre-train value, respectively, consistent with
the notion that synaptic depression during high-frequency
stimulation is caused mainly by RRP depletion (Otsu and
Murphy, 2004; Zucker and Regehr, 2002). In CAPS DKO
neurons, the RRP size after 10 Hz and 40 Hz stimulation
increased 2.8-fold and 5.6-fold, respectively (Figures 4A
and 4B, and Table 2). Thus, an increase in the RRP size
is the main reason for the pronounced facilitation and aug-
mentation that is induced by high-frequency stimulation
trains in CAPS DKO neurons.
To test how this newly formed RRP induced by high-fre-
quency stimulation in CAPS DKO neurons contributes to
transmitter release, we studied responses to two 40 Hz
action potential trains (100 stimuli) spaced at a 2 s interval.
In control neurons, phasic EPSCs in response to the sec-
ond 40 Hz train depressed much more rapidly than
responses to the first train, which resulted in an overall
reduction of combined phasic and tonic release during
the second train (Figure 4C, left). However, in CAPS
DKO neurons the first train mainly evoked tonic release,
as seen by the downward shift of the baseline (Figure 4C,
right), while the second train evoked strong but rapidly de-
pressing phasic EPSCs on the background of unaltered
tonic release (Figure 4C, right). As a consequence, the to-
tal release in CAPS DKO neurons during the second train
was slightly higher than during the first train (Figure 4C,
right). Interestingly, the phasic EPSCs induced in CAPS
DKO neurons after the first high-frequency train always
decayed within 6–7 stimuli, irrespective of the stimulation
frequency used (data not shown). Also, the amount of
tonic release during the first and second train was similar
in CAPS DKO neurons (Figure 4C, right), which supports
the notion that there is no major SV filling deficit in the
CAPS DKO neurons that would be ameliorated by the
(H) Total charge transfer induced by calcimycin, recorded from indi-
vidual cells plotted against initial evoked EPSCs from the same cells.
The slope of the fit for the data from CAPS-2 KO neurons is 1.56 (black
line). Data from CAPS DKO neurons did not show any correlation be-
tween calcimycin induced charge transfer and initial EPSC amplitude.
(I) Mean amplitudes of evoked EPSCs (stimulated at 0.3 Hz) recorded
during the application of calcimycin, normalized to the first data point.
Numbers in or above bars indicate the numbers of cells. Stars above
two bars indicate a statistically significant difference. Error bars indi-
cate standard error of the mean (SEM).
.

high-frequency stimulation. In an additional set of experi-
ments, we found that along with the RRP size and evoked
EPSCs, the mEPSC frequency increased 7.3-fold in CAPS
DKO neurons immediately following high-frequency stim-
ulation, approaching the levels observed in control cells
before high-frequency stimulation (Figure 4E and Table
2). Under the same conditions, we found mEPSC ampli-
tudes to also be slightly increased in both control and
CAPS DKO cells (Figure 4D and Table 2). This apparent in-
crease in mEPSC amplitudes in CAPS DKO and control
neurons is most likely due to detection problems and
simultaneous sampling of multiple mEPSCs at the high
mEPSC frequencies measured here, and therefore not
physiologically relevant.
Given that the facilitation, augmentation, and RRP in-
crease in CAPS DKO cells upon high-frequency stimula-
tion (Figures 3 and 4) are likely caused by transient
increases of [Ca2+]i, we next investigated synaptic activity
in CAPS DKO neurons while clamping [Ca2+]i at high levels.
We monitored spontaneous and evoked release in the
presence of the Ca2+ ionophore calcimycin (10 mM). This
caused a massive increase of spontaneous glutamate re-
lease that was quantitatively similar in control and CAPS
DKO neurons, including cells that did not exhibit any
evoked EPSCs (Figures 4F and 4G). The latter observation
indicates that responding and non-responding CAPS
DKO neurons represent only quantitatively different vari-
ants of the same mutant phenotype. Total calcimycin-
induced release was proportional to the initial EPSC am-
plitude in CAPS-2 KO neurons but not in CAPS DKO cells
(Figure 4H). Thus, the [Ca2+]i-increase induced by calci-
mycin enforces the release of the same number of SVs
in both genotypes, irrespective of the initial release capac-
ity. Despite this similarity in the extent of calcimycin-
induced release between control and CAPS DKO neurons
(Figure 4F), the time courses of the release were different.
Control cells started to release immediately after applica-
tion of calcimycin while the onset of release after calcimy-
cin application was delayed and slower in CAPS DKO neu-
rons (Figures 4F and 4G). Also, phasic EPSCs measured
at 0.3 Hz throughout calcimycin treatment were different
in the two genotypes tested. EPSCs in control neurons
depressed rapidly, while EPSCs in CAPS DKO cells facil-
itated transiently and then depressed gradually (Figure 4I).
Fura-2 measurements showed that the time courses and
amplitudes of [Ca2+]i changes induced by high-frequency
stimulation and calcimycin application are very similar in
neurites of control and CAPS DKO cells (Figure S2), indi-
cating that Ca2+ handling is normal in the absence of
CAPS. Pvr values at high Ca2+-concentrations were similar
in control and CAPS DKO cells (see above). Thus, the de-
layed spontaneous (Figures 4F and 4G) and transiently in-
creased evoked release (Figure 4I) in CAPS DKO neurons
upon calcimycin addition is likely due to the fact that SVs
in mutant cells require elevated [Ca2+]i for 0.5–2 s in order
to be primed and recruited for Ca2+-induced release.
We next examined whether the new [Ca2+]i-induced fu-
sion competent SVs in CAPS DKO neurons originate from
C
previously silent synapses or from increased priming in
already active synapses, or both. To address this ques-
tion, we monitored the NMDA components of EPSCs eli-
cited at 0.3 Hz in the presence of the irreversible NMDA
receptor open-channel blocker MK-801, before and after
a 40 Hz stimulation train, during which no MK-801 was
present (Figures 5A and 5B) (Rosenmund et al., 1993).
At the onset of the experiment, NMDA/AMPA ratios of
EPSCs were similar in CAPS DKO and control cells
(Figure 5B, inset). EPSCs were stimulated in the presence
of 10 mM glycine, 2.7 mM Ca2+ (no Mg2+), and the progres-
sive block of NMDA-mediated EPSCs by MK-801 was an-
alyzed. In CAPS-2 KO control neurons, the MK-801 block
exhibited decay kinetics with a rapid and a slow compo-
nent during 100 stimuli at 0.3 Hz (Table 2). Following an
intermittent 40 Hz stimulation (100 stimuli) in the absence
of MK-801, no new NMDA component was detectable
upon return to 0.3 Hz stimulation. This indicates that all ac-
tive synapses had been blocked during the first MK-801
treatment (Figures 5A and 5B). In responding CAPS DKO
neurons, NMDA-mediated EPSCs decayed with a delay
(Figures 5A and 5B, and Table 2). This delay was due
to the fact that the NMDA component was increased dur-
ing the first five stimuli (Figure 5B), most likely because
even the 0.3 Hz stimulation causes a [Ca2+]i-increase
that suffices to partially bypass the CAPS requirement,
prime SVs, and boost synaptic release. Strikingly, a new
NMDA-mediated EPSC component appeared after the in-
termittent 40 Hz stimulation but decayed very rapidly. The
first EPSC measured 2 s after the 40 Hz stimulation train
had a dramatically increased NMDA component com-
pared to the response before the stimulation train, ap-
proaching the values seen before MK-801 treatment (Fig-
ures 5A and 5B). Even non-responding cells that did not
release at all during the first phase of 0.3 Hz stimulation
in the presence of MK-801 showed a new NMDA-medi-
ated EPSC component after the intermittent 40 Hz stimu-
lation (�0.09 relative to the AMPA amplitude, data not
shown). Similar data were obtained when 300 instead of
100 stimuli at 40 Hz were applied, and no new NMDA com-
ponent was detectable when the 40 Hz train was given in
the presence of MK-801 (data not shown). Together, these
results indicate that in CAPS DKO neurons the facilitation
and augmentation upon high-frequency stimulation are to
a large extent due to the Ca2+-dependent ‘awakening’ of
previously inactive or very weakly active synapses. That
most synapses in CAPS DKO neurons can be activated
if the stimulation and concomitant increase in [Ca2+]i is
sufficiently robust is nicely illustrated by the FM1-43 load-
ing data (Figures 2B and 2D).
Munc13s and CAPS are Essential Componentsof the Same Priming PathwayMunc13-1 KOs (Augustin et al., 1999; Rosenmund et al.,
2002) are the only other known mouse mutants with a
priming deficit that is similar in type and extent to the
one seen in CAPS-1 KOs and CAPS DKOs. Like CAPS-1
KO and CAPS DKO neurons, Munc13-1 deficient
ell 131, 796–808, November 16, 2007 ª2007 Elsevier Inc. 803

Figure 5. Awakening of Silent Synapses in CAPS DKO
Neurons, and Munc13-1 Expression and Localization in
CAPS Deficient Neurons
804 Cell 131, 796–808, November 16, 2007 ª2007 Elsevier Inc.
glutamatergic hippocampal neurons, in which only
Munc13-2 is still present, show strong Ca2+ dependent
augmentation after high-frequency stimulation (Rose-
nmund et al., 2002). This augmentation in Munc13-1 KO
neurons is due to parallel increases in RRP size and Pvr
(Rosenmund et al., 2002), while in the CAPS DKO cells,
the augmentation after high-frequency stimulation is
mainly due to a change in RRP size.
In view of the similarity between Munc13-1 KO and
CAPS-1 KO or CAPS DKO cells, it is possible that
Munc13 proteins and CAPS proteins operate in the
same priming process and that the residual, strongly
Ca2+ dependent transmitter release activity in CAPS-1
KO and CAPS DKO cells is due to Munc13 dependent
SV priming. To test these possibilities, we performed
two types of experiments. In a first set of experiments,
we examined whether the priming deficit of CAPS defi-
cient and Munc13-1/2 DKO cells can be rescued by over-
expression of Munc13-1 or CAPS-1, respectively. We
found that overexpression of Munc13-1 in CAPS-1 KO
cells and of CAPS-1 in Munc13-1/2 DKO cells failed to
cross-rescue the mutant phenotypes (Figures 5D and
5E) while overexpression of CAPS-1 rescued the CAPS
(A, B) Synaptic NMDA EPSCs were blocked by eliciting a series of 100
EPSCs at 0.3 Hz in the presence of MK-801 (5 mM). Cells were then
stimulated at 40 Hz for 2.5 s in the absence of MK-801 followed by
30 EPSCs at 0.3 Hz again in the presence of MK-801.
(A) EPSCs at the beginning of the first application of MK-801 (1), at the
end of the first application of MK-801 (2), and at the beginning of the
second application of MK-801 (3) (example neurons). The left panels
show the absolute EPSCs, the right panels show the same example
traces normalized to the AMPA component.
(B) Averaged normalized NMDA-mediated amplitudes plotted against
the stimulus number during the first application of MK-801 and during
the second application of MK-801 (n = 8–9). The inset shows the mean
NMDA component relative to the AMPA component.
(C–E) Mean EPSC amplitudes measured in cells with the indicated
genotype and after Semliki Forest Virus mediated overexpression of
the indicated proteins. OE, overexpression.
(F) EPSC amplitudes in the absence and presence of 1 mM PDBU
(n = 19–23).
(G) EPSC potentiation induced by 1 mM PDBU.
(H) Expression of synaptic proteins in cultured hippocampal neurons of
mice with the indicated genotype. Cell homogenates (20 mg of protein
per lane from DIV 14 neurons) were analyzed by Western blotting using
antibodies against the indicated proteins. For the detection of the
bMunc13-2 signal, 30 mg of protein from DIV 21 neurons were loaded
onto each lane.
(I) Combined immunofluorescence detection of Synaptobrevin-2
(green) and Munc13-1 (red) in cultured hippocampal neurons, demon-
strating that Munc13-1 is localized at presynaptic terminals in CAPS
DKO neurons and CAPS-2 KO neurons. Insets show a magnification
of the marked section (white box) in each neuron. Scale bars, 20 mm
and 10 mm (inset).
(J) Mean percentage of Synaptobrevin-2 positive puncta colocalizing
with Munc13-1 positive (100 synapses per cell).
(K) Fluorescence intensity of Munc13-1 in Synaptobrevin-2 positive
puncta from (J).
Numbers in or above bars indicate the numbers of cells. Stars above
two bars indicate a statistically significant difference. Error bars indi-
cate standard error of the mean (SEM).
DKO phenotype (Figure 5C). These data indicate that
CAPS proteins and Munc13 proteins are unlikely to oper-
ate in independent parallel priming pathways. Rather, the
failure of our cross-rescue attempts is consistent with the
possibility that the two priming factors operate in series in
the same pathway or jointly as equally essential compo-
nents of the same priming apparatus. In a second set of
experiments, we tested whether the remaining, strongly
Ca2+ dependent transmitter release activity in CAPS-1
KO and CAPS DKO cells is due to Munc13 dependent
SV priming. For this purpose, we took advantage of the
fact that in our assay system and under our assay condi-
tions, phorbol ester dependent stimulation of transmitter
release is absolutely dependent on Munc13 proteins
(Rhee et al., 2002). We found that treatment with 1 mM of
the phorbol ester PDBU caused robust increases of
evoked EPSC amplitudes in all cells of all genotypes
tested (Figure 5F and Table 1), including cells that failed
to show evoked EPSCs before PDBU treatment (data
not shown). Most notably, the PDBU-induced potentiation
of evoked EPSCs was strongest in CAPS DKO cells (10-
fold) in which absolute PDBU-potentiated EPSCs reached
values measured in control cells before PDBU treatment
(Figures 5F and 5G, and Table 1). These findings pro-
vide strong support of the notion that the remaining SV
priming and release activity in CAPS DKO neurons is
mediated by Munc13 proteins, most likely Munc13-1
and Munc13-2.
In order to determine whether the SV priming deficit in
CAPS-1 KO and CAPS DKO neurons could be due to
a loss of Munc13 proteins from synapses, we performed
a quantitative analysis of Munc13 expression, focusing on
Munc13-1 and bMunc13-2, which are the two main
Munc13 isoforms expressed in mature neurons in culture
and in situ. Western blot analyses of hippocampal cultures
and E18-E19 brain homogenates showed that total
Munc13-1 expression levels are similar in control and
CAPS deficient neurons and brains (Figure 5H and Table 1).
In addition, quantitative immunostaining studies on
cultured neurons using antibodies to Munc13-1 and Syn-
aptobrevin-2 showed that the levels of Munc13-1 in syn-
apses is unaltered in CAPS DKO neurons in culture, as
determined by the proportion of Synaptobrevin-2-positive
puncta containing Munc13-1 and by the fluorescence
intensity of Munc13-1 immunofluorescence signals at
Synaptobrevin-2-positive synapses (Figures 5I–5K and
Table 1). Interestingly, we found the bMunc13-2 expres-
sion levels in cultured neurons and E18-19 brain homoge-
nates from CAPS DKO brain to be reduced by 48% as
compared to the control condition (Figure 5H and Table
1). While this expression decrease may be indicative of
a functional interaction between bMunc13-2 and CAPS
proteins, it is extremely unlikely to contribute to the
CAPS DKO phenotype because heterozygous and even
homozygous Munc13-2 KO neurons are functionally indis-
tinguishable from WT cells (Varoqueaux et al., 2002).
Taken together, our quantitative analysis of Munc13
expression in control and mutant neurons indicates that
C
the SV priming deficit in CAPS-deficient neurons is not
caused by altered Munc13 levels at synapses.
DISCUSSION
Our study shows that CAPS proteins are essential for the
generation of readily releasable SVs. The severity of the
priming deficit in CAPS DKO neurons is similar to that
seen in mouse mutants with the most severe and specific
priming defects known so far, i.e., Munc13-1 KOs (Augus-
tin et al., 1999; Rosenmund et al., 2002) and Munc13-1/2
DKOs (Varoqueaux et al., 2002). This establishes CAPS
proteins as novel essential components of the SV priming
machinery that supports phasic Ca2+ triggered transmitter
release.
Our rescue experiments show that the priming deficit in
CAPS DKO neurons can be reverted by re-expression of
CAPS-1 but not by overexpression of Munc13-1, and
that SV priming in Munc13-1/2 DKO neurons remains
blocked after overexpression of CAPS-1 (Figures 5C–
5E). This indicates that the priming defect in CAPS DKO
neurons reflects a cell autonomous phenotype, which is
supported by the observation that the aberrant locomotor
activity of C. elegans unc-31 mutants can be rescued by
specific re-expression of Unc-31 in motorneurons (Charlie
et al., 2006). In addition, our analysis of Munc13 expres-
sion (Figure 5H and Table 1) and localization in CAPS
DKO neurons (Figures 5I–5K) shows that the deficiency
of the priming activity in CAPS DKO cells is not due to
a loss of Munc13s from presynaptic terminals. This notion
is supported by the fact that treatments causing increases
of [Ca2+]i can transiently activate SV priming and phasic
Ca2+ triggered transmitter release from previously inactive
or very weakly active synapses, possibly by stimulating
Munc13s localized at the active zone (Figures 3 and 4).
Indeed, treatment of CAPS-1 KO and CAPS DKO neurons
with PDBU, which selectively activates a Munc13-depen-
dent priming process in our preparation (Rhee et al.,
2002), caused robust increases of evoked EPSC ampli-
tudes (Figure 5F and Table 1), including cells that failed
to show evoked EPSCs before PDBU treatment. This indi-
cates that the remaining SV priming and release activity in
CAPS deficient neurons is mediated by Munc13 proteins,
most likely Munc13-1 and Munc13-2. Based on these
findings, we propose a model of concerted Munc13/
CAPS action. Either, the two proteins act in series, with
Munc13s generating a primed pool of SVs that can sup-
port tonic release (Figure 4C) but that need to be stabilized
in a rapidly releasable state by CAPS proteins in order to
support evoked phasic release. Alternatively, CAPS and
Munc13s act in concert as equally essential components
of the SV priming apparatus. The molecular basis of this
concerted Munc13/CAPS action remains unknown, but
it is likely that the Munc13-homology domain 1 in CAPS
proteins (Koch et al., 2000) is partially responsible for their
priming function. This domain is part of the minimal
priming domain in Munc13s and involved in Syntaxin
binding (Basu et al., 2005; Stevens et al., 2005). Thus,
ell 131, 796–808, November 16, 2007 ª2007 Elsevier Inc. 805

Munc13s and CAPS proteins may jointly determine SV
priming by regulating Syntaxin function and SNARE
complex formation.
Our data demonstrate for the first time a direct role of
CAPS in SV fusion. For a number of reasons our observa-
tions in CAPS deficient neurons cannot be interpreted as
an indirect effect of altered LDCV function (Speese et al.,
2007; Tandon et al., 1998). First, the effects of LDCV-
derived neuropeptides and neuromodulators on synaptic
transmission in glutamatergic hippocampal neurons are
of a subtle modulatory nature. A perturbation of such
modulatory effects cannot explain the severe priming def-
icit seen in CAPS DKO cells (Figures 1A–1D). Indeed, mice
lacking the peptide hormone convertases/peptidases
PC1/3, PC2, or CPE are all viable and fertile, and do not
exhibit any of the striking neurological characteristics
seen in CAPS1 KOs and CAPS DKOs (i.e., total paralysis
and perinatal lethality) (Beinfeld et al., 2005; Cawley
et al., 2004; Furuta et al., 1997; Pan et al., 2006; Zhu
et al., 2002). Based on the macroscopic phenotypes of
mice lacking PC1/3, PC2, or CPE alone, it is extremely un-
likely that the SV priming deficit seen in CAPS-deficient
neurons is indirectly caused by aberrant LDCV-dependent
peptide hormone release. Second, the astrocytes we
used for autaptic cultures were from WT mice, excluding
the possibility that interference with an LDCV-based para-
crine regulatory effect by astrocytes causes the CAPS
DKO phenotype. In addition, autocrine and neuronal para-
crine effects are minimal in autaptic neuron cultures. Third,
CAPS DKO neurons develop normally and generate mor-
phologically normal synapses at normal numbers (Fig-
ure 2), and the priming deficiency in CAPS DKO neurons
is reverted 12-14 h after re-expression of CAPS-1
(Figure 5C). It is therefore unlikely that a perturbation of
an LDCV-based autocrine effect causes grossly abnormal
cell differentiation resulting in the CAPS DKO phenotype.
Fourth, the phenotype of CAPS DKO neurons is different
from that seen in KO mice lacking proteins that are essen-
tial for LDCV biogenesis such as Chromogranin (Mahapa-
tra et al., 2005). Finally, the phenotypes of neurons with
severe perturbations in both SV and LDCV secretion
such as SNAP-25 KO (Washbourne et al., 2002) or Syna-
tobrevin 2 KO neurons (Schoch et al., 2001) are very differ-
ent from the phenotype caused by CAPS deficiency. The
observation that cultured neurons from C. elegans unc-
31 mutants exhibit normal FM4-64 dye loading is consis-
tent with the possibility that Unc-31 is not involved in syn-
aptic vesicle exocytosis (Speese et al., 2007). However,
this conclusion is not justified because our own FM1-43
loading experiments (Figures 2B–2D) show that the mas-
sive stimulation used in such dye loading experiments,
i.e., application of 80–90 mM K+ for extended periods of
time, overrides the CAPS dependence of synaptic vesicle
priming, as do the application of calcimycin and other
measures to profoundly increase [Ca2+]i (Figures 3 and 4).
Interestingly, the severe RRP size defect seen in CAPS
DKO neurons during low frequency stimulation is tran-
siently reverted if these neurons are stimulated at high-
806 Cell 131, 796–808, November 16, 2007 ª2007 Elsevier Inc
frequency or if [Ca2+]i is increased by other means (Figures
3 and 4). Neurons that were previously deficient in phasic
action potential-triggered transmitter release and only
showed tonic release (Figure 4C) start to show such pha-
sic release after transient increases in [Ca2+]i and a con-
comitant increase in SV priming and RRP sizes (Figures
3 and 4). It is unlikely that these [Ca2+]i-mediated effects
are due to aberrant Ca2+-handling in CAPS DKO neurons,
because our Fura-2 imaging data indicate that [Ca2+]i-
transients in neurites induced by calcimycin treatment
or high-frequency stimulation are similar in control and
CAPS DKO neurons (Figure S2), yet release characteris-
tics are strikingly different. It is likely that this [Ca2+]i-
dependent priming process is executed by essential prim-
ing protein of the Munc13 family, all of which are known to
bind and be stimulated by Ca2+/CaM (Dimova et al., 2006;
Junge et al., 2004) and diacylglycerol or phorbol esters
(Rhee et al., 2002). As mentioned above, this notion is sup-
ported by the fact that the priming deficit of CAPS-1 KO
and CAPS DKO neurons can be reverted by phorbol ester
application (Figures 5F and 5G).
Based on several lines of evidence, it is very unlikely that
the remaining release in CAPS-1 KO and CAPS DKO neu-
rons under resting conditions (Figure 1) and the aug-
mented release in CAPS deficient neurons after rises in
intracellular Ca2+ concentrations (Figures 3 and 4) origi-
nate from a distinct CAPS-specific pool of releasable
SVs or synapses. For example, many CAPS-1 KO cells
and almost half of the CAPS DKO cells we measured do
not release transmitter at all if stimulated at low stimulation
frequencies (Figure 1B). This finding indicates that in many
neurons ultimately all releasable SVs at all synapses are
affected by the CAPS deficiency. In addition, CAPS-defi-
cient neurons and the respective control cells exhibit sim-
ilar release probabilities at control (Figures 1D and 1E) and
increased Ca2+ concentrations (�11% at 7.5 mM [Ca2+]o/
1 mM [Mg2+]o or 12 mM [Ca2+]o/1 mM [Mg2+]o), and
mEPSC kinetics are similar in control and CAPS-1 KO or
CAPS DKO neurons (Table 1). This indicates that SVs of
similar type are released with similar characteristics at
control and CAPS-deficient synapses. We therefore con-
clude that CAPS proteins are generally essential priming
proteins in glutamatergic hippocampal neurons.
EXPERIMENTAL PROCEDURES
Mutant Mouse Strains
CAPS-1 KO mice were published previously (Speidel et al., 2005).
CAPS-2 KO mice were generated by homologous recombination in
embryonic stem cells (Figure S1). Details are provided in Supplemental
Data.
Cell Culture and Electrophyisology
Microisland cultures of hippocampal neurons were prepared as de-
scribed (Pyott and Rosenmund, 2002). Cells were whole-cell voltage
clamped at �70 mV with an EPSC10 (HEKA) under control of the
Patchmaster 2 program (HEKA). All analyses were performed using
Axograph 4.1 (Axon Instruments) and MiniAnalysis (Synaptosoft).
The RRP size was determined by a 6 s application of the external saline
solution made hypertonic by the addition of 0.5 M sucrose. Recordings
.

of mEPSCs were performed in the presence of 300 nM tetrodotoxin
(TTX). EPSCs were evoked by depolarizing the cell from �70 to 0 mV
for 2 ms. The effect of high-frequency stimulation on the amplitude
of EPSCs was measured by applying depolarisations at frequencies
of 2.5, 10, 40, and 100 Hz for either 50 or 100 stimuli. Error bars indicate
standard error. Statistical significance was tested using Student’s
t test.
Morphometry and Immunostaining
Hippocampal neurons were grown for 14–28 days and then stained at
30�C for 10 s with 20 mM fixable FM1-43 (Molecular Probes) in modi-
fied, depolarizing medium containing 86 mM K+ and 83.5 mM Na+,
immediately followed by a 30 s incubation with the same dye concen-
tration in standard medium. Cells were washed with medium, fixed for
5 min with 2.5% formaldehyde in medium and then incubated for 15
min with 5% formaldehyde in PBS. Reactive sites were blocked with
25 mM glycine in PBS for at least 30 min. Then cell membranes were
permeabilized under mild conditions to avoid the formation of disper-
sive aggregates from membrane contents and the membrane staining
dye. For this purpose, the cells were kept for 20 min in 1 mM sodium
cholate (Sigma) in an otherwise salt free 300 mM sucrose solution.
Before and after the permeabilization, cells were washed with
300 mM sucrose to remove salt and detergent residues. To identify
all synapses independently of their exocytotic activity, cultures were
stained with a primary monoclonal antibody directed against VGluT1
(Synaptic Systems) and a guinea pig antibody against MAP-2 (Chem-
icon), followed by Alexa-546- and Alexa-633-labeled secondary anti-
bodies (Molecular Probes). Samples were used without mounting to
record fluorescence images with an inverse staged Zeiss LSM 410
confocal microscope equipped with a 40x oil immersion objective
and Zeiss LSM 3.98 software. Excitatory synapses were identified
on the basis of the VGluT1 and FM1-43 stains, and were separately
analyzed as total number of synapses (all VGluT1 positive puncta)
and active synapses (VGluT1/FM1-43 colocalized puncta). Synapses
were counted as described (Varoqueaux et al., 2002). For routine
quantitative immunostaining, neurons were prepared from E18-E19
hippocampi, and cultured and processed as described (Varoqueaux
et al., 2002). Error bars indicate standard error. Statistical significance
was tested using Student’s t test.
Electron Microscopy
For electron microscopy, hippocampal cultures were processed and
analyzed as described (Varoqueaux et al., 2002). Details are provided
in Supplemental Data. Error bars indicate standard error. Statistical
significance was tested using Student’s t test.
Experiments with Semliki Forest Virus
Generation of Semliki Forest Virus constructs, generation of virus
stocks, and neuron infection were performed as published (Ashery
et al., 1999).
Western Blotting
Antibodies and methods used for Western blotting are described in
Supplemental Data. Protein levels in Western blots of Munc13-1 and
bMunc13-2 were determined densitometrically by using ImageJ (Na-
tional Institutes of Health). Expression levels were normalized using
b-Tubulin as loading control. Error bars indicate standard error. Statis-
tical significance was tested using Student’s t test.
Supplemental Data
Supplemental Data include Supplemental Experimental Procedures,
Supplemental References, and two figures and can be found with
this article online at http://www.cell.com/cgi/content/full/131/4/796/
DC1/.
C
ACKNOWLEDGMENTS
We thank A. Galinski, I. Thanhauser, D. Schwerdtfeger, and the staff of
the MPIEM Animal Facility for technical assistance. We are grateful to
E. Neher for comments and discussions. This work was supported by
the Max Planck Society and the German Research Foundation (Grant
SFB406/A1 to N.B.).
Received: June 21, 2007
Revised: September 22, 2007
Accepted: November 1, 2007
Published: November 15, 2007
REFERENCES
Andrews-Zwilling, Y.S., Kawabe, H., Reim, K., Varoqueaux, F., and
Brose, N. (2006). Binding to Rab3A-interacting molecule RIM regulates
the presynaptic recruitment of Munc13–1 and ubMunc13–2. J. Biol.
Chem. 281, 19720–19731.
Ashery, U., Betz, A., Xu, T., Brose, N., and Rettig, J. (1999). An efficient
method for infection of adrenal chromaffin cells using the Semliki
Forest virus gene expression system. Eur. J. Cell Biol. 78, 525–532.
Augustin, I., Rosenmund, C., Sudhof, T.C., and Brose, N. (1999).
Munc13–1 is essential for fusion competence of glutamatergic synap-
tic vesicles. Nature 400, 457–461.
Basu, J., Shen, N., Dulubova, I., Lu, J., Guan, R., Guryev, O., Grishin,
N.V., Rosenmund, C., and Rizo, J. (2005). A minimal domain responsi-
ble for Munc13 activity. Nat. Struct. Mol. Biol. 12, 1017–1018.
Beinfeld, M.C., Blum, A., Vishnuvardhan, D., Fanous, S., and March-
and, J.E. (2005). Cholecystokinin levels in prohormone convertase 2
knock-out mouse brain regions reveal a complex phenotype of
region-specific alterations. J. Biol. Chem. 280, 38410–38415.
Bekkers, J.M., and Stevens, C.F. (1991). Excitatory and inhibitory
autaptic currents in isolated hippocampal neurons maintained in cell
culture. Proc. Natl. Acad. Sci. USA 88, 7834–7838.
Betz, A., Okamoto, M., Benseler, F., and Brose, N. (1997). Direct inter-
action of the rat unc-13 homologue Munc13–1 with the N terminus of
syntaxin. J. Biol. Chem. 272, 2520–2526.
Betz, A., Thakur, P., Junge, H.J., Ashery, U., Rhee, J.S., Scheuss, V.,
Rosenmund, C., Rettig, J., and Brose, N. (2001). Functional interaction
of the active zone proteins Munc13–1 and RIM1 in synaptic vesicle
priming. Neuron 30, 183–196.
Cawley, N.X., Zhou, J., Hill, J.M., Abebe, D., Romboz, S., Yanik, T.,
Rodriguiz, R.M., Wetsel, W.C., and Loh, Y.P. (2004). The carboxypep-
tidase E knockout mouse exhibits endocrinological and behavioral
deficits. Endocrinology 145, 5807–5819.
Charlie, N.K., Schade, M.A., Thomure, A.M., and Miller, K.G. (2006).
Presynaptic UNC-31 (CAPS) is required to activate the G alpha(s) path-
way of the Caenorhabditis elegans synaptic signaling network. Genet-
ics 172, 943–961.
Dimova, K., Kawabe, H., Betz, A., Brose, N., and Jahn, O. (2006). Char-
acterization of the Munc13-calmodulin interaction by photoaffinity
labeling. Biochim. Biophys. Acta 1763, 1256–1265.
Dulubova, I., Lou, X., Lu, J., Huryeva, I., Alam, A., Schneggenburger,
R., Sudhof, T.C., and Rizo, J. (2005). A Munc13/RIM/Rab3 tripartite
complex: from priming to plasticity? EMBO J. 24, 2839–2850.
Furuta, M., Yano, H., Zhou, A., Rouille, Y., Holst, J.J., Carroll, R., Rav-
azzola, M., Orci, L., Furuta, H., and Steiner, D.F. (1997). Defective pro-
hormone processing and altered pancreatic islet morphology in mice
lacking active SPC2. Proc. Natl. Acad. Sci. USA 94, 6646–6651.
Gracheva, E.O., Burdina, A.O., Holgado, A.M., Berthelot-Grosjean, M.,
Ackley, B.D., Hadwiger, G., Nonet, M.L., Weimer, R.M., and Rich-
mond, J.E. (2006). Tomosyn inhibits synaptic vesicle priming in Caeno-
rhabditis elegans. PLoS Biol. 4, e261. 10.1371/journal.pbio.0040261.
ell 131, 796–808, November 16, 2007 ª2007 Elsevier Inc. 807

Gracheva, E.O., Burdina, A.O., Touroutine, D., Berthelot-Grosjean, M.,
Parekh, H., and Richmond, J.E. (2007). Tomosyn negatively regulates
CAPS-dependent peptide release at Caenorhabditis elegans synap-
ses. J. Neurosci. 27, 10176–10184.
Junge, H.J., Rhee, J.S., Jahn, O., Varoqueaux, F., Spiess, J., Waxham,
M.N., Rosenmund, C., and Brose, N. (2004). Calmodulin and Munc13
form a Ca2+ sensor/effector complex that controls short-term synap-
tic plasticity. Cell 118, 389–401.
Koch, H., Hofmann, K., and Brose, N. (2000). Definition of Munc13-
homology-domains and characterization of a novel ubiquitously
expressed Munc13 isoform. Biochem. J. 349, 247–253.
Mahapatra, N.R., O’Connor, D.T., Vaingankar, S.M., Hikim, A.P.,
Mahata, M., Ray, S., Staite, E., Wu, H., Gu, Y., Dalton, N., et al.
(2005). Hypertension from targeted ablation of chromogranin A can
be rescued by the human ortholog. J. Clin. Invest. 115, 1942–1952.
Maycox, P.R., Deckwerth, T., Hell, J.W., and Jahn, R. (1988). Gluta-
mate uptake by brain synaptic vesicles. Energy dependence of trans-
port and functional reconstitution in proteoliposomes. J. Biol. Chem.
263, 15423–15428.
McEwen, J.M., Madison, J.M., Dybbs, M., and Kaplan, J.M. (2006).
Antagonistic regulation of synaptic vesicle priming by Tomosyn and
UNC-13. Neuron 51, 303–315.
Morgan, A., and Burgoyne, R.D. (1997). Common mechanisms for reg-
ulated exocytosis in the chromaffin cell and the synapse. Semin. Cell
Dev. Biol. 8, 141–149.
Otsu, Y., and Murphy, T.H. (2004). Optical postsynaptic measurement
of vesicle release rates for hippocampal synapses undergoing asyn-
chronous release during train stimulation. J. Neurosci. 24, 9076–9086.
Palmer, C.L., Cotton, L., and Henley, J.M. (2005). The molecular phar-
macology and cell biology of alpha-amino-3-hydroxy-5-methyl-4-iso-
xazolepropionic acid receptors. Pharmacol. Rev. 57, 253–277.
Pan, H., Che, F.Y., Peng, B., Steiner, D.F., Pintar, J.E., and Fricker, L.D.
(2006). The role of prohormone convertase-2 in hypothalamic neuro-
peptide processing: a quantitative neuropeptidomic study. J. Neuro-
chem. 98, 1763–1777.
Pyott, S.J., and Rosenmund, C. (2002). The effects of temperature on
vesicular supply and release in autaptic cultures of rat and mouse
hippocampal neurons. J. Physiol. 539, 523–535.
Renden, R., Berwin, B., Davis, W., Ann, K., Chin, C.T., Kreber, R.,
Ganetzky, B., Martin, T.F., and Broadie, K. (2001). Drosophila CAPS
is an essential gene that regulates dense-core vesicle release and
synaptic vesicle fusion. Neuron 31, 421–437.
Rhee, J.S., Betz, A., Pyott, S., Reim, K., Varoqueaux, F., Augustin, I.,
Hesse, D., Sudhof, T.C., Takahashi, M., Rosenmund, C., and Brose,
N. (2002). Beta phorbol ester- and diacylglycerol-induced augmenta-
tion of transmitter release is mediated by Munc13s and not by PKCs.
Cell 108, 121–133.
Richmond, J.E., Weimer, R.M., and Jorgensen, E.M. (2001). An open
form of syntaxin bypasses the requirement for UNC-13 in vesicle prim-
ing. Nature 412, 338–341.
Rosenmund, C., Clements, J.D., and Westbrook, G.L. (1993). Nonuni-
form probability of glutamate release at a hippocampal synapse.
Science 262, 754–757.
Rosenmund, C., Sigler, A., Augustin, I., Reim, K., Brose, N., and Rhee,
J.S. (2002). Differential control of vesicle priming and short-term plas-
ticity by Munc13 isoforms. Neuron 33, 411–424.
Rosenmund, C., and Stevens, C.F. (1996). Definition of the readily
releasable pool of vesicles at hippocampal synapses. Neuron 16,
1197–1207.
Rupnik, M., Kreft, M., Sikdar, S.K., Grilc, S., Romih, R., Zupancic, G.,
Martin, T.F., and Zorec, R. (2000). Rapid regulated dense-core vesicle
exocytosis requires the CAPS protein. Proc. Natl. Acad. Sci. USA 97,
5627–5632.
808 Cell 131, 796–808, November 16, 2007 ª2007 Elsevier Inc
Sadakata, T., Itakura, M., Kozaki, S., Sekine, Y., Takahashi, M., and
Furuichi, T. (2006). Differential distributions of the Ca2+ -dependent
activator protein for secretion family proteins (CAPS2 and CAPS1) in
the mouse brain. J. Comp. Neurol. 495, 735–753.
Sadakata, T., Kakegawa, W., Mizoguchi, A., Washida, M., Katoh-
Semba, R., Shutoh, F., Okamoto, T., Nakashima, H., Kimura, K.,
Tanaka, M., et al. (2007). Impaired cerebellar development and func-
tion in mice lacking CAPS2, a protein involved in neurotrophin release.
J. Neurosci. 27, 2472–2482.
Sadakata, T., Mizoguchi, A., Sato, Y., Katoh-Semba, R., Fukuda, M.,
Mikoshiba, K., and Furuichi, T. (2004). The secretory granule-associ-
ated protein CAPS2 regulates neurotrophin release and cell survival.
J. Neurosci. 24, 43–52.
Schoch, S., Deak, F., Konigstorfer, A., Mozhayeva, M., Sara, Y.,
Sudhof, T.C., and Kavalali, E.T. (2001). SNARE function analyzed in
synaptobrevin/VAMP knockout mice. Science 294, 1117–1122.
Speese, S., Petrie, M., Shuske, K., Ailion, M., Ann, K., Iwasaki, K., Jor-
gensen, E.M., and Martin, T.F. (2007). UNC-31 (CAPS) is required for
dense-core vesicle but not synaptic vesicle exocytosis in Caenorhab-
ditis elegans. J. Neurosci. 27, 6150–6162.
Speidel, D., Bruederle, C.E., Enk, C., Voets, T., Varoqueaux, F., Reim,
K., Becherer, U., Fornai, F., Ruggieri, S., Holighaus, Y., et al. (2005).
CAPS1 regulates catecholamine loading of large dense-core vesicles.
Neuron 46, 75–88.
Speidel, D., Varoqueaux, F., Enk, C., Nojiri, M., Grishanin, R.N., Martin,
T.F., Hofmann, K., Brose, N., and Reim, K. (2003). A family of Ca2+-
dependent activator proteins for secretion: comparative analysis of
structure, expression, localization, and function. J. Biol. Chem. 278,
52802–52809.
Stevens, C.F., and Tsujimoto, T. (1995). Estimates for the pool size of
releasable quanta at a single central synapse and for the time required
to refill the pool. Proc. Natl. Acad. Sci. USA 92, 846–849.
Stevens, D.R., Wu, Z.X., Matti, U., Junge, H.J., Schirra, C., Becherer,
U., Wojcik, S.M., Brose, N., and Rettig, J. (2005). Identification of the
minimal protein domain required for priming activity of Munc13–1.
Curr. Biol. 15, 2243–2248.
Takamori, S., Holt, M., Stenius, K., Lemke, E.A., Gronborg, M., Riedel,
D., Urlaub, H., Schenck, S., Brugger, B., Ringler, P., et al. (2006).
Molecular anatomy of a trafficking organelle. Cell 127, 831–846.
Tandon, A., Bannykh, S., Kowalchyk, J.A., Banerjee, A., Martin, T.F.,
and Balch, W.E. (1998). Differential regulation of exocytosis by calcium
and CAPS in semi-intact synaptosomes. Neuron 21, 147–154.
Varoqueaux, F., Sigler, A., Rhee, J.S., Brose, N., Enk, C., Reim, K., and
Rosenmund, C. (2002). Total arrest of spontaneous and evoked synap-
tic transmission but normal synaptogenesis in the absence of Munc13-
mediated vesicle priming. Proc. Natl. Acad. Sci. USA 99, 9037–9042.
Walent, J.H., Porter, B.W., and Martin, T.F. (1992). A novel 145 kd brain
cytosolic protein reconstitutes Ca(2+)-regulated secretion in perme-
able neuroendocrine cells. Cell 70, 765–775.
Washbourne, P., Thompson, P.M., Carta, M., Costa, E.T., Mathews,
J.R., Lopez-Bendito, G., Molnar, Z., Becher, M.W., Valenzuela, C.F.,
Partridge, L.D., and Wilson, M.C. (2002). Genetic ablation of the
t-SNARE SNAP-25 distinguishes mechanisms of neuroexocytosis.
Nat. Neurosci. 5, 19–26.
Zhu, X., Zhou, A., Dey, A., Norrbom, C., Carroll, R., Zhang, C., Laurent,
V., Lindberg, I., Ugleholdt, R., Holst, J.J., and Steiner, D.F. (2002). Dis-
ruption of PC1/3 expression in mice causes dwarfism and multiple
neuroendocrine peptide processing defects. Proc. Natl. Acad. Sci.
USA 99, 10293–10298.
Zucker, R.S., and Regehr, W.G. (2002). Short-term synaptic plasticity.
Annu. Rev. Physiol. 64, 355–405.
.