Capital Structure MBA 253. The Financing Decision The firm has limited ways to raise funds: Debt:...
101
Capital Structure MBA 253
-
date post
21-Dec-2015 -
Category
Documents
-
view
216 -
download
2
Transcript of Capital Structure MBA 253. The Financing Decision The firm has limited ways to raise funds: Debt:...

Capital Structure
MBA 253

The Financing Decision
The firm has limited ways to raise funds: Debt: Bank Debt, Commercial Paper and Corporate BondsEquity: Owners Equity, Venture Capital, Common Stock and WarrantsHybrid Securities: Mixtures of Debt and Equity: Convertible Debt, Preferred Stock, Option Linked Bonds
What mix of debt and equity should be used? (what is the firm’s Capital Structure)

Debt vs. Equity
Debt• Fixed Claim• Tax Deductible• High Priority in
Financial Trouble• Fixed Maturity• No Management
Control
Equity• Residual Claimant• No Tax Deduction• Lowest Priority in
Financial Trouble• No Maturity• Management Control

Debt
Bank DebtSmall amounts, Intermediation for small firms, No ratings agencies - public information can be minimized
Corporate BondsRisk Sharing, special featuresIssues to be addressed
Short or long termFixed or Floating RatesAssets used as SecuritySpecial Features
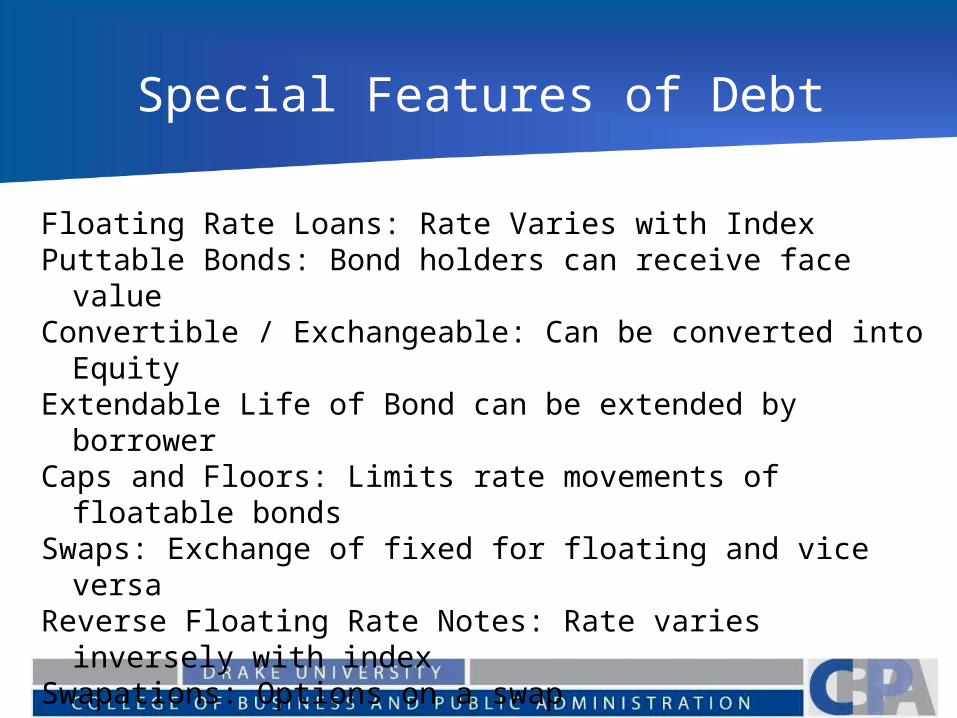
Special Features of Debt
Floating Rate Loans: Rate Varies with IndexPuttable Bonds: Bond holders can receive face value Convertible / Exchangeable: Can be converted into
EquityExtendable Life of Bond can be extended by borrowerCaps and Floors: Limits rate movements of floatable
bondsSwaps: Exchange of fixed for floating and vice versaReverse Floating Rate Notes: Rate varies inversely
with indexSwapations: Options on a swap

Equity
Owners Equityreturning earnings on the seed money to the firm
Venture Capitalcapital provided in return for ownership share
Common StockWarrants
Holders receive the right to buy shares in the company at a fixed price
priced upon implied volatilitycreate no financial obligation at time of issue
Contingent value rightsInvestors can sell their stock at a fixed price

Warrants and Options
Similar to a long term call optionDifference is that exercising a warrant affects the value of the underlying asset (it increase the number of shares outstanding)

Hybrid Securities
Convertible DebtLowers the interest rate paid by the firmbondholder given the option to convert into stock
Preferred Stockpromised payment (like bonds)infinite life, limited voting privileges
Option Linked BondsCommodity linked bonds

Does Capital Structure Matter?
WACC = rd(1-t)wd + rpswps + rewe
Generally: Keeping the risk level the same, Debt is less expensive than EquityHowever, Increasing debt, increases the risk to the shareholders, the cost of equity should increase due to the higher risk.Which has a larger influence: the decreased cost associated with the use of debt or increase cost associated with equity?

Debt Benefits and Cap Structure
Debt ratios of firms with higher tax rates should be higher than those with lower tax ratesFirms that have substantial non-debt tax shield (depreciation for example)should be less likely to use debtIf tax rates increase over time so should debt ratios

The Costs of Debt
Bankruptcy costsprobability of bankruptcyIndirect and Direct Costs
Agency CostsCreates tensions between shareholders and lenders
Lost FlexibilityFirms value the ability to take on new projects

Bankruptcy
Probability Increases with The size of debt obligations relative to the size of operating cash flowsThe variability of cash flows
Costs of BankruptcyDirect Costs --Legal and administrative costsIndirect Costs -- decreased sales, availability of credit
Indirect costs are higher when firms produce Durable products Products dependent on quality reputation Products requiring service and complementary
products Products requiring support services

Bankruptcy and Cap Structure
Firms in volatile industries should use debt less than firms in more stable industriesIf debt can be structured so that cash flows on debt increase and decrease with cash flows can borrow moreIf external protection from bankruptcy exists firms will borrow more Firms with non divisible and non marketable assets are more likely to use debtIf products require long-term servicing should have lower leverage

Agency Costs
Conflicts between Bondholders and StockholdersInvestment decisions (risk shifting)Financing DecisionsDividend policy
Agency costs are important whenBondholders believe that stockholder actions will increase chance of defaultProtective Covenants require monitoring costs and indirectly reduce flexibilityThe firms investments are not easily monitoredprojects are long term

Flexibility
The ability to handle unforeseen contingencies that might ariseProvides ability to undertake new projectsProvides more breathing roomFirms with large and unpredictable demands on cash flows will require higher flexibilityAs firms and industries mature the returns on projects become more stable and the desire of flexibility decreases

The Borrowing Trade off
Advantages Tax Benefits Higher tax rate
higher benefit
Added Discipline The greater the
separation between management and shareholders the greater the benefit
Disadvantages• Bankruptcy Costs Higher business risk
implies Higher cost
Agency Cost Greater separation
between stockholders and lenders results in Higher Cost
Loss of Flexibility Greater uncertainty
implies Higher costs

Business Risk
Business RiskThe riskiness of the firm’s assets if it uses no debtLooked at in a stand alone contextMeasured by the standard deviation of the firms ROA

ROA vs. ROE
ROA = Return to Investors/Assets = (Net Income to Shareholders +
Interest)/Assets
Without the use of debt this becomes= (Net Income to Shareholders /AssetsWhich is ROEW/O debt business risk can be measured by the
firms ROE.

ROE
Variability in ROE is determined by:1. Demand Variability2. Sale Price Variability3. Input Cost Variability4. Ability to Adjust output prices5. Ability to develop new products6. Fixed Costs

Operating Leverage
The portion of the firms costs that are fixed.Fixed costs must be paid regardless of sales – this increases riskThe Breakeven point is therefore important - it is the amount of sales needed to cover fixed cost.

Breakeven Point
The breakeven point occurs where the firm earns just enough to cover fixed and variable cost (EBIT = 0 and ROE = 0)EBIT=Price(Quant)-VaribCost(Q)-FixedC)
Rearrange and solve for Q0 = pQ-VQ-FF = (P-V)QQ = F/(P-V)

Financial Risk
Financial Risk is the extra risk placed on shareholders when the firm decides to use debt.
Above ROE = NI/asset=NI/equity(assets = equity when debt =0)
Now NI declines and as debt increases and equity decreases. The net effect is an increase in ROE

An example
Stratsburg Electronics 175,000 in assets two choices 175,000 equity or 87,500 equity &
87,500 debtAssume that the use of equity does not
change the EBIT

Numerical Example
Debt and Equity
All Equity
Expected EBIT 35,000 35,000
Interest (10%) 8,700 0
EBT 26,250 35,000
Taxes(40%) 10,500 14,000
Net Income 15,750 21,000
Expected ROE 15,750/87,500
=18%
21,000/175,000
=12%

The Capital Structure Question
Is there an “optimal” capital structure?Modigilani and Miller
Capital structure is irrelevantThe decrease in cost of capital from debt is offset by the increase in the cost of equity.
Trade off TheoriesThe capital structure that minimizes the WACC will also produce the highest shareholder value and is the optimal capital structure.

Modigliani & Miller
AssumptionsFirms can be classified by business
risk All investors agree about the
distribution of future earningsPerfect Capital Markets No Bankruptcy Costs No income taxes All cash flows are perpetuitiesEBIT is not changed by use of debt

M&M two propositions
Value of leveraged firm = Value of Unleveraged Firm EBIT/ WACC = EBIT / rSU
rSL = rSU + (rSU - rd) (D/S) where:
rSL = Cost of stock leveraged firm rSU = cost of stock unleveraged firm rd = Constant cost of debt D = market value of debt S = market value of stock

M&M
EBIT/WACC = EBIT/KSU
rSL=rSU+(rSU-rd)(D/S)Together this implies that the cost of capital doesn’t change as the amount of borrowing increases. Assumed that EBIT doesn’t change so WACC = rSU regardless of the amount of debt used.WACC = wd rd + wsrSL

An Example:EBIT/WACC = EBIT/KSU KSL=KSU+(KSU-Kd)(D/S)
Assume that KSU = 10% Kd = 6%
No DebtValue of firm = EBIT/ KSU
Value of firm = EBIT/.10
10% Debt KSL=KSU+(KSU-Kd)(D/S) KSL= .10 + (.10-.06)(1/9) KSL= .104444
WACC = wd Kd + ws KSL
WACC = .10(.06)+.9(.10444)
WACC = .10
Value of firm = EBIT/.10

Including Taxes
What if the interest payments on debt are tax deductible? Then WACC will decrease at the percentage of debt increases.
This implies that the value of the firm will increase as the amount of debt increases. In fact the optimal capital structure would be 100% debt. Miller also showed that if personal income taxes are included that one possible scenario is still capital structure irrelevance. (see book for details)

If Debt Doesn’t Matter
The cost of capital is unaffected by changes in the proportions of debt and equity
The value of the firm is unaffected by leverage
The investment decision can be made independently of the financing decision.

Tradeoff Theory
Initially adding debt causes the WACC to decline. The tax benefit of debt causes the WACC to decrease for now bankruptcy costs are low.
As the firm uses more debt bankruptcy costs start to increase. The decrease in the WACC is less for every unit of debt added.
As the amount of debt increase, so do bankruptcy costs Eventually the indirect and direct costs to the firm outweigh the tax benefits and the WACC increases.
This implies that a minimum WACC exists, at this point the value of the firm (EBIT/WACC) will be maximized.

Trade Off Theory
If this is the case – the use of debt matters, The point were the WACC will be minimized will maximize the value of the firm

Empirical EvidenceThe Debt Ratio is:
Negatively correlated with the volatility in annual operating earnings as predicted by bankruptcy costs
Positively related to the level of non-debt tax shields opposite of what was predicted
Negatively related to advertising and R&D expenses, as predicted by tradeoff theory
Positively related to the marginal tax rate as predicted by the tradeoff theory
Negatively related to the need for decision making flexibility as predicted by tradeoff theory
Negatively related to variability in operating cash flows as predicted by tradeoff theory

Information Asymmetry
Managers prefer retained earnings to external financing since external financing depends upon the market pricing the securityIf management believes that the market is overvaluing its securities it is more willing to issue new equity, even if projects don’t existIf management believes that the market is underpricing its securities it is less willing to issue new equity even if good projects exist.

Signaling
Therefore issuing securities signals the market that firms believe their security is overvalued and it is interpreted as a negative signal. (The market believes the firm has negative information not publicly available) The signal is more negative if there is a greater possibility of asymmetry (stocks for example).

Capital Structure Decisions
Rank Source Principles Cited1 Retained Earnings None2 Straight Debt Max Security Prices3 Convertible Debt Cash Flow and
Survivability4 External Common Avoiding Dilution
of Equity5 Straight Pref Stock Comparability6 Convertible Pref None

Other Things to Consider
Some final considerations in the capital structure decision1) Long Run Viability2) Managerial Conservatism3) Lender and Rating Agency Attitudes4) Financial Flexibility5) Control6) Asset Structure7) Growth Rate8) Profitability

Cap Structure: Models and Applications
Cost of Capital ApproachAnalysis based on the cost to the firm of financing new projects (the WACC calculated earlier)
Adjusted Present ValueValuing the firm by starting without leverage then adjusting its value as more debt is added
Comparative AnalysisComparing the debt ratio and other financial information to industry averages

The Cost of Capital Approach
Basic Idea: Attempt to maximize firm value by finding
the level of debt that produces its minimum WACC.Procedure:
Calculate the cost of debt, cost of equity and the WACC at various levels of debt to identify its minimum WACC.

WACC
The weighted average cost of capital is defined as the weighted average of the cost of the different components of financing
WACC = rdwd(1-t) + rpswps + rewe where:rd = before tax cost of debt wd = % of financing from
debtrps = cost of preferred stock wps = % of financing from
Pref stockrd = cost of debt equity wd = weight of financing
from equityt = firms marginal tax rate

WACC and Firm Value
The value of the firm is the present value of its future cash flows (FCFF) discounted at the WACC (the hurdle rate)Value of the firm = FCFF/(1+WACC)t]Notice as the WACC decreases the value of the firm will increase, if the WACC increases the value of the firm will decrease.

WACC and Firm Value
According to the present value formula as the discount rate decreases the PV of a future sum (or series of cash flows) will increase.If the tradeoff theory is correct there is a minimum WACC
Does this imply that the Firm Value will be maximized at the point where the WACC is minimized?

WACC and Firm Value
If the cash flows to the firm do not depend on the financing mix, the value of the firm is maximized when the WACC is minimizedThe Debt Equity ratio might cause a change in the FCFF, if this is the case the minimum WACC will not necessarily maximize firm value

Estimating the Cost of Capital*
You need to estimate the WACC for different levels of debt.
Develop an estimate for the cost of equity and various debt levelsDevelop an estimate for the cost of debt at various debt levelsCombine 1 and 2 to find the WACC for various levels of debt.

Estimating the Cost of Equity
Step 1 Estimate the equity beta (run regression or use analysts estimate)
Step 2 Estimate the unlevered beta (Beta if the firm had no debt)
u = current/[1+(1-t)D/E]Step 3 Reestimate the levered beta for different
levels of debtLevered = u[1+(1-t)D/E]
Step 4 Use CAPM to estimate the costs of equity from the levered betas
re= rRF+ Levered[E(rm)-rRF)

Disney’s Optimal Capital Structure
Step 1 Estimate Beta
Regression StatisticsR Square 0.330368Adjusted R Square 0.318823Standard Error 0.057753Observations 60.000000
Coefficients Standard Error t Stat P-valueIntercept 0.006689 0.007524 0.888943 0.377706S&P 1.094980 0.204697 5.349280 0.000002

Disney’s Cost of Equity
Step 2: Estimate the Unlevered beta: u =current/[1+(1-t)D/E]
Disney’s D/E Ratio = Long Term Debt = 12.67 Billion Market Capitalization =65.74 Billion D/E = 12.67/65.74 = .19%
Assuming a 36% tax rate
u= current/[1+(1-t)D/E] = 1.094[1+(1-.36)(.19)] = 0.975

Disney Cost of Equity
Step 3 Reestimate the
levered beta at different levels of debt
Lev= u[1+(1-t)D/E]
D/(D+E) D/E Bl0.100 0.111 1.0440.200 0.250 1.1310.300 0.429 1.2420.400 0.667 1.3910.500 1.000 1.5990.600 1.500 1.9110.700 2.333 2.4300.800 4.000 3.4700.900 9.000 6.589

Disney’s Cost of Equity
Step 4 Estimate cost of equity using Levered in the CAPM let rRF = 5%
rM- rRF = .0482%
Re=rRF+(rM-rRF)
D/(D+E) D/E Bl Cost of Equity0.100 0.111 1.044 0.1000.200 0.250 1.131 0.1050.300 0.429 1.242 0.1100.400 0.667 1.391 0.1170.500 1.000 1.599 0.1270.600 1.500 1.911 0.1420.700 2.333 2.430 0.1670.800 4.000 3.470 0.2170.900 9.000 6.589 0.368

Estimate the Cost of Debt
Step 1 Compute the market value of the firmMV of firm = MV of Debt + MV of Equity
Step 2 Compute $ value of debt at various debt ratios $Value of Debt = D/(D+E)(MV of
firm)Step 3 Compute the amount paid in interest at
each debt ratio = (Interest rate)($value of Debt)
Step 4 Estimate the Interest Coverage Ratio = EBIT/Interest Expense
Step 5 Use the Interest coverage ratio to determine bond ratings and interest rate spreads
Step 6 Use Spreads to find before tax cost of debt

A Viscous Circle
You need the interest rate to calculate the interest payments. Then use the interest payment to determine the interest coverage and rating to find the interest rate. Use iterative procedure to find consistent rates, Assume AAA use rate then estimate rate, if they are not the same repeat the process...

Disney’s Cost of Debt Step 1
Step 1 Compute the market value of the firmMV of firm = MV of Debt + MV of
Equity = 12.67 Billion+ 65.74
Billion = 78.41 Billion
Use this as the current amount of financing undertaken by the firm (we want to find the $ value of debt at various debt ratios)

Disney’s Cost of Debt Step 2
Step 2 Compute $ value of debt at various debt ratios $Value of Debt = (Debt/(D+E))(MV of firm)
D/(D+E) D/E $ Value of Debt0.1 0.1111 78410000000.2 0.2500 156820000000.3 0.4286 235230000000.4 0.6667 313640000000.5 1.0000 392050000000.6 1.5000 470460000000.7 2.3333 548870000000.9 9.0000 70569000000

Disney’s Cost of Debt Step 3
Step 3 Compute the amount paid in interest at each debt ratio = (Interest Rate)($value of Debt)
The problem is that you have to assume an interest rate then continue with Steps 4 and 5 to see if your assumption was correct. Your assumption of the rate is based upon the likely rating for the firm.
Starting with the increase from 0% to 10% debt assume that the firm is ranked AAA. Then look at the table relating bond ratings to rates to estimate the rate.

Bond Ratings and Average Yield Spreads vs. US Treasuries
(long term bonds)
Rating Spread Int Cov Rating Spread Int Cov AAA .35% >12.5 B+ 2.5% 2.5-3 AA .50% 9.5-12.5 B 3.25% 2-2.5 A+ .70% 7.5-9.5 B- 4.25% 1.5-2 A .85% 6.0-7.5 CCC 5.00% 1.25-1.5 A- 1.00% 4.5-6.0 CC 6.00% 0.8-1.25 BBB 1.5% 4-4.5 C 7.5% 0.5-
0.8 BB 2.0% 3-3.5 D 10.0%
<0.5

Disney’s Cost of Debt Step 3
A rating of AAA implies a 5.35% interest rate for the firm (0.35% spread over the long term rate)
Given the interest rate you can calculate the interest expense = (Interest Rate)($ Value of Debt) =(0.0535)(7.84) = .4194 Billion
Use this number to calculate the interest coverage ratio in step 4

Disney’s Cost of Debt Steps 4 & 5
Step 4 Estimate the Interest Coverage Ratio = EBIT/Interest Expense
Disney’s EBIT = 5.301 BillionInterest coverage ratio at 10% D/(D+E) = 5.301/0.4194 = 12.634
An interest coverage ratio of 12.634 implies a bond rating of AAA, so 5.35% is correct.
If the interest coverage ratio did not imply the same rating as your assumption, go back to step 3.

Ratings and Interest Coverage Ratios
Rating Coverage ratio Interest rateAAA 12.5 to infinity 5.35%AA 9.5 to 12.5 5.50%A+ 7.5 to 9.5 5.70%A 6.0 to 7.5 5.85%A - 4.5 to 6.0 6.00%BBB 4.0 to 4.5 6.50%
12.63
Implies a bond rating of AAA

A Second Example
Using a 20% D/(D+E) and still the assumption that the firms debt will be ranked AAA implying a 5.35% cost of debt
• The $ value of debt is 15.682 Billion• Implying $ expense of 15.682(.0535)
= .83898 Billion• The interest coverage ratio is
5.301/.83898 = 6.3183866 which implies a bond rating of ...

Ratings and Interest Coverage Ratios
Rating Coverage ratio Interest rateAAA 12.5 to infinity 5.35%AA 9.5 to 12.5 5.50%A+ 7.5 to 9.5 5.70%A 6.0 to 7.5 5.85%A - 4.5 to 6.0 6.00%BBB 4.0 to 4.5 6.50%
6.31
Implies a bond rating of A

Ratings and Interest Coverage Ratios
Since the interest coverage ratio implies that the bond should be rated A assume that the rate is 6.00%
• The $ value of debt is 15.682 Billion• Implying $ expense of 15.682(.0585) = .91739
Billion• The interest coverage ratio is
5.301/.91739 = 5.77 Checking the table…….

Ratings and Interest Coverage Ratios
Rating Coverage ratio Interest rateAAA 12.5 to infinity 5.35%AA 9.5 to 12.5 5.50%A+ 7.5 to 9.5 5.70%A 6.0 to 7.5 5.85%A - 4.5 to 6.0 6.00%BBB 4.0 to 4.5 6.50%
5.77Implies a bond rating of A-

A Second Example
Using a 20% D/(D+E) and still the assumption that the firms debt will be ranked A- implying a 6.00% cost of debt
• The $ value of debt is 15.682 Billion• Implying $ expense of 15.682(.06)
= .94092Billion• The interest coverage ratio is
5.301/.94092 = 5.63 which implies a bond rating of ...
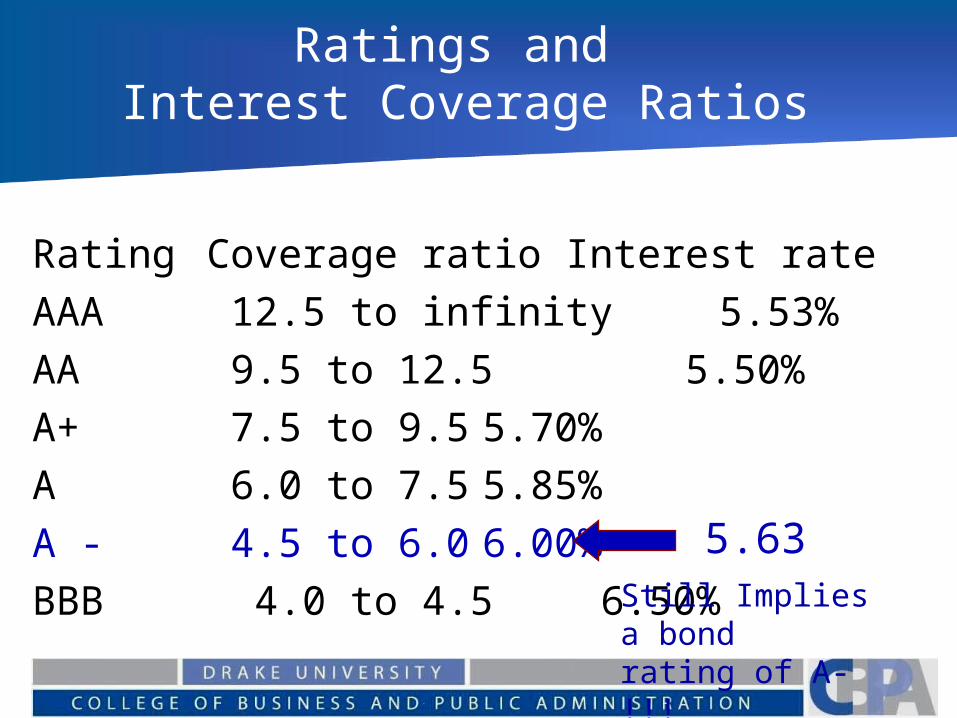
Ratings and Interest Coverage Ratios
Rating Coverage ratio Interest rateAAA 12.5 to infinity 5.53%AA 9.5 to 12.5 5.50%A+ 7.5 to 9.5 5.70%A 6.0 to 7.5 5.85%A - 4.5 to 6.0 6.00%BBB 4.0 to 4.5 6.50%
5.63Still Implies a bond rating of A- !!!

Ratings and Interest Coverage Ratios
Since the assumed rate and the corresponding actual rate agree, the cost of debt for a weight in debt of 20% is then set to be 6.00% and the process is repeated for 25% debt, 30% debt etc…
Remember that these are before tax cost of debt, and they will need to be adjusted in the cost of capital formula.

Disney’s Cost of Debt
Steps 3 and 4 for debt from 10% to 60% - complete this for a range from 0 to 100% debt
D/(D+E) D/EInterest Coverage
Ratio Cost of Debt0.100 0.111 12.637 0.0540.200 0.250 5.778 0.0600.300 0.429 3.005 0.0750.400 0.667 1.537 0.1100.500 1.000 0.901 0.1500.600 1.500 0.663 0.170

Cost of Capital
Using the cost of equity and cost of debt at various debt levels you can find the WACC of each level of debt.
Remember, the debt level determine the weights of each type of financing (the capital structure).

WACC at Different Debt Levels
D/E Wd rd We re Cost of Capital0.0526 0.05 0.0535 0.95 0.0986 0.095350.1111 0.1 0.0535 0.9 0.1003 0.093720.1765 0.15 0.057 0.85 0.1023 0.092420.2500 0.2 0.06 0.8 0.1045 0.091280.3333 0.25 0.06 0.75 0.1070 0.089850.4286 0.3 0.075 0.7 0.1099 0.091310.5385 0.35 0.09 0.65 0.1132 0.093720.6667 0.4 0.11 0.6 0.1170 0.098380.8182 0.45 0.15 0.55 0.1216 0.110071.0000 0.5 0.15 0.5 0.1271 0.111531.2222 0.55 0.15 0.45 0.1337 0.112981.5000 0.6 0.17 0.4 0.1421 0.122111.8571 0.65 0.17 0.35 0.1528 0.124212.3333 0.7 0.17 0.3 0.1671 0.126303.0000 0.75 0.17 0.25 0.1872 0.128404.0000 0.8 0.2 0.2 0.2173 0.145855.6667 0.85 0.2 0.15 0.2674 0.148919.0000 0.9 0.2 0.1 0.3676 0.1519619.0000 0.95 0.2 0.05 0.6683 0.15501

Optimal Debt Ratio
0.06000
0.08000
0.10000
0.12000
0.14000
0.16000
0.18000
0.20000
0 0.2 0.4 0.6 0.8 1

Minimum WACC
The minimum WACC occurs at approximately 25% debt. This is the “Optimal” amount of debt for the firm
The value of the firm could then be found assuming that the future FCFF can be estimated.

FCFF
FCFF = EBIT(1-t) + Depreciation - Capital Spending
Disney’s 2005 financial statements show that EBIT = 5.301 BillionDepreciation = 1.339 BillionCapital Spending = 1.823 BillionAssuming a tax rate of 36%
FCFF = 5.301(1-.36)+1.339 – 1.823 = 2.9086

Firm Value and WACC
In General the value of the firm is the present value of its discounted cash flows:
If the cash flows are constant over time similar to a perpetuity this reduces to
n
tt
t
WACC
FCFF
1 )1(
WACC
FCFF

Constant growth in FCFF
This is the same formula as for valuing stocks with constant growth in dividends (now the cash flows being discounted are FCFF instead of Dividends.Let g be the constant rate of growth in FCFF then the value of the firm is given by:
)(
)1(
gWACC
gFCFF

Annual Savings
Disney is currently operating at a debt level of 16%. But its optimal debt level is 30%The annual financing cost at the current debt ratio is 78.41(.09242) = 7.2466 BillionAt a debt level of 25% (WACC = .08985)
The annual financing costs would be equal to 78.41(.08985) = 7.0421 Billion
This implies an annual savings of 7.2466B-7.0421 = $201.46 Million IF the firm moves to its optimal capital structure

Implied Growth Rate
Rearrange to find the growth rate
)(
)1(0
gWACC
gFCFFPV
)1()( 0 gFCFFgWACCPV )()()( 0 gFCFFFCFFgPVWACCPV
)()()( 0 gPVgFCFFFCFFWACCPV
))(()( 0 gPVFCFFFCFFWACCPV )(
))(()(
PVFCFF
FCFFWACCPVg

Implied Growth Rate
Use the current MV of the firm from before as the PV PV=78.41 B, FCFF = 2.9086 Billion, WACC = .08985%
)(
))(()(
PVFCFF
FCFFWACCPVg
.0508778.412.9086
2.908608985.78.41

Assuming that the annual savings also grows at the implied growth rate of 7.36%, the PV of the annual savings will represent an increase in the value of the firm since it reduces its yearly interest expense.
Billion $5.431 Million 143,5$05087.08985.
)05087.1)(Million 46.201(
g-WACC
g)Saving(1 AnnualPV

Share Price
The value of the firm increased by 5.431 Billion, this can be transformed to a per share value by dividing by the number of shares outstanding.The resulting number should represent an increase in the share price of the firm. It would be the increase in the PV of the future cash flows to the firm. Given 2.1 Billion Shares issued:
5.431/2.113 = $2.57 The share price should increase by $2.57 or
2.57/31.45 = 8.1%
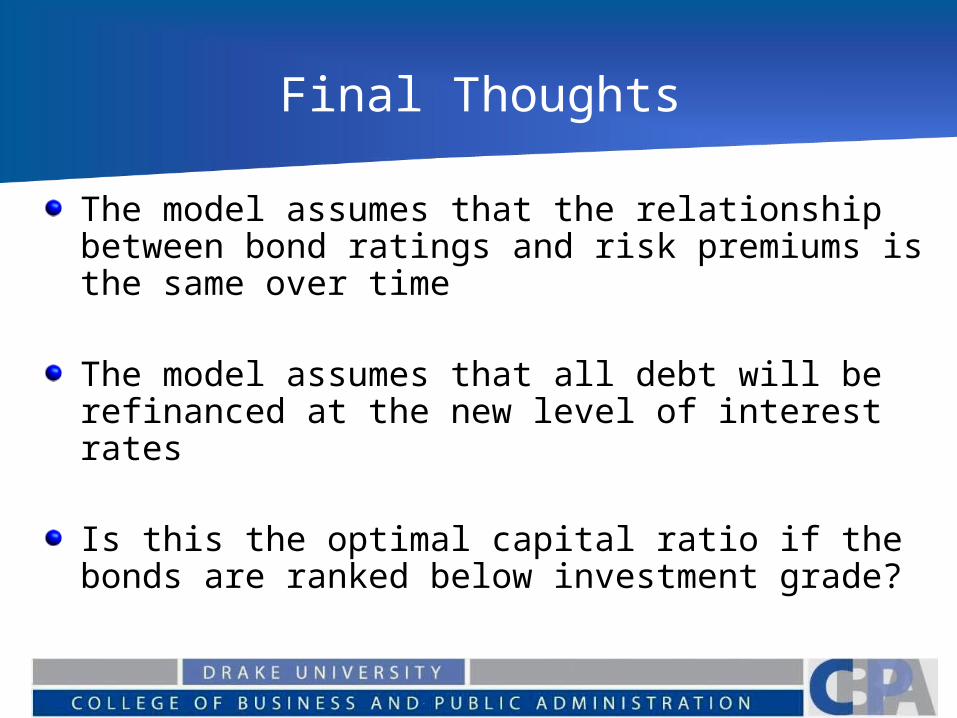
Final Thoughts
The model assumes that the relationship between bond ratings and risk premiums is the same over time
The model assumes that all debt will be refinanced at the new level of interest rates
Is this the optimal capital ratio if the bonds are ranked below investment grade?

Adjusted Present Value
Start with the PV of the firm assuming that there is no debt
As debt is added adjust the present value to account for the positive and negative effects of adding debt.
Assuming that the largest benefit of borrowing is the tax saving and the largest source of costs are bankruptcy costs:
Value of Value of PV of PV of Levered = Unlevered + Tax Benefits - Bankruptcy Firm Firm of debt Costs

Value of Unlevered Firm
Assumes that the firm has no debt. this requires an estimate of the unlevered cost of equity.The unlevered cost of equity is found by using the unlevered beta in the CAPMThe value of the unlevered firm is then:
)(
)1(
gWACC
gFCFF

Tax Benefit
The expected tax benefit from borrowing is based upon the level of debt in the firm.Each years tax savings equal the tax rate multiplied by the amount of debt multiplied by the cost of debtThe benefit should be discounted at the cost of debt
PV of tax benefit = (Tax rate)(Cost of Debt)(Debt) Cost of Debt
= (Tax Rate)(Debt)Note: The cost of debt changes as the level of
debt changes

Expected Bankruptcy Costs
The expected bankruptcy costs depends upon the probability of defaultThe probability of default will increase as the firm increases its use of debt.The expected bankruptcy cost is the probability of default multiplied by the PV of the bankruptcy costs if the firm defaults.
PV of Expected Probability PV of Bankruptcy = of x
Bankruptcy Costs Bankruptcy Costs

Optimal Debt Ratio
To find the optimal debt ratio the adjusted value of the firm needs to be calculated at various levels of debt
The level of debt that maximizes the adjusted value of the levered firm is the one that is the optimal level of debt.

Disney
Step 1: Using our numbers from before estimate the value of the unlevered firm:
Value of Value of PV of PV of Levered = Unlevered + Tax Benefits - Bankruptcy Firm Firm of debt Costs
Rearranging
Value of Value of PV of PV of UnLevered = Levered - Tax Benefits + Bankruptcy Firm Firm of debt Costs
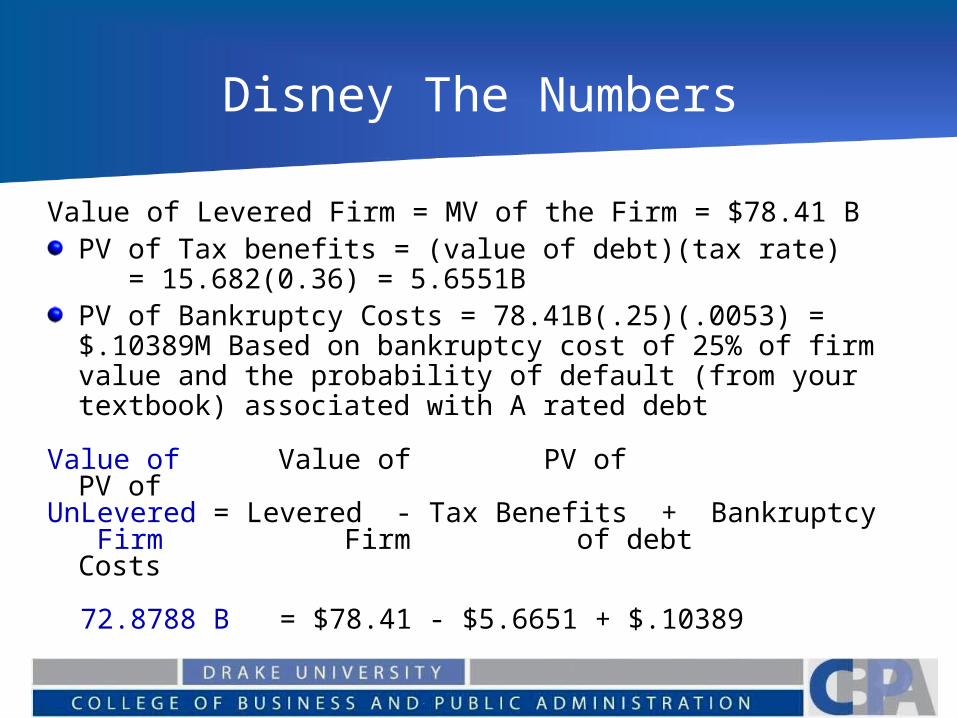
Disney The Numbers
Value of Levered Firm = MV of the Firm = $78.41 BPV of Tax benefits = (value of debt)(tax rate)
= 15.682(0.36) = 5.6551BPV of Bankruptcy Costs = 78.41B(.25)(.0053) = $.10389M Based on bankruptcy cost of 25% of firm value and the probability of default (from your textbook) associated with A rated debt
Value of Value of PV of PV of UnLevered = Levered - Tax Benefits + Bankruptcy Firm Firm of debt Costs
72.8788 B = $78.41 - $5.6651 + $.10389

Step 2
Estimate the tax benefits and expected bankruptcy costs at various levels of debt.
Start with the Value of the unlevered firm then adjust for the PV of tax Benefit and PV of Bankruptcy Costs

Step 3
Estimate the value of the levered firm at various debt levels
WdPV Tax Benefit
PV of Ban Cost APV
0.05 1.411 0.002 74.2880.1 2.823 0.002 75.7000.15 4.234 0.078 77.0350.2 5.646 0.276 78.2480.25 7.057 0.276 79.6590.3 8.468 2.392 78.9560.35 9.880 5.167 77.5910.4 11.291 6.371 77.7990.45 12.702 12.742 72.8400.5 14.114 12.742 74.2510.55 15.525 12.742 75.6620.6 16.937 15.682 74.1330.65 18.348 15.682 75.5450.7 19.759 15.682 76.9560.75 21.171 19.603 74.4470.8 22.582 19.603 75.8580.85 23.993 19.603 77.2700.9 25.405 19.603 78.681

Adjusted Present Value
APV
72.000
73.000
74.000
75.000
76.000
77.000
78.000
79.000
80.000
81.000
0 0.2 0.4 0.6 0.8 1
Weight in Debt
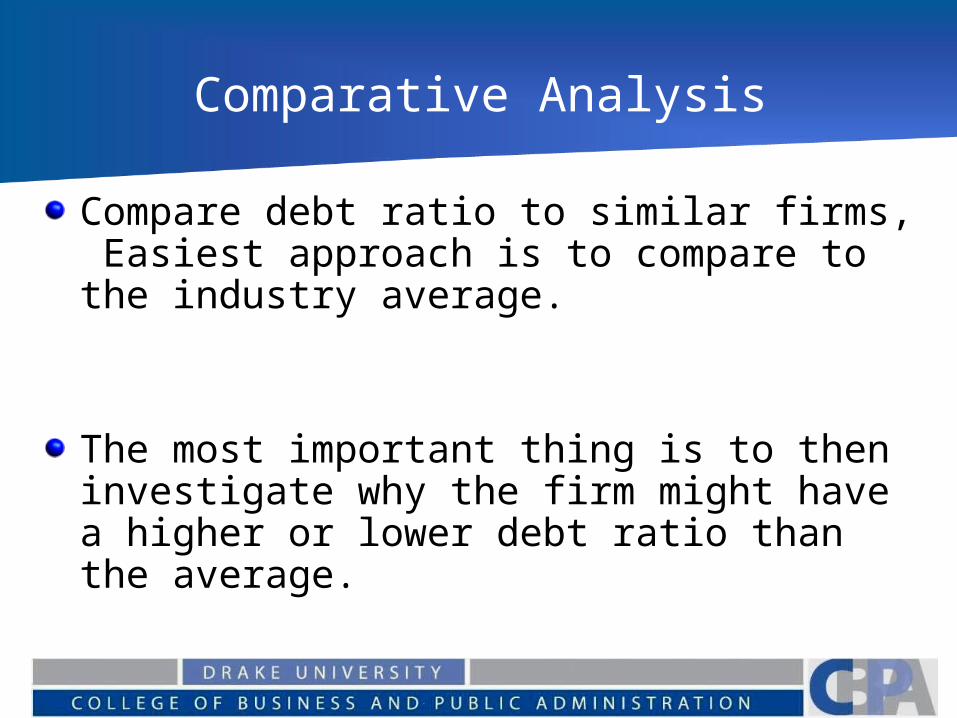
Comparative Analysis
Compare debt ratio to similar firms, Easiest approach is to compare to the industry average.
The most important thing is to then investigate why the firm might have a higher or lower debt ratio than the average.

The Financing Details
If the firm is not at its optimal level of debt it must decide if it wants to move toward its optimal level. Outside pressure often plays a key role in making this decision.
If it decides to move toward its optimal level it has two choices.
Gradual Change --Change only new projects or also adjust existing ones?Quick Change

Immediate or Gradual
The decision of an unlevered firm to change its debt ratio is based upon
Degree of Confidence in the Optimal EstimateComparability of Peer GroupsLikelihood of a takeoverNeed for flexibility (financing slack)

?? Speed of Change ??
Assume that a firm which currently has more debt than identified as its optimal level has substantial indirect bankruptcy costs. Is the speed that it attempts to return to its optimal level affected by its bankruptcy costs?

Increasing Leverage Quickly
Borrowing money and buying back stock
Debt for Equity Swap
Using the proceeds from the sales of assets to buyback stock

Why Increase Leverage Quickly?
Often to avoid a hostile takeover bid. Firms with large cash balances are prime targets for takeover. Some recent examples of increased leverage to fight a takeover are
CBS Inc. in 1986 Bought back 21% of StockGoodyear Tire 1986 Sold three units and bought back 20 Million sharesPhillips Petrol. 1984 Doubled debt to buy back
shares

Decreasing Leverage Quickly
Creates a problem since the it signals that the firm is desperate to decrease its debt level (It might not survive if it doesn’t decrease its debt level)Most often this happens in one of two ways
Renegotiating debt agreements. Convincing lenders to take an equity stake in the firmSelling assets and using proceeds to retire some debtWhich assets should the firm sell? Worst performing, Best performing or most liquid?

Increasing Leverage Gradually
The ability to increase the the firms leverage gradually allows the firm to look for quality projects. Some possible ways of increasing the portion of debt include:
Increasing the Dividend Payout RatioRepurchasing stock each yearIncreasing Capital expenditures

Decreasing Leverage Gradually
Firms can finance new projects with retained earnings, lowering the amount of debt used by the firm. Lowering (or suspending) dividend is another approach (although not one favored by shareholders) to decreasing the debt level.

Details of New Finance
The firm needs to specify the details that outline either its new equity (common stock, warrants or contingency rights) or debt (maturity, fixed or floating, conversion options....)
Will discuss a series of steps that will help in the decision making process

Details
Examine the Cash Flow CharacteristicsWant to match Cash Flows and Liabilities (duration, fixed or floating rates, inflation, currency risk...)
Examine the tax implicationsConsider the response of Rating AgenciesExamine the effects of Asymmetric InformationConsider any Agency CostsA Sensitivity Analysis