
Capital Structure Analysis of EBXGroup’s Companies ...
20
Recebido em 02/08/2017, revisões requeridas em 05/09/2017, aprovado em 19/10/2017, disponível em 18/12/2017 Avaliado pelo sistema double blind review Editor-Chefe: Rafael Barreiros Porto Editor associado: Pedro Guilherme Ribeiro Piccoli ISSN: 1984-3925 http://dx.doi.org/10.21714/1984-3925_2017v20n3a8 ______________________________________________________________________________ Contabilidade, Gestão e Governança - Brasília · v. 20 · n. 3 · p. 463-482 · set /dez. 2017 463 Capital Structure Analysis of EBXGroup’s Companies: Combining Theory and Practice Análise da Estrutura de Capital das Empresas do GrupoEBX: Unindo Teoria e Prática Matheus da Costa Gomes 1 , Vinícius Medeiros Magnani 2 , Mauricio Ribeiro do Valle 3 RESUMO De acordo com a teoria de market timing, as companhias tendem a emitir ações ou dívidas de modo a explorar janelas de oportunidade, e esse comportamento é um determinante significativo da estrutura de capital das empresas. Com base nessa assertiva e nas evidências recentes encontradas no mercado brasileiro, este trabalho tem por objetivo analisar o comportamento de market timing de seis empresas do Grupo EBX (MPX, MMX, OGX, LLX, OSX e CCX), com ações cotadas na BM&FBovespa, até meados de 2013. Para tanto, utilizou-se a metodologia de estudo de caso e, como principais fontes de evidências, indicadores relacionados à estrutura de capital e ao mercado de ações. Foi inserida, também, uma abordagem econométrica utilizando-se o estimador de efeitos fixos para dados em painéis. Os resultados encontrados apontam que as decisões financeiras tomadas pelos gestores das empresas do Grupo EBX indicam tentativas de explorar janelas de oportunidades relacionadas, sobretudo, ao mercado de ações, mensuradas tanto pelo price-to-earnings (PE) de Shiller, um índice agregado de mercado, quanto pelo índice market-to-book (M/B) de cada empresa analisada. Este trabalho contribui para a discussão sobre market timing no Brasil, ao unir teoria e prática, de maneira intuitiva e dinâmica, trazendo aspectos relativos às empresas e às condições de mercado. Palavras-chave: Estrutura de capital; Grupo EBX; Market timing; Janelas de oportunidade. 1 Mestre em Controladoria e Contabilidade pela Faculdade de Economia, Administração e Contabilidade de Ribeirão Preto (FEA-RP) da Universidade de São Paulo – USP, São Paulo, (Brasil). E-mail: [email protected] 2 Doutorando do Programa de Pós-Gradução em Controladoria e Contabilidade (PPGCC) da FEA-RP – USP, São Paulo, (Brasil). E-mail: [email protected] 3 Graduado em Ciências Econômicas pela Universidade Estadual Paulista Júlio de Mesquita Filho – UNESP, São Paulo, (Brasil). E-mail: [email protected]
Transcript of Capital Structure Analysis of EBXGroup’s Companies ...

Recebido em 02/08/2017, revisões requeridas em 05/09/2017, aprovado em 19/10/2017, disponível em 18/12/2017 Avaliado pelo sistema double blind review
Editor-Chefe: Rafael Barreiros Porto Editor associado: Pedro Guilherme Ribeiro Piccoli ISSN: 1984-3925 http://dx.doi.org/10.21714/1984-3925_2017v20n3a8
______________________________________________________________________________
Contabilidade, Gestão e Governança - Brasília · v. 20 · n. 3 · p. 463-482 · set /dez. 2017
463
Capital Structure Analysis of EBXGroup’s Companies:
Combining Theory and Practice
Análise da Estrutura de Capital das Empresas do
GrupoEBX: Unindo Teoria e Prática
Matheus da Costa Gomes1, Vinícius Medeiros Magnani
2, Mauricio Ribeiro
do Valle3
RESUMO
De acordo com a teoria de market timing, as companhias tendem a emitir ações ou dívidas de
modo a explorar janelas de oportunidade, e esse comportamento é um determinante
significativo da estrutura de capital das empresas. Com base nessa assertiva e nas evidências
recentes encontradas no mercado brasileiro, este trabalho tem por objetivo analisar o
comportamento de market timing de seis empresas do Grupo EBX (MPX, MMX, OGX, LLX,
OSX e CCX), com ações cotadas na BM&FBovespa, até meados de 2013. Para tanto,
utilizou-se a metodologia de estudo de caso e, como principais fontes de evidências,
indicadores relacionados à estrutura de capital e ao mercado de ações. Foi inserida, também,
uma abordagem econométrica utilizando-se o estimador de efeitos fixos para dados em
painéis. Os resultados encontrados apontam que as decisões financeiras tomadas pelos
gestores das empresas do Grupo EBX indicam tentativas de explorar janelas de oportunidades
relacionadas, sobretudo, ao mercado de ações, mensuradas tanto pelo price-to-earnings (PE)
de Shiller, um índice agregado de mercado, quanto pelo índice market-to-book (M/B) de cada
empresa analisada. Este trabalho contribui para a discussão sobre market timing no Brasil, ao
unir teoria e prática, de maneira intuitiva e dinâmica, trazendo aspectos relativos às empresas
e às condições de mercado.
Palavras-chave: Estrutura de capital; Grupo EBX; Market timing; Janelas de oportunidade.
1 Mestre em Controladoria e Contabilidade pela Faculdade de Economia, Administração e Contabilidade de
Ribeirão Preto (FEA-RP) da Universidade de São Paulo – USP, São Paulo, (Brasil). E-mail:
2 Doutorando do Programa de Pós-Gradução em Controladoria e Contabilidade (PPGCC) da FEA-RP – USP,
São Paulo, (Brasil). E-mail: [email protected]
3 Graduado em Ciências Econômicas pela Universidade Estadual Paulista Júlio de Mesquita Filho – UNESP, São
Paulo, (Brasil). E-mail: [email protected]

Capital Structure Analysis of EBXGroup’s Companies: Combining Theory and Practice
______________________________________________________________________________
Contabilidade, Gestão e Governança - Brasília · v. 20 · n. 3 · p. 463-482 · set /dez. 2017
464
ABSTRACT
According to market timing theory, companies tend to issue stocks or debts to take advantage
of opportunity windows, and this behavior is a significant determinant in company capital
structure. Based on this assertion and on recent evidence found on the Brazilian market, this
paper seeks to analyze the market timing behavior of the six publicly-traded companies of the
EBX Group (MPX, MMX, OGX, LLX, OSX and CCX), up to mid-2013. For this purpose, the
methodology used was that of a case study and as the main source of data, the indicators
related to capital structure and the stock market. An econometric approach using a fixed
effects estimator for panel data was also inserted. The results show that the financial
decisions made by managers in the EBX Group indicate attempts to exploit the opportunity
windows related to the stock market, mainly measured by Sheller’s price-to-earnings ratio
(Sheller PE), an aggregate market index, as well as the market-to-book ratio(M/B) of each
company analyzed. This paper contributes to the discussion about market timing in Brazil,
combining theory and practice in an intuitive and dynamic way, as well as brings aspects
related to companies and market conditions.
Keywords: Capital structure; EBX Group; Market timing; Opportunity windows.
1 INTRODUCTION
According to market timing theory, firms’ capital structure is a consequence of attempts
to issue securities (stocks or debts) at times deemed appropriate for issuing (Baker & Wurgler,
2002). In this theory, companies prefer debts when stock prices are overvalued by the market.
International evidence indicates that this behavior is an important determinant in financial
decision-making and companies’ capital structure (Ritter, 1991; Baker & Wurgler, 2002; Alti,
2006; Huang, Uchida & Zha, 2016).
In Brazil, authors such as Rossi Junior and Jiménez (2008), Rossi Junior and Marotta
(2010) and Albanez and Lima (2014) have found results indicatingthat Brazilian companies
issue securities in order to exploit temporary “opportunity windows" encouraged by market
timing behavior. However, the findings regarding this phenomenon are contradictory or
mixed. Mendes, Basso and Kayo (2009), and Padilha and Silva (2016) did not find significant
effects of market timing on Brazilian companies’ capital structure.
What is certain is that market timing theory has been providing coherent answers to
questions such as "What drives a company to take resources without having projects to
invest?" or "High values of resources raised in an Initial Public Offering (IPO) in contrast to
negative returns after issuance: a matter of luck or chance? "However, especially in Brazil,
many studies find it difficult to analyze historical series in a low dynamic market, with a low
number of issued shares. Therefore, this paper proposes a different approach. The proposal
here is to analyze a single group of companies, in an intuitive way, in light of market timing
behavior and by using case study methodology.
Case studies fit well into analysis of contemporary events by providing direct, flexible,
broad and systematic observation (Yin, 2010). In the end, an econometric approach is also
used to give more robustness to the analysis. The EBX Group was picked to be the case
studied in this paper, through its six companies listed on the São Paulo Stock, Mercantile and
Futures Exchange (BM&FBovespa) until mid-2013: MPX, MMX, OGX, LLX, OSX and

Matheus da Costa Gomes, Vinícius Medeiros Magnani, Mauricio Ribeiro do Valle
______________________________________________________________________________
Contabilidade, Gestão e Governança - Brasília · v. 20 · n. 3 · p. 463-482 · set /dez. 2017
465
CCX. The acronyms MPX, MMX, OGX, LLX, OSX and CCX refer to the companies MPX
Energia S.A., MMX Mineração e Metálicos S.A., OGX Petróleo e Gás Participações S.A.,
LLX Logística S.A., OSX Brasil S.A., and CCX Carvão da Colômbia S.A., respectively.
The interest in studying the EBX Group was due to the high number of events it
presented during the period under analysis, due to its intense relation with the capital market,
which attracted attention among a wide range of economic agents, generating a considerable
amount of information, and because it was one of the main corporate groups operating in
Brazil.
According to data and information taken from the EBX Group's website, up to the year
2000, about U$ 20 billion in value had been created by the group on the mineral market, with
the company's value more than tripling between 1991 and 1996. In the 2000s, the EBX
Group’s companies established a trust relationship with investors and creditors when the
companies started to have their shares traded on the stock exchanges. However, in a short
time, the various positive record numbers gave place to negative record numbers. In the first
quarter of 2013, companies MPX, MMX, OGX, LLX, OSX and CCX reported a loss of R$
1.15 billion, according to data released by Economatica ®. According to the same data
survey, only OGX lost 62.79% of its market value in 2013.
Thus, the objective of this paper is to analyze the evolution of the capital structure in the
EBX Group’s companies in relation to market timing behavior. To this end, the present study
has as a research question: "Are the decisions taken by publicly traded companies of the EBX
Group and related to changes in their capital structure indicative of market timing behavior?
“When answering the research question, this paper contributes in three key respects: (i)
providing a better understanding and applicability of market timing behavior on the Brazilian
market as a determinant in financing decisions and companies’ capital structure; (ii) providing
a systemic and practical view of the main hypotheses of market timing theory when
evaluating EBX Group’s companies; (iii) providing insights and contributions to the
development of the theory, for example by adding to the discussion the Shiller’s price-to-
earnings ratio (Shiller PE)to represent capital market conditions.
This paper differs from others by focusing on a case study, with companies from the
same conglomerate, which despite their specific characteristics, have their financial decisions
centralized by the same holding company - EBX Group. Thus, the market timing theory is
used to understand a set of decisions based on a real case, through the evolution of the
companies’ capital structure in the same economic group. The market timing theory has been
shown as one of the main capital structure theories and is in increasing development,
however, it is not as consolidated in the literature in comparison to more traditional theories
such as trade-off and pecking order.
For a broad and contextual analysis, in addition to variables directly related to the
capital structure such as leverage and the market-to-book ratio, this study proposes the use of
the Sheller PE ratio as an indicator of stock market valuation. The results found by this study
indicate that EBX Group’s companies have made their financing decisions influenced by
attempts to take advantage of the opportunity windows, mainly related to the stock market.
Descriptive and graph analyses proved to be powerful analytical tools, and Sheller PE and
M/B were significant determinants of the analyzed companies’ capital structure.
The paper is organized into six sections. Following this introduction, the second section
contains a literature review. Section 3 presents the methodological aspects and the research
tools used. In section 4, there are the analyses and the results, while in section 5, the
discussion of the results found. Concluding remarks are contained in section 6.The
bibliographical references are presented at the end of the paper.

Capital Structure Analysis of EBXGroup’s Companies: Combining Theory and Practice
______________________________________________________________________________
Contabilidade, Gestão e Governança - Brasília · v. 20 · n. 3 · p. 463-482 · set /dez. 2017
466
2. MARKET TIMING THEORY
Equity market timing or simply market timing is a capital structure theory based on the
opportunistic behavior of corporate managers who tend to issue securities (stocks or debts) at
times considered favorable for issuance. The theory emerged as an alternative to the classical
trade-off and pecking order theories. Alti (2006) considers Taggart’s (1977) paper as the
oldest study on equity market timing. Taggart’s objective (1977) was to test financial-decision
models on the use of the main resources by North American companies between 1957 and
1972. The author notes that companies consider temporary market conditions in their
financing decisions - if stock prices are down (compared to historical market values), it will
choose the issuing of debts in relation to the issuing of shares and vice versa.
Other papers such as those by Jalilvand and Harris (1984), Marsh (1982), and Asquith
and Mullins (1986) used historical stock market values and found evidence pointing to
corporate managers using market timing behavior.
Ritter's (1991) paper examined the long-term performance of 1,526 IPOs (Initial Public
Offerings) conducted in the United States between 1975 and 1984. Unlike Taggart (1977) and
Jalilvand and Harris (1984), for example, the author used stock returns after the issuing of
shares to detect companies' market timing strategies. Ritter (1991) reported that the long-term
return of the shares placed on the market through the 1,526 IPOs was lower than the
benchmark index (NASDAQ and AMEX-NYSE) by about 30% in the three-year period after
the companies become publicly traded. Firms that became public companies in periods of
high volume of IPOs (hot market) and newer companies did worse, performing below
average.
For Ritter (1991), Loughran and Ritter (1995), Rajan and Servaes (1997) and Huang et
al. (2016), companies issue stocks when investors are more optimistic about earnings growth
prospects. Initially, investors pay dearly for stocks, as informational asymmetry dwindles,
stock prices decline. Therefore, the Initial Public Offering (IPO) or Seasoned Equity Offering
(SEO) may be an attempt to seize an opportunity window as a way to reduce the cost of
capital for the issuer, to the detriment of investors' return expectations.
Alti (2006) emphasizes that temporary market conditions have an impact on financing
decisions. The author verified that in periods of high volume of IPOs - companies tend to
issue more shares and reduce leverage more than companies in periods called cold market
(low volume of IPOs), making use of market timing behavior.
One of the most cited evidence in the literature was found through anonymous surveys
conducted in companies in the United States and Canada during 1999. Graham and Harvey
(2001) interviewed 392 CFOs (Chief Financial Officer) and, in the results, two thirds of the
CFOs considered market timing behavior as relevant. In light of this and the other papers
cited, a theory based on market timing behavior was proposed by Baker and Wurgler (2002).
The authors refer to equity market timing as the practice of issuing stocks when their prices
are high and repurchasing them when their prices are low, in relation to their equity values
and their historical market values. The strategy is intended to exploit temporary fluctuations
in the cost of capital relative to the cost of other forms of capital, which is only possible in the
presence of an inefficient market.
Baker and Wurgler (2002) used a sample of 2,289 companies during the period from
1968 to 1999. They adopted the external finance weighted-average market-to-book ratio
(M/Befwa) as a measure of market timing opportunity perceived by managers. In addition, size,
tangibility, profitability and the lagged M/B ratio itself were used as control variables. As a

Matheus da Costa Gomes, Vinícius Medeiros Magnani, Mauricio Ribeiro do Valle
______________________________________________________________________________
Contabilidade, Gestão e Governança - Brasília · v. 20 · n. 3 · p. 463-482 · set /dez. 2017
467
dependent variable, financial leverage measures were used. By means of traditional
regressions in capital structure studies, the authors found a negative and significant
relationship between leverage and M/B, this is because the higher the market-to-book ratio the
higher the issuance of stocks, and therefore the higher the share issuance the lower the
leverage. In addition, through M/Befwa, Baker and Wurgler (2002) found that the impact of
market timing on firms' capital structure persists for at least 10 years.
2.1 Evidence of market timing in Brazil
In Brazil, most of the studies examined the market timing behavior of Brazilian
companies with public traded shares on BM&FBovespa. Rossi Junior and Jiménez (2008)
tested the equity market timing theory on the Brazilian market from 1996 to 2006. Investment
funds were analyzed and an average of 250 companies per quarter was used, all publicly
traded. The results found in the research show that when the equity cost is relatively lower
than the cost of other sources of funds or when the market value of the company is overvalued
in comparison with the equity value, companies issue shares to finance the deficit in funds.
The opposite occurs if the companies present low M/B.
On the other hand, Mendes et al.(2009) adapted the article by Baker and Wurgler (2002)
for the Brazilian market. The authors used data from Brazilian non-financial companies that
carried out IPO during the period from 1996 to 2002. Even if the expected relationship
between leverage and the M/B ratio was found, the drop in the level of leverage to market
value shortly after the IPO contrasts with its growth in the following years, without presenting
the persistence necessary to confirm the theory for the Brazilian market. According to the
authors, in Brazil, the issue of the internal generation of resources and the search for a
constant goal between debt and equity have a greater influence on the decision to "go to the
market" (Mendes et al.2009, p.98).
Minardi and Sanvicente (2009) investigated the determinants of the capital structure
through interviews conducted in 370 Brazilian companies, mainly private and medium-sized
companies. The method used was similar to Graham and Harvey’s (2001) for US and
Canadian companies. The evidence found by the authors did not point in favor of a theory
alone, however, market timing attempts were evidenced by the interviewees.
Using the work of Alti (2006), Rossi Junior and Marotta (2010) analyzed whether the
market timing behavior affects the volume of shares issued in the IPO. The authors created
two samples: one made up of companies that launched IPO in a hot market period and other
comprising IPOs from companies in cold market periods. The results indicate that companies
seek to issue more shares in hot periods than in cold periods because stocks may be
overvalued in the presence of a hot market. It has also been found that companies issuing
shares in hot periods are less profitable, suggesting that underperforming companies take
advantage of windows to raise funds through IPOs at BM&FBovespa.
Further, in also analyzing IPOs of Brazilian companies, between 2001 and 2011,
Albanez and Lima (2014) suggest that Brazilian companies use market timing behavior by
taking advantage of opportunity windows. Firms prefer stocks instead of debt when their
market value is high compared to book values, and this difference decreases after the IPO.
In general, papers on market timing in Brazil points to the use of this practice by
companies on the domestic market (Rossi Junior & Jiménez, 2008; Rossi Junior & Marotta,
2010; Albanez & Lima, 2014). However, other studies raise doubts as to whether this

Capital Structure Analysis of EBXGroup’s Companies: Combining Theory and Practice
______________________________________________________________________________
Contabilidade, Gestão e Governança - Brasília · v. 20 · n. 3 · p. 463-482 · set /dez. 2017
468
behavior is a significant determinant of capital structure in publicly traded Brazilian
companies (Minardi & Sanvicente, 2009; Mendes et al., 2009).
Since the influential article by Baker and Wurgler (2002), many studies have been
published on the subject. The model proposed by Baker and Wurgler (2002) seems to fit in
better with developed markets, whereas in emerging markets there is a need for adjustments
and inclusion of alternative variables to exploit the phenomenon in other ways, adapting it to
the reality of each market (Albanez & Lima, 2014). Therefore, this paper also proposes the
use of Shiller PE as another determinant of leverage along with M/B ratio, in order to also
identify the managers' perception of the overall performance of the Brazilian stock market.
Since the M/B represents the managers' perception of the current market value of a specific
company and is closely linked to the characteristics of the firms, Shiller PE is directly linked
to the market conditions that are important in the market timing analysis.
According to case study methodology, it is expected that this paper will contribute to a
better understanding and applicability of market timing behavior on the Brazilian market and
emerging markets similar to Brazil - capital markets with concentrated stock control, less
protection to shareholders and low degree of enforcement (Botero, Djankov, La Porta, López-
de-Silanes, & Shleifer, 2004; Claessens & Yurtoglu, 2013). In recent years in Brazil, there
have been many opportunity windows related to the capital market, and these have developed
and gained representativeness as a source of financial resources for companies, providing a
favorable scenario for the development of market timing theory (Cooper & Morgan, 2008;
Albanese & Lima, 2014).
3. CASE STUDY METHODOLOGY: MULTIPLE CASES
A case study is a research strategy that investigates an empirical subject following a set
of pre-established procedures –it involves planning that ranges from the definition of the type
of question and the objective of the research to data collection and analysis. Yin (1994)
highlighted five key components of a case study: i) research focus; ii) study propositions; (iii)
analysis units; iv) logical connection of data and propositions; and (v) criteria for interpreting
results.
Briefly, the first component - research focus - refers to the clear definition of the
research question, considering the objective proposed. The second component - study
propositions - is responsible for directing the research in the right direction. Propositions help
in the search for relevant references, and mainly reflect an important theoretical question.
Supported by market timing theory by Baker and Wurgler (2002) and the empirical
evidence found in other studies, this paper uses the relationship between variables as the main
evidence that points to market timing attempts. According to the theory, for example, the
decrease in financial leverage in the years after the IPO may indicate that the primary issuing
of shares was purely opportunistic behavior, that is, the company did not need to raise funds,
but as the cost of capital was undervalued by the market, and it seized the moment. On the
other hand, if the market-to-book ratio declines in the years following the IPO, it may be an
indication that opportunistic behavior was quickly perceived by the market.
The third component - analysis units - defines the case (or multiple cases) to be studied.
The analysis units of this study are the six companies of the EBX Group with shares listed on
BM&FBovespa: MPX, MMX, OGX, LLX, OSX and CCX. The fourth component - logical
connection of data and propositions - expects variables such as leverage, market-to-book and

Matheus da Costa Gomes, Vinícius Medeiros Magnani, Mauricio Ribeiro do Valle
______________________________________________________________________________
Contabilidade, Gestão e Governança - Brasília · v. 20 · n. 3 · p. 463-482 · set /dez. 2017
469
Shiller PE to help explain the evolution of the capital structure of EBX Group’s companies,
respond to the question of study, and achieve the objective proposed. The fifth and final
component of a case study research - criteria for the results interpretation - expects that, after
collecting the data and other pertinent information, the interpretation of the results will be
done in a clear and sufficient way, based on the literature reviewed as well as to comply with
this study’s aim.
The methodological model used by this paper is similar to that proposed by Yin (1994),
for studies of multiple cases. The model begins with the definition and planning of the study,
which is made up of the theoretical development: presentation of previous studies, theory and
theoretical hypotheses. Then, in a more operational process, Yin (2010) suggests that the
cases election and projection of data collection be conducted. It is hoped that, from the
theoretical hypotheses proposed and the data sources defined, it is possible to explore the data
to find evidence that contributes to the research question and to promote relevant
contributions (Cooper & Morgan, 2008).
In multiple-case studies, several individual studies are conducted simultaneously
considering the same criteria for analysis, eventually generating an individual report for each
case with the main analyzes, characteristics and implications. Finally, in the analysis and
conclusion, the results of each case are crossed, looking for a logical sequence of clues, with
the purpose of drawing conclusions about the whole scenario analyzed (Yin, 2010).
3.1 Data sources, constructs, and operational definitions of variables
This paper uses as its main source of data the quarterly financial statements of the
companies analyzed, along with other sources, such as financial and market indicators, in
order to obtain a chain of evidence on the evolution of the capital structure of the publicly
traded companies of the EBX Group in light of market timing behavior.
a) Financial leverage. This paper uses two measures of leverage, one at book value and
another at market value. As the analysis is based on the market, the market value indicator
plays a fundamental role in the evaluation of the analyzed companies’ perception. However, it
is only possible to calculate the market leverage after the company has opened equity on the
stock exchange, so it is necessary to use the book leverage for pre-IPO analysis. The use of
these two measures of leverage also allows the control of possible spurious correlations
between the interpretation of leverage and effective management practices. The two measures
were calculated using the consolidated quarterly data (accounting and market) collected from
the Economatica® database, according to equations (1) and (2).
Lev1 = Financial Debts / Book Value of Assets (1)
Lev2 = Financial Debts / Market Value of Assets (2)
Where: Lev1: Book leverage; Lev2: Market leverage; Financial Debts: Loans, bonds
and financial leasing obligations (short and long term); Market Value of Assets: Assets minus
book value of equity plus market value of shares.
b) Market-to-book (M/B). According to the theory, the market-to-book ratio exerts an
important influence on the companies’ capital structure. It is used as a proxy to measure
managers’ perception in the use of opportunity windows, that is, to verify the existence of this

Capital Structure Analysis of EBXGroup’s Companies: Combining Theory and Practice
______________________________________________________________________________
Contabilidade, Gestão e Governança - Brasília · v. 20 · n. 3 · p. 463-482 · set /dez. 2017
470
behavior. We expect a negative relationship between leverage and M/B, since the market-to-
book ratio affects leverage through net issuing of shares. Therefore, the higher the market-to-
book ratio the greater the net issuing of shares, and therefore the higher the net issuing of
shares, the lower the leverage. The M/B of the six publicly traded companies of the EBX
Group was collected quarterly from the Economatica® database and was calculated according
to equation (3).
M/B = Price per Share / Net Asset Value per Share (3)
c) Shiller PE or CAPE. Shiller's price-to-earnings (Shiller PE) or CAPE ratio
(Cyclically Adjusted Price to Earnings ratio) will also be used as a proxy for market timing, in
addition to the M/B, since it serves as the general indicator of stock market valuation.
The CAPE is calculated by dividing prices per share over their real average earnings
over the last 10 years, all adjusted for inflation, according to equation (4). Campbell and
Shiller’s model predicts below-average returns when the CAPE is above its historical average,
indicating that the market is overvalued, and on the contrary, above-average returns are
expected when the CAPE is below its historical average due to a momentary underestimation
(Campbell & Shiller, 1998).
Used initially to predict stock returns, the CAPE ratio is also useful for checking
whether the stock market is overvalued or undervalued relative to the average historical
earnings per shares. The 10-year adjustment proposed by Campbell and Shiller (1988) is
intended to reduce the distortion of the high and low cycles of stock prices, which show high
volatility.
To identify predicted behaviors in market timing theory, the Shiller PE ratio, which
indicates when the stock market is overvalued or undervalued, can be used. Considering the
"overvalued market" state, lower leverage is expected from publicly traded companies, since
the manager will seize the opportunity to issue shares rather than incur debt. On the contrary,
in the face of an "undervalued market", as evidenced by a Shiller PE below its historical
average, the stock market may not be as attractive to companies and thus, if they make use of
market timing behavior, higher leverage is expected through third-party debt. Therefore, a
negative relationship between CAPE and leverage is expected.
CAPE = Price per Share/ Historical Average of Real Earnings per Share (4)
Besides the graph and descriptive analyses performed, regression models with
unbalanced panel data are used. For this, the Size and Tangibility (Tang) control variables are
inserted in the analysis to reduce the correlation of the error with the interest variable and,
consequently, reduce the stochastic error of the proposed regression model. Size and
tangibility (Tang) were calculated using consolidated quarterly data collected from the
Economatica® database, according to equations (5) and (6).
d) Size. The company size is usually positively related to indebtedness, since larger
companies tend to be more diversified, with a higher reputation and a lower bankruptcy risk,
which consequently favors debt collection (Rajan & Zingales, 1995). At the same time, size
may serve as a proxy for disclosure quality, increasing investor’s interest in the case of
issuing shares, since such shares are more likely to be priced at the time of issuance (Baker &
Wurgler, 2002). Thus, an ambiguous relationship is expected between size and leverage. The
following measure will bemuse:

Matheus da Costa Gomes, Vinícius Medeiros Magnani, Mauricio Ribeiro do Valle
______________________________________________________________________________
Contabilidade, Gestão e Governança - Brasília · v. 20 · n. 3 · p. 463-482 · set /dez. 2017
471
Size = ln (Total Assets) (5)
e) Tangibility. Usually, tangible assets serve as collateral for debts (contracts
covenants), the more tangible assets, the lower the creditor’s risk and the larger the debt tends
to be (Rajan & Zingales, 1995; Albanez, 2015). Therefore, a positive relationship between
tangibility and indebtedness (leverage) is expected. The proxy for Tang that will be used in
this study is:
Tang = Fixed Assets / Total Assets (6)
3.3 Econometric models
Two equations are proposed to verify the relationship of the market-to-book and Shiller
PE with the companies’ capital structure of the EBX Group: equations (7) and (8). The model
is derived from traditional equations in studies on capital structure, where leverage is
explained by the M/B ratio (Baker & Wurgler, 2002; Albanez & Lima, 2014). However,
Shiller PE will also be used as an explanatory variable, as a general indicator of evaluation of
stock market valuation. While the M/B seeks to capture the perception of the manager of a
particular firm before the valuation of the latter on the stock market, the Shiller PE
demonstrates the managers’ global perception.
Keeping the variables M/B and Shiller PE (or CAPE) in the same equation is similar to
what Baker and Wurgler (2002) did, when they maintained the M/B and added the weighted
average of the M/B, justifying that the first is often used as a control variable to capture
growth opportunities. Therefore, both the M/B and the CAPE show possible opportunity
windows on the stock market. The model also has two control variables: company size (Size)
and tangibility (Tang).
( ) ( ) ( ) ( )
(7)
( ) ( ) ( ) ( )
(8)
Where: Lev1: Book leverage; Lev2: Market leverage; M/B: market-to-book ratio;
CAPE: Shiller PE; Size: Company size; Tang: Tangibility.
The data for the regressions were organized in an unbalanced panel and the frequency of
the collected sample is quarterly, totaling 111 observations, beginning and ending according
to Table 1. According to Wooldridge (2006), in the panel data methodology it is necessary to
test the models to determine which approach to follow, the following stand out: pooled, fixed
effects and random effects. Thus, during the research, the tests of Chow, Breusch-Pagan and
Hausman were performed and are presented in Table 3, in section 4.4: Results of econometric
analysis. According to the test statistics, we opted for the fixed effects model approach.

Capital Structure Analysis of EBXGroup’s Companies: Combining Theory and Practice
______________________________________________________________________________
Contabilidade, Gestão e Governança - Brasília · v. 20 · n. 3 · p. 463-482 · set /dez. 2017
472
Table 1 - Sample data
Firms Start End
MPX Mar-2008 Sep-2013
MMX Dec-2006 Sep-2013
OGX Sep-2008 Sep-2013
LLX Dec-2008 Sep-2013
OSX Jun-2010 Sep-2013
CCX Sep-2012 Sep-2013
4 ANALYSES AND RESULTS
4.1 Data analyses
This section starts with Table 2, which shows the variables’ means divided into three
periods, except for CCX, which was divided into two periods due to the small number of
observations of the company. The intention is to show the variables’ behavior at the time of
issuing of shares (Mean I) and after issuing, in the medium/long term, (Mean II and Mean
III). For example, MPX was divided into three periods: in the first, there are data from the
first eight observations (n = 1-8); in the second, the following eight observations (n = 9-
16); and in the third period, the data are from the last eight observations (n = 16-23). Note that
for all periods to have eight observations, the 16th observation appears in both Mean II and
Mean III. A similar method was followed for the other companies analyzed.
As can be seen in Table 2, the book leverage (Lev1) increases after the IPO window, its
Mean II is greater than its Mean I for almost all companies, with the exception of CCX. In the
long term, after the IPO (Mean III), some companies increase even more Lev1 (MPX, LLX,
OSX), while others do not (MMX and OGX). While the market leverage (Lev2), on average,
increases from period to period for all companies in the sample (Mean III>Mean II>Mean I),
except for CCX.
This increase in debt levels is because companies can attract more debt after becoming
publicly traded. Authors such as Taggart (1977), Jalilvand and Harris (1984) and Ritter
(1991) point out that this is mainly due to the decrease in the asymmetry and the expectation
of profit growth for IPO companies.
According to Baker and Wurgler’s (2002) market timing theory, companies
prefer to issue shares if their prices are overvalued by the market. According to Table 2, the
M/B ratio that measures the managers' perception of possible opportunity windows obtained a
higher mean in the period of the IPO (Mean I) in four of the six companies (MMX, LLX,
OSX and CCX). The CAPE variable, which also measures the managers' perception of the
opportunity window in the stock market, always presents a higher value in the Mean I - IPO
period in all companies. That is, on average, CAPE decreases over time (Mean I> Mean II>
Mean III).
The high M/B and CAPE during periods of IPOs (Mean I) suggest that the EBX
Group’s companies issued stocks in times of opportunity windows, either because the
company was overvalued or because the market was heated - hot market. Alti (2006) suggests
that in times of heated stock market, companies tend to make use of market timing behavior to
issue shares.

Matheus da Costa Gomes, Vinícius Medeiros Magnani, Mauricio Ribeiro do Valle
______________________________________________________________________________
Contabilidade, Gestão e Governança - Brasília · v. 20 · n. 3 · p. 463-482 · set /dez. 2017
473
Table 2 shows that, on average, both the Size and Tang variables increased in all
companies (Mean III>Mean II>Mean I), except for CCX. Thus, it is possible to expect a
positive relationship between these two variables and the levels of indebtedness, especially
with Lev2, since debt also increased on average. Thus, Size and Tang would be linked to the
reduction of the bankruptcy risk by providing greater guarantee to the creditor, leading to a
greater power of debt collection, as pointed out by Rajan and Zingales (1995).
Table 2 – Descriptive statistics segregated according to period
Firm Estatistic Lev1 Lev2 M/B CAPE Size Tang
MPX
N=23
Mean I (n = 1-8) 0.25 0.24 1.53 16.15 15.00 0.31
MeanII (n = 9-16) 0.48 0.33 2.86 14.58 15.64 0.58
MeanIII (n = 16-23) 0.65 0.47 2.94 11.04 15.99 0.72
MMX
N=28
MeanI (n = 1-10) 0.35 0.15 4.44 17.68 14.69 0.22
MeanII (n = 10-19) 0.55 0.23 -1.71 15.50 14.82 0.12
MeanIII (n = 19-28) 0.28 0.27 1.22 11.29 15.76 0.34
OGX
N=21
MeanI (n = 1-7) 0.00 0.00 3.70 15.08 16.12 0.00
MeanII (n = 8-14) 0.14 0.04 5.96 14.13 16.27 0.01
MeanIII (n = 15-21) 0.13 0.06 3.61 10.96 16.53 0.48
LLX
N=20
MeanI (n = 1-7) 0.16 0.09 3.90 15.00 14.12 0.36
MeanII (n = 8-14) 0.33 0.17 3.70 13.83 14.50 0.52
MeanIII (n = 14-20) 0.54 0.46 1.81 10.96 15.00 0.56
OSX
N=14
MeanI (n = 1-5) 0.22 0.11 2.34 15.26 15.01 0.31
MeanII (n = 6-10) 0.40 0.36 1.36 11.57 15.55 0.66
MeanIII (n = 10-14) 0.53 0.64 0.56 10.56 16.08 0.82
CCX N=5
MeanI (n = 1-3) 0.29 0.37 0.70 11.12 13.90 0.54
MeanII (n = 3-5) 0.19 0.35 0.47 10.04 13.74 0.43
4.2 Capital structure ofEBXGroup’s companies: leverage and M/B
This section analyzes the evolution of the capital structure of the EBX Group’s
companies based mostly on their leverage ratios (Lev1 and Lev2) and market-to-
book (M/B). For this, Figure 1 illustrates the behavior of these variables for each company in
the sample. The IPO period is highlighted because it represents the main point of reference for
the analysis. In the cases of LLX and CCX, the starting point of the analysis is the spinoff of
the companies that gave rise to them.
It begins with the analysis of MPX. Prior to the IPO date, MPX's liability was formed
almost entirely from short-term debt. The consolidated financial statements as of December
31st, 2007 show that out of MPX's total liabilities: 99% were current liabilities and only 1%,
non-current liabilities. After the IPO, according to Figure 1 (a), MPX increased its means
levels of indebtedness (Lev1 and Lev2), stimulated by long-term debt. Since the company is
in the expansion process, according to the literature, it is able to attract more debt because its
shares are traded on the stock market due to the decrease in informational asymmetry
(Taggart, 1977; Ritter, 1991).
It should be noted that MPX presented a reduction of the M/B ratio after the IPO
(Figure 1 (a)). This reduction was significant when compared to the M/B of Dec-07 (3.8) with
the M/B of Dec-08 (0.50). The drop in the M/B ratio may indicate a reduction in investors'
expectations about the company's future after the IPO. As of Dec-08, the market value of
MPX began to increase progressively, except for some periods with a small decline, reaching
its apex in March-12, when the M/B reached the mark of 5.5. It is noteworthy that in March-

Capital Structure Analysis of EBXGroup’s Companies: Combining Theory and Practice
______________________________________________________________________________
Contabilidade, Gestão e Governança - Brasília · v. 20 · n. 3 · p. 463-482 · set /dez. 2017
474
12 there was a partial spin-off of MPX with the creation of the CCX and capital restructuring,
a fact that may have influenced the fall of the M/B to 2.2 in June-12. The partial spin-off of
MPX at the moment the M/B reached its apex may be an indication that this moment
presented itself as an opportunity window.
The second company reviewed here is MMX. Figure 1 (b) shows that MMX's market
leverage declined for more than a year after the IPO, from 0.10 in Sep-06 to 0.03 in Jun-
08. However, shortly after this period, levels of indebtedness increased while the partial spin-
off that gave rise to LLX occurred. It stands out in the history of MMX the fact that it
generated many other companies of the EBX Group. Two moments of high financial leverage
(Lev1 and Lev2) of MMX are worth highlighting: between Dec-08 and Dec-09 and from Sep-
12 to Jun-13. The first moment seems more linked to financial restructurings while the second
to the troubled period of the Group, characterized by the expected results that did not
materialize.
Prior to the IPO date, in June 2006, MMX's Owner’s Equity was only 6% in relation to
the company's total assets and its current liabilities were three times higher than non-current
liabilities. Following the issuing of shares, the Owner’s Equity was 65% of the total assets,
evidencing how the IPO funding was representative for MMX. Figure 1 (b) shows the
MMX’s market-to-bookratio increase after the IPO. The M/B reached its record value on Jun-
08, the period prior to the company's spinoffs and restructuring. From Dec-08 to Dec-09,
MMX obtained a negative M/B, that is, the company's Owner’s Equity was negative during
this time interval. This was possibly motivated by the company’s restructuring, which was
mitigated after the capital increase of R$ 1.9 billion in February 2010.
It does not make much sense to analyze a negative M/B, and for that reason, this period
slightly undermines this analysis, after the capital contribution that left the Owner’s Equity
positive, the M/B was above 7 on Mar-10, it did not stay on that plateau for a long time. From
March 2013 to September 2013, the MMX market value was lower than its book value:
positive M/B and less than 1. In light of the changes in MMX's capital structure, the decrease
in Lev2 after the IPO and its own funding through the issuing of shares, the high negative
correlation between M/B and Lev2 stands out; the market timing theory may be evidence of
the existence of opportunistic gains in switching between stocks and debts (Baker & Wurgler,
2002).
LLX, the third company analyzed in this section, came into existence on Sep-08 and
does not present a measure of accounting leverage (Lev1) before this period (Figure 1 (d)). It
should be emphasized that the company did not present a significant increase in Lev1 and
Lev2 in the short term. Leverage started a significant upswing only after March 2011, when in
June 2013, the company's liabilities were more than half of the asset's market value. The non-
increase in debt after the IPO may indicate that share issuing was motivated by opportunistic
behavior - the company did not need to raise funds, but since the cost of capital was
undervalued by the market, it seized the moment (Ritter, 1991; Baker & Wurgler,
2002). Since the LLX’s M/B ratio, which increased well sharply and reached its highest mark
in Dec-09, it moved towards the value that equals M and B, that is, when the market-to-
book ratio is equal to 1, thus indicating the company’s significant loss of market value in just
over three years.
The fourth company analyzed has its indexes shown in Figure 1 (e), OSX performed
IPO in the first quarter of 2010, when it rose four times higher the amount than the total
assets’ book value in December 2009. For this reason, the Owner’s Equity was 76% of the
company's assets after the IPO, before the issue was only 4% of the assets.
Matheus da Costa Gomes, Vinícius Medeiros Magnani, Mauricio Ribeiro do Valle
______________________________________________________________________________
Contabilidade, Gestão e Governança - Brasília · v. 20 · n. 3 · p. 463-482 · set /dez. 2017
475
On Dec-09, for each R$ 1.00 of OSX's assets there was almost R$ 0.94 of onerous
liabilities. As equity represented 4% of total assets, the liability was formed almost entirely
from financing and short-term loans, a scenario that remained in the periods following the
IPO. OSX stands out for having the highest indebtedness index among the companies
analyzed in this paper. Regarding the M/B ratio, its apex was reached with the initial shares,
after which, except for a few quarters of a small increase in the index, the M/B decreased
quarter by quarter, closer and closer to zero. In the last two quarters of analysis, the OSX’s
M/B was 0.1, when the market value of the company corresponded to 10% of its book value.
This value loss in the last periods analyzed occurred in all publicly traded
companies in the EBX Group, mainly due to the crisis in investors’ confidence with the
front conglomerate to the detriment of the business enterprises’ return expectations. For
information, companies MPX, MMX, OGX, LLX, OSX and CCX recorded a loss of R$ 1.15
billion in the first quarter of 2013, according to data released by consultancy Economatica®.
The verticalization of the EBX Group's business followed the rule of creating as many
companies as needed to meet products and service demands from both the market and the
conglomerate's own companies. As investors are more optimistic about the potential for
earnings growth of young companies, the IPO can be an attempt to take advantage of the
reduced cost of capital before investors’ great expectations (Ritter, 1991).
It was decided to analyze OGX and CCX lastly due to certain peculiarities that they
present. OGX (Figure 1 (c)) was created in April 2006 after a partial spin-off from MMX. Its
primary share issuing raised R$ 6.7 billion, a record number on the Brazilian capital market at
that time. There is no leverage (Lev1 and Lev2) during almost the entire OGX analysis
period, according to Figure 1 (c). This implies that the company did not make use of third-
party resources with a burden, except for some quarters of 2011 and 2012. Remembering that
leverage considers only onerous liabilities: short- and long-term financing and debentures. In
OGX’s case, other liabilities increased substantially over the years after share issuing, as is
the case with the "Suppliers" account. OGX's period of positive leverage is related to the
issuance of debt securities abroad.
OGX spent much of its life in the pre-operational phase. The first drilling of an oil well
took place only in September 2009, while oil production only occurred in 2012. Even if the
company did not produce anything at the time of the IPO, OGX had a portfolio made up high
potential diversified blocks and therefore investors' major expectations reflected in the record
amount of IPO funding.
The drop in the OGX’s M/B ratio after the primary share issue was for only one
period. OGX’s shares appreciated approximately 500% from Jun-08 to Sep-10 of the IPO at
the apex of the M/B. The fact is that at the end of June 2012, expectations began to decrease
due to the company's lower-than-expected production and in a short time OGX came to
surround another historical record at the time, this time a negative mark, to be the first
company belonging to the São Paulo Stock Exchange Index (IBovespa) to file for bankruptcy.
OGX alone lost 62.79% of its market value in 2013, according to the Economatica®
survey. In June 2014, the company's judicial reorganization plan was approved, which also
changed its name.
To finalize this individual analysis of the companies and to outline the behavior of the
conglomerate, the CCX is analyzed. CCX presents the shortest period when compared to the
other companies in the sample; it corresponds to almost two years, since the company only
started to have stock on the stock market after the partial spin-off from MPX (Figure 1 (f)). It
is notable that CCX was created at the apex of the MPX’s M/B ratio. From the viewpoint
of market timing behavior, this could have been presented as an opportunity window (Rossi

Capital Structure Analysis of EBXGroup’s Companies: Combining Theory and Practice
______________________________________________________________________________
Contabilidade, Gestão e Governança - Brasília · v. 20 · n. 3 · p. 463-482 · set /dez. 2017
476
Junior & Jiménez, 2008). Because it offers few periods and data for analysis,
CCX’sassessment is more punctual and difficult, since it is difficult to find trends in the
variables over the short period.
Figure 1 – Evolution of Leverage (Lev1 and Lev2) and market-to-book (M/B) of the EBX Group’s
companies
4.3 Historical Shiller PE onthe Brazilian stock market
Shiller PE is an indicator used to assess whether the stock market is overvalued or
undervalued. Given the difficulty to analyze whether the IPO happened at an opportune
moment considering the histories of the companies analyzed, since market values are only
possible after the IPO, it is intended to check here if the IPO occurred at an opportune time for
the Brazilian stock market. In light of this, Shiller PE is interesting because it allows you to
compare each specific IPO with stock market valuation at the same time.
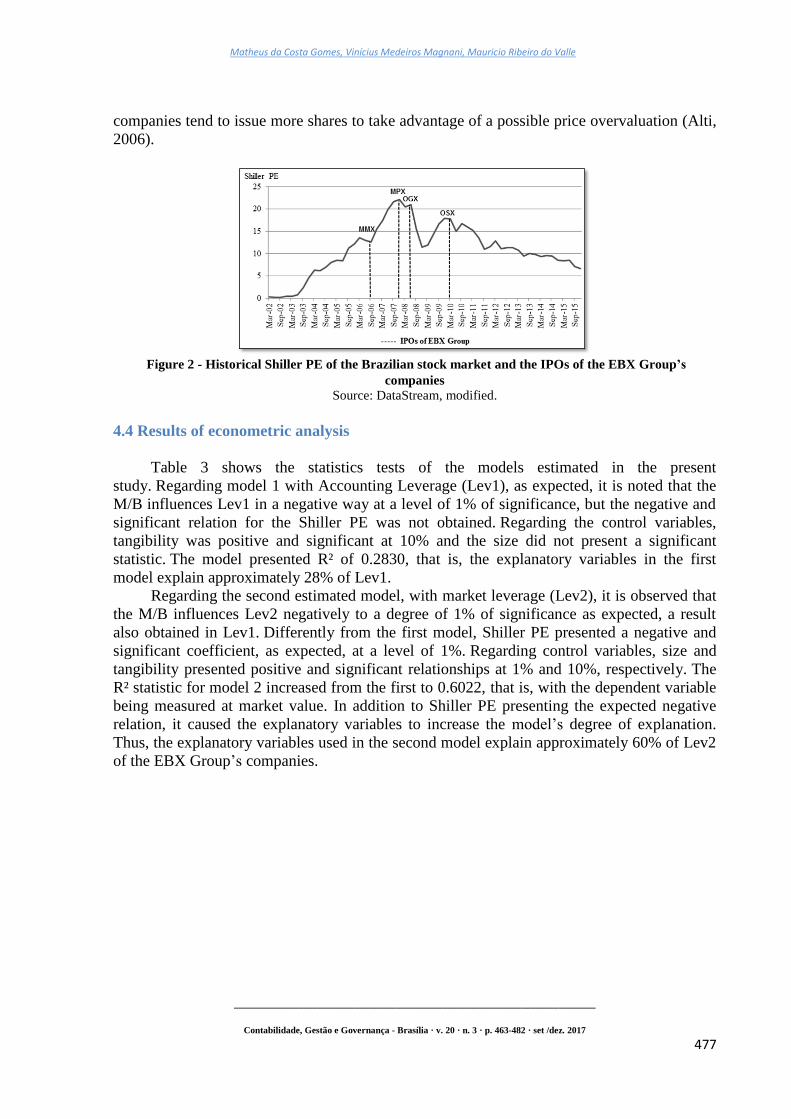
For this, Figure 2 illustrates the evolution of Shiller PE’s history onthe stock market,
brought by Klement (2012), and based on the methodology proposed by Campbell and Shiller
(1988). The effects of the 2008 financial crisis that negatively impacted the BM&FBovespa
are shown in Figure 2. Nevertheless, the EBX Group companies’ IPO were carried out at
times of "hot market" on the Brazilian market, evidenced by the Shiller PE above historic
average, especially MPX and OGX’s IPOs since the beginning of 2008 corresponds to the
indicator’s period more "above average", noting that, according to the theory, in hot periods
a) MPX b) MMX
c) OGX d) LLX
e) OSX f) CCX
Matheus da Costa Gomes, Vinícius Medeiros Magnani, Mauricio Ribeiro do Valle
______________________________________________________________________________
Contabilidade, Gestão e Governança - Brasília · v. 20 · n. 3 · p. 463-482 · set /dez. 2017
477
companies tend to issue more shares to take advantage of a possible price overvaluation (Alti,
2006).
Figure 2 - Historical Shiller PE of the Brazilian stock market and the IPOs of the EBX Group’s
companies
Source: DataStream, modified.
4.4 Results of econometric analysis
Table 3 shows the statistics tests of the models estimated in the present
study. Regarding model 1 with Accounting Leverage (Lev1), as expected, it is noted that the
M/B influences Lev1 in a negative way at a level of 1% of significance, but the negative and
significant relation for the Shiller PE was not obtained. Regarding the control variables,
tangibility was positive and significant at 10% and the size did not present a significant
statistic. The model presented R² of 0.2830, that is, the explanatory variables in the first
model explain approximately 28% of Lev1.
Regarding the second estimated model, with market leverage (Lev2), it is observed that
the M/B influences Lev2 negatively to a degree of 1% of significance as expected, a result
also obtained in Lev1. Differently from the first model, Shiller PE presented a negative and
significant coefficient, as expected, at a level of 1%. Regarding control variables, size and
tangibility presented positive and significant relationships at 1% and 10%, respectively. The
R² statistic for model 2 increased from the first to 0.6022, that is, with the dependent variable
being measured at market value. In addition to Shiller PE presenting the expected negative
relation, it caused the explanatory variables to increase the model’s degree of explanation.
Thus, the explanatory variables used in the second model explain approximately 60% of Lev2
of the EBX Group’s companies.

Capital Structure Analysis of EBXGroup’s Companies: Combining Theory and Practice
______________________________________________________________________________
Contabilidade, Gestão e Governança - Brasília · v. 20 · n. 3 · p. 463-482 · set /dez. 2017
478
Table 3 – Regression and tests results: model 1 and 2
Dependentvariables Model 1 Model 2
Book Leverage (Lev1) Market Leverage (Lev2)
Coef. statistic-t p-value Coef. statistic-t p-value
Explanatoryvariables
Constant -0.9866 -1.18 0.2422 -1.5216 -2.86 0.0052***
Market-to-book (M/B) -0.0167 -3.87 0.0002*** -0.0102 -3.74 0.0003***
Shiller PE (CAPE) -0.0007 -0.09 0.9305 -0.0130 -2.71 0.0079***
Size 0.0845 1.62 0.1081 0.1244 3.76 0.0003***
Tangibility (Tang) 0.1840 1.75 0.0824* 0.1476 2.22 0.0289**
N 111 111
Prob> F: 0.0000*** 0.0000***
R²: 0.2830 0.6022
Chow Test
F(5): 7.32 10.85
Prob> F: 0.0000*** 0.0000***
Breusch-Pagan Test
Chi²(5): 0.00 23.37
Prob> Chi²: 1.0000 0.0000***
Hausman Test
Chi²(3): 28.08 25.12
Prob> Chi²: 0.0000*** 0.0000***
Rejection of the null hypotheses: ***significance level 1%; **significance level 5%; *significance level 10%.
5. DISCUSSION OF RESULTS
In general, EBX Group’s companies increased their indebtedness levels, indicating
expansion of activities through new investments. It should be noted that the verticalization of
the conglomerate's business followed the rule of creating how many companies were needed
to meet the demands of the first companies' products and services and so on (Moraes,
2013). This strategy, initially assumed by the group, coupled with the euphoria of analysts
and investors, has led to record fund raising on the stock market. Increased debt collection
over time and the high M/B incurred by companies at first may indicate relatively low funding
costs (Taggart, 1977; Jalilvand & Harris, 1984; Ritter, 1991).
The fall of the M/B ratio after the IPO of five of the six companies provides evidence
that they sought funds on the capital market when they were overvalued, corroborating the
chances of market timing. Some even saw their market value rise in the medium term, driven
by new expectations, often through the publication of a "Relevant Fact" to the market,
common among the group companies. However, others such as OSX and CCX obtained their
highest M/B at the time of the IPO. The vertical chain originally intended for the companies
of the EBX Group was not solid in the medium/long term. The capital structure of the group's
companies appeared to be guided by market timing behavior.
As in research from Baker and Wurgler (2002) and Albanez and Lima (2014), the
estimated models contribute to explain the levels of leverage mainly to market leverage and
the results found point to the negatively related leverage with M/B, while the graph analysis
points to a positive relationship between market-to-book ratio and share issuing, since share
issuing was made when the M/B was high in most cases. This negative relation between M/B
and market leverage, in the presence of an imperfect market, allowed for the existence of
gains by switching between stocks and debt, according to evidence in favor of the present

Matheus da Costa Gomes, Vinícius Medeiros Magnani, Mauricio Ribeiro do Valle
______________________________________________________________________________
Contabilidade, Gestão e Governança - Brasília · v. 20 · n. 3 · p. 463-482 · set /dez. 2017
479
theory (Baker & Wurgler, 2002; Alti, 2006; Rossi Junior & Marotta, 2010; Albanez & Lima,
2014).
It can be reiterated that the inclusion of the Shiller PE ratio as another proxy for
managers’ perception of the stock market opportunity windows generated the hypothesis that
managers not only analyze the M/B of the company, but also analyze a general indicator of
stock market valuation. Thus, the Shiller PE variable contributes to the analysis proposed by
this paper to corroborate the main assumptions of market timing theory in a more holistic
analysis. As expected, the results indicate that in times of high M/B and Shiller PE,
companies use less debt financing, preferring to raise funds on the stock market, which may
represent opportunistic behavior in fundraising. In general, Figure 1 and Figure 2 illustrate the
results found in the econometric analysis.
It should be emphasized that the results obtained in this study are due to a series of
hypotheses and criteria adopted, which might bring some limitations despite the benefits such
criteria have brought to the discussion. The main limitations are the lack of leverage and
operating profits of some companies, as well as the negative M/B ratio presented by MMX,
slightly hampering the search for evidence of market timing behaviors. As the study’s
proposal was to perform an analysis guided only by market timing theory, other theories and
approaches that could also explain the financial decisions and the capital structure of the
companies in the sample were not addressed, another important limitation to this paper.
Furthermore, adding factors such as illegal practices, such as corruption and earnings
manipulation, which were not incorporated in the research due to the difficulty of
measurement, could also enhance the results and conclusions found here.
In conclusion, despite the small sample, limited to a case study, this research contributes
to the understanding and development of market timing theory, mainly for the practical
implications of this theoretical approach.
6. FINAL CONSIDERATIONS
This paper investigated the evolution of the EBX Group’s capital structure, with shares
listed on the BM&FBovespa by 2013, considering the market timing theory and market
timing behavior. Among the methodological models used by this research are: the one
proposed by Yin (1994) for case studies and an econometric model.
It was verified that most of the companies analyzed showed an increase in debt levels
after the insertion of their shares in the capital market, due to the greater debt offer that public
companies can attract because they have less information asymmetry. On the one hand,
leverage rose, on the other hand, the fall in the M/B ratio after the IPO of five of the six
companies indicated that the market overestimated their value, so that they raised funds with
an undervalued cost of equity capital. It should be emphasized that the leverage and M/B have
proved to be powerful tools in capital structure analysis. In addition, the Shiller PE pointed
out that the EBX Group’s companies’ IPO were carried out at times when the index was
above the historical average, in times of hot market, which encourage them to issue more
shares than in periods of cold market. Good prospects for the future of the country and
companies may have contributed to many economic agents being convinced of the
conglomerate's potential.
This paper concluded that market conditions were decisive in the composition of the
capital structure of the analyzed companies, that is, the financial decisions made by the
Capital Structure Analysis of EBXGroup’s Companies: Combining Theory and Practice
______________________________________________________________________________
Contabilidade, Gestão e Governança - Brasília · v. 20 · n. 3 · p. 463-482 · set /dez. 2017
480
managers were motivated by attempts to explore temporary market windows, measured both
by Shiller PE, the aggregate market index, as well as by the M/B of the companies.
Finally, since this study did not examine the success or failure of the EBX Group’s
market timing, nor quantified the time effect that this practice had on the group’s companies’
capital structure, such complementary analyses are recommended by way of suggestions for
future research. In trying to isolate as much as possible the effects that market timing behavior
has on financial decisions, capital structure is a major challenge for researchers. Other
variables such as average market profitability and abnormal stock returns can be incorporated
in future research, as well as different companies in other scenarios, to perform comparative
analyses.
REFERENCES
Albanez, T. (2015). Impact of the cost of capital on the financing decisions of Brazilian
companies.International Journal of Managerial Finance, 11(3), 285-307.
Albanez, T., & Lima, G. A. S. F. (2014). Effects of market timing on the capital structure of
Brazilian firms. International Finance Review, 15, 307-351.
Alti, A. (2006). How persistent is the impact of market timing on capital structure? The
Journal of Finance, 61, 1681-1710.
Asquith, P., & Mullins, D. W. (1986). Equity issues and offering dilution. Journal of
Financial Economics, 15(1), 61-89.
Baker, M., & Wurgler, J. (2002).Market timing and capital structure. The Journal of Finance,
57(1), 1-32.
Botero, J. C., Djankov, S.; La Porta, R.; López-de-Silanes, F.; & Shleifer, A. (2004). The
regulation of labor. Quarterly Journal of Economics, 119(4), 1339-1382.
Campbell, J. Y., & Shiller, R. J. (1988). The dividend price ratio and expectations of future
dividens and discount factors. Review of Sinancial studies, 1(3), 195-228.
Campbell, J. Y., & Shiller, R. J. (1998). Valuation Ratios and the Long-Run Stock Market
Outlook. Journal of Portfolio Management, 24(2), 11-26.
Claessens, S., & Yurtoglu, B. B. (2013). Corporate governance in emerging markets: A
survey. Emerging Markets Review, 15, 1-33.
Cooper, D. J., & Morgan, W. (2008). Case study research in accounting. Accounting
Horizons, 22(2), 159-178.
Graham, J. R., & Harvey, C. R. (2001). The theory and practice of corporate finance:
evidence from the field. Journal of Financial Economics, 60(2-3), 187-243.

Matheus da Costa Gomes, Vinícius Medeiros Magnani, Mauricio Ribeiro do Valle
______________________________________________________________________________
Contabilidade, Gestão e Governança - Brasília · v. 20 · n. 3 · p. 463-482 · set /dez. 2017
481
Huang, Y., Uchida, K., & Zha, D. (2016). Market timing of seasoned equity offerings with
long regulative process. Journal of Corporate Finance, 39, 278-294.
Jalilvand, A., & Harris, R. S. (1984).Corporate behavior in adjusting to capital structure and
dividend targets: an econometric study. The Journal of Finance, 39(1), 127-145.
Klement, J. (2012). Does the Shiller-PE Work in Emerging Markets ? Working
Paper.Available at: http://www.ssrn.com/abstract=2088140. Accessed on: Apr. 2016.
Loughran, T., & Ritter, J. R. (1995). The new issues puzzle. The Journal of Finance, 50, 23-
52.
Marsh, P. (1982). The Choice between Equity and Debt: An Empirical Study. The Journal of
Finance, 37(1), 121-144.
Mendes, E. A., Basso, L. F. C., & Kayo, E. K. (2009).Estrutura de capital e janelas de
oportunidade: testes no mercado brasileiro. Revista de Administração Mackenzie –
RAM,10(6), 78-100.
Minardi, A. M. A. F., & Sanvicente, A. Z. (2009). Decisão sobre estrutura de capital de
empresas brasileiras. Paper presented at the XXXIII Encontro Nacional da Associação
Nacional dos Programas de Pós-Graduação em Administração – EnANPAD, São Paulo,
Brasil.
Moraes, R. (2013). O surgimento da holding EBX, a relação imbricada entre as empresas X,
seus problemas e o "novo" interesse dos EUA. Sep. 2013. Available at:
http://www.robertomoraes.com.br/2013/09/o-surgimento-da-holding-ebx-relacao.html.
Accessed on: Mar. 2014.
Padilha, D. F., & Silva, T. P. (2016). Relação entre o market timing e a estrutura de capital de
empresas de alta tecnologia: um estudo usando a teoria dos jogos. ConTexto, Porto
Alegre, 16(33), 41-57.
Rajan, R., & Servaes, H. (1997).Analyst following of initial public offerings. The Journal of
Finance, 52, 507-529.
Rajan, R., & Zingales, L. (1995). What do we know about capital structure? Some evidence
from the international data. The Journal of Finance, 50, 1421-1460.
Ritter, J. R. (1991). The long-run performance of initial public offerings. The Journal of
Finance, 46(1), 3-27.
Rossi Junior, J. L., & Jiménez, J. I. C. (2008). Testes empíricos sobre market timing na
determinação da estrutura de capital das empresas brasileiras. Paper presented at the
XXXII Encontro Nacional da Associação Nacional dos Programas de Pós-Graduação em
Administração – EnANPAD, Rio de Janeiro, Brasil.
Rossi Junior, J. L., & Marotta, M. (2010). Equity market timing: testando através de IPO no
mercado brasileiro. Revista Brasileira de Finanças, 8, 85-101.

Capital Structure Analysis of EBXGroup’s Companies: Combining Theory and Practice
______________________________________________________________________________
Contabilidade, Gestão e Governança - Brasília · v. 20 · n. 3 · p. 463-482 · set /dez. 2017
482
Taggart, R. A. (1977). A model of corporate financing decisions. The Journal of Finance,
32(5), 1467-1484.
Wooldridge, J. M. (2006). Introdução à econometria: uma abordagem moderna. São Paulo:
Pioneira Thomson Learning.
Yin, R. K.(1994).Case study research: design and methods. (2nd
ed.) Newbury Park: SAGE
Publications, Applied Social Research Methods Series, Thousand Oaks.
______. (2010). Estudo de caso: planejamento e métodos. (4th
ed.) Porto Alegre: Bookman.