
Capital Punishment and the Invisible Black Male...
31
Capital Punishment and the Invisible Black Male Race-of-Victim Effects in US Executions, 1977-2013 Abstract: This paper examines the role of racial bias in the implementation of capital punishment. First, our analysis of existing literature confirms higher rates of capital punishment for those who kill Whites, particularly for Blacks who kill Whites. Second, we compare homicide victim data with a newly collected dataset including information on the victims of every inmate executed in the US since 1976, some 1,369 executions. These data reveal Black males have been the primary victims of homicides, but their killers are much less likely to be put to death. While previous scholars have emphasized the over-representation of killers of White women, we shed additional light on another aspect of the racial and gender biases of the US death penalty. Capital punishment is very rarely used where the victim is a Black male, despite the fact that this is the category most likely to be the victim of homicide. Keywords: Capital punishment; death penalty; race; gender. Word count: 5391 (not counting references or appendices) Revised and resubmitted to Politics, Groups, and Identities, 8 August 2014
Transcript of Capital Punishment and the Invisible Black Male...

Capital Punishment and the Invisible Black Male
Race-of-Victim Effects in US Executions, 1977-2013
Abstract: This paper examines the role of racial bias in the implementation of capital
punishment. First, our analysis of existing literature confirms higher rates of capital punishment
for those who kill Whites, particularly for Blacks who kill Whites. Second, we compare
homicide victim data with a newly collected dataset including information on the victims of
every inmate executed in the US since 1976, some 1,369 executions. These data reveal Black
males have been the primary victims of homicides, but their killers are much less likely to be put
to death. While previous scholars have emphasized the over-representation of killers of White
women, we shed additional light on another aspect of the racial and gender biases of the US
death penalty. Capital punishment is very rarely used where the victim is a Black male, despite
the fact that this is the category most likely to be the victim of homicide.
Keywords: Capital punishment; death penalty; race; gender.
Word count: 5391 (not counting references or appendices)
Revised and resubmitted to Politics, Groups, and Identities, 8 August 2014

1
Capital Punishment and the Invisible Black Male
Race-of-Victim Effects in US Executions, 1977-2013
The US routinely experiences over 10,000 homicides in a single year but in the modern period
(post-1976) has never executed as many as 100 individuals; death is not and never has been the
likely consequence for murder. In spite of the low rates of usage of capital punishment, its
symbolic and emotional power are immense. In this article, we focus on one particular element
of that power: the great odds against being executed if one’s victim is a Black male. Black men,
especially among the relatively young, have a statistical risk of homicide victimization many
times higher than any other racial or gender group, but their killers rarely face the death penalty.
We explore the extent of these discrepancies here first by reviewing the literature and second by
presenting the results of a newly collected database of all US executions from 1976 through
2013.
The single most reliable predictor of whether a defendant in the United States will be
executed is the race of the victim. Blacks make up about half of the total homicide victims in the
US though they represent only about 12 percent of the population. Yet, among convicted
murderers who have been executed, only 15 percent of victims have been Black. A substantial
body of academic research has confirmed a persistent racial bias in death sentencing in favor of
White victims. Further, research suggests that among defendants charged with killing White
victims, Blacks are more likely than Whites to receive a death sentence. Just 7% of executions
for interracial murders involve White killers with nonwhite victims (Death Penalty Information
Center, 2014). One statistic is particularly stark: Since the reinstatement of capital punishment
in 1976 through the end of 2013, 1,359 inmates were executed. Among this group were 534
White inmates executed for killing a single victim. Just nine of that group of 534 had a Black

2
male victim.1 Including killers with multiple victims, just 16 Whites executed had a Black male
victim (these 16 cases are listed in Appendix B). It has long been widely known that racial
disparities affect criminal justice, of course. Academics and activists have for years argued that
the judicial system places more values on the lives of Whites, resulting in disproportionately
harsh treatment of Black criminals who have White victims (ACLU, 2007; NAACP, 2013;
Baldus, Pulaski, & Woodworth, 1983). Our goal in this paper is to draw attention to the scope of
existing disparities in treatment, and in particular to focus on a group which is nearly invisible in
this system: Black male victims.
Our work offers new evidence in efforts to document racial bias in the implementation of
capital punishment, providing both a systematic review of existing literature and a new,
comprehensive review of all 1,359 executions in the modern era. We would certainly expect to
uncover patterns in the direction of what we observe, given the robust literature documenting
bias in capital punishment. However, the scope of the disparity identified is greater than even the
existing body of scholarship would lead one to expect. In addition, our findings are not based on
a sample or an estimate; they are the product of a complete list of every execution in the modern
area and detailed information about each victim. The thorough nature of our evidence allows us
to make substantial conclusions about the state of capital punishment in the United States; it is
clearly a racial project, and a highly gendered one as well.
The Influence of Victim Race in Capital Sentencing
Of course, suggesting that the race of the victim has an impact on the likelihood of a death
sentence is hardly new. It is one of the most consistent findings in all empirical legal scholarship
relating to capital punishment. The landmark work on the influence of victim race in death
1 Eight had Black female victims.

3
penalty sentencing was conducted by David Baldus, Charles Pulaski and George Woodworth
(1983). Their work examined over 2,000 murders in Georgia, controlling for over 230 variables.
It found that those accused of killing White victims were four times as likely to be sentenced to
death as those accused of killing Black victims (Baldus, Pulaski, & Woodworth, 1983).2
Research has continued on this topic apace, and by 1990 the federal Government Accounting
Office had issued a report reviewing the substantial body of scholarship on racial bias in capital
punishment. According to the GAO, 82% of studies found that those who murdered Whites were
more likely to be sentenced to death than those who murdered Blacks (GAO, 1990).
In the years following the GAO report, academic research has continued to demonstrate
that victim race is a strong determinant of whether defendants are sentenced to death, and done
so with increasingly sophisticated methods (Baldus & Woodworth, 2003; Bowers, Pierce, &
McDevitt, 1984; Donohue, 2014; Paternoster & Brame, 2003; Pierce & Radelet, 2005; Radelet,
1989). These more recent works have found that even after controlling for aggravating factors,
defendants with White victims are as much as four times as likely to be sentenced to death than
those with Black victims (Baldus & Woodworth, 2001; Paternoster, Brame, Bacon, & Ditchfield,
2004). Donohue (2014) was particularly complete in assessing the degree of heinousness of the
crimes for all death-eligible homicides in Connecticut. His conclusion was that death sentences
were not reserved for the “worst of the worst”—many not sentenced to death had committed
more heinous or aggravated murders than those sentenced; rather, victim race and geography
were major predictors. Similar disparities have been found across the death penalty states.3
2 It was notably the central evidence presented in the 1987 Supreme Court decision McCleskey v. Kemp, which
alleged widespread racial bias in the implementation of the death penalty in Georgia In the end the Supreme Court
ruled that even strong statistical evidence of racial bias in sentencing did not render the death penalty
unconstitutional. 3 Examinations of capital punishment in Texas have found the death penalty more likely in cases with White victims
after controlling for a large number of potential explanatory values (Bowers, 1984; Ekland-Olson, 1988). Similar
results were found in studies of death penalty sentencing in North Carolina and Florida (Unah, 2011; Zeisel, 1981).

4
Though victim race is the key determinant, certain combinations of victim race and
defendant race can result in even greater bias. Donohue’s study of over 4,600 murders in
Connecticut found that African-American defendants received the death penalty at three times
the rate of White defendants in cases where the victims are White (Donohue, 2014). The race of
a defendant and victim can play a role even after the death sentence has been imposed. Among
those already on death row, minority inmates convicted of killing Whites are more likely to be
executed than any other perpetrators (Jacobs, Qian, Charmichael, & Kent, 2007).
Across recent US history, so few White men being put to death for the murder of Black
men that in some death penalty states such an event has never occurred. In his 1981 study of the
death penalty in Florida, Zeisel found that not only were there no White persons on death row for
killing only a Black person, but that there had “never been such a person on Florida’s death row
in living memory” (Zeisel, 1981). In Texas and Alabama the execution of a White man for the
murder of a Black man has occurred only once in living memory, in both cases within the last
decade. The men executed in those two cases, Lee Taylor and Henry Francis Hays, were both
White supremacists convicted of particularly gruesome and racially motivated murders.4
Meta Analysis of Race-of-Victim Bias
As the preceding review of the literature suggests, race-of-victim bias has been a topic of great
interest to scholars. Consequently there is a rich literature presenting empirical evidence of such
biases across time and death penalty states. To better understand the scope of race-of-victim
effects in capital prosecution and sentencing, we conducted a meta-analysis of existing research.
In North Carolina, the rate of death penalty sentencing for White victim cases was almost twice as high of that of
non-White victim cases between 1993 and 1997. A study of California executions found that those convicted of
killing White victims were 3.7 times as likely to receive a death sentence as those with Black victims (Pierce &
Radelet, 2005). 4 See Appendix B for a list and short description of the cases where a White has been executed for the crime of
killing a Black man.

5
Meta-analysis involves the quantitative synthesis of findings from multiple, independently
conducted studies. Taking the findings of this body of literature as our data, we sought to
determine the scale of race-of-victim biases. In so doing we expand on the work of Baldus and
Woodworth whose 2005 article provides an excellent overview of empirical research on racial
bias in the death penalty, with an emphasis on post 1990 research.
To begin, we produced a comprehensive inventory of the body of research, identifying
236 sources, of which 72 listed empirical estimates. The articles included are empirical analyses
and discussions of race and gender-based discrimination in death penalty prosecution and
sentencing. This review is limited to works from academic journals, governmental studies and
state-commissioned reports.5 The review is also limited to works published after 1972, which
was the year the Supreme Court of the United States decided in Furman v. Georgia that states
had to reevaluate their death penalty statutes to eliminate arbitrariness. Michael Radelet (1989)
has argued that much of the research conducted before the Furman decision failed to consider
important controls, including the effect of prior criminal records and employed methodologies
that have since become outmoded due to their simplicity. The periods under study range from
1972 to 2008 and jurisdictions include the U.S. Armed Forces, Federal Courts and 33 current and
prior death penalty states from all regions of the United States. Notably, the controls used in the
studies under review varied widely.
In every study of racial bias in capital prosecution, prosecutors were more likely to
charge killers of Whites with capital crimes than they were killers of Blacks.6 Studies of bias in
5 We make one exception to this rule, including a piece from the Los Angeles Times, which details the results of a
study commissioned by the newspaper. 6 Thirty studies examined race-of-victim bias in prosecutor’s decisions to charge defendants capitally. In addition,
the literature covered 16 current and past death penalty states including states in the geographic West, South, and
Northeast as well as cases prosecuted within the judicial branch of the US Armed Forces. Studies covered a period
of over 30 years with periods studied ranging from 1976 to 2007.

6
death sentencing (in the penalty phase of a capital trial) covered an even greater range than those
of capital prosecution.7 The vast majority of these studies found that killers of Whites were more
likely than killers of Blacks to receive a death sentence.8 Though existing scholarship would
certainly lead us to expect to find frequent documentation of racial bias, the enormous range of
methods, time frames, geographic foci and control variables used make finding consistent
evidence of anything far more difficult. In light of this, the persistent presence of bias is both
striking and extremely robust.
Figure 1 illustrates the collective findings of all the studies we reviewed. Part A
summarizes the race-of-victim findings for published studies on the prosecutor’s decision to
charge a defendant capitally, and Part B does so for studies looking at sentences of death after a
trial. The bars indicate the number of studies that found each level of bias. A value of 1.00
would indicate that Black and White victims are equally likely to see the crime proceed capitally
(Part A), or lead to a sentence of death (Part B). As Figure 1 makes clear, almost all published
studies find some degree of racial bias, and, for the decision to prosecute, this was unanimous.
Figure 1. Race-of-Victim Effects found in Published Studies
A. Capital Prosecutions B. Death Sentences
7 Researchers collectively examined cases over a period of 35 years, from 1972 to 2008, and from 33 states as well
as cases conducted within the US Armed Forces. 8 Appendix A lists each of the studies reviewed, indicates the geographic scope and time coverage of the study, and
lists the findings.

7
Note: For a list of sources and more details on the findings, see Appendix A.
In the studies summarized in Figure 1A, none found a value below 1.00. That is, each of
the 30 studies identified found that killers of Whites were more likely than killers of Blacks to
face a capital prosecution. These studies cover a wide range of geographic areas and time
periods, and include different sets of statistical controls. In Figure 1B we see almost the same
patern, with some slight differences. Though the vast majority of studies found that killers of
Whites are sentenced to death at higher rates then killers of Blacks, there were cases in which
this was not found.9 Nine studies found a negative effect or no significant effect (ratios below
1.09), and 69 studies found significant and substantial race-of-victim effects. As the captions to
the figures show, the average bias in the charging studies (Part A) was 2.85; in the sentencing
studies (Part B), 6.93. These are very high racial disparities, and as Appendix A makes clear
they have been found in many time periods, geographical areas, and with different statistical
models controlling for legally relevant factors. Note that Part B shows that nine studies where
ratios could not be calculated because no Whites had been sentenced to death for killing Black
victims. Overall, then, our comprehensive review of past studies shows ample evidence of racial
biases in the vast majority of cases. The unique contribution of the current study is to examine
all US executions since 1976. We turn to those findings in the next section.
Methodology
The US has executed 1,359 inmates in the modern period through December 31st 2013. Each of
these executions is the object of considerable public record, and several web sites make available
information about each of them. Most prominent is that of the Death Penalty Information Center
9 One study, in Delaware, found a value of 0.49; a second, from South Carolina, found 0.54; seven studies found
values in the range of 0.93 to 1.09; 60 studies found race-of-victim disparities ranging from 1.19 to 34.1; and nine
studies found an infinite ratio, as there were no death sentences handed down for any killers of Blacks (these are
clustered at a value of 15 in the graph).

8
(DPIC), a Washington-based clearinghouse of information related to the modern death penalty.
Another prominent and near-comprehensive source is the website of the Clark County (IN)
Office of the Prosecuting Attorney. This site, in fact, links to newspaper coverage, legal
documents, and other sources relating especially to the underlying crimes that lead to the death
penalty in each case. Beginning with these two sources, the senior author of this article, working
with a team of research assistants, compiled a database listing the race and gender of each of the
victims of these executions. For cases from 2000 through 2013, the Clark County Prosecutor’s
Office site contains full information; for earlier cases, extensive web and legal database searches
were conducted to ascertain information about the victims, dates of crimes, dates of sentencing,
and country of crime and conviction; this article makes use only of the victim information. With
information about the inmate easily available, and information about the victims now compiled,
our analysis is relatively straightforward; we simply want to know the number of cases with
various combinations of offender-victim race and gender. These can then be compared with US
Department of Justice (Bureau of Justice Statistics – BJS) statistics about homicides overall.10
BJS statistics come from “Homicide Trends in the United States” and are available only through
2005. The time coverage of our execution database is therefore slightly longer than that of
homicides, but we report the full series available. Limiting our execution database to 2005
would show similar results; executions typically follow homicides by more than 10 years in any
case.
10 The usual caveats apply to the use of homicide data reported by the BJS, as it comes from local jurisdictions and
may not always be a full census. However, for homicides, the data are more fully reported than for lesser crimes.
And, most importantly, we are concerned with percentages of victims and offenders of different race and genders.
These percentages may vary somewhat in the real world from those reported by BJS, but as the reader will see, the
differences we report are so large that we are confident they cannot be due to measurement error in the BJS reports.
Further, to the extent that crimes are not closed and therefor offender data is missing, this may be expected
disproportionately to affect Black-on-Black crimes, rather than others. If this were the case, it would make our
findings stronger rather than weaker.

9
It is important to recognize some limitations to our comparisons of execution cases with
all US homicides; the key point is that we do not know which homicides are capital-eligible and
which are not. Here, we follow the examples of Blume et al. (2004) and Fagan et al. (2006), who
looked at particular states (eight states where offender and victim race and gender data were
available for Blume, and Texas in the case of Fagan) and compared death-sentence cases with
homicides more generally. For example, Blume et al. calculated the number of death sentences
per homicide (using the same BJS statistics that we use) and showed these rates per 1,000
homicides: Black Offender-Black Victim, 8.4; White Offender-Black Victim, 19.3; White
Offender-White Victim, 30.1; Black Offender-White Victim, 65.4 (calculated from Blume et al.
2004, 197; note that for Arizona, the comparisons are Minority-Majority rather than Black-
White). Our results are highly consistent and use a similar methodology to those, with these
differences: Blume et al. looked at death sentences where we look at executions; they looked at
just eight states where we look at all US jurisdictions; and they reviewed statistics from 1977
through 2000 and we go through 2013.
Fagan et al. (2006, 1825, Figure 2) compare homicide trends with capital homicide trends
and show that capital homicides represent roughly 15 to 25 percent of all homicides in death
penalty states from 1976 through 2005, or 22 to 28 percent of homicides nationally. The
percentage of homicides eligible for capital prosecution increases slightly over time nationally as
well as in death states. As our interest is in proportions and trends over time, these numbers
suggest that a national analysis based on all homicides will show similar trends as one limited to
death-eligible homicides (since these represent a relatively—though admittedly not perfectly—
constant percentage of all homicides), and to look at national data rather than to limit our
assessment to death-penalty states only (since the trends are highly similar in both).

10
Systematic data on capital-eligible homicides are not available, but the number of capital-
eligible homicides is generally related to the number of homicides more broadly, as Fagan et al.
(2006) demonstrate. Further, a number of carefully controlled studies reviewed above have
looked at individual-level factors including victim and defendant SES, number of victims,
egregiousness of crime and aggravating and mitigating factors statutorily considered in death
penalty sentencing and reached findings broadly similar to our own (Baldus & Woodworth,
2003; Donohue, 2014; Paternoster & Brame, 2003; Pierce & Radelet, 2005).11 And, finally, a
review of the White-on-Black killings that did lead to an execution in Appendix B makes clear,
even to a reader accustomed to the violent nature of capital homicides, that these cases are
indeed particularly heinous.
Results
To begin, we examine overall homicide rates in order to determine how many executions of each
racial combination we would expect in the absence of bias. Using data from the Department of
Justice on all US homicides, available from 1975 through 2005, we find that the vast majority of
homicides are intra-racial (between two people of the same race). As shown in Figure 2, White-
on-White homicide and Black-on-Black homicide each consistently make up over 40 percent of
all homicides. Interracial crimes, White-on-Black and Black-on-White homicides, each make up
less than 10 percent of all homicides.
11 As noted earlier, we expand on these works here both in our use of a new, more comprehensive national data set
of modern-era executions as well as in our focus on bias against Black victims (and in favor of White defendants
with Black victims).

11
Figure 2. Percent of Homicides by Offender-Victim Race.
Source: Bureau of Justice Statistics 2008, 2011.
In the absence of legally permissible factors that are relevant in death sentencing we
would expect that most executions would be the result of White-on-White or Black-on-Black
crime, and that executions for White-on-Black and Black-on-White crime would be infrequent,
and roughly equal to their proportion of all homicides (10 percent). However, literature on race-
of-victim bias suggests that executions for Black-on-White crime will be relatively common
while executions for White-on-Black crime will be rare (see our meta-analysis above). Our
analysis confirms that this is the case, but extends the evidence to a larger historical period, with
greater geographic coverage than has been done before, and shows that the bias is larger than had
been previously estimated. Figure 3 provides a visual representation. The dark bars show the
number of victims of White killers who were later executed; grey bars show the number of
victims of Black killers who were later executed.

12
Figure 3. Race of Victim for Blacks and Whites Executed.
While 17 Whites have been executed for killing a Black, 230 Blacks have been executed
for killing a White. In fact, twice as many Blacks have been executed for killing Whites (230) as
have been executed for killing Blacks (108). This is in spite of the fact that, like for Whites, the
vast majority of all homicides committed by Blacks have a Black victim.12
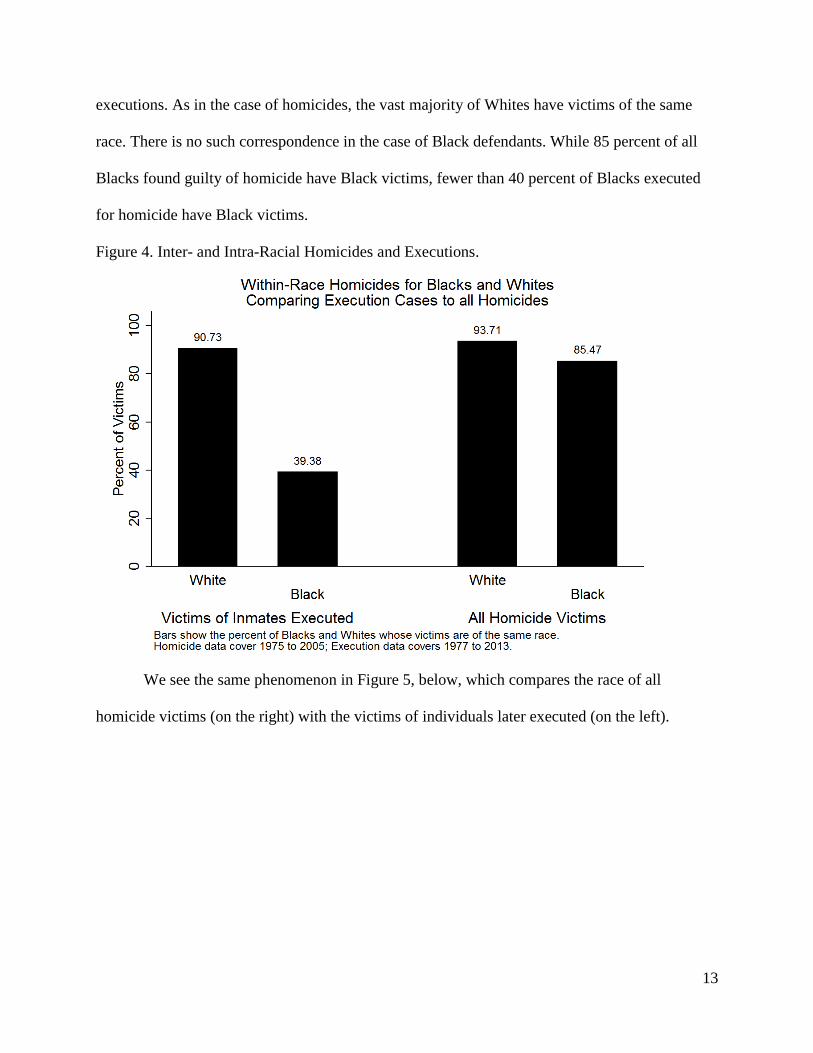
Figure 4 compares execution rates for intra-racial (White-on-White and Black-on-Black)
and inter-racial homicides. Figure 2 showed that the vast majority of homicides occur between
individuals of the same race, and this is reflected in the right-most columns of Figure 4, which
show that 94 and 85 percent, respectively, of Whites and Blacks have victims of the same race.
The left-most columns in Figure 4 show that patterns of intra-racial homicide are not reflected in
12 (Note that our analysis here focuses on those cases where there was only a single victim. Including all 1,359 cases
shows a similar pattern but the results are clouded because many with multiple victims included victims of different
races.) Blume et al. (2004) note that race-of-offender effects often are not found because Black offenders typically
have Black victims, and crimes with Black victims are unlikely to lead to a death sentence. Blacks who kill Whites,
however, are greatly over-represented on death row.
13
executions. As in the case of homicides, the vast majority of Whites have victims of the same
race. There is no such correspondence in the case of Black defendants. While 85 percent of all
Blacks found guilty of homicide have Black victims, fewer than 40 percent of Blacks executed
for homicide have Black victims.
Figure 4. Inter- and Intra-Racial Homicides and Executions.
We see the same phenomenon in Figure 5, below, which compares the race of all
homicide victims (on the right) with the victims of individuals later executed (on the left).

14
Figure 5. Race of Homicide Victims compared to Race of Victims of those Executed.
Figure 5 shows that Blacks make up 47 percent of all homicide victims, but just 17
percent of the victims of those executed. This suggests that Blacks are not only overrepresented
among the executed (as scholars have long argued) but are also vastly underrepresented among
victims of those executed. Analysis of the 2,128 victims of all individuals executed between
1977 and 2013, and all 401,650 homicide victims between 1975 and 2005 reveals that although
Blacks make up almost half (47 percent) of all homicide victims, they represent just a small
proportion (17 percent) of the victims of crime where the perpetrator is later executed by the
state. Conversely, Whites are overrepresented among victims of those executed as compared to
homicides in general. These findings suggest that race-of-victim bias can work not only to
increase the perceived seriousness of crimes against White victims, but also to decrease the
perceived seriousness of crimes against Black victims.
Figure 6 shows the ratio of executions to homicides, by year, for the different
combinations of inmate and victim race. It calculates the ratio of percent of all homicides in a

15
given offender-victim race category to the percentage of execution-related homicides for that
same category. If an equal percentage of homicides led to execution, the ratio would be 1.00.
Numbers below 1.00 indicate that such homicides are relatively unlikely to lead to an execution,
and numbers above 1.00 show where the executions are statistically more likely.
Figure 6. Ratio of Executions to Homicides by Race of Offender and Victim.
The thick Black line in Figure 6 shows that White-on-White crime is consistently treated
in a proportionate manner, with an overall ratio 1.02. For these crimes, roughly the same
percentage lead to execution as not. This is what we would expect in the absence of any kind of
bias for or against victims or perpetrators. In both of the victim/perpetrator combinations with
Black victims, however, overall ratios are well below 1, meaning that killers of Black victims are
substantially less likely than killers of Whites to be executed. Of course, the low odds of
execution are particularly stark in the case of White-on-Black crime, for which the overall ratio

16
is 0.34. In fact, as the thin solid line makes clear, there are many years where this ratio is 0.00:
no Whites were executed killing Blacks in many of the years shown. (A quick perusal of
Appendix B gives a feel, in fact, of just how horrific these crimes need to be in order to lead to
execution.) The dotted line at the top of the graph shows the opposite for Black-on-White crime.
In this case, Black-on-White murders make up a far larger proportion of all executions than they
do of all homicides. While Whites who killed Blacks are vastly under-represented in the list of
those executed, Blacks with White victims are dramatically over-represented. These trends are
stark, consistent over time, and overwhelming in their magnitude.
Conclusion
Strong race-of-victim effects have consistently been found in post-Furman studies indicating that
individuals with White victims are treated more harshly than those with Black victims. Our own
data consisting of all reported homicides and executions in the modern era (from 1976 onwards)
confirms that there are very few cases in which Whites are executed for killing Blacks, and a
disproportionately high number of cases in which Blacks are executed for killing Whites.
Researchers have tended to focus on the latter cases, specifically as evidence of a troubling bias
in favor of White victims. In fact, our data suggests that an exploration of both kinds of cases
presents even more compelling evidence of the power of race-of-victim bias.
A long line of scholarship documents persistent racial bias in the implementation of
capital punishment. In McCleskey v. Kemp the United States Supreme Court ruled that even the
most convincing evidence of racial bias is not enough to demonstrate a violation of constitutional
rights unless it presents proof of intentional, conscious discrimination. Such evidence is nearly
impossible to come by barring an outright admission. Further, as the magnitude and scope of
racial bias documented in our findings suggests, a focus on intentional discrimination by

17
individuals ignores the ways in which bias might be built into the system or operate
unconsciously across multiple individuals and processes. Recent litigation regarding the
retention of the death penalty in Connecticut included the compilation of extensive statistics in a
massive data collection effort by Donohue (2014) covering every death-eligible homicide in
recent years in that state, and confirming important racial and geographic biases in the
application of the penalty. (From 1973 through 2007, Donohue’s analysis showed that
Connecticut had 4,979 homicides, 205 death-eligible homicides, 12 death sentences, nine death
sentences sustained after appeals, and one execution.) The court, as in McCleskey, threw out the
argument that such evidence was pursuasive. Scheidegger (2011, 2012) argued that if crimes
occur in urban areas, and urban juries have Blacks, and Blacks are unwilling to impose the death
sentence, then “racial disparities would shrink to insignificance if legitimate factors, including
jurisdiction, could properly be taken into account” (2011, 22).13 In another article (2012, 164) he
asks: “To the extent that a race-of-the-victim disparity exists, is it due to racial animus of the
decision makers?” If this cannot be demonstrated, then his logic suggests that there can be no
finding of disparity, and that was the finding in McCleskey as well as in the Connecticut
litigation. This is what Eduardo Bonilla-Silva (1997) refers to as the “prejudice problematic”—
the expectation that we should identify a single racist villain to explain an outcome that could
well be due to more structural causes. To a large extent, the courts have remained true to this
“prejudice problematic,” unwilling to confront implicit bias and structural differences. Further,
as Scheidegger (2011) suggests, they take geographic disparities—which of course can be related
to racial outcomes—as signs of appropriate “local control” properly to be left to the discretion of
13 He obviously ignores Houston, Dallas, Fort Worth as top ten counties nationally by executions, and Philadelphia
and Los Angeles, top counties by death sentences imposed. The “death qualification”, limiting jury participation
only to those with abstract support of the death penalty, mitigates his concerns at the same time as it eliminates
many Blacks from capital juries.

18
locally elected prosecutors, judges, and juries and in fact a sign of healthy variation rather than a
challenge to the equal protection clause of the Constitution.
Despite the rejection of powerful evidence by the courts, scholarship continues to
document the presence of racial bias in capital punishment. This work contributes new evidence
to this endeavor, providing both a systematic review of existing literature and a new,
comprehensive review of all 1,359 executions in the modern era. In both cases the results are
stunning. The trend is certainly expected given the large body of scholarship documenting bias.
However, the scope of the disparity is greater than even the existing literature would lead one to
expect. Further, our findings are not based on a survey or an estimate; we have assembled a
complete list of every execution in the modern era, and looked up information on each of the
victims. The comprehensive nature of our evidence allows some strong conclusions about the
state of capital punishment in the US now almost 40 years since its re-establishment in 1976.
The enormous scope of racial bias identified here, in both the review of existing literature
and analysis of all modern-era executions, suggests that we question the standard for evidence
presented in McCleskey v. Kemp. It is clear that significant, troubling racial disparities exist
without proof of intentional discrimination by state actors. These disparities are not, as Justice
Powell suggested, “an inevitable part of our criminal justice system” (McCleskey v. Kemp 1987).
More pressingly, these findings suggest that we reevaluate the death penalty itself. At a
minimum, we must recognize its strongly racialized character.
In a time when support for capital punishment among legislators and the public has
reached record lows, our study adds another reason to oppose the practice. In its modern history
as in its use in previous eras, racial bias in its application is consistently high. In addition to the
threat to the equal protection of the law that these numbers suggest, such overwhelming evidence

19
of differential treatment erodes public support for the judicial system. Further, the strength of
these biases makes clear that complaints of unequal treatment are real, not imagined. If the
ultimate and highly symbolic punishment is meted out in such a disparate manner with regards to
race, and with these patterns of racial bias so similar in the modern period to the overtly racist
practices of previous generations, the statistical patterns laid bare in this study can only lead to a
decline in support and efficacy of the judicial system overall.

20
Sources
Abrams, David, Bertrand, Marianne, Mullainathan, Sendhil. (2012). “Do Judges Vary in Their
Treatment of Race?” Journal of Legal Studies 41:2 p. 347-383
American Civil Liberties Union Capital Punishment Project. (2007). The Persistent Problem of
Racial Disparities in The Federal Death Penalty. 25 June 2007. Web. 19 Mar. 2014.
Atkins v. Moore, 1998 WL 93409 (C.A.4 (S.C.))
AP. (1999, September 6, 1999). South Carolina Executes Man for Murder, New York Times.
Baldus, David C., Pulaski, Charles, & Woodworth, George. (1983). Comparative Review of
Death Sentences: An Empirical Study of the Georgia Experience. Journal of Criminal
Law and Criminology, 74, 661-753.
Baldus, David C., & Woodworth, G. (2003). Race Discrimination and the Death Penalty: An
Empirical and legal overview. In J. R. Acker, R. M. Bohm & C. S. Lanier (Eds.),
America's Experiment with Capitol Punishment: Reflections on the Past, Present and
Future of the Ultimate Penal Sanction. Durham, NC: Carolina Academic Press.
Baldus, David C., & Woodworth, George. (2001). Race of Victim and Race of Defendant
Disparities in the Administration of Maryland's Capital Charging and Sentencing System
(1979-1996). Preliminary Finding.
Bell, Kim. (1995, December 4, 1995). Killer of Inmate Next on Death Row, St. Louis Post
Dispatch.
Blume, John, Theodore Eisenberg, and Martin T. Wells. 2004. Explaining Death Row’s
Population and Racial Composition. Journal of Empirical Legal Studies 1, 1: 165–207.
Bonilla-Silva, Eduardo. 1997. Rethinking Racism: Toward a Structural Interpretation.
American Sociological Review 62, 3: 465-480.
Bowers, B.A., Pierce, G.L., & McDevitt, J.F. (1984). Legal Homicide: Death as Punishment in
America, 1864-1982. Boston: Northeastern University Press.
Donohue III, John J. 2014. An Empirical Evaluation of the Connecticut Death Penalty System
Since 1973: Are There Unlawful Racial, Gender, and Geographic Disparities?
Forthcoming, Journal of Empirical Legal Studies, 11: 4 (December). Available at:
http://ssrn.com/abstract=2470082, downloaded 4 August 2014.
Fagan, Jeffrey, Franklin E. Zimring, and Amanda Geller. 2006. Capital Punishment and Capital
Murder: Market Share and the Deterrent Effects of the Death Penalty. Available at:
http://ssrn.com/abstract=928649, downloaded 4 August 2014.Gaskins, Donald H., &
Earle, Wilton. (1992). Final Truth: The Authobiography of a Serial Killer. Hartwell, GA:
Adept
Jacobs, David, Qian, Zhenchao, Charmichael, Jason T., & Kent, Stephanie L. (2007). Who
Survives on Death Row? An Individual and Contextual Analysis. American Sociological
Review, 72(4), 610-632.
McCleskey v. Kemp (1987).
O'Boyle, Peter. (1988, April 14, 1988). South Carolina Board Denies Parole Request of Gaskins'
Henchman, The State, p. 1A.
O'Neil, Tim. (1993, Nov. 3 1993). Death-Row Appeal Claims New Evidence, St. Louis Post-
Dispatch.
Paternoster, Raymond, & Brame, Robert. (2003). An Empirical Analysis of Maryland’s Death
Sentencing System with Respect to the Influence of Race and Legal Jurisdiction:
University of Maryland.

21
Paternoster, Raymond, Brame, Robert, Bacon, Sarah, & Ditchfield, Andrew. (2004). Justice by
Geography and Race: The Administration of the Death Penalty in Maryland, 1978-1999.
University of Maryland Law Journal of Race, Religion, Gender and Class, 4(1), 1-97.
Pierce, Glenn L. , & Radelet, Michael L. (2005). The Impact of Legally Inappropriate Factors On
Death Sentencing For California Homicides, 1990-1999. Santa Clara Law Review, 49, 1-
31.
Radelet, Michael L. . (1989). Executions of Whites for Crimes against Blacks: Exceptions to the
Rule? . The Sociological Quarterly, 30(4), 529-544.
Scheidegger, Kent S. 2011. Mend It Don't End it: A Report to the Connecticut General
Assembly on Capital Punishment. Available at
http://www.cjlf.org/deathpenalty/deathpenalty.htm, downloaded 4 August 2014.
Scheidegger, Kent S. 2012. Rebutting the Myths about Race and the Death Penalty. Ohio State
Journal of Criminal Law 10, 1. Available at
http://www.cjlf.org/deathpenalty/deathpenalty.htm, downloaded 4 August 2014.
Unah, Isaac. (2011). Empirical Analysis of Race and the Process of Capital Punishment in Noth
Carolina. Michigan State Law Review, 609, 610-658.
Zeisel, Hans. (1981). Race Bias in the Administration of the Death Penalty: The Florida
Experiment. Harvard Law Review, 456, 456-.

22
Appendix A: Empirical Legal Studies of Race-of-Victim Effects14
The table below shows the degree of racial bias found in published studies of race-of-victim
effect. Unless otherwise noted the data refer to the ratio between Black and White victims;
“size” refers to the number of homicide cases included in the study, unless otherwise noted. All
available studies published since 1972 are included, thus reflecting the “modern era” of the death
penalty. Note, however, that different studies have different geographic scope and time
coverage. Footnotes at the bottom of the table explain the particulars of each comparison made.
Methodology: Our starting point was the foundational 1983 article “Comparative Review of
Death Sentences: An Empirical Study of the Georgia Experience” by David C. Baldus, Charles
Pulaski, and George Woodworth. A Google Scholar search identified 394 works that cite
Baldus’ 1983 journal article. We reviewed the sources and retained those articles whose titles
and abstracts mentioned “race,” “discrimination,” “arbitrariness,” “gender,” “injustice,” “bias” or
“disproportionality.” We also conducted searches in relevant academic journals for works
referencing “death penalty,” “death sentencing,” or “capital sentencing.” We conducted a
second round of review using Google Scholars “Cited by” function to find articles citing our
initial selection of articles. Finally, we reviewed the references of these works to find additional
sources, including legal journals with volumes or issues devoted to examination of
discrimination in the death penalty. We also used reference databases including ProQuest and
JSTOR to search for articles with keywords and phrases such as “death penalty race” and
“discrimination and the death penalty,” taking note of articles that cited relevant articles. Lastly,
the review included books relating to death penalty and discrimination found in a major
university library. Capital Punishment in America: Race and the Death Penalty Over Time by
Martin Guevara Urbina (2012) was especially valuable because the author includes a
comprehensive review of prior research from which we were able to find works we had not
previously included.
#
Study Geographic
Scope
Time
Range
Size Ratio
Panel A. Studies examining capital prosecution
1 Wilson, Marcia J (2008).
New Mexico 7/1979-
12/2007
211≈ 14.93
2 Baldus, David C., Catherine M. Grosso, George
Woodworth, and Richard Newell (2012).
U.S. Armed
Forces
7/16/1984-
10/13/2005
105^ 6.17∂
3 Songer, Michael J. and Isaac Unah (2006-2007). South Carolina 1993-97 2,319 5.85
4 Bohm, Robert M (1994). GA:
Chattahoochee
and Ocmulgee
judicial
circuits
3/28/1973-
7/1990
274~ 5.3
5 Hindson, Stephanie, Hillary Potter, and Michael
L. Radelet (2006).
Colorado 1972-2005 110≈ 4.22
6 Baldus, David C., Charles Pulaski and George
Woodworth (Autumn 1983).
Georgia 1970-78 724◊ 3.68
14 The studies included in these tables were all published after 1972, which was the year the Supreme Court of the
United States decided Furman v. Georgia.

23
7 Jacoby, Joseph E. and Raymond Paternoster.
(Spring 1982).
South Carolina 6/8/1977-
11/30/1979
205 3.2
8 Paternoster, Raymond (Autumn 1983). South Carolina 6/8/1977-
12/31/1981
1,686^ 2.69
9 Barnes, Katherine, David Sloss and Stephen
Thaman (2009).
Missouri 1997-2001 247 2.64
10 Paternoster, Raymond, Robert Brame, Sarah
Bacon, and Andrew Ditchfield (2004).
Maryland 7/1/1978-
12/31/1999
1,311^ 2.55†
11 Paternoster, Raymond (1984).
South Carolina 6/8/1977-
12/31/1981
1,686^ 2.51^^
12 Paternoster, Raymond, Robert Braeme, Sarah
Bacon and Andrew Ditchfield (2003).
Maryland 7/1978-
9/1999
1,311^ 2.38†
13 Paternoster, Raymond and Ann Marie Kazyaka
(Winter 1988).
South Carolina 6/8/1977-
12/31/1981
302^^ 2.31
14 Unah, Isaac (February 2009).
NC: Durham
County
2002-07
149^ 2.31
15 Keil, Thomas J. and Gennaro F. Vito (March
1990).
Kentucky 12/22/1976
- 10/1/1986
401 2.16
16 Rohrlich, Ted and Federic N. Tulsky (December
3, 1996).
CA: Los
Angeles
County
1990-94 9,442 2.14
17 Bienen, Leigh B., Neil Alan Weiner, Deborah W.
Denno, Paul D. Allison, and Douglas Lane Mills
(1988-1989).
New Jersey 8/6/1982-
8/18/1988
703 2.04
18 Sorensen, Jonathan R. and Donald H. Wallace
(1995).
Missouri 1977-91 3,873~ 1.91
19 Wagers, Kristin Amber (2010).
Scheb II, John M. and Kristin A. Wagers (2008-
2009).
Tennessee 1976- 2007 1,068∆ 1.71
20 Phillips, Scott (2008-2009). TX: Harris
County
1992-99 504~ 1.69‡
21 Phillips, Scott (December 2009).
TX: Harris
County
1992-99 504~ 1.57‡
22 Bortner, Peg and Andy Hall (June 2002). Arizona 1995-99 971~ 1.49†
23 McNally, Kevin (2003-2004). US 1988-2000 381~ 1.42†
24 Klein, Stephen P. and John E. Rolph (1991-
1992).
California 9/10/1977-
3/1/1984
496◊ 1.4†
25 Brock, Deon E., Jon Sorensen, and James W.
Marquart (1999).
Texas 9/1991-
9/1993
179◊ 1.33
26 Baldus, David C., Charles Pulaski and George
Woodworth (1984-1985).
Baldus, David C., Charles A. Pulaski, Jr. and
George Woodworth (Spring 1986).
Georgia 3/28/1973-
6/30/1978
606 1.3
27 Klein, Stephen P., Richard A. Berk, and Laura J.
Hickman (June 2006).
US 1/1/1995-
7/31/2000
312^ 1.3†
28 Donohue, John (October 2011). Connecticut 1973-2007 205^ 1.2†
29 Baldus, David C., George Woodworth, Catherine
M. Grosso, and Aaron M. Christ. (2002-2003).
Nebraska 4/30/1973-
12/31/1999
185^ 1.13†
30 Baldus, David. C., Julie Brain, Neil A. Weiner,
George Woodworth (2008-2009).
Arkansas
Judicial
Circuits 8 and
8S: Lafayette,
Miller,
Nevada, and
1990-2005 63^ 1.1∂
24
Hempstead
counties
Panel B. Studies examining capital sentencing
1 Baldus, David. C., Julie Brain, Neil A. Weiner,
George Woodworth (2008-2009).
Arkansas
Judicial
Circuits 8 and
8S: Lafayette,
Miller,
Nevada, and
Hempstead
counties
1990-2005 63^ ∞
2 Zeisel, Hans (December 1981). Florida 1972-77 378^^ 34.1
3 Gross, Samuel R. and Robert Mauro (1989).
Gross, Samuel R., and Robert Mauro (November
1984).
Mississippi
Georgia
Florida
Arkansas
North Carolina
Oklahoma
Illinois
Virginia
1976-80
852
2,126
3,501
798
1,871
898
3,115
1,389
10.45
9.7
7.6
6.53
5.97
5.78
5.38
4.31
4 Keil, Thomas J. and Gennaro F. Vito (March
1990).
Kentucky 12/22/1976
- 10/1/1986
401 9.56
5 Radelet, Michael L. and Glenn L. Pierce (January
1991).
Florida 1976-87 10,142 5.9
6 Paternoster, Raymond, Robert Brame, Sarah
Bacon, and Andrew Ditchfield (2004).
Maryland 7/1/1978-
12/31/1999
1,311^ 4.82†
7 Brock, Deon, Nigel Cohen, and Jonathan
Sorensen (2000-2001).
TX: Dallas,
Tarrant,
Harris, Bexar
counties
1980-96 28,286 4.64
8 Paternoster, Raymond, Robert Braeme, Sarah
Bacon and Andrew Ditchfield (2003).
Maryland 7/1978-
9/1999
1,311^ 4.6†
9 Radelet, Michael L (December 1981). Florida 1976-77 637~ 4.48
10 Baldus, David C., Charles Pulaski and George
Woodworth (Autumn 1983).
Georgia 1970-78 724◊ 4
11 Baldus, David C., Charles Pulaski and George
Woodworth (1984-1985).
Baldus, David C., Charles A. Pulaski, Jr. and
George Woodworth (Spring 1986).
Georgia 3/28/1973-
6/30/1978
606 3.9
12 Pierce, Glenn L. and Michael L. Radelet (2005-
2006).
California 1990-99 263≈ 3.7
13 Smith, M. Dwayne (1987). Louisiana 10/1/1976-
12/31/1982
504^ 3.5
14 Pierce, Glenn L. and Michael L. Radelet (2002). Illinois 1988-97 4,182 3.45
15 Donohue, John (October 2011). Connecticut 1973-2007 205^ 3.14†
16 Thompson, Ernie (Spring 1997). Arizona 1982-91 2,028 3.06
17 Baldus, David C., Catherine M. Grosso, George
Woodworth, and Richard Newell (2012).
U.S. Armed
Forces
7/16/1984-
10/13/2005
105^ 2.98∂
18 Barnett, Arnold (1984-1985). Georgia 1973-78 606 2.9
19 Phillips, Scott (2012).
TX: Harris
County
1/1/2001-
2/15/2008
488^ 2.86
20 Williams, Marian R. and Jefferson E. Holcomb
(2001).
Ohio 1981-94 5,319 2.66

25
21 Pierce, Glenn L. and Michael L. Radelet (2010-
2011).
LA: East
Baton Rouge
Parish
1990-2008
191∆ 2.64
22 American Civil Liberties Union of Virginia
(December 2000).
Virginia 1978-97 78+
1,038±
2.2
3.4
23 Unah, Issac (February 4, 2003).
Unah, Isaac (2011).
North Carolina 1993-97
520◊ 2.13†
24 Bienen, Leigh B., Neil Alan Weiner, Deborah W.
Denno, Paul D. Allison, and Douglas Lane Mills
(1988-1989).
New Jersey 8/6/1982-
8/18/1988
703 2.07
25 Bortner, Peg and Andy Hall (June 2002). Arizona 1995-99 971~ 2.02†
26 Phillips, Scott (December 2009).
TX: Harris
County
1992-99 504~ 1.89‡
27 Wagers, Kristin Amber (2010).
Scheb II, John M. and Kristin A. Wagers (2008-
2009).
Tennessee 1976- 2007 1,068∆ 1.85
28 Unah, Isaac (April 16, 2001). North Carolina 1993-97 502◊ 1.69†
29 Baldus, David C, George Woodworth, Gary L.
Young, and Aaron M. Christ (July 25, 2001).
Nebraska 4/20/1973-
12/31/1999
177^ 1.54†
30 Sorensen, Jonathan R. and Donald H. Wallace
(1995).
Missouri 1977-91 3,873~ 1.5
31 Phillips, Scott (2008-2009). TX: Harris
County
1992-99 504~ 1.5‡
32 Barnes, Katherine, David Sloss and Stephen
Thaman (2009).
Missouri 1997-2001 247 1.2
33 Baldus, David C., George Woodworth, Catherine
M. Grosso, and Aaron M. Christ. (2002-2003).
Nebraska 4/30/1973-
12/31/1999
185^ 1.19†
34 Aguirre, Jr., Adalberto, Richard P. Davin, David
V. Baker, and Konrad Lee (1999).
California 1/1989-
3/1994
151◊ 1.09
35 Reckdenwald, Amy (June 2004). North Carolina 1979-2000 640◊ 1.03
36 Brock, Deon E., Jon Sorensen, and James W.
Marquart (1999).
Texas 9/1991-
9/1993
179◊ 1.03
37
38
Paternoster, Raymond and Ann Marie Kazyaka
(Winter 1988).
Radelet, Michael L. and Glenn L. Pierce (2011)
South Carolina
North Carolina
6/8/1977-
12/31/1981
1/1/1980-
12/31/2007
302^^
368
.54
2.96
39 Baldus, David C., Charles A. Pulaski, Jr. and
George Woodworth (Spring 1986).
(Ratios beyond first Georgia ratio are computed
from data in Henderson and Taylor, “Racist
Justice: Discrimination Even in Death,” Dallas
Times Herald, November 18, 1985)
Georgia
New Jersey
Maryland
Arkansas
Texas
Kentucky
Georgia
Mississippi
Missouri
Virginia
Illinois
Arizona
Florida
Tennessee
California
Louisiana
Alabama
1977-84 606
722^^
451^^
205^^
1,890^^
277^^
377^^
179^^
480^^
331^^
1,459^^
197^^
1,128^^
388^^
3,392^^
510^^
342^^
1.3
1.05
7.57
6.28
4.61
4.47
4.30
3.99
3.97
3.89
2.96
2.51
2.49
2.44
2.38
2.19
2.04

26
South Carolina
Indiana
Oklahoma
Nebraska
Ohio
North Carolina
Pennsylvania
Nevada
Delaware
Idaho
New Mexico
Montana
Wyoming
Utah
Washington
Colorado
448^^
360^^
242^^
55^^
664^^
480^^
970^^
110^^
49^^
37^^
50^^
25^^
45^^
54^^
131^^
125^^
1.87
1.84
1.79
1.75
1.19
.99
.98
.93
.49
∞
∞
∞
∞
∞
∞
∞
Notes ^ Death-eligible cases ^^ Felony homicides ∆ First-degree murder convictions ~ Defendants indicted for murder ◊ Defendants sentenced for murder (life or death
sentences) ≈ Death penalty cases (death penalty sought) *** Combination of death-sentenced, life-sentenced, and
non-penalty-trial cases + Rape convictions
± Robbery-murders
∞ Ratio could not be calculated because there were no
death-sentenced cases in one of the reference categories
to compare to the other reference category
Race-of-Victim
∂White victim and other cases
†White victim and nonWhite/minority victim
‡White or Hispanic victim and other cases
††NonBlack victim and Black victim
Race-of-Inmate
§ Black defendants and other cases # Defendant of color/minority/nonWhite and White
defendant % Black and nonBlack defendants
Combined Race-of-Inmate and Race-of-Victim ## Minority-inmate/White-victim and other cases √ Black-inmate/White-victim and other cases << Minority/defendant of color/nonWhite-inmate/White-
victim and White-inmate/White-victim and Black-inmate/nonBlack-victim and other cases

27
Appendix B: White-On-Black Homicides Resulting in Execution 1975-201315
So few occurrences of White-on-Black homicides have led to an execution in the modern history
of the death penalty that we can list each of them here. Even for those accustomed to reading of
the often horrific crimes associated with many death penalty cases, these crimes or the criminals
involved are particularly noteworthy, gruesome, or overtly racially motivated.
As it happens, South Carolina has seen more White-on-Black homicide executions than
any other state since 1975. Their cases include William Downs, a two-time child rapist and
murderer who requested the death penalty and waived his appeals, and Richard Johnson, also a
double murderer, who fatally shot the Black South Carolina state trooper who pulled him over
following his first murder. Joseph Atkins murdered his Black adopted father and the thirteen-
year-old neighbor girl just five years after being paroled for the murder of his brother. He shot
the girl at close range with a shotgun while she slept (Atkins v. Moore Fourth Circuit, 1998). By
the time police began to suspect Donald “Pee Wee” Gaskins, often described as the state’s most
infamous and prolific serial killer, he had killed at least 13 people. Though these were initially
thought to be Gaskins’ only victims he would later claim to have killed 181 people (Gaskins &
Earle, 1992). Gaskins’ initial death sentence was vacated, but he was sentenced to death a second
time after conducting a paid hit using a bomb disguised as a homemade radio, killing a Black
inmate in the adjacent prison cell (AP, 1999; O'Boyle, 1988). Therefore, while his execution
was a result of the killing of a Black man, his previous crimes had already qualified him as one
of the most prolific murderers in state history. Here we present a list and short description of
each Black-on-White homicide that has led to an execution.
15 Facts for these cases were found through a review of rulings on subsequent appeals and LexisNexis searches of
news coverage of the cases.

28
The first 10 cases listed had only Black male victims. Edwin Turner had 2 such victims
but all the others had only a single Black male victim. Six additional cases are listed below,
where the killer had multiple victims some of whom were Black males but others were of other
races. In all, just 10 Whites have been executed for the crime of killing a Black male, and, as
this list makes clear, many of them had previously killed others, though they eventually were
sentenced to death and executed for the killing of a Black male. Others had explicit racial
motivations.
Donald Gaskins, SC, September 6, 1991: Donald (Pee Wee) Gaskins is described as South
Carolina’s most infamous and prolific serial killer. By the time police began to suspect Gaskin of
the murder of a local woman, he had killed at least 13 people. He would later claim to have had
181 victims. After having his first death sentence vacated due to the Supreme Court initiated
moratorium, Gaskins was eventually executed for his 14th known murder, a paid hit on Rudolph
Tyner, a fellow inmate, using a bomb disguised as a radio.
Robert O’Neal, MO, December 6, 1995: In 1984, Robert O’Neal was a member of a White
supremacist prison gang and had been incarcerated since the age of 18 for murdering a 78-year-
old man during the commission of a burglary (Bell, 1995). On February 3, 1984, O’Neal, Rodnie
Stewart, and Lloyd E. Schlup, approached Black inmate Arthur Dade. Steward threw hot liquid
in Dade’s eyes and Schlup restrained the victim while O’Neal stabbed him to death with a 12
inch long homemade knife (O'Neil, 1993). Prosecutors called the murder an “Aryan hit.”
Henry Francis Hays, AL, June 6, 1997: In 1981 the Alabama KKK ordered a lynching to “show
Klan strength.” On March 20, 1981 Henry Francis Hays and fellow Klansman James “Tiger”
Knowles, abducted 19-year-old Michael Donald and drove him to a secluded area where they
struck him with a tree limb over 100 times. When Donald stopped moving they slit his throat and
placed a rope around his neck. Before hanging Donald’s body from a tree, they took him to the
home of Henry’s father, a Klan leader, to show other Klan members.
Norman Lee Newsted, OK, July 8, 1999: On February 20, 1984 Norman Lee Newsted fatally
shot cab driver Larry Donnell Buckley after the men stopped to ask for directions to the home of
Newsted’s sister. Newsted had hailed the cab after arriving at the airport having fled Utah, where
he and an accomplice had each shot three people during the commission of a robbery. All three
victims died.
William Downs, SC, July 14, 2006: After being arrested in the 1999 kidnapping, rape and
murder of 6 year old Keenan O’Mailia, William Downs admitted to having raped and killed
another boy, James Porter in Savannah Georgia eight years earlier. Before being sentenced for
the murder of O’Mailia Downs told the court that he deserved the death penalty saying, “I think

29
it would be disrespectful to the family and…to the whole world if you did not give me the death
penalty”
John Yancey Schmitt, VA, November 9, 2006: In 1999 John Yancey Schmitt robbed the Bon Air
NationsBank armed with a semi-automatic handgun. According to prosecutors, the bank’s
security guard Earl Dunning placed himself between Schmitt and the bank tellers during the
holdup. Witnesses reported that Schmitt shot Dunning twice. Security cameras captured a
“vivid” photo of Schmitt, who was identified as the same man who had robbed the bank a month
earlier.
Lee Andrew Taylor, TX, June 16, 2011: In 1999 Lee Andrew Taylor was serving a life sentence
for an aggravated robbery in which an elderly couple were beaten in their home. The elderly man
died as a result of the attack and his wife required extensive reconstructive surgery. On April 1,
1999 Taylor attacked Donta Greene, who was unarmed, fatally stabbing him in the chest thirteen
times with a prison-made stabbing device that resembled an ice pink.
Lawrence Brewer, TX, September 20, 2011: On June 7, 1998, in an area of Texas known for
Klan activity, Larry Byrd accepted a ride from White supremacists Lawrence Brewer, John King
and Shawn Berry. The men took Byrd to a secluded area where they beat him, urinated on him
and chained him to their truck before dragging his body behind the vehicle for two miles. Byrd
remained conscious throughout the attack, dying only when his right arm and head were severed
The men dumped Byrd’s remains in front of an African American church.
Edwin Turner, MS, February 8, 2012: In December of 1995, Edwin Turner and Paul M. Stewart
drank beer and smoked marijuana before setting out to rob convenience stores in Carroll County
Mississippi. Armed with rifles, the men approached the first convenience store, where Turner
shot attendant Eddie Brooks. At the next store he shot Everett Curry while he pumped gas. The
men returned home with $400 in cash.
Frederick Treesh, OH, March 6, 2013: On August 27, 1994 Frederick Treesh and Benjamin
Brooks entered an adult bookstore store armed with a nine-millimeter handgun and a sawed-off
shotgun. Treesh fatally shot the store’s security guard and while fleeing shot the store’s clerk
twice. According to prosecutors, in the days preceding the murder Treesh and Brooks had robbed
banks and businesses, stolen and carjacked cars, committed sexual assaults and fatally video
store owner Ghassan Danno in a series of crimes that crossed five states.
These six inmates had at least one Black male victims, but also had other types of victims:
Roger Stafford, OK, July 1, 1995: In 1975 Stafford, along with his wife Verna and brother
Harold, killed a family of three in a robbery, after tricking them into stopping to come to the aid
of Verna alongside a highway. Three weeks later they killed six restaurant employees while
robbing a steakhouse in Oklahoma City. Stafford ordered all of the employees into the walk in
freezer and killed the only Black employee, janitor Isaac Freeman, before opening fire on the
others.

30
Joseph Atkins, SC, January 22, 1999: After being paroled for the murder of his brother in 1985,
Joseph Atkins cut the phone lines to his neighbors’ home, entered armed with a machete and
shotgun, and shot the 13-year old neighbor girl while she slept. He then returned to his own
home where he fatally shot his father.
Timothy McVeigh, FE, June 11, 2001: On April 19, 1995 Timothy McVeigh detonated a rental
truck filled with explosives in front of the Alfred P. Murrah Federal Building in Oklahoma City.
The explosion damaged or destroyed 324 buildings within a 16-block radius, injured over 600
people and killed 168 including 19 children. It remains the deadliest act of domestic terrorism in
U.S. history.
Richard Johnson, SC, May 3, 2002: in September of 1985, Dan Swanson, who was driving his
RV to Florida, picked up, Richard Johnson along with two other hitchhikers. During the trip,
Johnson shot Swanson and hid his body in the RV. He then fatally shot the Black state trooper
who pulled the RV over for reckless driving six times, at least once after he had already fallen to
the ground.
Frank G. Spisak Jr., OH, February 17, 2011: In February of 1982 neo-Nazi Frank Spisak began
shooting Black and Jewish individuals at Cleveland State University as part of a “war” for the
“survival” of the “Aryan race.” Spisak killed Horace Rickerson, Brian Warford and Timothy
Sheehan and shot two others, John Hardaway and Coletta Dartt, who survived.
Harry Mitts, OH, September 25, 2013: In August 14, 1994, Harry Mitts Jr., severely inebriated,
threatened several people in his apartment complex with a gun armed with a laser site. Mitts
shouted racial epithets at his White neighbor and her Black boyfriend, John Bryant before fatally
shotting Bryant. When police arrived at the scene Mitts fatally shot Sgt. Dennis Glivar and
wounded two other responding officers.