
Capital Plan Update - corpinfo.panynj.gov · SEP and RPP 35% SEC 5% MAND 10% By Project Category ....
19
Capital Plan Update Committee on Capital Planning, Execution and Asset Management April 30, 2015
Transcript of Capital Plan Update - corpinfo.panynj.gov · SEP and RPP 35% SEC 5% MAND 10% By Project Category ....

Capital Plan Update
Committee on Capital Planning, Execution and Asset Management
April 30, 2015

Presentation Agenda
2014 Year End Summary
1Q 2015 Performance
Dashboard Presentation

2014 Capital Performance Summary
• Across 412 projects
• 231 in active construction
• 96% of adjusted plan spending was achieved
• 86 projects advanced to the next phase
Such as:
• Port Authority Bus Terminal Quality of Commute Program
• Replacement of Fire Alarm System at JFK Airport’s Control Tower
Plan Spent: $3.6 billion
Plan Performance: A Success
Plan Managed: Accommodating New Needs
• Project Management Manual
• Project Delivery Program
Process Improvements: Enhancing Efficiency

2014 Investments in
Transportation Infrastructure* *Excludes WTC
Bridges 32%
Utilities 17%
Runways & Taxiways
15%
Buildings & Garages
14%
Rail Systems 8%
Paving & Roadways
6%
Control Systems
4% Wharfs
2%
Other 2%
By Asset Type
SGR 50%
SEP and RPP 35%
SEC 5%
MAND 10%
By Project Category

2014 Economic Impact
18,800 Job Years
$1.2 B Total
Wages
$5B Economic Activity

2015 Spending Plan • 2015: Robust spending plan and portfolio of projects
• $3.6 billion planned spending across 372 projects
• 13 Sandy projects newly added, reflecting the plan’s flexibility
to changing needs and priorities
2015 Plan
Department # Projects $ Spending Plan
Aviation 131 778,084
PATH 64 221,631
Port Commerce 37 152,533
TB&T 110 814,114
Line Dept Total 342 $ 1,966,362
WTC 25 1,625,388
Regional, Development &
Provisions 5 30,860
Agency Total 372 $ 3,622,610
Asset Category
*Excludes WTC

1Q 2015 Spending Performance
Department YTD Plan YTD Actuals
Actuals as a %
of Plan
Aviation 129,162 100,041 77%
PATH 42,067 29,351 70%
Port Commerce 13,943 17,215 123%
TB&T 176,344 146,211 83%
Line Dept. Total $361,516 $292,818 81%
WTC 320,400 139,061 43%
Total $685,571 $432,256 63%

1Q 2015: Phase Advancements
0 10 20 30 40 50 60 70
Planning to Design
2015 Planned
1Q Actual
2015 Planned
1Q Actual
Design to Construction
Planning to Design
2015 Planned
1Q Actual
2015 Planned
1Q Actual
Design to Construction
Planning to Design
2015 Planned
1Q Actual
2015 Planned
1Q Actual
Design to Construction
36
9
25
66
10
29
25% of Annual Goal Achieved
38% of Annual Goal Achieved

Sandy Projects
* Includes plan projects with partial Sandy work
38 projects funded in
2015
62 projects in
10 Year
Plan
22 future
starts
9 in Construction
10 in Design
19 in Planning
2 completed
in 2014
38 active

Port Authority Bus Terminal:
1Q Accomplishments • Modernized one set of
public restrooms
• Improved cellular connectivity in South Wing Public Areas
• Design work proceeding on Bus Parking/Staging in Lots D & E

Active Project Management
Managing challenges throughout the year
1 • Monitor for lagging projects
2 • Meet with all stakeholders to understand the causes
3
• Formulate an action plan that supports resumption of activity

Capital Program Delivery Dashboard
A Capital Program Delivery Dashboard will be uploaded to the Port Authority website in
mid May to provide public access to key capital program performance indicators.
The Dashboard will provide the public with:
• Cost and schedule information for the 372 active capital projects identified in the
2015 Capital Budget.
• Summaries of the PA planned Capital investments at the Agency, Departments and
Facilities levels.
• Performance and status through the end of March 2015, and will be updated
quarterly.
“The Panel also suggests that the Port Authority create and post to its website detailed capital plan dashboards,
such as those provided by the Metropolitan Transportation Authority (“MTA”) on its website.”
-Special Panel Report, p. 50
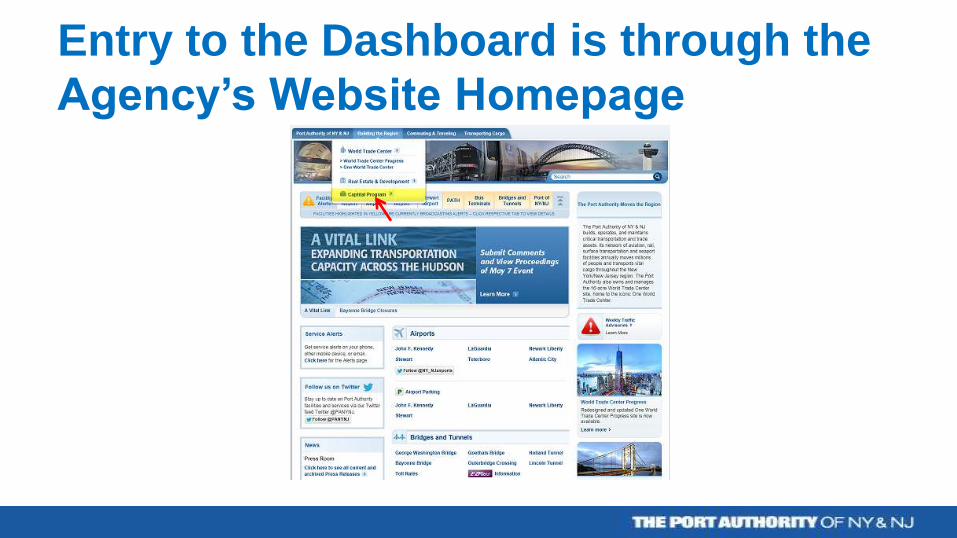
Entry to the Dashboard is through the
Agency’s Website Homepage

Dashboard Landing Page

Dashboard Main Page – Agency Level
Summary (Top Half)
1 2
3 4

Dashboard Main Page - Agency Level
Summary (Bottom Half)

Dashboard Facility Level Page
(Top Half)

Dashboard Facility Level Page (Bottom Half) – Project
Listing
1
3
2
4

Individual Project Summary


![Heterometallic Copper–Vanadium Compounds: im 4 2 4 mand 2 ... · (mand) 2] 2 anions.Thestrongercoordi-nation in [Cu(im) 4 V 2 O 4 (mand) 2] n (1) that contains the racemic mandelato](https://static.fdocuments.in/doc/165x107/5f6962c175ba286cb347905a/heterometallic-copperavanadium-compounds-im-4-2-4-mand-2-mand-2-2-anionsthestrongercoordi-nation.jpg)


