Capital Markets Review | 2nd Quarter 2020
5
Capital Markets Review | 2nd Quarter 2020 June 30, 2020 Overview 1 © 2020 RVK, Inc. The disconnect between investor risk appetite and economic conditions reached staggering levels during the second quarter. These conditions were largely fueled by fiscal relief and liquidity reinforcing programs implemented by governments and global central banks in response to the COVID-19 pandemic and the resulting economic shutdowns. The S&P 500 rebounded sharply as its forward P/E ratio reached levels last seen during the tech bubble. Equity markets outside the US produced similarly positive returns for Q2, although they remain deeper in the red in 2020 compared to broad domestic indexes. In general, the funding pressures markets experienced in the first quarter abated, as various programs enacted by the Federal Reserve proved successful in restoring normal capital markets activity. Risk assets were consistently bid higher, with nearly every major asset class producing strong returns. While economic data generally pointed to a bottoming of global GDP growth during the month of April, the modest economic recoveries in May and June lagged significantly behind the ”V” shaped recovery seen in the pricing of risk assets. The Atlanta Fed’s GDPNow estimate for Q2 US growth, as of July 1st, indicated a 36.8% annualized economic contraction, a recession more severe than experienced in 2008-09. At the same time, the NASDAQ and Dow Jones Industrial Average experienced their best quarters since 2001 and 1987, respectively, while equity issuance in the US hit a record of $184 billion. On the debt side, the first half of 2020 also saw record issuance in corporate credit. Companies with investment grade ratings issued in excess of $1.2 trillion during the first six months of the year, double the amount realized over the same period in 2019. Additionally, companies with junk ratings saw year -over-year increases in issuance of close to 40%. In a sign that market participants continue to look past the near -term effects of the pandemic and the unprecedented new supply coming to market, credit spreads narrowed across the quality spectrum. Despite the tightening of spreads, a potential wave of corporate defaults remains likely, as the number of defaults for companies with liabilities in excess of $50 million increased to 76, a level last seen during the financial crisis in Q1 2009. Amid the negative trends that were observed during the quarter, there were encouraging indicators in the form of lower than expected unemployment rates and higher than anticipated non-farm payroll growth. Many professional forecasters had anticipated an unemployment rate approaching 20% by quarter -end, following the 20.8 million job losses announced in April. In fact, the June employment report indicated an unemployment rate of just 11.1%. Going forward, the economy remains in a precarious position, as personal current transfer receipts, including $1,200 checks sent to many American households and expanded unemployment benefits, kept incomes elevated during the economic shutdown. It remains to be seen whether markets can maintain their trajectory if these income replacing programs are not renewed, especially if further lockdowns are necessary. Trailing Period Market Performance (%) Quarter-to-Date Performance (%) QTD CYTD 1 Year 5 Years 10 Years S&P 500 20.5 -3.1 7.5 10.7 14.0 Russell 2000 25.4 -13.0 -6.6 4.3 10.5 MSCI EAFE 14.9 -11.3 -5.1 2.1 5.7 MSCI EAFE SC 19.9 -13.1 -3.5 3.8 8.0 MSCI EM 18.1 -9.8 -3.4 2.9 3.3 Bloomberg US Agg Bond 2.9 6.1 8.7 4.3 3.8 BofA ML 3Mo US T-Bill 0.0 0.6 1.6 1.2 0.6 Wilshire US REIT 10.6 -17.8 -12.3 4.0 9.2 Bloomberg Commodity Index 5.1 -19.4 -17.4 -7.7 -5.8 20.5 25.4 14.9 19.9 18.1 2.9 0.0 10.6 5.1 0.0 5.0 10.0 15.0 20.0 25.0 30.0 Return (%)
Transcript of Capital Markets Review | 2nd Quarter 2020
Capital Markets Review | 2nd Quarter 2020 June 30, 2020
Overview
1 © 2020 RVK, Inc.
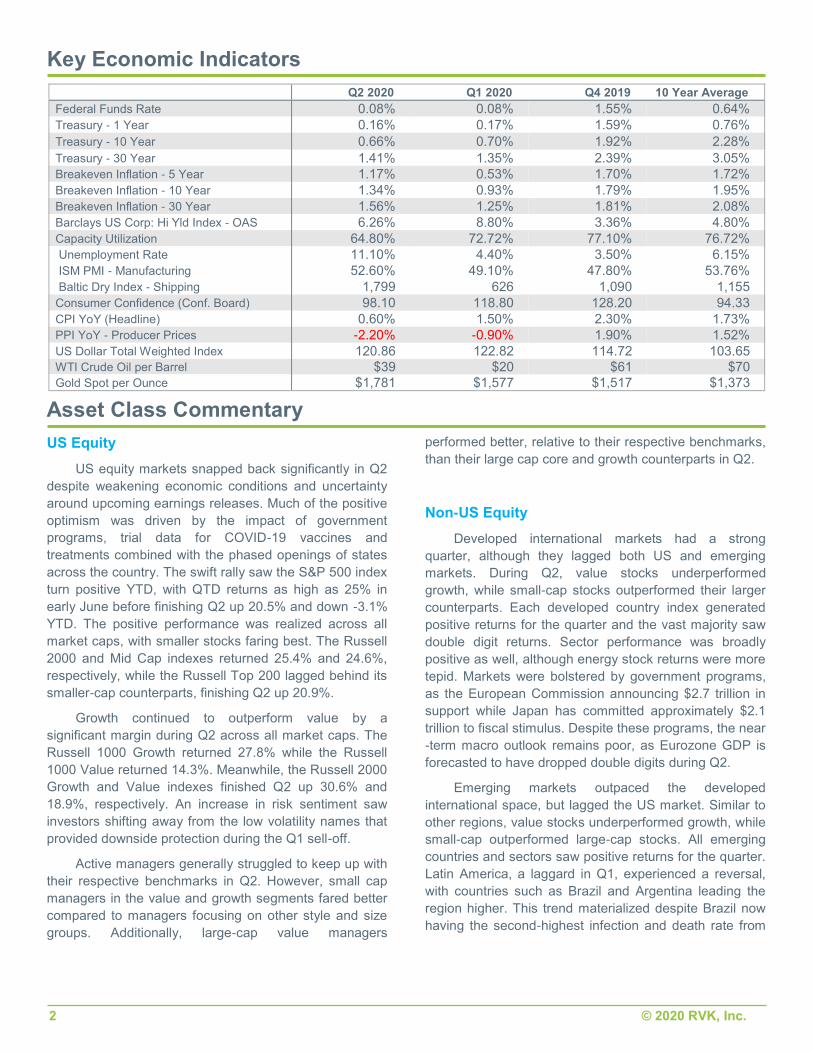
The disconnect between investor risk appetite and economic conditions reached staggering levels during the second
quarter. These conditions were largely fueled by fiscal relief and liquidity reinforcing programs implemented by
governments and global central banks in response to the COVID-19 pandemic and the resulting economic shutdowns.
The S&P 500 rebounded sharply as its forward P/E ratio reached levels last seen during the tech bubble. Equity markets
outside the US produced similarly positive returns for Q2, although they remain deeper in the red in 2020 compared to
broad domestic indexes. In general, the funding pressures markets experienced in the first quarter abated, as various
programs enacted by the Federal Reserve proved successful in restoring normal capital markets activity. Risk assets
were consistently bid higher, with nearly every major asset class producing strong returns.
While economic data generally pointed to a bottoming of global GDP growth during the month of April, the modest
economic recoveries in May and June lagged significantly behind the ”V” shaped recovery seen in the pricing of risk
assets. The Atlanta Fed’s GDPNow estimate for Q2 US growth, as of July 1st, indicated a 36.8% annualized economic
contraction, a recession more severe than experienced in 2008-09. At the same time, the NASDAQ and Dow Jones
Industrial Average experienced their best quarters since 2001 and 1987, respectively, while equity issuance in the US hit
a record of $184 billion. On the debt side, the first half of 2020 also saw record issuance in corporate credit. Companies
with investment grade ratings issued in excess of $1.2 trillion during the first six months of the year, double the amount
realized over the same period in 2019. Additionally, companies with junk ratings saw year-over-year increases in issuance
of close to 40%. In a sign that market participants continue to look past the near-term effects of the pandemic and the
unprecedented new supply coming to market, credit spreads narrowed across the quality spectrum. Despite the tightening
of spreads, a potential wave of corporate defaults remains likely, as the number of defaults for companies with liabilities in
excess of $50 million increased to 76, a level last seen during the financial crisis in Q1 2009.
Amid the negative trends that were observed during the quarter, there were encouraging indicators in the form of
lower than expected unemployment rates and higher than anticipated non-farm payroll growth. Many professional
forecasters had anticipated an unemployment rate approaching 20% by quarter-end, following the 20.8 million job losses
announced in April. In fact, the June employment report indicated an unemployment rate of just 11.1%. Going forward, the
economy remains in a precarious position, as personal current transfer receipts, including $1,200 checks sent to many
American households and expanded unemployment benefits, kept incomes elevated during the economic shutdown. It
remains to be seen whether markets can maintain their trajectory if these income replacing programs are not renewed,
especially if further lockdowns are necessary.
Trailing Period Market Performance (%) Quarter-to-Date Performance (%)
QTD CYTD 1
Year 5
Years 10
Years
S&P 500 20.5 -3.1 7.5 10.7 14.0
Russell 2000 25.4 -13.0 -6.6 4.3 10.5
MSCI EAFE 14.9 -11.3 -5.1 2.1 5.7
MSCI EAFE SC 19.9 -13.1 -3.5 3.8 8.0
MSCI EM 18.1 -9.8 -3.4 2.9 3.3
Bloomberg US Agg Bond 2.9 6.1 8.7 4.3 3.8
BofA ML 3Mo US T-Bill 0.0 0.6 1.6 1.2 0.6
Wilshire US REIT 10.6 -17.8 -12.3 4.0 9.2
Bloomberg Commodity Index 5.1 -19.4 -17.4 -7.7 -5.8
20.5
25.4
14.9
19.918.1
2.90.0
10.6
5.1
0.0
5.0
10.0
15.0
20.0
25.0
30.0
Re
turn
(%
)
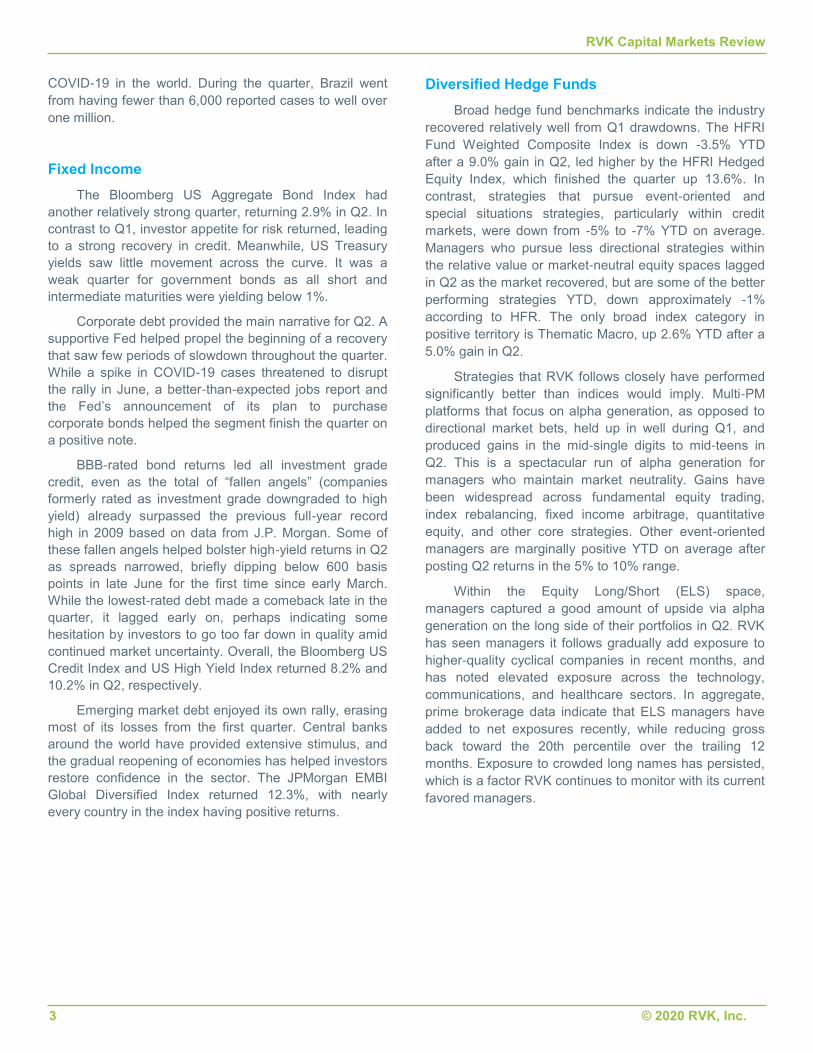
Key Economic Indicators
2 © 2020 RVK, Inc.
US Equity
US equity markets snapped back significantly in Q2
despite weakening economic conditions and uncertainty
around upcoming earnings releases. Much of the positive
optimism was driven by the impact of government
programs, trial data for COVID-19 vaccines and
treatments combined with the phased openings of states
across the country. The swift rally saw the S&P 500 index
turn positive YTD, with QTD returns as high as 25% in
early June before finishing Q2 up 20.5% and down -3.1%
YTD. The positive performance was realized across all
market caps, with smaller stocks faring best. The Russell
2000 and Mid Cap indexes returned 25.4% and 24.6%,
respectively, while the Russell Top 200 lagged behind its
smaller-cap counterparts, finishing Q2 up 20.9%.
Growth continued to outperform value by a
significant margin during Q2 across all market caps. The
Russell 1000 Growth returned 27.8% while the Russell
1000 Value returned 14.3%. Meanwhile, the Russell 2000
Growth and Value indexes finished Q2 up 30.6% and
18.9%, respectively. An increase in risk sentiment saw
investors shifting away from the low volatility names that
provided downside protection during the Q1 sell-off.
Active managers generally struggled to keep up with
their respective benchmarks in Q2. However, small cap
managers in the value and growth segments fared better
compared to managers focusing on other style and size
groups. Additionally, large-cap value managers
performed better, relative to their respective benchmarks,
than their large cap core and growth counterparts in Q2.
Non-US Equity
Developed international markets had a strong
quarter, although they lagged both US and emerging
markets. During Q2, value stocks underperformed
growth, while small-cap stocks outperformed their larger
counterparts. Each developed country index generated
positive returns for the quarter and the vast majority saw
double digit returns. Sector performance was broadly
positive as well, although energy stock returns were more
tepid. Markets were bolstered by government programs,
as the European Commission announcing $2.7 trillion in
support while Japan has committed approximately $2.1
trillion to fiscal stimulus. Despite these programs, the near
-term macro outlook remains poor, as Eurozone GDP is
forecasted to have dropped double digits during Q2.
Emerging markets outpaced the developed
international space, but lagged the US market. Similar to
other regions, value stocks underperformed growth, while
small-cap outperformed large-cap stocks. All emerging
countries and sectors saw positive returns for the quarter.
Latin America, a laggard in Q1, experienced a reversal,
with countries such as Brazil and Argentina leading the
region higher. This trend materialized despite Brazil now
having the second-highest infection and death rate from
Q2 2020 Q1 2020 Q4 2019 10 Year Average
Federal Funds Rate 0.08% 0.08% 1.55% 0.64%
Treasury - 1 Year 0.16% 0.17% 1.59% 0.76%
Treasury - 10 Year 0.66% 0.70% 1.92% 2.28%
Treasury - 30 Year 1.41% 1.35% 2.39% 3.05%
Breakeven Inflation - 5 Year 1.17% 0.53% 1.70% 1.72%
Breakeven Inflation - 10 Year 1.34% 0.93% 1.79% 1.95%
Breakeven Inflation - 30 Year 1.56% 1.25% 1.81% 2.08%
Barclays US Corp: Hi Yld Index - OAS 6.26% 8.80% 3.36% 4.80%
Capacity Utilization 64.80% 72.72% 77.10% 76.72%
Unemployment Rate 11.10% 4.40% 3.50% 6.15%
ISM PMI - Manufacturing 52.60% 49.10% 47.80% 53.76%
Baltic Dry Index - Shipping 1,799 626 1,090 1,155
Consumer Confidence (Conf. Board) 98.10 118.80 128.20 94.33
CPI YoY (Headline) 0.60% 1.50% 2.30% 1.73%
PPI YoY - Producer Prices -2.20% -0.90% 1.90% 1.52%
US Dollar Total Weighted Index 120.86 122.82 114.72 103.65
WTI Crude Oil per Barrel $39 $20 $61 $70
Gold Spot per Ounce $1,781 $1,577 $1,517 $1,373
Asset Class Commentary
RVK Capital Markets Review
3 © 2020 RVK, Inc.
COVID-19 in the world. During the quarter, Brazil went
from having fewer than 6,000 reported cases to well over
one million.
Fixed Income
The Bloomberg US Aggregate Bond Index had
another relatively strong quarter, returning 2.9% in Q2. In
contrast to Q1, investor appetite for risk returned, leading
to a strong recovery in credit. Meanwhile, US Treasury
yields saw little movement across the curve. It was a
weak quarter for government bonds as all short and
intermediate maturities were yielding below 1%.
Corporate debt provided the main narrative for Q2. A
supportive Fed helped propel the beginning of a recovery
that saw few periods of slowdown throughout the quarter.
While a spike in COVID-19 cases threatened to disrupt
the rally in June, a better-than-expected jobs report and
the Fed’s announcement of its plan to purchase
corporate bonds helped the segment finish the quarter on
a positive note.
BBB-rated bond returns led all investment grade
credit, even as the total of “fallen angels” (companies
formerly rated as investment grade downgraded to high
yield) already surpassed the previous full-year record
high in 2009 based on data from J.P. Morgan. Some of
these fallen angels helped bolster high-yield returns in Q2
as spreads narrowed, briefly dipping below 600 basis
points in late June for the first time since early March.
While the lowest-rated debt made a comeback late in the
quarter, it lagged early on, perhaps indicating some
hesitation by investors to go too far down in quality amid
continued market uncertainty. Overall, the Bloomberg US
Credit Index and US High Yield Index returned 8.2% and
10.2% in Q2, respectively.
Emerging market debt enjoyed its own rally, erasing
most of its losses from the first quarter. Central banks
around the world have provided extensive stimulus, and
the gradual reopening of economies has helped investors
restore confidence in the sector. The JPMorgan EMBI
Global Diversified Index returned 12.3%, with nearly
every country in the index having positive returns.
Diversified Hedge Funds
Broad hedge fund benchmarks indicate the industry
recovered relatively well from Q1 drawdowns. The HFRI
Fund Weighted Composite Index is down -3.5% YTD
after a 9.0% gain in Q2, led higher by the HFRI Hedged
Equity Index, which finished the quarter up 13.6%. In
contrast, strategies that pursue event-oriented and
special situations strategies, particularly within credit
markets, were down from -5% to -7% YTD on average.
Managers who pursue less directional strategies within
the relative value or market-neutral equity spaces lagged
in Q2 as the market recovered, but are some of the better
performing strategies YTD, down approximately -1%
according to HFR. The only broad index category in
positive territory is Thematic Macro, up 2.6% YTD after a
5.0% gain in Q2.
Strategies that RVK follows closely have performed
significantly better than indices would imply. Multi-PM
platforms that focus on alpha generation, as opposed to
directional market bets, held up in well during Q1, and
produced gains in the mid-single digits to mid-teens in
Q2. This is a spectacular run of alpha generation for
managers who maintain market neutrality. Gains have
been widespread across fundamental equity trading,
index rebalancing, fixed income arbitrage, quantitative
equity, and other core strategies. Other event-oriented
managers are marginally positive YTD on average after
posting Q2 returns in the 5% to 10% range.
Within the Equity Long/Short (ELS) space,
managers captured a good amount of upside via alpha
generation on the long side of their portfolios in Q2. RVK
has seen managers it follows gradually add exposure to
higher-quality cyclical companies in recent months, and
has noted elevated exposure across the technology,
communications, and healthcare sectors. In aggregate,
prime brokerage data indicate that ELS managers have
added to net exposures recently, while reducing gross
back toward the 20th percentile over the trailing 12
months. Exposure to crowded long names has persisted,
which is a factor RVK continues to monitor with its current
favored managers.
RVK Capital Markets Review
4 © 2020 RVK, Inc.
Global Tactical Asset Allocation (GTAA)
GTAA managers largely provided positive absolute
returns during Q2. Even with positive absolute returns,
long-biased strategies reported mixed performance
versus a static and less diversified blend of 60% US
equity and 40% US fixed income. Long-biased strategies
that had relatively weaker performance versus peers
tended to have more exposure to emerging market
equities, which slightly underperformed US and other
developed markets. Within emerging market equities,
growth equities once again outpaced value by a
significant margin as the MSCI Emerging Market Growth
Index returned 22.2% versus 14.0% for the MSCI
Emerging Market Value Index. This trend detracted from
the performance of managers tilted toward value stocks
within emerging markets. In some cases, managers that
underperformed on a relative basis also reduced their
beta exposure to some degree during the quarter as
equity markets began to rebound following the lows seen
in March. Though these strategies lagged, they still saw
positive absolute returns during the quarter. Multi-asset
managers that intend to provide reduced correlations,
lower volatility, and less market sensitivity mostly
underperformed long-biased GTAA managers. However,
strategies within this group that saw stronger relative
returns held idiosyncratic positions, such as long
exposure to Ukraine, Egypt, and South Africa, which
contributed to returns.
Diversified Inflation Strategies (DIS)
Performance across DIS managers that RVK tracks
closely was largely positive during Q2, with returns
ranging from the high-single digits to the high-teens. Due
to relatively strong performance across a number of risk
assets, managers with larger TIPS allocations tended to
underperform peers as generally riskier assets saw a
bounce back from poor Q1 performance. However,
managers with relatively larger TIPS allocations have still
generally outperformed peers YTD. Strong performing
strategies in Q2 also tended to hold higher relative
allocations to commodities. Though commodities did not
keep up with other segments of the market, it did provide
positive absolute returns in Q2. DIS managers that saw
relatively stronger performance also generally held higher
allocations to REITs, global listed infrastructure, and/or
global natural resource equities in varying proportions.
Inflation, as measured by the year-over-year change in
headline CPI, decreased over the quarter from 1.50% in
March to 0.60% as of June 30. As viewed through
monthly CPI releases, April and May both reported slight
decreases in inflation with June seeing an increase, in
part due to higher gasoline and food prices. Additionally,
10-year Treasury break-evens, a market-based measure
of future inflation expectations, increased over the quarter
from 0.93% to 1.34%.
Real Estate
Core private real estate returned -1.6% during the
second quarter (on a preliminary basis) as reported by
the NCREIF ODCE Index, with the total return comprised
of 0.9% from income and -2.5% from price appreciation.
While the income component remained relatively healthy
and in line with historical levels, price appreciation
experienced a further meaningful decrease following the
prior quarter’s negative return. Investors in publicly traded
real estate regained some ground during the second
quarter and outperformed their private market
counterparts by a wide margin. Publicly traded real estate
delivered a second quarter total return of 14.0%, as
measured by the FTSE NAREIT All REITs Index. This
level of quarterly return volatility is to be expected given
the high level of correlation between REITs and public
equity markets.
While the total return for core private real estate was
negative, it did beat many expectations going into the
quarter, as much of the impact from COVID-19 remains
unknown. There was considerable uncertainty regarding
the level of rent collections across property sectors,
beginning with those due in April. As the second quarter
progressed, trends started to emerge. Unsurprisingly, the
hospitality and retail sectors fared the worst due to
shelter-in-place orders. Other sectors, such as industrials
and multifamily, have performed in-line with expectations.
Industrials were bolstered by increased demand from
online consumer spending, while multifamily was stable
due to the necessity-based attributes of the sector. It is
also worth highlighting that transaction activity, which is a
key input in the appraisal process, was scarce in Q2.
Much of the negative price appreciation reported by
managers stemmed from reduced income growth
assumptions and increased reserves for credit losses as
opposed to cap rate expansion.
This document was prepared by RVK, Inc. (RVK) and may include information and data from Bloomberg, Morningstar
Direct, eVestment.com, NCREIF, and Preqin. While RVK has taken reasonable care to ensure the accuracy of the infor-
mation or data, we make no warranties and disclaim responsibility for the inaccuracy or incompleteness of information or
data provided or for methodologies that are employed by any external source. This document is not intended to convey
any guarantees as to the future performance of investment products, asset classes, or capital markets.
Disclaimer
RVK is one of the ten largest consulting firms in the US (as defined by Pension & Investments) and
received a noteworthy award in 2018 as it was named a Quality Leader among large US consultants
by independent research firm, Greenwich Associates. RVK’s diversified client base of over 190
clients covers 30 states and includes endowments, foundations, corporate and public defined benefit
and contribution plans, Taft-Hartley plans, and high-net-worth individuals and families. The firm is
independent, employee-owned, and derives 100% of its revenues from investment consulting
services.
5 © 2020 RVK, Inc.
1Between July and October 2019, Greenwich Associates conducted interviews with 1,100 individuals at 896 of the largest tax-exempt funds in the US–
including corporate and union funds, public funds, endowments and foundations–with either pension or investment pool assets greater than $150 mil-
lion. Study participants were asked to provide quantitative and qualitative evaluations of their asset managers and investment consultants, including
qualitative assessments of those firms soliciting their business and detailed information on important market trends. RVK is one of three firms recog-
nized in the large investment consultant category. The ratings may not be representative of any one client’s experience with RVK; rather they are rep-
resentative of those clients submitted and that chose to participate in the survey. The results are not indicative of RVK’s future performance.
To read the Greenwich article, please refer to the following URL: https://www.greenwich.com/asset-management/five-factors-distinguish-best-class-
consultants-average-practitioners
For more information about RVK, please refer to the following URL: https://www.rvkinc.com/about/about.php
RVK was founded in 1985 to focus exclusively on investment consulting and today employs over 100
professionals. The firm is headquartered in Portland, Oregon, with regional offices in Boise, Chicago, and New
York City. RVK is one of the ten largest consulting firms in the US, as reported by Pensions & Investments' 2019
Special Report – Consultants. Additionally, RVK received a notable award in April 2020 when it was named a
Greenwich Quality Leader among large US investment consultants, based upon Greenwich Associates' 2019
study. Greenwich is an industry-recognized third-party firm which asks plan sponsors to rank their consultants
on a series of key metrics. Notably, RVK is the only firm among large US consultants to receive an award for
a third consecutive year.1 RVK’s diversified client base of over 190 clients covers 30 states, and covers
endowments, foundations, corporate and public defined benefit and contribution plans, Taft-Hartley plans, and
high-net-worth individuals and families. The firm is independent, employee-owned, and derives 100% of its
revenues from investment consulting services.