The Theory of Capital Markets Rational Expectations and Efficient Markets.

Capital Markets Expectations
Lessons From the Past
Thoughts About the Future
Examining Historical Capital Markets Returns
» Past is Not Prologue:
» Past Returns are Best when Future Returns are Worst
» Market Yields Predict Future Performance
Looking to the Future
» The “3-D” Hurricane: Our Debt, Demographics and Deficit
Where are the Opportunities Today?
» What are the Near-Term Opportunities and Headwinds?
» Our Asset Allocation Recommendations
2
3
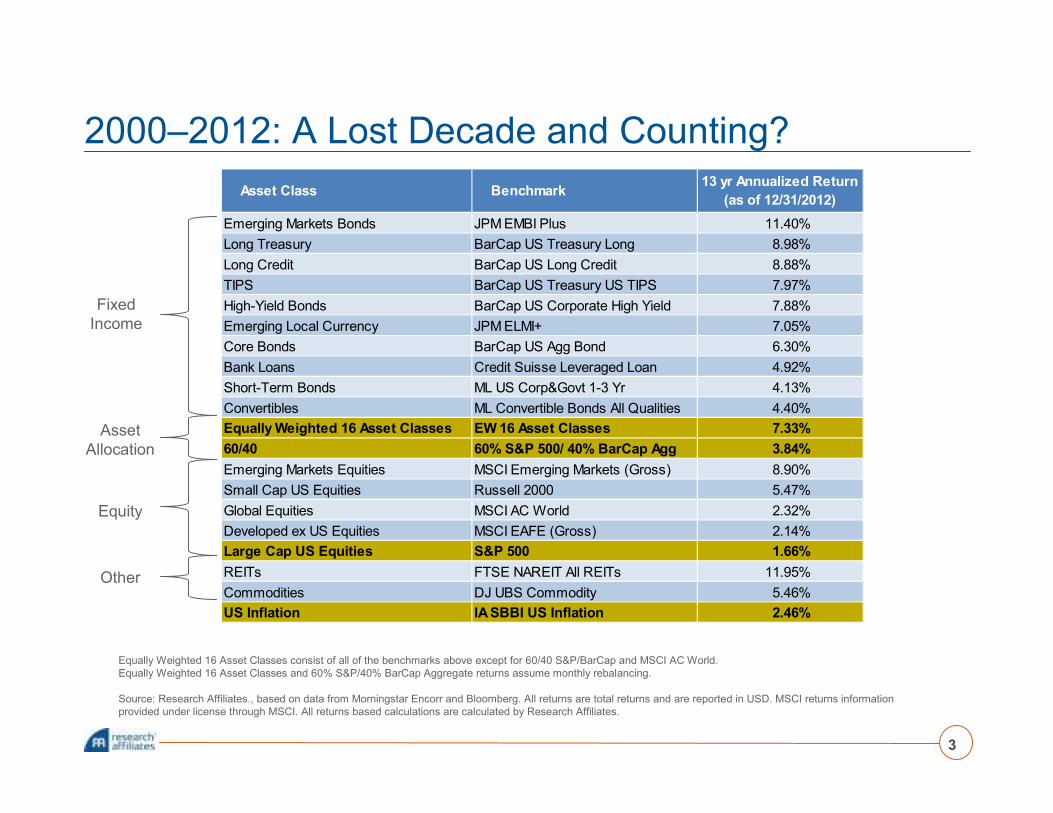
Equally Weighted 16 Asset Classes consist of all of the benchmarks above except for 60/40 S&P/BarCap and MSCI AC World.
Equally Weighted 16 Asset Classes and 60% S&P/40% BarCap Aggregate returns assume monthly rebalancing.
Source: Research Affiliates., based on data from Morningstar Encorr and Bloomberg. All returns are total returns and are reported in USD. MSCI returns information
provided under license through MSCI. All returns based calculations are calculated by Research Affiliates.
2000–2012: A Lost Decade and Counting?
Fixed
Income
Asset
Allocation
Equity
Other
Asset Class Benchmark13 yr Annualized Return
(as of 12/31/2012)
Emerging Markets Bonds JPM EMBI Plus 11.40%
Long Treasury BarCap US Treasury Long 8.98%
Long Credit BarCap US Long Credit 8.88%
TIPS BarCap US Treasury US TIPS 7.97%
High-Yield Bonds BarCap US Corporate High Yield 7.88%
Emerging Local Currency JPM ELMI+ 7.05%
Core Bonds BarCap US Agg Bond 6.30%
Bank Loans Credit Suisse Leveraged Loan 4.92%
Short-Term Bonds ML US Corp&Govt 1-3 Yr 4.13%
Convertibles ML Convertible Bonds All Qualities 4.40%
Equally Weighted 16 Asset Classes EW 16 Asset Classes 7.33%
60/40 60% S&P 500/ 40% BarCap Agg 3.84%
Emerging Markets Equities MSCI Emerging Markets (Gross) 8.90%
Small Cap US Equities Russell 2000 5.47%
Global Equities MSCI AC World 2.32%
Developed ex US Equities MSCI EAFE (Gross) 2.14%
Large Cap US Equities S&P 500 1.66%
REITs FTSE NAREIT All REITs 11.95%
Commodities DJ UBS Commodity 5.46%
US Inflation IA SBBI US Inflation 2.46%

4
Source: Research Affiliates., based on data from Morningstar Encorr and Bloomberg.
Salvaging a Lost Opportunity… In Hindsight
2.46%
1.66%
3.84%
6.76%
7.33%
8.59%
0%
2%
4%
6%
8%
10%
IA SBBI US Inflation S&P 500 60% S&P 500/ 40%
Barclays Agg
60% FTSE RAFI US
1000 / 40% Barclays
Agg
EW 16 Asset Classes EW 16 Assets
Classes - RAFI
Equities
Annualized
Retu
rn
13 Year Annualized Returns as of 12/31/2012
13-Year
Negative Real
Return
Adding Fixed
Income
Replacing 60%
Cap Equity w/
RAFI
Diversify Broadly
(Cap Wtd
Equities)
Diversify Broadly
(RAFI Wtd
Equities)

0
2
4
6
8
10
12
14
16
18
0
2
4
6
8
10
12
14
16
18
Perc
en
t (%
)
Perc
en
t (%
)
BarCap US Aggregate Bond Total Return USD Forward 10-Year Return
BarCap US Aggregate Bond Yield USD (%Yield)
Source: Research Affiliates based on data from Ibbotson and Barclays Capital as of March 31, 2013.
Bond Market Returns Follow Yields
Future long-term bond returns closely follow entry yield
Very strong relationship between
starting yield and future 10-year total
return: Correlation of 0.90.
5

*Actual S&P return (Ibbotson).
As of March 31, 2013.
Source: Ibbotson, Research Affiliates based on data from Ibbotson and Robert Shiller of Yale.
Forward Stock Returns Set to be Less than Past
» 30-year returns of S&P 500 stocks: 11%!*
» Should we expect that for the next decade?? No!
6
3.1% 3.0%
4.2%
2.7%
1.9%
2.0%
0.8% 3.1%
0.0%
2.0%
4.0%
6.0%
8.0%
10.0%
12.0%
Return DecompositionSince 1926: Mar-2013
30-Year ReturnDecomposition: Mar-2013
Reasonable ForwardExpectations
Valuation Expansion
Real Earnings Growth
Dividends
Inflation
~ 2.5%
~ 2%
~ 1.5%
6%
10%
11%

Source: Research Affiliates, LLC., based on data from Robert Shiller and the Bureau of Economic Analysis.
Long-Term Real Growth in EPS Follows
Per Capita GDP, not Headline GDP
7
Long-Term Real Growth, 10-Year Rolling Averages
1870 1880 1890 1900 1910 1920 1930 1940 1950 1960 1970 1980 1990 2000 2010
Log
Sca
le
GDP = 3.4%
PC GDP = 1.9%
EPS = 1.7%
Earnings per share grow less than GDP.
New companies are formed and new shares
issued as the population grows.
EPS growth is just below per capita GDP growth.

Source: Research Affiliates, LLC., based on data from the BEA, Corporate Profits with Inventory Valuation and Capital Consumption Adjustments divided by GDP
Seasonally Adjusted at Annual Rates. As of March 31, 2013.
Corporate Profit Margins Are Near All Time Highs
5%
6%
7%
8%
9%
10%
11%
12%
13%
14%
1948 1953 1958 1963 1968 1973 1978 1983 1988 1993 1998 2003 2008 2013
Corporate Profits as a Percentage of GDP (1948 - 2013Q1)
Current level of 12.7% back to
the historical average of 9.6%
would mean a 25% collapse in
corporate earnings.
Historical Average: 9.6%

*Data as of March 31, 2013.
Sources: Research Affiliates, based on data from Robert Shiller, Federal Reserve, and BEA.
Past Average Return of 60/40 Portfolio = 7.1%
Current Expected Return of 60/40 Portfolio = 4.2%
Beginning Real Expected Beginning Expected Realized Expected
Dividend Long-Term Implied Equity Bond 60/40 60/40 Minus
Decades Yield EPS Growth Inflation Return Yield Return Return Realized
1871 - 1880 5.9% 2.0% 2.4% 10.6% 5.3% 8.5% 8.3% -0.2%
1881 - 1890 4.5% 2.0% 0.8% 7.4% 3.7% 5.9% 3.1% -2.8%
1891 - 1900 4.8% 2.0% 0.5% 7.4% 3.4% 5.8% 6.9% 1.1%
1901 - 1910 4.4% 2.3% 0.0% 6.7% 2.9% 5.2% 5.7% 0.6%
1911 - 1920 5.2% 2.3% 0.4% 8.1% 3.3% 6.2% 2.9% -3.3%
1921 - 1930 7.5% 0.5% 2.8% 11.0% 5.7% 8.9% 11.6% 2.7%
1931 - 1940 6.3% 1.1% 0.1% 7.5% 3.0% 5.7% 3.9% -1.8%
1941 - 1950 6.4% 1.2% -1.3% 6.2% 1.6% 4.3% 8.6% 4.2%
1951 - 1960 7.4% 1.6% -0.7% 8.4% 2.2% 5.9% 10.6% 4.7%
1961 - 1970 3.4% 1.4% 0.9% 5.8% 3.8% 5.0% 6.3% 1.2%
1971 - 1980 3.5% 1.4% 3.5% 8.6% 6.4% 7.7% 6.9% -0.9%
1981 - 1990 4.6% 1.5% 9.9% 16.8% 12.8% 15.2% 14.3% -0.9%
1991 - 2000 3.7% 1.3% 5.2% 10.5% 8.1% 9.5% 14.4% 4.8%
2001 - 2010 1.2% 1.7% 2.3% 5.3% 5.2% 5.3% 3.8% -1.5%
Average 4.9% 1.6% 1.9% 8.6% 4.8% 7.1% 7.6% 0.6%
Current* 2.1% 1.3% 2.5% 5.9% 1.8% 4.2%

Looking to the future
� A 3-D Hurricane:
our deficit, debt, and demographics

-5%
0%
5%
10%
15%
20%
-5%
0%
5%
10%
15%
20%
195
3
195
5
195
7
195
9
196
1
196
3
196
5
196
7
196
9
197
1
197
3
197
5
197
7
197
9
198
1
198
3
198
5
198
7
198
9
199
1
199
3
199
5
199
7
199
9
200
1
200
3
200
5
200
7
200
9
201
1
Official Deficit ∆debt/GDP ∆debt+GSE GAAP Deficit, Incl Entitl.
25-Year Averages, as % of GDP:Federal Fiscal Deficit: 3.0%Change in National Debt: 5.0%Change in National + GSE Debt: 7.9%Change in Debt + Entitlements: 15.3%(Excluding 2003 Adoption of Medicare "D")
Medicare "A" Adopted →
Medicare "D" Adopted →
Medicare "B" Adopted →
11
Source: Research Affiliates, based on data and projections from the U.S. Treasury Department. Through 2012 Q4.
What’s the True Deficit? Under GAAP Accounting,
Far Higher Than Official Statistics
The Debt and the Deficit: Comparing the Deficit with the Growth of
the National Debt, GSE Debt, and Unfunded Entitlements
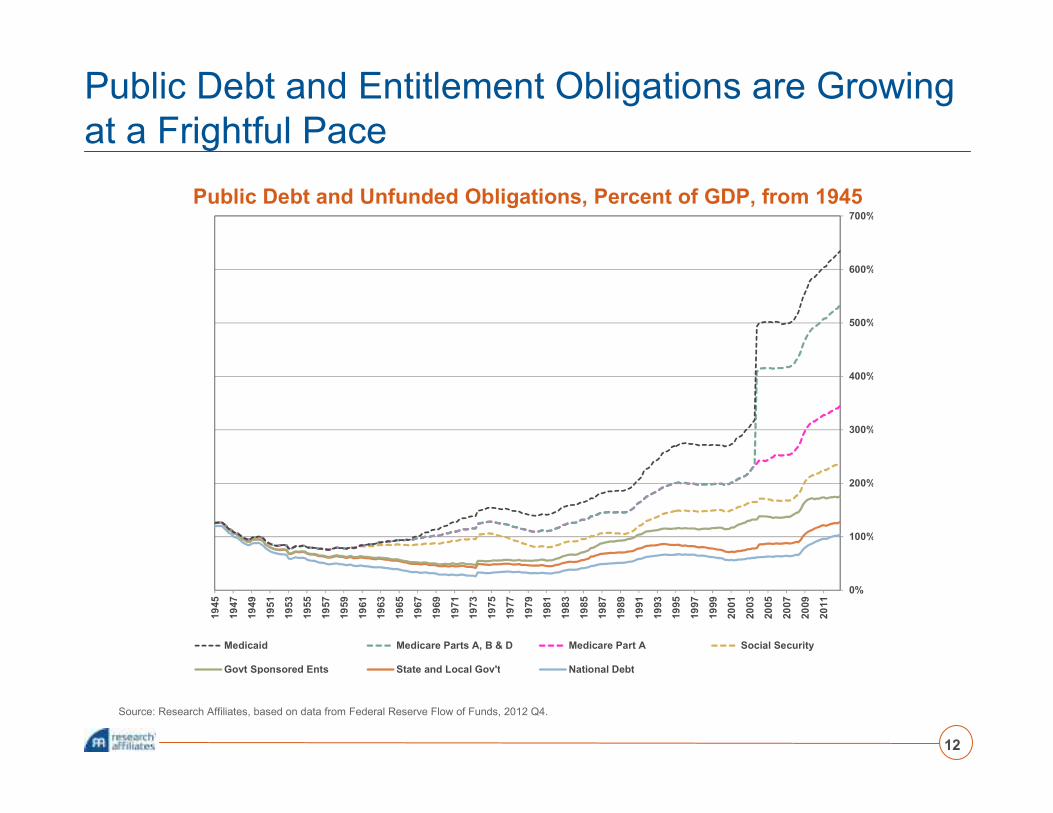
0%
100%
200%
300%
400%
500%
600%
700%19
45
19
47
19
49
19
51
19
53
19
55
19
57
19
59
19
61
19
63
19
65
19
67
19
69
19
71
19
73
19
75
19
77
19
79
19
81
19
83
19
85
19
87
19
89
19
91
19
93
19
95
19
97
19
99
20
01
20
03
20
05
20
07
20
09
20
11
Medicaid Medicare Parts A, B & D Medicare Part A Social Security
Govt Sponsored Ents State and Local Gov't National Debt
12
Source: Research Affiliates, based on data from Federal Reserve Flow of Funds, 2012 Q4.
Public Debt and Entitlement Obligations are Growing
at a Frightful Pace
Public Debt and Unfunded Obligations, Percent of GDP, from 1945

13
Source: Research Affiliates, based on data from CIA World Fact Book 2010, International Monetary Fund. Note: RAFI® Scale is defined as the equal weighted average of
four measures of a country’s ability to repay its debt obligations: capital (GDP), labor (population), resources (land mass), and energy (energy consumption). This average is
compared to the amount of a country’s net debt outstanding to determine its overall debt service capability relative to the rest of the world.
Comparing Debt Levels:
Developed vs. Emerging CountriesNet Debt / Debt Service Capacity, Relative to World Average
Excludes All Off-Balance-Sheet Debt and Entitlement Programs
Net Debt is More than Double Debt Capacity Net Debt is less than 20% of Debt Capacity Negative Net Debt

14
Source: Research Affiliates, based on data from U.S. Census, United Nations.
And Demographics Won’t Make This
Any Easier in the Years AheadG8 versus BRIC Economies

Source: Research Affiliates, LLC, based on data from CIA World Fact Book 2012, International Monetary Fund, Penn World Table, World Bank.
Rising Debt Goes Hand in Hand With Slow Growth
Spanning 30 Countries and 30 Years, 1982–2011
Does More Debt Help After a Year or Two?
No, Dr. Krugman, It Does Not!
-12
-9
-6
-3
0
3
6
9
12
15
-15 -10 -5 0 5 10 15 20
On
e Y
ear
Real
GD
P G
row
th (
%)
Concurrent Growth in External Debt (%)
Developed Countries G5 CountriesEmerging Countries Linear (Developed Countries)
Correl = -0.59
-12
-9
-6
-3
0
3
6
9
12
15
-15 -10 -5 0 5 10 15 20
On
e Y
ea
r R
eal
GD
P G
row
th, fr
om
t t
o t
+1 (
%)
Growth in External Debt, t-1 to t (%)
Developed Countries G5 Countries Emerging Countries Linear (Developed Countries)
Correl = -0.25
-12
-9
-6
-3
0
3
6
9
12
15
-15 -10 -5 0 5 10 15 20
On
e Y
ea
r R
eal G
DP
Gro
wth
, fr
om
t +
1to
t+
2 (
%)
Growth in External Debt, t-1 to t (%)
Developed Countries G5 Countries Emerging Countries Linear (Developed Countries)
Correl = -0.02

16
Source: Research Affiliates, based on data from United Nations, Penn World Table, and Global Financial Data.
Relationship between GDP Growth and Demographic
Composition (R2 = 0.30), Net of Valuation Effects
GDP Growth and Demographic Shares
Demographic
Sweet Spot: Fastest
GDP Growth, Age 20–44
Demographic
Trouble,
Age 55 & Up
Terrible
Twos

Recap of the headwinds and investment implications
» Our Debt burden must be addressed:
» Pay the debt, abrogate, or reflate
» Demographic aging slows real GDP growth
» Slower labor force growth and an aging labor force, both hurt GDP growth
» 2.7% past 50 years, 1% is far more likely. New Normal, Indeed!
» Most investors over rely on two “pillars,” stocks and bonds
» Both pillars, already weakened by low yield, crumble with inflation
» Investors urgently need to establish a “Third Pillar”
» Diversifying into EM and alternative markets
» Seek markets with higher yield or growth or both
» Focus on markets that can hedge our inflation risk
17

Three (or Four) Paths to Improved Return Potential
Consider Other Asset Classes
» Stocks and bonds are not the only choices
» “Unconventional assets” may at times be priced to offer better return
potential
Seek Alpha
» Conservatively, focusing on avoiding negative alpha, or
» Aggressively, if you have confidence in the opportunities
Actively Manage the Asset Mix
» Include alternative markets in these decisions
» Seek assets which are out of favor, priced for better returns
We Believe All Three Paths Can Be Pursued in Parallel!
Our fourth set of tools – modest leverage and shorting – may enhance
portfolio efficiency by amplifying some risks while reducing others
18

Where are the opportunities today?
� Building a third pillar

20
Long treasury: Barclays U.S. Long Treasury; Core fixed income: Barclays U.S. Aggregate Index; Long credit: Barclays U.S. Long Credit; Short-term bonds: Barclays U.S.
Aggregate 1-3 yrs; Large cap U.S. equities: S&P 500; Emerging market bonds: JPM EMBIG Diversified; Developed ex U.S. equities: MSCI EAFE (Gross); Small cap U.S.
equities: Russell 2000; Emerging market equities: MSCI Emerging Markets (Gross); REITs: FTSE NAREIT All REITs; Local currency EM: JPMorgan ELMI+; TIPS: Barclays
U.S. TIPS; High yield: Barclays U.S. Corporate High Yield; Bank loans: Credit Suisse Leveraged Loan Index; Commodities: DJ UBS Commodity Total Return Index
Source: Research Affiliates, LLC., based on data from Bloomberg and Encorr.
Identifying “Stealth Inflation Fighters” to Build a
Third Pillar
-0.8 -0.6 -0.4 -0.2 0.0 0.2 0.4 0.6
Commodities
Bank Loans
REITs
Convertibles
High Yield
Emg Mkts Equities
Small Cap US Equities
Developed ex US Equities
Large Cap US Equities
Local Currency EM
Emg Mkts Bonds
TIPS
Long Credit
Long Treasury
Core Fixed Income
Short Term Bonds
Quarterly Correlation of real returns to U.S. Inflation, March 1997 - March 2013
21
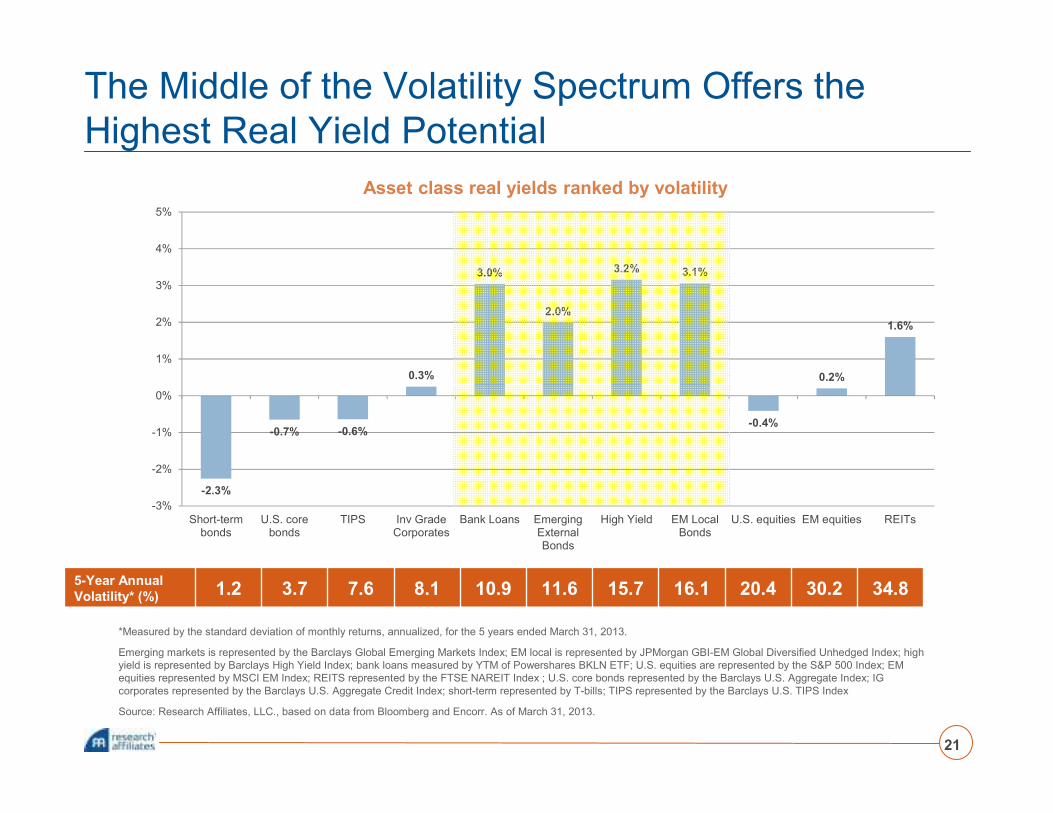
*Measured by the standard deviation of monthly returns, annualized, for the 5 years ended March 31, 2013.
Emerging markets is represented by the Barclays Global Emerging Markets Index; EM local is represented by JPMorgan GBI-EM Global Diversified Unhedged Index; high
yield is represented by Barclays High Yield Index; bank loans measured by YTM of Powershares BKLN ETF; U.S. equities are represented by the S&P 500 Index; EM
equities represented by MSCI EM Index; REITS represented by the FTSE NAREIT Index ; U.S. core bonds represented by the Barclays U.S. Aggregate Index; IG
corporates represented by the Barclays U.S. Aggregate Credit Index; short-term represented by T-bills; TIPS represented by the Barclays U.S. TIPS Index
Source: Research Affiliates, LLC., based on data from Bloomberg and Encorr. As of March 31, 2013.
The Middle of the Volatility Spectrum Offers the
Highest Real Yield Potential
5-Year Annual
Volatility* (%) 1.2 3.7 7.6 8.1 10.9 11.6 15.7 16.1 20.4 30.2 34.8
-2.3%
-0.7% -0.6%
0.3%
3.0%
2.0%
3.2% 3.1%
-0.4%
0.2%
1.6%
-3%
-2%
-1%
0%
1%
2%
3%
4%
5%
Short-termbonds
U.S. corebonds
TIPS Inv GradeCorporates
Bank Loans EmergingExternalBonds
High Yield EM LocalBonds
U.S. equities EM equities REITs
Asset class real yields ranked by volatility
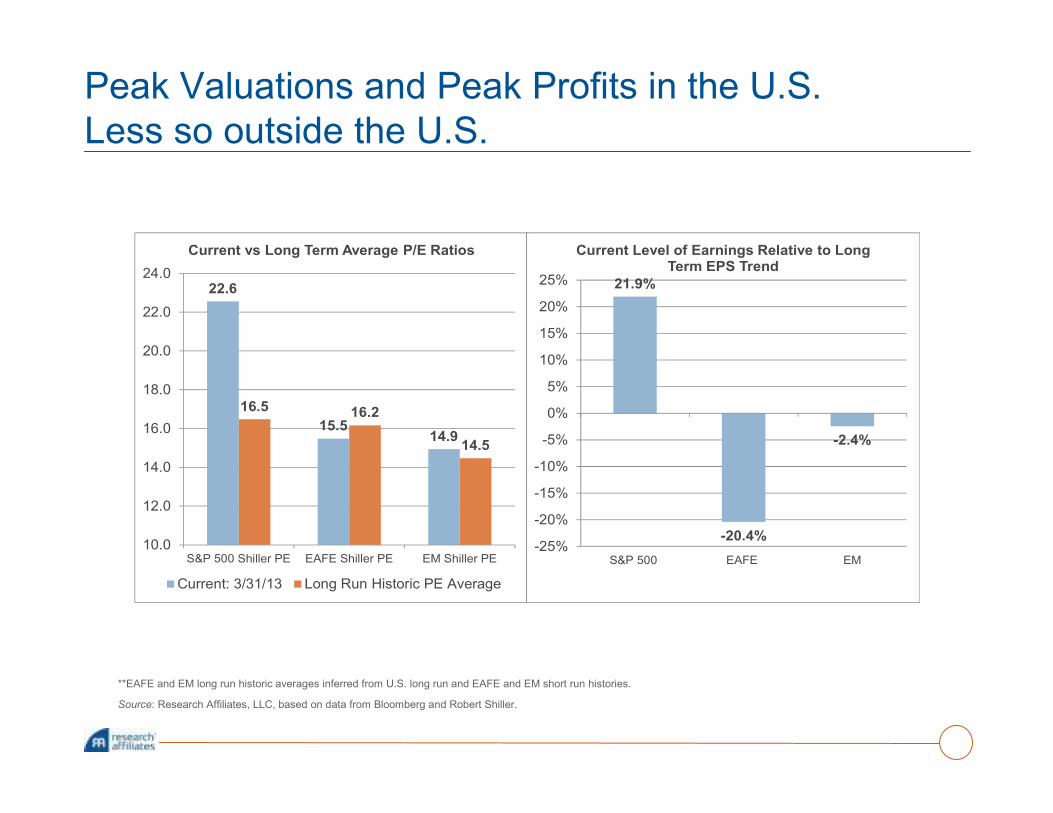
**EAFE and EM long run historic averages inferred from U.S. long run and EAFE and EM short run histories.
Source: Research Affiliates, LLC, based on data from Bloomberg and Robert Shiller.
Peak Valuations and Peak Profits in the U.S.
Less so outside the U.S.
22.6
15.514.9
16.5 16.2
14.5
10.0
12.0
14.0
16.0
18.0
20.0
22.0
24.0
S&P 500 Shiller PE EAFE Shiller PE EM Shiller PE
Current vs Long Term Average P/E Ratios
Current: 3/31/13 Long Run Historic PE Average
21.9%
-20.4%
-2.4%
-25%
-20%
-15%
-10%
-5%
0%
5%
10%
15%
20%
25%
S&P 500 EAFE EM
Current Level of Earnings Relative to Long Term EPS Trend

*Include 23 DM and 14 EM bond issuers, where data are available; countries are defined by the IMF. High debt countries is defined by >70% debt-to-GDP; low debt defined
by <40% debt-to-GDP.
**We removed one large outlier from each sample to avoid data skewness.
Note: Debt : GDP figures are as of 12/31/2011. All other data as of 3/31/2013.
Source: Research Affiliates, LLC, based on data from Bloomberg, the Yield Book, and the IMF.
EM vs. Developed Sovereign Bonds
Who has the debt servicing capacity?
Debt : GDP
Yield to
Maturity
5-Year CDS
Spread Credit Rating
Country Groups*
High Debt Countries 101.5% 2.0% 1.3% AA
Low Debt Countries 30.1% 4.4% 0.9% A+/A
Developed vs. Emerging**
Developed Market 77.2% 1.8% 0.8% AA+/AA
Emerging Market 39.3% 4.8% 1.1% A-

24
Source: Research Affiliates., based on data from Bloomberg.
Fundamental Index Strategies:
Eliminating the Performance Drag of Cap-Weight
4/30/2013 3 Month 1 Year 3 Year Since Launch* Launch Date
FTSE RAFI All World 3000 4.8% 18.6% 8.3% 15.1% 10/6/2008
MSCI All World 4.9% 15.7% 9.3% 13.6%
Value Added -0.1% 2.9% -1.0% 1.5%
FTSE RAFI US 1000 8.2% 22.5% 13.1% 7.4% 11/28/2005
Russell 1000 7.2% 17.2% 12.9% 5.8%
Value Added 1.1% 5.3% 0.2% 1.6%
FTSE RAFI US MS 1500 5.4% 18.8% 10.7% 8.0% 5/4/2006
Russell 2000 5.4% 17.7% 11.3% 5.5%
Value Added 0.0% 1.1% -0.6% 2.5%
FTSE RAFI Developed ex-US 1000 3.4% 18.5% 5.3% 5.1% 11/28/2005
MSCI EAFE 5.3% 20.0% 8.0% 4.6%
Value Added -1.9% -1.4% -2.6% 0.5%
FTSE RAFI Dev. ex-US MS 1500 5.1% 15.2% 7.9% 3.6% 8/6/2007
MSCI EAFE Small 6.9% 18.3% 9.4% 1.0%
Value Added -1.7% -3.1% -1.5% 2.6%
FTSE RAFI Emerging Markets -4.1% 1.2% 2.0% 2.5% 7/9/2007
MSCI Emerging Markets -2.2% 4.3% 3.4% 1.4%
Value Added -1.9% -3.1% -1.4% 1.1%
Note: The index version of the RAFI methodology, or the FTSE RAFI Indexes, is licensed globally by our partner the FTSE Group. All returns are Total Returns in USD. This material relates only to
a hypothetical model of past performance of the Fundamental Index strategy itself, and not to any asset management products based on this index. No allow ance has been made for trading
costs or management fees w hich w ould reduce investment performance. Actual results may dif fer. Indexes are not managed investment products, and, as such cannot be invested in directly.
Returns represent performance based on rules used in the creation of the index, are not a guarantee of future performance and are not indicative of any specific investment. Returns listed
prior to the individual indexes launch dates are simulated.
*Launch date returns are calculated using the f irst full month of returns follow ing index inception.
MSCI returns information provided under license through MSCI. All returns based calculations are calculated by Research Affiliates, LLC.

Source: Research Affiliates, LLC, and Morningstar Encorr. From “The Rationale for Global Tactical Asset Allocation,” Investments & Wealth Monitor, John West and Rob
Arnott, November/December 2009. The illustration is of a six asset class portfolio including stocks (S&P 500 Index), bonds (Barclays Aggregate), high yield bonds (Barclays
Corporate High Yield), emerging market bonds (JPM EMBI+), REITs (FTSE NAREIT), and TIPS (Barclays U.S. TIPS). These figures are optimized using Encorr based on
target standard deviations. The asset class expected returns are based on our building block approach of beginning yield + real growth + inflation – defaults.
Crisis Brings Opportunity – Be Tactical
5.5%
9.5%
10.5%
3.5%
4.5% 4.6%
3%
4%
5%
6%
7%
8%
9%
10%
11%
5% 6% 7% 8% 9% 10% 11% 12% 13%
An
nu
ali
ze
d R
eal
Retu
rn
Annualized Standard Deviation
Expected Portfolio Real Return at 6%, 9% & 12% Volatility
2/27/2009
7/31/2008

26
Past performance is no guarantee of future results. Emerging Markets Stocks represented by MSCI Emerging Markets Gross Index. Commodities represented by Dow Jones
UBS/AIG Commodity Index. REITS represented by Wilshire REIT Index. Emerging Markets Bonds represented by JP Morgan Emerging Markets Bond Index Global. TIPS
represented by Barclays U.S. TIPS Index. High Yield Bonds represented by Merrill Lynch High Yield Master II Index. Long Term Govt Bonds represented by Barclays Long-
Term Treasury Index. Mortgage Bonds represented by Barclays Mortgage Index. Convertible Bonds represented by Merrill Lynch ALL US Convertible Securities Index.
Unhedged Foreign Bonds represented by Citigroup World ex-U.S. Government Bond Index. Money Markets represented by Citigroup 3-Month T-Bill Index. Intl Stocks
represented by MSCI EAFE Gross Index. S&P 500 Equal Weighted (SPEW) reflects the performance of the S&P 500 Index with component stocks equally weighted rather
than capitalization weighted. The Standard & Poor’s 500 Stock Index (S&P 500) is an unmanaged, capitalization-weighted index of U.S. companies generally representative
of the U.S. Stock Market. The Barclays US Aggregate Bond Index is generally considered to be representative of the domestic, investment-grade, fixed-rate, taxable bond
market. Returns are not indicative of the past or future performance of any investment product.
A Spectrum of Returns
“The First Shall Be Last and the Last Shall Be First”
Asset Class 2008-2012 2003–2007 1998–2002 1993–1997
Emerging Markets Stocks -3 391 -21 44
International Stocks -15 171 -12 74
REITs 29 131 23 118
Large Cap U.S. Stocks 9 83 -3 152
Commodities -23 95 21 58
Convertibles 22 66 20 92
Unhedged Foreign Bonds 32 43 27 47
TIPS 41 36 52 —
High Yield Bonds 61 67 3 75
Long Government Bonds 58 32 52 62
Emerging Markets Bonds 64 82 44 —
Core Bonds 33 24 44 43
Mortgages 32 25 43 42
Money Market 2 16 23 26
Red = worst three Blue = best three
Cumulative Returns

Thank You
For additional information visit
www.researchaffiliates.com
Use the QR code to view
Fundamentals, Research
Affiliates’ monthly publication.
Important Information» By accepting this document you agree to keep its contents confidential and not to use the information contained in this document, and in the other materials you will be
provided with, for any purpose other than for considering a participation in the proposed transactions. You also agree not to disclose information regarding the
transactions to anyone within your organization other than those required to know such information for the purpose of analyzing or approving such participation. No
disclosure may be made to third parties (including potential co-investors) regarding any information disclosed in this presentation without the prior permission of
Research Affiliates, LLC.
» The material contained in this document is for information purposes only. This material is not intended as an offer or solicitation for the purchase or sale of any security or
financial instrument, nor is it advice or a recommendation to enter into any transaction. Any offer to sell or a solicitation of an offer to buy or sell shall be made solely to
qualified investors through a private placement memorandum for pooled investment vehicles, or investment management agreement for separately managed accounts.
This information is intended to supplement information contained in the respective disclosure documents. The information contained herein should not be construed as
financial or investment advice on any subject matter. Research Affiliates, LLC and its related entities do not warrant the accuracy of the information provided herein,
either expressed or implied, for any particular purpose.
» THE INDEX DATA PUBLISHED HEREIN IS SIMULATED, UNMANAGED AND CANNOT BE INVESTED IN DIRECTLY. PAST SIMULATED PERFORMANCE IS NO
GUARANTEE OF FUTURE PERFORMANCE AND IS NOT INDICATIVE OF ANY SPECIFIC INVESTMENT. ACTUAL INVESTMENT RESULTS MAY DIFFER. The
simulated data contained herein is based on the patented non-capitalization weighted indexing system, method and computer program product (see Robert D. Arnott,
Jason Hsu and Philip Moore. 2005. “Fundamental Indexation.” Financial Analysts Journal [March/April]:83-99).
» Any information and data pertaining to indexes contained in this document relates only to the index itself and not to any asset management product based on the index.
No allowance has been made for trading costs, management fees, or other costs associated with asset management as the information provided relates only to the
index itself. With the exception of the data on Research Affiliates Fundamental Index, all other information and data are based on information and data available from
public sources.
» Investors should be aware of the risks associated with data sources and quantitative processes used in our investment management process. Errors may exist in data
acquired from third party vendors, the construction of model portfolios, and in coding related to the index and portfolio construction process. While Research Affiliates
takes steps to identify data and process errors so as to minimize the potential impact of such errors on index and portfolio performance, we cannot guarantee that such
errors will not occur.
» Russell Investments is the source and owner of the Russell Index data contained or reflected in this material and copyrights related thereto. The presentation may
contain confidential information and unauthorized use, disclosure, copying, dissemination, or redistribution is strictly prohibited. This is a presentation of Research
Affiliates, LLC. Russell Investments is not responsible for the formatting or configuration of this material or for any inaccuracy in Research Affiliates’ presentation thereof.
» Copyright MSCI. All Rights Reserved. Without prior written permission of MSCI, this information and any other MSCI intellectual property may only be used for your
internal use, may not be reproduced or redisseminated in any form and may not be used to create any financial instruments or products or any indices. This information
is provided on an “as is” basis, and the user of this information assumes the entire risk of any use made of this information. Neither MSCI nor any third party involved in
or related to the computing or compiling of the data makes any express or implied warranties, representations or guarantees concerning the MSCI index-related data,
and in no event will MSCI or any third party have any liability for any direct, indirect, special, punitive, consequential or any other damages (including lost profits) relating
to any use of this information.
» The trade names Fundamental Index®, RAFI®, the RAFI logo, and the Research Affiliates corporate name and logo are registered trademarks and are the exclusive
intellectual property of Research Affiliates, LLC. Any use of these trade names and logos without the prior written permission of Research Affiliates, LLC is expressly
prohibited. Research Affiliates, LLC reserves the right to take any and all necessary action to preserve all of its rights, title and interest in and to these marks.
» Fundamental Index®, the non-capitalization method for creating and weighting of an index of securities, is patented and patent-pending proprietary intellectual property
of Research Affiliates, LLC (US Patent No. 7,620,577; 7,747,502; 7,792,719; 7,778,905; and 8,005,740; Patent Pending Publ. Nos. US-2007-0055598-A1, US-2008-
0288416-A1, US-2010-0191628, US-2010-0262563, WO 2005/076812, WO 2007/078399 A2, WO 2008/118372, EPN 1733352, and HK1099110).
» © Research Affiliates, LLC. All rights reserved. Duplication or dissemination prohibited without prior written permission.
28