
Capital Markets Day Growing Solar and Wind -...
19
Growing Solar and Wind Capital Markets Day Kari Kautinen / Senior Vice President M&A and Solar & Wind Development / 16 November 2016 Fortum solar power plant, India
Transcript of Capital Markets Day Growing Solar and Wind -...

Growing Solar and WindCapital Markets Day
Kari Kautinen / Senior Vice President M&A and Solar & Wind Development /
16 November 2016
Fortum solar power plant, India

2
Agenda• Current market and drivers
– Technology drivers
– System integration
– Changing business models and value creation
• Solar
• Wind
• Summary

In less than 2 hours the Earth receives the amount of energy we consume annually
Fortum solar power plant, India

4
Onshore wind and solar PV breaking records with PPA contracts while offshore dropping into the game with recent auction resultLowest recently announced long-term PPA contract prices and auction results, without
subsidies1
Germany69 €/MWh
United States39 €/MWh
Chile26 €/MWh
India58 €/MWh
Jordan55 €/MWh
UAE27 €/MWh
South Africa58 €/MWh
Peru43 €/MWh
New world-record
Mexico32 €/MWh Peru
33 €/MWh
United States40 €/MWh
Brazil44 €/MWh
Netherlands73 €/MWh
Australia62 €/MWh
Solar PV
Onshore
Offshore
South Africa46 €/MWh
Morocco27 €/MWh
Argentina53 €/MWh
Argentina54 €/MWh
1 Sources: announcements by the investing companies and IEA report ”Renewable Energy Medium-Term Market Report 2015” for US, Brazil, South Africa, Australia and Jordan. Values reported in nominal
euros. United States values calculated excluding tax credits. Typical contract lengths are 15-25 years. The prices indicate levels with which investors have been willing to invest, however, they may not describe
the actual comparable costs as the bid prices may be reduced by preferential land prices, site exploration cost, targeted low-cost loans etc.
For Sweden the price level at which investors can hedge their renewable production for the next 4 years: average of 2017-2020 electricity (LUL) + elcertificate futures with 29.8.2016 closing prices. Newest Abu
Dhabi bids were 21,6 €/MWh but the producers get 1.6 times the payment during June-September and thus the actual average is 27 €/MWh
Sweden36 €/MWh
Denmark50 €/MWh

5
Growth in wind and solar accelerating globally and in Fortum’shome markets
Solar and wind capacity increase from 2015 to 2020 in specific regions
0 50 100 150 200 250
Rest of Asia
China
India
Rest of Americas
US
Europe
Rest of Asia
China
India
Rest of Americas
US
Europe
Win
dS
ola
r
Installed capacity [GW]
*Only wind capacities are shown for Nordic
0
1
2
3
2015 20200
2
4
6
8
10
12
14
2015 2020
SWE-NOR certificate market Finland
GW
GW
Capacity in 2015
Additional capacity by 2020
Sources: 2015 installed capacities from U.S. Energy Information Administration, Capacity additions for Europe from EU reference scenario (REF2016) and
rest of the world from Bloomberg New Energy Finance NEO2016. 27% capacity factor was used to convert EU Ref2016 energies into capacity figures 2.5
GW 2020 target is used for Finland

6
System integration has significant value creation opportunity in the future – solar and wind essential part of new business models
Utilities
as system
integrators
Energy abundance”Clean, cheap, intermittent”
• Solar and wind
• Energy sales
• Curtailment control
Storage and
flexibility”Stationary, centralized”
• Hydro, centralized batteries
• Balancing services
• Peak capacity shaving
• Seasonal storage
Active consumer”Mobility, flexibility”
• Batteries, electric vehicles,
demand response
• Grid services (distributed)
• Load (peak) shifting
• Capacity sales
Demand
response
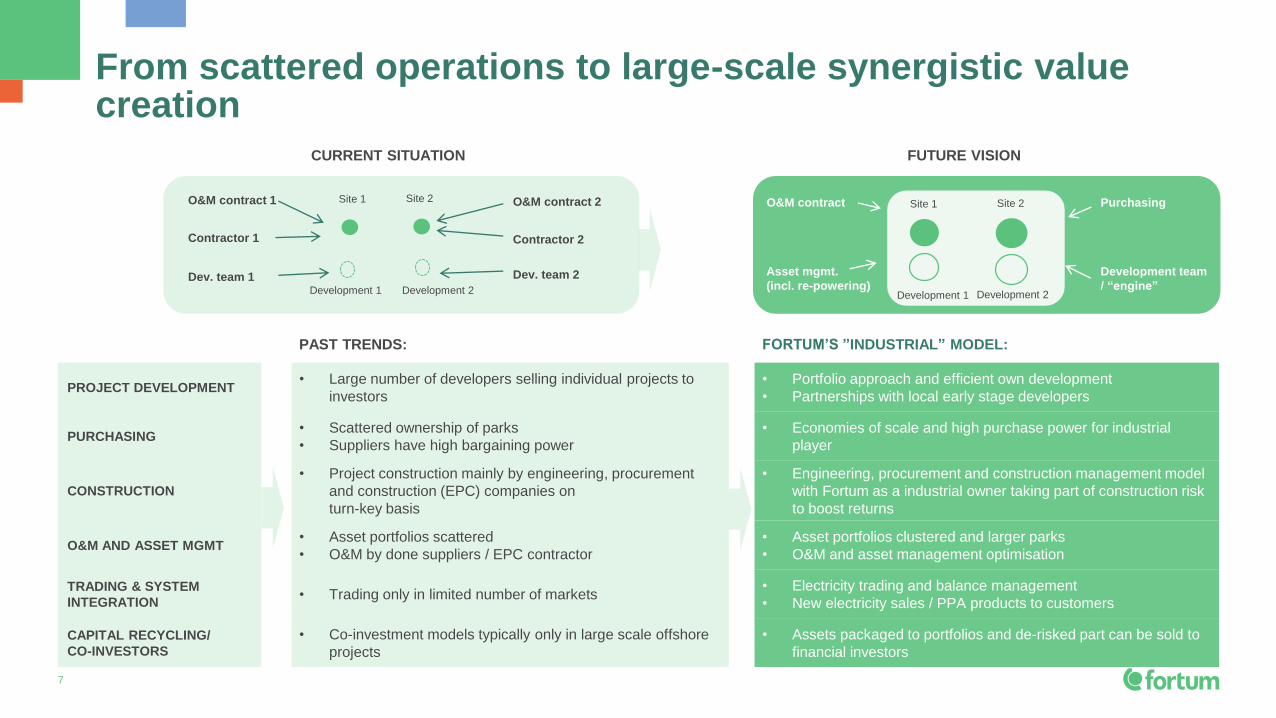
PAST TRENDS: FORTUM’S ”INDUSTRIAL” MODEL:
PROJECT DEVELOPMENT• Large number of developers selling individual projects to
investors
• Portfolio approach and efficient own development
• Partnerships with local early stage developers
PURCHASING• Scattered ownership of parks
• Suppliers have high bargaining power
• Economies of scale and high purchase power for industrial
player
CONSTRUCTION
• Project construction mainly by engineering, procurement
and construction (EPC) companies on
turn-key basis
• Engineering, procurement and construction management model
with Fortum as a industrial owner taking part of construction risk
to boost returns
O&M AND ASSET MGMT• Asset portfolios scattered
• O&M by done suppliers / EPC contractor
• Asset portfolios clustered and larger parks
• O&M and asset management optimisation
TRADING & SYSTEM
INTEGRATION• Trading only in limited number of markets
• Electricity trading and balance management
• New electricity sales / PPA products to customers
CAPITAL RECYCLING/
CO-INVESTORS
• Co-investment models typically only in large scale offshore
projects
• Assets packaged to portfolios and de-risked part can be sold to
financial investors
7
From scattered operations to large-scale synergistic value creation
CURRENT SITUATION FUTURE VISION
Site 1 Site 2 O&M contract 2O&M contract 1
Development team
/ “engine”
PurchasingO&M contract
Asset mgmt.
(incl. re-powering)Development 2Development 1
Contractor 2Contractor 1
Dev. team 1 Dev. team 2
Site 1 Site 2
Development 2Development 1

8
Fortum competences to extract maximum value from wind and solar assets
Site and CAPEX
optimisation
O&M and
asset mgmt.
Base case
IRR
Achievable
project IRR
In tariff / power purchase agreement (PPA) scheme:
Sell shares of de-risked assets to financial investors with lower return
target
In market-based schemes:
System integration, smart
offering to end consumers,
potential price recovery
Confirmed IRR improvements through utilisation of Fortum
competences
Additional IRR-levers
Trading and
balancing

Solar power

10
Solar to grow even faster in next decades profoundly impacting power markets – utilities are needed for system integration
Sources: BP Statistical Review (for years 1996-2015), BNEF New Energy Outlook 2016 (for years 2016-2040)
0%
2%
4%
6%
8%
10%
12%
14%
16%
0
500
1 000
1 500
2 000
2 500
3 000
3 500
4 000
4 500
1996 1998 2000 2002 2004 2006 2008 2010 2012 2014 2016 2018 2020 2022 2024 2026 2028 2030 2032 2034 2036 2038 2040
Share
of
tota
l ele
ctr
icity g
enera
tion
Ge
ne
ratio
n c
ap
acity in G
W
Solar power capacity and generation globally
Solar (GW)
Solar (% of TWh)
Start-ups
Already today, solar power is fundamentally changing energy systems

11
Solar competences and scale that can be financially leveraged in India
• Fortum has gradually increased investments with attractive return levels
• With the targeted investments the 200–400 MEUR mandate almost filled
• Target to create sizeable portfolio – consider alternative structures and business models
Amrit 5 MW
Rajasthan
Kapeli 10 MW
Madhya Pradesh
2013 2014 2015 2016 2017
Bhadla 70MW
Rajasthan
Kapeli project execution Bhadla / Pavagada project execution
Pavagada 100 MW Karnataka
Sizable project
(up to 250 MW)
Acquisition to establish
Fortum in market, O&M
experience
Construction project
to develop
competences
Large-scale projects
to exploit economies
of scale
CAPEX mandate utilised,
partnering models for
further growth
Further options

China
IndiaAustralia USA
Japan
Europe
BrazilSE AsiaMEA
Mexico
12
Attractive next step after India is to add value in system integration
Bubble size represents
utility-scale solar
installations in next 10 yrs
FORTUM TARGET Critical mass with capital recycling Reasonable volumes with value creation from system integration
Market type Developing economies for volume Mature economies for system integration
Solar demand driver Need of new generation capacity Need of decarbonisation and aging capacity replacements
Type of demand Government-driven auctions and tariffs + open market-based volumes
Value creation CAPEX/OPEX optimisation, site selection + system enhancing solutions, optimisation, integration
Innovation Local solutions, e.g. microgrids Global solutions in business models, storage and digitalisation
Country and FX risk Above average Below average
Higher irradiation
and better match to
consumption
Forerunners in
system level
solutions and
technology
innovation
MEA = Middle East and Africa, SE Asia = Southeast Asia
Source: Bloomberg New Energy Finance, Fortum analysis
Volume and cost
driven markets,
local innovations
13
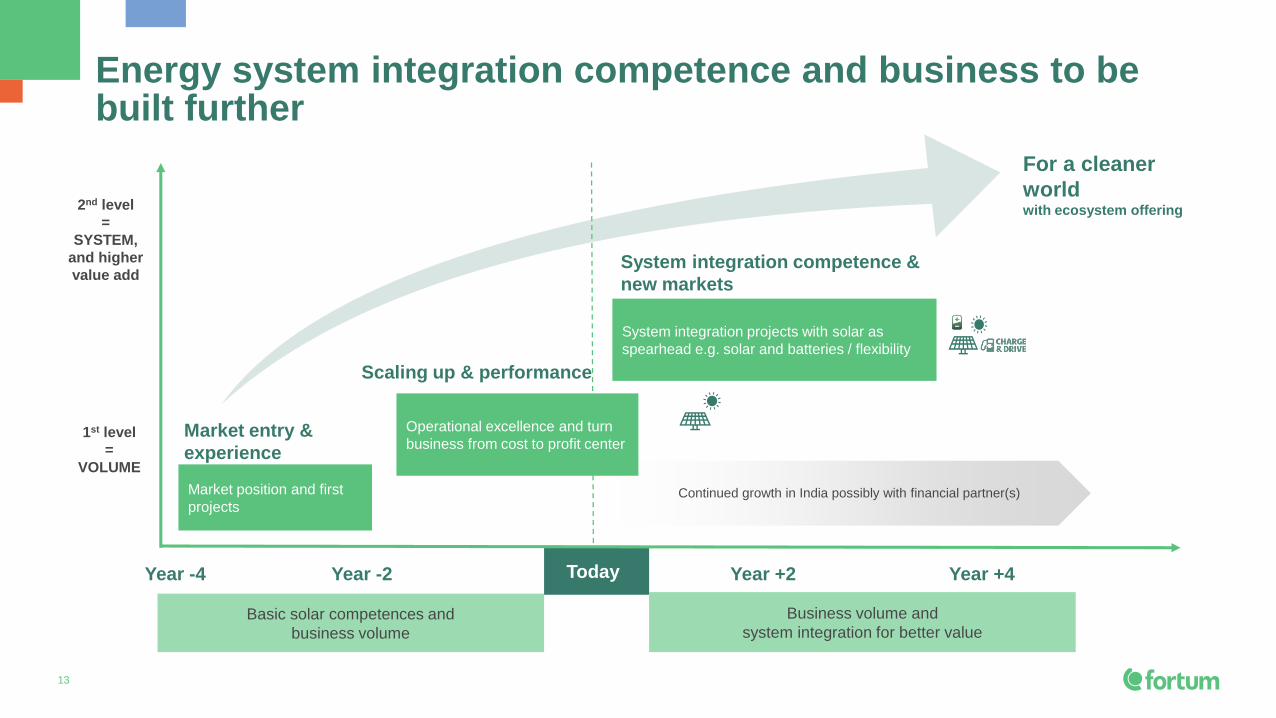
Energy system integration competence and business to be built further
1st level
=
VOLUME
Year -4
2nd level
=
SYSTEM,
and higher
value add
Market entry &
experience
Scaling up & performance
System integration competence &
new markets
For a cleaner
worldwith ecosystem offering
Basic solar competences and
business volume
Business volume and
system integration for better value
Continued growth in India possibly with financial partner(s)
Year -2 Today Year +2 Year +4
System integration projects with solar as
spearhead e.g. solar and batteries / flexibility
Operational excellence and turn
business from cost to profit center
Market position and first
projects

Wind power
15
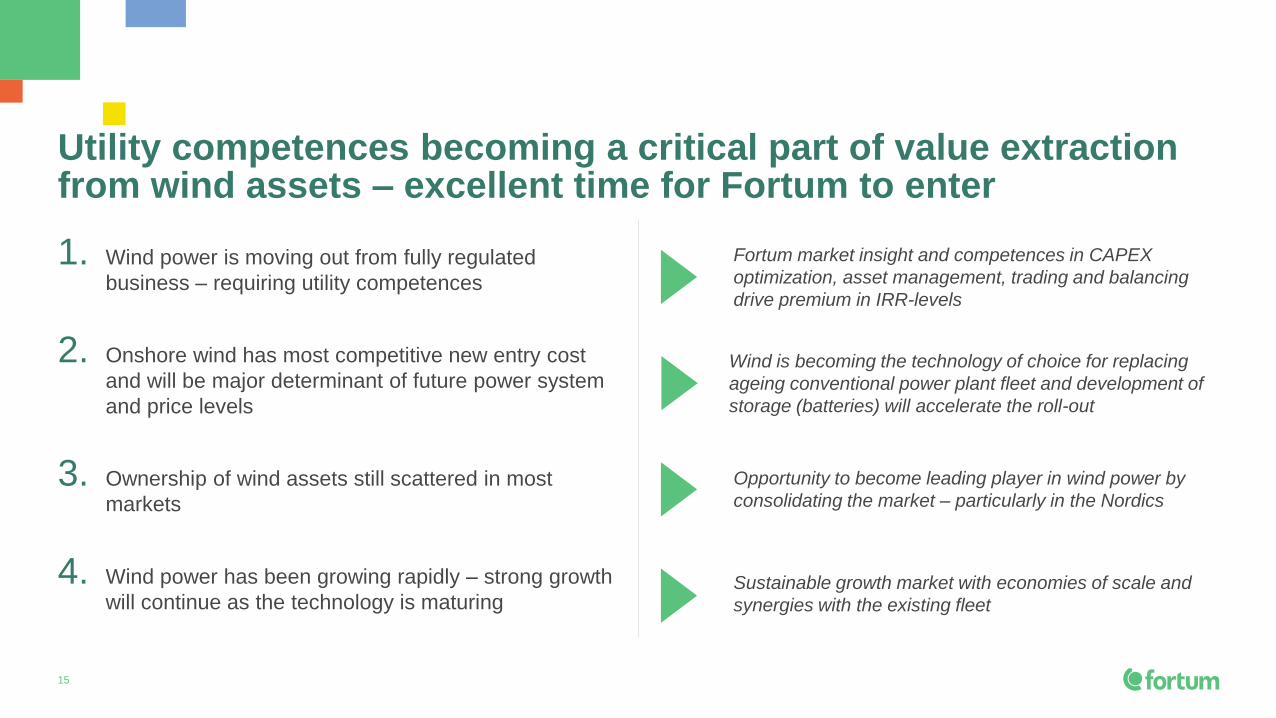
Utility competences becoming a critical part of value extraction from wind assets – excellent time for Fortum to enter
1. Wind power is moving out from fully regulated
business – requiring utility competences
2. Onshore wind has most competitive new entry cost
and will be major determinant of future power system
and price levels
3. Ownership of wind assets still scattered in most
markets
4. Wind power has been growing rapidly – strong growth
will continue as the technology is maturingSustainable growth market with economies of scale and
synergies with the existing fleet
Fortum market insight and competences in CAPEX
optimization, asset management, trading and balancing
drive premium in IRR-levels
Wind is becoming the technology of choice for replacing
ageing conventional power plant fleet and development of
storage (batteries) will accelerate the roll-out
Opportunity to become leading player in wind power by
consolidating the market – particularly in the Nordics

16
Fortum to focus on onshore wind in Nord Pool area and Russia
Highest value creation and competitive edge in home markets –
Nord Pool area and Russia
• Selection of attractive projects & sites with high wind speed and low CAPEX
– best sites to have further value through re-powering
• Sizeable wind clusters (100+ MW) for efficient asset management, local
operation and maintenance
• Existing platform and competences for efficient project implementation and
scalable operations
• Full utilisation of Fortum competences in trading and portfolio effect with
hydropower (balancing)
Build up ~1,000-1,500 MW wind portfolio
• Start with onshore wind in Nord Pool area in construction projects and existing
assets
• Prospective entry in Baltics
• Russia - target up to 500 MW utilizing Capacity Supply Agreements (CSA)
• Assess entry options to other Fortum markets and wider European market in
next wave
• In addition, a solid pipeline of projects
Focus on Nord Pool area and Russia
Operating wind projects
Construction projectsFirst focus markets
Fortum’s targets in Wind:
• Nord Pool area: up to 1,000 MW
• Russia: up to 500 MW utilizing CSA’s

17
Fortum’s fleet and competences maximize value from wind
• Weather and trading competences
• Asset management (condition
monitoring), maintenance and
availability optimisation with economies
of scale
• Ability to carry market risk
System perspective
and customer businessWhat?
• Site selection and acquisition
• Energy yield and construction CAPEX
optimisation
• Efficient project management
• Secure re-powering opportunity
Site and CAPEX
optimisation
How?
Trading, operational excellence and
integration with hydropower
• Combination of wind to storage
(batteries, hydro)
• Green energy premium
• Direct sales (B2B) to large industrial
customers
Potential additional
value creation in
the longer run
Optimised site
and asset
Best value out of
generated power
and Fortum fleet
Typical return
for wind asset
IRR premium over financial investors
or small scale producers

18
Summary
• Wind and solar are fundamentally changing power
systems globally
• Most competitive new entry costs of new power
production
• Wind and solar pushed by cost competitiveness,
customer demand and global climate change
agenda
• Utility competences have become important part
of value creation in renewables – more market
based schemes to accelerate development
• Target to reach GW-scale in wind and solar
business
• Wind focus first in Nord Pool area and Russia
• Solar in India and in selected new market with
system innovation needs
• Add value with utility competences along the
value chain – clear premium above country and
technology specific cost of capital
• Leverage solar and wind competence to be
leading system integrator in 2020’s
Fortum targets in wind and solar

Q&A


![[ RENEWABLE ENERGY - WIND AND SOLAR ] · biomass, wind, marine and solar, help increase Canada’s capacity for renewable energy; wind and solar are the country’s two fastest-growing](https://static.fdocuments.in/doc/165x107/5f4c4f8ee3db153fe0280afa/-renewable-energy-wind-and-solar-biomass-wind-marine-and-solar-help-increase.jpg)


![Are global wind power resource estimates overstated? · CF for onshore wind of 40% in 2010 growing to 46% in 2030 [10]. Lu et al [4] provided an updated estimate of global wind capacity](https://static.fdocuments.in/doc/165x107/5fd136f776570a517e1a7845/are-global-wind-power-resource-estimates-overstated-cf-for-onshore-wind-of-40.jpg)


