Capital Market Implications of Corporate Disclosure ... · markets and individual securities and...
25
BuR - Business Research Official Open Access Journal of VHB Verband der Hochschullehrer für Betriebswirtschaft e.V. | 82 1 Introduction The impact of corporate disclosure on capital mar- kets has been discussed for decades–and the interest has not decreased over time. Lev and Ohlson (1982: 249) stated in their review of research in the field: “A decade and a half of the most concerted and am- bitious research effort in accounting history is eva- luated here”. Even today neither capital market implications nor other consequences of corporate disclosure have been fully explored or understood. Corporate disclosure is intended to provide infor- mation on the operating activities, and the financial and business situation of a firm to an interested audience. Firms’ disclosure is therefore not limited to financial information, but also addresses a great variety of non-financial information. It is undisputed that corporate disclosure increases the amount of information available to addressees. This information effect is only a means to an end and firms will hardly provide information out of philanthropic motives. In fact, it is purely economic reasoning that drives disclosure of corporate infor- mation. In a related vein Dye (2001) noted that capital market impacts of disclosure are in the spot- light while implications for merchandise markets are of peripheral interest. Prior research mainly discussed the relation between disclosure and an increase in wealth of shareholders, but also evalu- ated other market consequences of disclosure. Following Healy and Palepu (2001) two types of disclosure consequences exist: (1) the liquidity of markets and individual securities and (2) the cost of capital to firms. Most prior studies investigated the implications of annual report disclosure on capital markets outside Germany or relied on specific, nar- row proxies for disclosure with questionable validity (e.g., Leuz and Verrecchia 2000, Leuz 2003). I therefore examine these relations in the German capital market in 2006 using the innovative Artifi- cial Intelligence Measurement of Disclosure (AIMD) that directly derives disclosure measures from an- nual reports. Capital-market-related research mainly addresses voluntary disclosure as from a mandatory disclosure that does not vary between firms (of a certain indus- try, size and exchange segment) no firm-specific endogenous market reactions can be expected. A research design to address the mandatory disclosure issue must be either normative or requires sufficient variance in mandatory disclosure levels that can often be found in international samples only. In line with, e.g., Chen, Chen, and Cheng (2008), Langberg Capital Market Implications of Corporate Disclosure: German Evidence Michael Grüning, Frankfurt School of Finance & Management, Frankfurt/Main, Germany, E-Mail: [email protected] Abstract This paper investigates the relationship between annual report disclosure, market liquidity, and capital cost for firms registered on the Deutsche Börse. Disclosure is comprehensively measured using the innova- tive Artificial Intelligence Measurement of Disclosure (AIMD). Results show that annual report disclosure enhances market liquidity by changing investors’ expectations and inducing portfolio adjustments. Trad- ing frictions are negatively associated with disclosure. The study provides evidence for a capital-cost- reduction effect of disclosure based on the analysis of investors’ return requirements and market values. Altogether, no evidence is found that the information processing at the German capital market is structur- ally different from other markets. Keywords: annual report disclosure, capital market, market liquidity, cost of capital Manuscript received August 19, 2010, accepted by Christian Schlag (Finance), October 15, 2010.
Transcript of Capital Market Implications of Corporate Disclosure ... · markets and individual securities and...

BuR - Business Research Official Open Access Journal of VHB Verband der Hochschullehrer für Betriebswirtschaft e.V. ���� � | ���� � � ����� ���� � �8��2
�
1 Introduction The impact of corporate disclosure on capital mar-kets has been discussed for decades–and the interest has not decreased over time. Lev and Ohlson (1982: 249) stated in their review of research in the field: “A decade and a half of the most concerted and am-bitious research effort in accounting history is eva-luated here”. Even today neither capital market implications nor other consequences of corporate disclosure have been fully explored or understood. Corporate disclosure is intended to provide infor-mation on the operating activities, and the financial and business situation of a firm to an interested audience. Firms’ disclosure is therefore not limited to financial information, but also addresses a great variety of non-financial information. It is undisputed that corporate disclosure increases the amount of information available to addressees. This information effect is only a means to an end and firms will hardly provide information out of philanthropic motives. In fact, it is purely economic reasoning that drives disclosure of corporate infor-mation. In a related vein Dye (2001) noted that capital market impacts of disclosure are in the spot-light while implications for merchandise markets are of peripheral interest. Prior research mainly
discussed the relation between disclosure and an increase in wealth of shareholders, but also evalu-ated other market consequences of disclosure. Following Healy and Palepu (2001) two types of disclosure consequences exist: (1) the liquidity of markets and individual securities and (2) the cost of capital to firms. Most prior studies investigated the implications of annual report disclosure on capital markets outside Germany or relied on specific, nar-row proxies for disclosure with questionable validity (e.g., Leuz and Verrecchia 2000, Leuz 2003). I therefore examine these relations in the German capital market in 2006 using the innovative Artifi-cial Intelligence Measurement of Disclosure (AIMD) that directly derives disclosure measures from an-nual reports. Capital-market-related research mainly addresses voluntary disclosure as from a mandatory disclosure that does not vary between firms (of a certain indus-try, size and exchange segment) no firm-specific endogenous market reactions can be expected. A research design to address the mandatory disclosure issue must be either normative or requires sufficient variance in mandatory disclosure levels that can often be found in international samples only. In line with, e.g., Chen, Chen, and Cheng (2008), Langberg
Capital Market Implications of Corporate Disclosure: German Evidence Michael Grüning, Frankfurt School of Finance & Management, Frankfurt/Main, Germany, E-Mail: [email protected]
Abstract This paper investigates the relationship between annual report disclosure, market liquidity, and capital cost for firms registered on the Deutsche Börse. Disclosure is comprehensively measured using the innova-tive Artificial Intelligence Measurement of Disclosure (AIMD). Results show that annual report disclosure enhances market liquidity by changing investors’ expectations and inducing portfolio adjustments. Trad-ing frictions are negatively associated with disclosure. The study provides evidence for a capital-cost-reduction effect of disclosure based on the analysis of investors’ return requirements and market values. Altogether, no evidence is found that the information processing at the German capital market is structur-ally different from other markets. Keywords: annual report disclosure, capital market, market liquidity, cost of capital Manuscript received August 19, 2010, accepted by Christian Schlag (Finance), October 15, 2010.

BuR - Business Research Official Open Access Journal of VHB Verband der Hochschullehrer für Betriebswirtschaft e.V. ���� � � ���� � � ����� ���� � �8��2
��
and Sivaramakrishnan (2010), and Zechman (2010) I therefore disregard mandatory disclosure implica-tions but focus on firm-specific disclosure conse-quences. The remaining paper is organized as follows. In section two the relations between disclosure and liquidity aspects are discussed. Section three looks at disclosure from a cost-of-capital perspective. The research design for the empirical evaluation of the four hypotheses developed in sections two and three is described in section four. Section five reports the results of the empirical investigation. Finally, sec-tion six summarizes the findings.
2 Liquidity Hypotheses Development
Different aspects of liquidity exist. On the one hand share turnover measures the overall trading activity. On the other hand the bid-ask spread also addresses liquidity issues as the friction that burdens traders.
2.1 Trading activity Trading activity (i.e. share turnover) is an obvious measure for market liquidity as liquidity increases with more liquid funds used to buy securities. The market price balances different individual ex-pectations and reflects the consensus expectations of all market participants while changing consensus expectations imply changes in market prices (Elton, Gruber, and Gultekin 1981, Karpoff 1987, Ryan and Taffler 2004, and Ryan 2005). Consensus expecta-tions only change, however, if the individual expec-tations of some investors change and they adjust their portfolios by buying or selling securities. Changes in individual expectations therefore induce share turnover. Individual expectations are co-determined by the level of information that is available to the respec-tive market participant. Roll (1988) identified three different factors to influence capital market partici-pants’ expectations: (1) common macroeconomic knowledge, (2) industry-specific information, and (3) firm-specific information. All of them could potentially be addressed by corporate disclosure. If disclosure provides information that is new to some investors their individual expectations change. As a result, portfolios need to be adjusted and share turnover occurs. This effect not only exists if the information is new to some investors, but also if certain market participants interpret available in-
formation differently against the background of the new information (Karpoff 1986, Kim and Verrecchia 1991). Prior empirical research revealed a strong and sus-tainable impact on trading activity for various dis-closure instruments. The influence of earnings an-nouncements on share turnover is very well docu-mented. In the 1960s empirical studies started to report an increasing share turnover in connection with earnings announcements (e.g., Beaver 1968). Multiple papers followed to examine this relation-ship based on larger samples, more advanced em-pirical methods, and in different capital markets (e.g., Morse 1981, Bamber 1986, Sivakumar and Waymire 1994). They consistently showed a positive effect of disclosure on share turnover. On the other hand, laboratory experiments fail to reproduce a turnover increase following an earnings announce-ment in simulated markets (Gillette, Stevens, Watts, and Williams 1999). Share turnover is also influenced by other types of information that could be provided by corporate disclosure, including macroeconomic data (McGuinness 1999), social responsibility disclosure (Patten 1990), and ad-hoc information disclosure (Ryan and Taffler 2004, Muntermann and Guettler 2007). Based on the idea that the information con-tent of annual reports decreases with increasing temporal distance to the accounting year end, the positive relation between timeliness of disclosure and share turnover demonstrated by Leventis and Weetman (2004) can also be interpreted as evi-dence for a positive association of disclosure and trading activity. Furthermore, Bailey, Li, Mao, and Zhong (2003) and Francis, Nanda, and Wang (2006) reported an increase in share turnover fol-lowing increased non-discrimination disclosure requirements of U.S. regulation F-D. A different stream of literature discusses a negative relation between corporate disclosure and share turnover under certain conditions. Share turnover increases with increasing uncertainty of investors and a greater variance in individual expectations (Barron 1995, Bamber, Barron, and Stober 1997, Bamber, Barron, and Stober 1999, Linsmeier, Thornton, Venkatachalam, and Welker 2002). The higher the variance of individual expectations the higher the information advantage of informed in-vestors that must be transformed into real economic benefits by market transactions–causing share turn-over. With higher information asymmetry therefore

BuR - Business Research Official Open Access Journal of VHB Verband der Hochschullehrer für Betriebswirtschaft e.V. ���� � � ���� � � ����� ���� � �8��2
��
more insider transactions occur. Corporate disclo-sure is expected to reduce information asymmetry and hence reduce insider transactions and trading activities. Eventually, the negative effect of corpo-rate disclosure is based on the assumption that a considerable proportion of all stock market transac-tions are insider transactions and their decrease cannot be compensated by additional transactions of previously uninformed investors. Altogether, the idea that corporate disclosure devel-ops to an extent where information asymmetry vanishes and previously informed investors leave the market, whereas the decrease in informed transactions cannot be compensated by an increase in share turnover from other (now better informed) investors seems to be implausible. In line with the first stream of literature an increasing share turn-over with an increasing information provision by corporate disclosure is therefore hypothesized.
H1: Corporate disclosure and share turnover are positively associated.
2.2 Bid-Ask Spread Information asymmetry reduces, i.e. information levels of market participants are more even, if (1) information that has been private is made public or (2) disclosure provides information that is entirely new to the market (and the relative proportion of public information increases to the disadvantage of private information). In this respect two different views on how informa-tion asymmetry reduction affects the bid-ask spread are discussed in the literature. On the one hand, a lower information asymmetry reduces the risk of passive traders to lose against better informed active traders. As passive traders compete the actual spread reduces accordingly. Bloomfield and O’Hara (1999) reproduced this competitive effect in a labo-ratory setting. On the other hand, a lower spread makes the price-offering service of passive traders less attractive as the risk and the resulting compen-sation provided by active traders are lower (Dia-mond and Verrecchia 1991). Consequently, passive traders exit the market and market liquidity de-creases. With lower information asymmetry unin-formed traders may also become more aware of being uninformed and leave the market. Altogether, liquidity decreases and the spread increases (Wu
and Zhang 2002). Diamond and Verrecchia (1991) argued that the effect of a spread reduction due to reduced risk outweighs the contrary impact of a spread increase due to trader exits. A negative rela-tion between corporate disclosure and bid-ask spread is therefore expected. In contrast to main stream literature some papers predict a positive association of disclosure and in-formation asymmetry. McNichols and Trueman (1994) argued that market participants respond to disclosure with a varying motivation to search for additional information, i.e. to reduce information asymmetry on their own. Verrecchia (1982), Dia-mond (1985), and Kim and Verrecchia (1994) as-sumed that market participants differ in their in-formation-processing capabilities and therefore information asymmetry increases if more informa-tion is available. Various empirical evidence supports a negative association of disclosure and spread. Early papers relied on a contingency approach where certain firm characteristics are expected to accompany higher information asymmetry. For instance, a high pro-portion of insiders holding stocks, a high proportion of institutional investors and a large influence of principal shareholders–that are all considered to accompany high information asymmetry–imply a high spread (e.g., Chiang and Venkatesh 1988, Hef-lin and Shaw 2000). Later studies directly ad-dressed the relation between corporate disclosure, information asymmetry, and spread. For instance, Welker (1995), Healy, Hutton, and Palepu (1999), Leuz and Verrecchia (2000), Brockman and Chung (2001), Heflin, Shaw, and Wild (2005), and Attig, Fong, Gadhoum, and Lang (2006) provided evi-dence that firms’ voluntary disclosure policy is nega-tively associated with spreads. The spread is also reducing with the disclosure of particular informa-tion, including the disclosure of explored and unex-plored oil reserves (Raman and Tripathy 1993, Boone 1998, Boone, Luther, and Raman 1998), segmental reporting information (Greenstein and Sami 1994), and management forecasts of quarterly earnings (Coller and Yohn 1997). However, the dis-closure effect on the spread seems to depend on the type of information (Guo, Lev, and Zhou 2004). In summary, previous theoretical as well as empiri-cal work suggests the following hypothesis.
H2: Corporate disclosure and the bid-ask spread are negatively associated.

BuR - Business Research Official Open Access Journal of VHB Verband der Hochschullehrer für Betriebswirtschaft e.V. ���� � � ���� � � ����� ���� � �8��2
��
3 Equity Cost Hypothesis Development
The expected reduction of equity cost is probably the most important motive for firms to disclose information (Choi 1973, Cooke 1993, Verrecchia 2001, Lambert, Leuz, and Verrecchia 2007). The basic idea of the cost reduction effect is twofold (Core 2001): First, comprehensive disclosure re-duces investors’ information uncertainty as dis-cussed in the previous section. Second, if informa-tion asymmetry decreases, investors require a lower risk premium (Bailey, Karolyi, and Salva 2006), i.e. cost of capital reduces. Two main streams of literature exist that examine the relation of cost of capital and corporate disclo-sure in detail. On the one hand, information asym-metry is considered to drive capital cost as investors require compensation for higher transaction costs that result from higher bid-ask spreads (Amihud and Mendelson 1986, Botosan, Plumlee, and Xie 2004). In line with the negative relation between disclosure and information asymmetry cost of capi-tal reduces with an increasing disclosure level. On the other hand, corporate disclosure influences the non-diversifiable prognosis risk for unknown re-turns (Klein and Bawa 1976, Coles, Loewenstein, and Suay 1995, Clarkson, Guedes, and Thompson 1996). Here, investors are assumed to decide based on uncertain returns while the precise distribution is unknown and distribution parameters are esti-mated from past experience and other available information. Uncertain returns are modeled using estimators for the distribution function parameters that depend on an investor’s level of information. As the prognosis risk is non-diversifiable it affects cost of capital but is not considered in popular capital market models (Botosan 2006). A number of approaches are discussed in the litera-ture to quantify the cost of capital concept empiri-cally.
3.1 Investors’ Return Requirements Cost of equity is opportunity cost of alternative in-vestment opportunities (e.g., Shapiro 1978, Kerins, Smith, and Smith 2004, Indjejikian 2007) and equals the rate of return investors require to hold stocks of a firm. Easley and O’Hara (2004) regarded an imperfect capital market where differently in-formed investors with rational expectations hold risky securities. The overall amount of information
is separated into public and private, i.e. information asymmetry is proportional to the percentage of private information. Easley and O’Hara (2004) concluded that in equilibrium firms with lower in-formation asymmetry are ceteris-paribus con-fronted with lower return expectations of their in-vestors. Corporate disclosure is introduced into the model and increases the number of investors that have access to private information or reduces the amount of private information for the benefit of public information. Both effects reduce the required rate of return and decrease firms’ capital cost ac-cordingly. In their empirical study Easley, Hvidkjaer, and O’Hara (2002) reported an increase in returns with higher information asymmetry. Therefore, the following hypothesis is formulated.
H3: Corporate disclosure and cost of capital are negatively associated.
3.2 Other direct measures for cost of capital
The Capital Asset Pricing Model (CAPM) (Sharpe 1964, Lintner 1965, Mossin 1966) is inappropriate because of the following theoretical concerns. None of the mechanisms discussed in section two, neither the transaction-cost-based nor the information-based one, can be modeled within the CAPM. While the first is incompatible with the imputed fric-tionless capital market, the latter is incompatible with the assumption of well-known distribution functions of all relevant market parameters. Accord-ingly, the CAPM does not leave room for effects of information asymmetry and corporate disclosure because of the assumed high information efficiency and identical expectations of all market participants (Easley, Hvidkjaer, and O’Hara 2002). A descriptive analysis (available from the BuR – Business Re-search website) reveals no association of disclosure and the beta for the German sample used in sections four and five. Similarly there is no room for the transaction-cost-based as well as the prognosis-risk-related impact of corporate disclosure on capital cost within the Arbitrage Pricing Theory (APT) (Lehmann and Modest 1988, Fama and French 1996) framework (Easley and O’Hara 2004). I can-not apply expected income discounting methods (e.g., Gebhardt, Lee, and Swaminathan 2001, Boto-san and Plumlee 2002) as no IBES prognoses data could be obtained for the sample. Cost of capital can also not be measured by the direct welfare loss of a

BuR - Business Research Official Open Access Journal of VHB Verband der Hochschullehrer für Betriebswirtschaft e.V. ���� � � ���� � � ����� ���� � �8��2
��
(1) market value = equityt +
��� = 1
E(earningst+� – r · equityt+�–1) / (1+r)�
capital-raising firm, i.e. the underpricing when issu-ing secu���� ����ck 1986, Beatty and Ritter 1986) as a considerable amount of the underpricing is not driven by information asymmetry, but results from non-rational decisions and principal-agent prob-lems (Ritter and Welch 2002). Furthermore, most sample firms do not have IPOs within the time pe-riod under review. Aside from the above capital cost concepts other approaches are also infrequently used to evaluate the relation between corporate disclosure and cost of capital empirically–and provide mixed evidence. Some reveal an unconditioned capital cost reduction because of disclosure (Nikolaev and Van Lent 2005, Cheng, Collins, and Huang 2006, Eaton, Nofsinger, and Weaver 2007, Black, Carnes, Jandik, and Hen-derson 2007), some document a relation that de-pends on the kind of information (Richardson and Welker 2001), and some a relation that depends on how the information is disclosed (Botosan and Plumlee 2002).
3.3 Market Value Maximizing market value is a means to an end of reducing cost of equity. As market value is the future expected cash flows from the firm to its investors discounted with the equity cost rate, with a lower equity cost rate the market value increases. Within short periods of time the number of shares issued can be considered to be constant. Market value and share price therefore contain similar information with respect to disclosure effects. Many papers regarded “value relevance”, i.e. a posi-tive influence of corporate disclosure on a firm’s market value as the ultimate aim of disclosure (e.g., Hughes 2000, Espahbodi, Espahbodi, Rezaee, and Tehranian 2002, Young and Guenther 2003, �abac, Scott, and Wier 2005, Bowen, Davis, and Matsu-moto 2005). To analyze this effect accounting information and market capitalization can be linked through abnor-mal returns. For an indefinite period of time a firm’s market value is the sum of all discounted future cash payments to investors (Peasnell 1982, Feltham and Ohlson 1995, Bernard 1995). The Ohlson and Feltham framework allows a firm’s market value to be approximated using earnings prognoses and equity book values if the clean-surplus condition is fulfilled. It requires that all changes in the equity book value that do not result from transactions with
investors are recognized in the income statement. Hence, equityt = equityt–1 + earningst + dividendst (Ohlson 1995, Feltham and Ohlson 1995) and mar-ket capitalization of equity can be restated as
where r is the risk-free interest rate (Lundholm 1995). In addition to equity book values the formula only contains expected values of future abnormal returns above a risk-free equity return. Bernard (1995) concluded from his analysis of the U.S. capi-tal market that valid estimates can be obtained us-ing a short forecasting horizon of only T = 4 periods. Any conceivable mandatory disclosure includes the equity book value for the reporting period. Further mandatory or voluntary disclosure should therefore provide information that is useful to estimate ab-normal returns. While dividend prognoses are also influenced by investors’ decision on whether to dis-tribute or retain profits, abnormal earnings can be forecast using information about operating activities and the financial and business situation of a firm only. Still, the above arguments and economic intuition do not allow to predict the direction of the relation, i.e. whether there is a proportional or inversely pro-portional relationship. Corporate disclosure can either contain “good” or “bad” news, i.e. increase or reduce market expectations of abnormal returns. Considering the “good news bias” that is well docu-mented in the literature (e.g., Clarkson, Kao, and Richardson 1994, Karamanou and Vafeas 2005) I hypothesize a positive relation between disclosure and a firm’s market value. Similarly, differences between accounting stan-dards’ and markets’ perceptions can be explained by assets and liabilities. It is well known that changes in accounting standards induce price reactions at the capital market (Dyckman and Smith 1979, Col-lins, Rozeff, and Dhaliwal 1981, Healy and Palepu 2001). Disclosure is an instrument to bridge the gap between market perceptions and accounting stan-dards by providing further information about the value of assets and liabilities (Robinson and Lucas 2007). On the one hand, differences between mar-ket values and accounting values result as the bal-ance sheet does not recognize certain assets and liabilities at market price. Market and book values of equity differ as a consequence. On the other hand,
BuR - Business Research Official Open Access Journal of VHB Verband der Hochschullehrer für Betriebswirtschaft e.V. ���� � � ���� � � ����� ���� � �8��2
��
what is perceived as an asset differs between an accounting standard and the market. Although cer-tain intangibles are not recognized in the balance sheet they are valued by the market and co-determine a firm’s market value. Accordingly, mar-ket value can also be explained by varying recogni-tion of assets/liabilities following accounting stan-dards and market perceptions. Often book values do not exceed market values of assets while the reverse is true for liabilities. Fur-thermore, the value of intangible assets considera-bly exceeds that of intangible liabilities. The book value of total equity is therefore lower than market capitalization. As intangible assets are much more important for firms than intangible liabilities I will restrict myself to the former. A difference between market capitalization and equity book values may result because (1) valuation differences between accounting standards and the market are small, (2) the firm has few, low-value intangible assets, and (3) the firm has difficulties in explaining the inherent value of intangible assets to the capital market (Beattie and Thomson 2005). The first effect only relates to mandatory disclosure that is not ad-dressed here as discussed in the introduction. The second effect is not linked to disclosure, but the third can easily be influenced by a firm’s disclosure policy. Given the bias of disclosure towards “good news” market value should increase following dis-closure. Empirical papers researching the topic often rely on multiple regression models with market capitaliza-tion as the dependent, certain disclosure measures as independent, and controls for items that are not (or not at market values) recognized in the balance sheet, e.g., equity book values, total assets and li-abilities. They overwhelmingly support a positive relation between disclosure and market capitaliza-tion (e.g., Landsman 1986, Barth 1991, Healy, Hutton, and Palepu 1999, Ritter and Welch 2002). Contradictory, Mangena and Tauringana (2007) failed to reproduce a relation between disclosure level and market capitalization. Summarizing, based on theory and empirical evi-dence I hypothesize the following.
H4: Corporate disclosure and market capitaliza-tion are positively associated.
4 Research Design This section documents the empirical design to evaluate the four hypotheses from the preceding sections.
4.1 Regression Models First I establish the regression models. In addition to corporate disclosure a number of control vari-ables used in previous studies are included to ascer-tain the explanatory power of disclosure for the respective dependent variable.
4.1.1. Trading Activity Prior empirical studies suggested that a number of parameters besides corporate disclosure affect trad-ing activity. In line with Leuz and Verrecchia (2000) I use the free float that measures shareholder con-centration as a control for trading activity. Empirical evidence of whether firm size is associated with share turnover is mixed. Some studies find a nega-tive association of firm size and share turnover (e.g., Tkac 1999); some a positive (e.g., Bessembinder, Chan, and Seguin 1996, Leuz and Verrecchia 2000). The positive relation between price volatility and share turnover is well documented in the empirical literature (see the review of Bessembinder and Se-guin 1993). Membership to stock exchange seg-ments may also influence share turnover (Tkac 1999) as inclusion into major stock exchange indices is found to increase trading activity (Shleifer 1986, Harris and Gurel 1986, Vijh 1994, Beneish and Whaley 1996, Lynch and Mendenhall 1997). Other studies documented increasing trading activities for cross-listed firms (e.g., Bancel and Mittoo 2001 and the overview at Karolyi 1998). Therefore, I evaluate H1 using the following multi-ple regression equation.
(2) SHARE_TURNOVER = a0 + a1 · DISCLOSURE + a2 · FREEFLOAT + a3 · SIZE + a4 · VOLATILITY + a5 · EXCHANGE_ SEGMENT + a6 · CROSSLISTING + �.
4.1.2. Bid-Ask Spread Prior research developed various approaches to measuring spreads. Following Stoll (2000) I here use the proportional quoted half-spread defined as (ask price – bid price) / (2 · closing price) as all

BuR - Business Research Official Open Access Journal of VHB Verband der Hochschullehrer für Betriebswirtschaft e.V. ���� � � ���� � � ����� ���� � �8��2
��
required information is easily available. I measure this spread as the annual average based on daily ask, bid, and closing prices. The proportional quoted half-spread does not allow to separate the transac-tion-cost-based from information-based spread components (Glosten and Harris 1988). These two components cannot be separated here because in-formation about each single trade within a certain period of time is not available. However, I argue that the approximation error is acceptable as the transaction-cost spread compo-nent is low relative to the information-based on the Deutsche Börse. Between the mid-1980s and 1995 the proportion of the information-based spread on the NYSE increased from 43 percent to between 47 and 54 percent (Stoll 1989, Menyah and Paudyal 2000). Transaction costs further decrease with in-creasing electronic trading (Weber 2006) and the spread is more sensitive to incoming new informa-tion in electronic trading systems compared to floor trading (Aitken, Frino, Hill, and Jarnecic 2004). In 2006 about 92 percent of all trades on the Deutsche Börse were processed using the electronic Xetra system. Therefore, the information-based spread is supposed to be considerably larger than the transac-tion-cost-based spread and the approximation error is acceptable. Furthermore, for the regression analy-sis the total level of the transaction-cost spread is irrelevant as long as it is identical for all securities. This is most likely true for order processing cost, but not for inventory cost that varies with the risk of an individual security. However, inventory cost con-tributes to the total spread only marginally (Stoll 1989). I consider a number of control variables when eva-luating the relation between corporate disclosure and the spread. Empirical evidence suggests that the spread increases with large, especially institutional investors as they tend to have insider knowledge (e.g., Chiang and Venkatesh 1988, Leuz 2003). The analyst following has a depressant effect on the spread (e.g., Brennan and Subrahmanyam 1995, Leuz and Verrecchia 2000), but no data are avail-able for the German capital market, unfortunately. Stock exchange turnover as a measure of trading ac-tivity, the closing price, and market capitalization also inhibit the spread (e.g., Lev 1988, Leuz and Verrecchia 2000, Stoll 2000, Brockman and Chung 2003, Leuz 2003, Heflin, Shaw, and Wild 2005,
Chang, Chen, Liao, and Mishra 2006). I do not con-sider the closing price and market capitalization as additional controls because the proportional quoted half-spread already accounts for the closing price and market value information beyond firm size. Prior research found higher spreads with higher volatility of prices (e.g., Leuz and Verrecchia 2000, Stoll 2000, Leuz 2003, Heflin, Shaw, and Wild 2005) and lower spreads for larger firms (e.g., Leuz and Verrecchia 2000, Leuz 2003, Heflin, Shaw, and Wild 2005, Ali, Chen, and Radhakrishnan 2007). I use the following multiple regression equation to evaluate H2.
(3) SPREAD = a0 + a1 · DISCLOSURE + a2 · FREEFLOAT + a3 · SIZE + a4 · SHARE_ TURNOVER + a5 · VOLATILITY + �.
4.1.3. Investors’ Return Requirements Return expectations, i.e. ex-ante returns of securi-ties are not easy to measure from an empirical per-spective. Following Francis, LaFond, Olsson, and Schipper (2004) I therefore use ex-post returns measured as annual average of ex-post daily stock return deviations from the industry average. This deviation also controls for industry effects. In line with Easley, Hvidkjaer, and O’Hara (2002) I use firm size as a control variable in addition to industry and the following multiple regression equation re-sults for H3.
(4) ABNORMAL_RETURN = a0 + a1 · DISCLOSURE + a2 · SIZE + �.
4.1.4. Market Capitalization Accounting information is not completely value irrelevant. Therefore, I control for book value of equity in line with Hughes (2000) and Bowen, Da-vis, and Rajgopal (2002). Following Bowen, Davis, and Rajgopal (2002) I also control for other firm size effects using an additional size measure. In line with Abdolmohammadi (2005) I also use abnormal returns beyond the industry average as a control variable, although no significant influence was do-cumented in prior research. Altogether the following multiple regression equation results for H4.
(5) MARKET_VALUE = a0 + a1 · DISCLOSURE + a2 · COMMON_EQUITY + a3 · SIZE + a4 · ABNORMAL_RETURN + �.

BuR - Business Research Official Open Access Journal of VHB Verband der Hochschullehrer für Betriebswirtschaft e.V. ���� � � ���� � � ����� ���� � �8��2
��
4.2 Empirical Measures This section documents the measures used for test-ing the models set up in section 4.1.
4.2.1. Proxies for Corporate Disclosure Previous studies used a wide variety of methods to measure corporate disclosure, including the popular rating provided by the Association for Investment and Management (AIMR) (e.g., Lang and Lund-holm 1993, 1996, Welker 1995, Sengupta 1998, Hea-ly, Hutton, and Palepu 1999, Bushee and Noe 2000, Botosan and Plumlee 2002, Lundholm and Myers 2002), scores from the Center for International Financial Analysis & Research (CIFAR) (e.g., Carlin and Mayer 2003, Hope 2003, Bushee 2004, Bush-man, Piotroski, and Smith 2004, Francis, Khurana, and Pereira 2005), Standard & Poor’s Scoring (e.g., Khanna, Palepu, and Srinivasan 2004, Durnev and Kim 2005, Ali, Chen, and Radhakrishnan 2007, Doidge, Karolyi, and Stulz 2007), and scores derived from manual, proprietary text analysis. No raw data are available for the German sample. Therefore, I derive disclosure measures from firms’ annual reports using the Artificial Intelligence Mea-surement of Disclosure (AIMD) (Grüning 2011). It measures disclosure in ten distinctive information dimensions (financial information, information about customers, information about the value chain, information about employees, information about R&D, information about corporate strategy, infor-mation about corporate governance, information about the stock market, and information about so-cial and environmental responsibility). Appendix A provides further details about AIMD. For the empirical analysis I aggregate the AIMD measures for the ten disclosure dimensions (DIS-CLOSURE_01 … DISCLOSURE_10) using factor analysis. Based on a KMO of 0.928 and one eigen-value above one (8.123) a single factor (DISCLO-SURE) is extracted.
4.2.2. Other measures The remaining variables are taken from either Data-stream Worldscope or the Hoppenstedt Firmen-datenbank, depending on information availability and sample coverage. Following Francis, LaFond, Olsson, and Schipper (2004) I proxy abnormal returns beyond the indus-try average (ABNORMAL_RETURN) by the 2006 annual average of daily abnormal stock returns against the industry average using four industry groups described in Table 1. Daily stock returns are
obtained from Datastream Worldscope. Equity book values (COMMON_EQUITY) are measured by the 2006 book value of total equity obtained from Hop-penstedt. In line with Archambault and Archam-bault (2003) CROSSLISTING is the number of countries a firm is listed outside Germany based on the Datastream list of stock exchanges. EX-CHANGE_SEGMENT distinguishes between firms listed in the Prime (coding 1) and General Standard (coding 2) based on Deutsche Börse information. The percentage of shares not hold by strategic inves-tors (FREEFLOAT) measures shareholder concen-tration in line with Leuz and Verrecchia (2000). Data are obtained from the Deutsche Börse Weight-ing Files. MARKET_VALUE is the market value of the firm obtained from Datastream. Trading activity is measured as the turnover of shares (SHARE_TURNOVER) in 2006 obtained from Datastream. Following Hagerman and Zmijewski (1979) and Ecker, Francis, Kim, Olsson, and Schip-per (2006), SIZE is measured as the natural loga-rithm of total sales of the firm in 2006 obtained from Hoppenstedt. In line with Stoll (2000) infor-mation asymmetry is measured by the annual aver-age of daily proportionally quoted half-spreads 2006 (SPREAD). Ask, bid, and closing prices are obtained from Datastream. VOLATILITY is the standard deviation of daily prices 2006 divided by the mean price 2006. Daily prices are taken from Datastream.
4.3 Sample and Descriptive Results The hypotheses are evaluated using a sample that initially consists of all 600 German firms listed in the Prime and General Standard of the Deutsche Börse in 2006. I exclude foreign firms listed on the Deutsche Börse. Table 1 reports selected character-istics of the initial sample.
Table 1: Sample characteristics
Panel A: Industry of sample firms
industry number of firms in sample
production (NACE groups A, B, C, D, E, F)
264
commerce (NACE group G) 33
financial (NACE group J) 44
services (NACE groups H, I, K, L, M, N, O, P, Q)
259
600

BuR - Business Research Official Open Access Journal of VHB Verband der Hochschullehrer für Betriebswirtschaft e.V. ���� � � ���� � � ����� ���� � �8��2
��
Panel B: Size of sample firms
total sales number of firms in sample*
less than 107.5 € 159
less than 108.0 € 109
less than 108.5 € 119
less than 109.0 € 68
less than 109.5 € 51
less than 1010 € 22
less than 1010.5 € 17
more than 1010.5 € 11
556
* 44 missing values
The effective sample size decreases considerably because of missing values. Particularly, I could only obtain English-language annual reports for 390 firms. The effective sample size decreases further depending on availability of other measures in the Datastream and Hoppenstedt databases. I apply a list-wise deletion approach in order to retain a large proportion of the sample variance. Appendix B pro-vides selected descriptive statistics for the sample. I address the delay in the availability of annual re-ports by regressing disclosure measures for the annual report of 2005 that became available some-time in 2006 with controls and a dependent variable for 2006.1
Table 2: Multivariate regression of share turnover on disclosure
Panel A: Robust regression
Predicted Sign (Standardized) Coefficient t-Statistics p VIF
DISCLOSURE + 0.4546*** (5.12) 0.000 2.33
FREEFLOAT + 0.0580* (1.82) 0.070 1.13
SIZE ? 0.0564 (1.45) 0.147 2.36
VOLATILITY + 0.0510 (1.52) 0.130 1.14
EXCHANGE_SEGMENT – 0.0106 (0.45) 0.652 1.15
CROSSLISTING + 0.4414*** (8.75) 0.000 1.19
Condition Number 1 0.71
N 348
R2 0.6084
Panel B: Robust rank regression
Predicted Sign (Standardized) Coefficient t-Statistics p VIF
DISCLOSURE + 0.2253*** (3.81) 0.000 2.03
FREEFLOAT + 0.3473*** (7.26) 0.000 1.12
SIZE ? 0.0589 (0.99) 0.324 2.06
VOLATILITY + 0.1295*** (3.01) 0.003 1.14
EXCHANGE_SEGMENT – – 0.2562*** (–5.23) 0.000 1.17
CROSSLISTING + 0.1687*** (5.95) 0.000 1.14
Condition Number 9.79
N 348
R2 0.4456
The table reports standardized coefficients, t-statistics, significance values (p), and variance inflation factors (VIF) from a linear and a ranked OLS regression with heteroscedasticity-corrected errors. The dependent variable is the share turnover (SHARE_TURNOVER) 2006 obtained from Datastream. DISCLOSURE is the factor (KMO 0.928; one eigenvalue of 8.123 above one) extracted from the ten AIMD disclosure measures derived from annual reports of 2005. FREEFLOAT is the percentage of shares not hold by strategic inves-tors derived from the Deutsche Börse Weighting files 2006. SIZE is the natural logarithm of total sales 2006 obtained from the Hop-penstedt Firmendatenbank. VOLATILITY is the standard deviation of daily prices 2006 divided by the mean price 2006 with prices being obtained from Datastream. EXCHANGE_SEGMENT distinguishes between firms listed in the Prime (coding 1) and General Standard (coding 2). CROSSLISTING is the number of countries a firm is listed outside Germany based on the Datastream list of stock exchanges. All metric variables are winsorized at the 0.02 level at both extremes to adjust for potential outliers. * p<0.1, ** p<0.05, *** p<0.01.
___________________ 1 Raw data are available from the BuR – Business Research website.
BuR - Business Research Official Open Access Journal of VHB Verband der Hochschullehrer für Betriebswirtschaft e.V. ���� � � ���� � � ����� ���� � �8��2
�
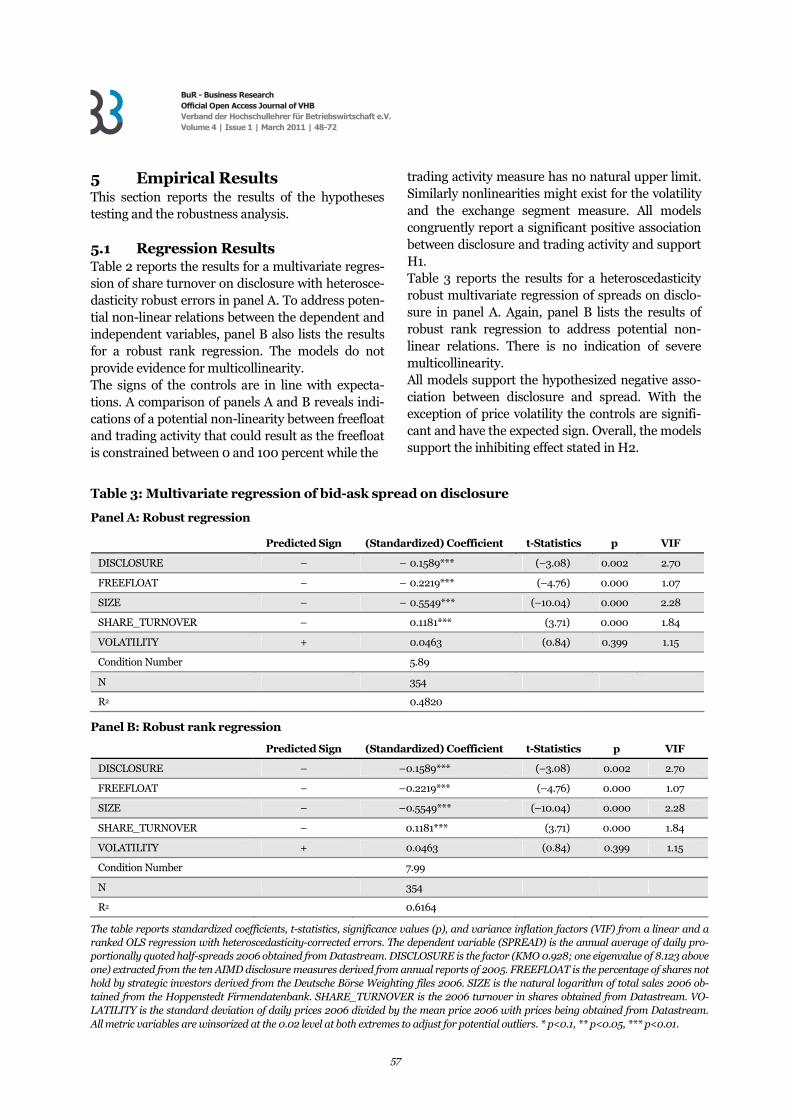
5 Empirical Results This section reports the results of the hypotheses testing and the robustness analysis. 5.1 Regression Results Table 2 reports the results for a multivariate regres-sion of share turnover on disclosure with heterosce-dasticity robust errors in panel A. To address poten-tial non-linear relations between the dependent and independent variables, panel B also lists the results for a robust rank regression. The models do not provide evidence for multicollinearity. The signs of the controls are in line with expecta-tions. A comparison of panels A and B reveals indi-cations of a potential non-linearity between freefloat and trading activity that could result as the freefloat is constrained between 0 and 100 percent while the
trading activity measure has no natural upper limit. Similarly nonlinearities might exist for the volatility and the exchange segment measure. All models congruently report a significant positive association between disclosure and trading activity and support H1. Table 3 reports the results for a heteroscedasticity robust multivariate regression of spreads on disclo-sure in panel A. Again, panel B lists the results of robust rank regression to address potential non-linear relations. There is no indication of severe multicollinearity. All models support the hypothesized negative asso-ciation between disclosure and spread. With the exception of price volatility the controls are signifi-cant and have the expected sign. Overall, the models support the inhibiting effect stated in H2.
Table 3: Multivariate regression of bid-ask spread on disclosure
Panel A: Robust regression
Predicted Sign (Standardized) Coefficient t-Statistics p VIF
DISCLOSURE – – 0.1589*** (–3.08) 0.002 2.70
FREEFLOAT – – 0.2219*** (–4.76) 0.000 1.07
SIZE – – 0.5549*** (–10.04) 0.000 2.28
SHARE_TURNOVER – 0.1181*** (3.71) 0.000 1.84
VOLATILITY + 0.0463 (0.84) 0.399 1.15
Condition Number 5.89
N 354
R2 0.4820
Panel B: Robust rank regression
Predicted Sign (Standardized) Coefficient t-Statistics p VIF
DISCLOSURE – – 0.1589*** (–3.08) 0.002 2.70
FREEFLOAT – – 0.2219*** (–4.76) 0.000 1.07
SIZE – – 0.5549*** (–10.04) 0.000 2.28
SHARE_TURNOVER – 0.1181*** (3.71) 0.000 1.84
VOLATILITY + 0.0463 (0.84) 0.399 1.15
Condition Number 7.99
N 354
R2 0.6164
The table reports standardized coefficients, t-statistics, significance values (p), and variance inflation factors (VIF) from a linear and a ranked OLS regression with heteroscedasticity-corrected errors. The dependent variable (SPREAD) is the annual average of daily pro-portionally quoted half-spreads 2006 obtained from Datastream. DISCLOSURE is the factor (KMO 0.928; one eigenvalue of 8.123 above one) extracted from the ten AIMD disclosure measures derived from annual reports of 2005. FREEFLOAT is the percentage of shares not hold by strategic investors derived from the Deutsche Börse Weighting files 2006. SIZE is the natural logarithm of total sales 2006 ob-tained from the Hoppenstedt Firmendatenbank. SHARE_TURNOVER is the 2006 turnover in shares obtained from Datastream. VO-LATILITY is the standard deviation of daily prices 2006 divided by the mean price 2006 with prices being obtained from Datastream. All metric variables are winsorized at the 0.02 level at both extremes to adjust for potential outliers. * p<0.1, ** p<0.05, *** p<0.01.

BuR - Business Research Official Open Access Journal of VHB Verband der Hochschullehrer für Betriebswirtschaft e.V. ���� � � ���� � � ����� ���� � �8��2
�
Table 4: Multivariate regression of abnormal returns on disclosure
Panel A: Robust regression
Predicted Sign (Standardized) Coefficient t-Statistics p VIF
DISCLOSURE – – 0.2504*** (–3.61) 0.000 2.08
SIZE + 0.5772*** (9.43) 0.000 2.08
Condition Number 1.01
N 361
R2 0.1875
Panel B: Robust rank regression
Predicted Sign (Standardized) Coefficient t-Statistics p VIF
DISCLOSURE – – 0.1538** (–2.47) 0.014 1.77
SIZE + 0.5215*** (9.16) 0.000 1.77
Condition Number 4.97
N 361
R2 0.1898
The table reports standardized coefficients, t-statistics, significance values (p), and variance inflation factors (VIF) from a linear and a ranked OLS regression with heteroscedasticity-corrected errors. The dependent variable (ABNORMAL_RETURN) is the 2006 annual average of daily abnormal stock returns against the industry average using four industry groups based on the NACE industry classifi-cation obtained from Datastream. DISCLOSURE is the factor (KMO 0.928; one eigenvalue of 8.123 above one) extracted from the ten AIMD disclosure measures derived from annual reports of 2005. SIZE is the natural logarithm of total sales 2006 obtained from the Hoppenstedt Firmendatenbank. All metric variables are winsorized at the 0.02 level at both extremes to adjust for potential outliers. * p<0.1, ** p<0.05, *** p<0.01.
Table 4 reports the results of a robust multivariate regression of abnormal returns on disclosure in panel A and the results of a robust rank regression in panel B. There are no indications for multicollin-earity. The models congruently support hypothesis H3 that disclosure and abnormal returns are negatively associated. Table 5 reports the results of a robust multivariate regression of market value on disclosure in panel A.
Panel B again lists the results of a robust rank re-gression to address potential nonlinear relations. The condition number for the model in panel A is at the lower end of the continuum between moderate and strong multicollinearity according to Belsley, Kuh, and Welsch (1980: 105) and therefore suggests a moderate multicollinearity problem. The alterna-tive variance inflation factors do not indicate a se-vere multicollinearity. The model in panel B does not show any indication of severe multicollinearity.
Table 5: Multivariate regression of market value on disclosure
Panel A: Robust regression
Predicted Sign (Standardized) Coefficient t-Statistics p VIF
DISCLOSURE + 0.1219*** (3.60) 0.000 2.31
COMMON_EQUITY + 0.7241*** (15.38) 0.000 4.94
SIZE ? 0.1342** (2.55) 0.011 5.08
ABNORMAL_RETURN ? – 0.0428* (–1.84) 0.067 1.27
Condition Number 4 4.65
N 345
R2 0.8539

BuR - Business Research Official Open Access Journal of VHB Verband der Hochschullehrer für Betriebswirtschaft e.V. ���� � � ���� � � ����� ���� � �8��2
��
Table 5 continued: Multivariate regression of market value on disclosure
Panel B: Robust rank regression
Predicted Sign (Standardized) Coefficient t-Statistics p VIF
DISCLOSURE + 0.1424*** (4.21) 0.000 1.88
COMMON_EQUITY + 0.7139*** (14.09) 0.000 3.79
SIZE ? 0.0990* (1.80) 0.073 4.12
ABNORMAL_RETURN ? – 0.0128 (–0.43) 0.671 1.28
Condition Number 1 1.31
N 345
R2 0.8029
The table reports standardized coefficients, t-statistics, significance values (p), and variance inflation factors (VIF) from a linear and a ranked OLS regression with heteroscedasticity-corrected errors. The dependent variable is the natural logarithm of market value (MARKET_VALUE) obtained from Datastream. DISCLOSURE is the factor (KMO 0.928; one eigenvalue of 8.123 above one) extracted from the ten AIMD disclosure measures derived from annual reports of 2005. COMMON_EQUITY is the natural logarithm of the book value of total equity obtained from Hoppenstedt Firmendatenbank. SIZE is the natural logarithm of total sales 2006 obtained from the Hoppenstedt Firmendatenbank. ABNORMAL_RETURN is the 2006 annual average of daily abnormal stock returns against the in-dustry average using four industry groups based on the NACE industry classification obtained from Datastream. All metric variables are winsorized at the 0.02 level at both extremes to adjust for potential outliers. * p<0.1, ** p<0.05, *** p<0.01.
It is not surprising to find a positive relation be-tween market value and common equity. In addi-tion, both models provide evidence for a positive association of disclosure and market value. In line with Abdolmohammadi (2005), no significant asso-ciation between abnormal returns and market value could be found. Altogether, the results support H4 that disclosure is value relevant.
5.2 Robustness Analysis Various robustness tests have been conducted to find out if sampling issues or the particular model specifications affect the findings. I test the regression models from section 5.1 for a sample selection bias using the two-step methodol-ogy of Heckman (1979). Here, the population is equivalent to all 600 listed firms. The samples con-sists of the 345 to 361 firms that could be considered for the respective regression models. I use the ex-change segment and the natural logarithm of total sales as determinants in the selection equation to address the fact that data might be more likely available for larger, Prime Standard firms. Lambda values for the share turnover and market value re-gressions are insignificant indicating no sample selection problem. Lambda values are significant for the spread and the abnormal return regressions. For these models I apply a Heckman correction. The Heckman-corrected results (see Table A-3 in Ap-pendix C) are structurally identical to the results shown in Tables 3 and 4 and support the significant
negative association of disclosure and the respective dependent variables. Altogether, the Heckman analysis provides no evidence that the findings are affected by sample selection bias. To examine whether the models are robust against varying specifications I use various alternative de-pendent and independent proxies. The factor ex-tracted from the natural logarithm of the ten AIMD measures, the sum of the ten AIMDs and the sum of the natural logarithm of the ten AIMDs are used as alternative disclosure measures. I use total sales, the number of employees and total assets, and the natu-ral logarithm of both as alternative size proxies. A binary variable if firms are crosslisted in the U.S. is used as an alternative proxy of crosslisting. Finally, I test if weekly and monthly averages of spreads and volatility as an alternative to daily averages affect the results. I found structurally identical results. Tables A-4 to A-7 in Appendix C provide the regres-sion results of a selection of these alternative model specifications.
6 Conclusion Corporate disclosure is discussed in the literature to have considerable capital market implications. In line with Healy and Palepu (2001) I examine market liquidity and capital cost implications of annual report disclosure for a sample of German firms listed on the Deutsche Börse. Different from other papers that rely on specific, narrow proxies for dis-closure I derive disclosure measures from annual

BuR - Business Research Official Open Access Journal of VHB Verband der Hochschullehrer für Betriebswirtschaft e.V.���� � � ���� � � ����� ���� � �8��2
��
reports using AIMD, a comprehensive, innovative computerized approach using artificial intelligence. The findings provide evidence that annual report disclosure positively affects market liquidity in the German capital market. Information disclosure changes market participants’ individual expecta-tions which in turn require portfolio adjustments leading to trading activities. The friction that hin-ders trading activities proxied by the bid-ask spread is also vulnerable to disclosure influences and the information and transaction-cost-based spread reduces with more information being disclosed. I also found that market liquidity benefits from the provision of additional information via disclosure in the German capital market in line with U.S. evi-dence (e.g., Welker 1995, Healy, Hutton, and Palepu 1999, Heflin, Shaw, and Wild 2005). Popular approaches to measure cost of capital, in-cluding the CAPM and the APT, do not provide insights into a potential equity-cost-reducing effect of disclosure as they do not allow to model informa-tion asymmetry reductions. Consequently, I found no association of the systematic risk (beta) and the level of annual report disclosure. This finding is contradictory to the influential Botosan (1997) anal-ysis but in line with theory and in line with the em-pirical studies of Auer (1998), De Alencar (2005), and Linsley and Shrives (2006). I found that inves-tors’ return requirements proxied by ex-post ab-normal returns are associated with a higher level of annual report disclosure for the German sample. In line with Easley, Hvidkjaer, and O’Hara (2002) this supports the view that capital cost reduction is a disclosure consequence within the Easley and O’Hara (2004) framework for the German capital market. The findings also support a capital-cost-reduction effect using market capitalization as an indirect measure of cost of capital. In line with e.g., Healy, Hutton, and Palepu (1999), Ritter and Welch (2002), and Linsley and Shrives (2006) I found that market value is positively associated with annual report disclosure. Using a sample of listed German firms the study supports the view that corporate disclosure in-creases market liquidity and reduces cost of capital. It therefore does not reveal evidence that the infor-mation processing at the German capital market might be structurally different from that on other capital markets.
Appendices
Appendix A: Artificial Intelligence Measurement of Disclosure (AIMD) The Artificial Intelligence Measure of Disclosure (AIMD) measures how informative a corporate text (e.g., annual report) is across ten information di-mensions: 1. sales-market and customer-related information, 2. employee-related information, 3. corporate environment information, 4. financial information, 5. corporate governance information, 6. research-and-development-related information, 7. social and environmental responsibility informa-
tion, 8. capital-market-related information, 9. corporate strategy information, and 10. information relating to the value chain.
AIMD differs from other disclosure measures with various respects. As described above it covers a broad understanding of disclosure, including non-financial and voluntary disclosure. Furthermore, AIMD extends word-count systems (e.g., Hussainey, Schleicher, and Walker 2003) by analysing more complex semantical units (“phrases”), and partly considers the grammatical structure of sentences. It does not require human interaction and judgement to derive disclosure measures from annual reports and therefore goes beyond current applications that only assist human beings in a manual coding proc-ess (e.g., Beattie, McInnes, and Fearnley 2004). Accordingly, AIMD is cost-effective and can be used with large samples. AIMD derives individual disclosure measures across the ten distinctive information dimensions listed above. As for most of these information dimensions it is not possible to discriminate between voluntary and mandatory disclosure (Cooke and Zeff 2007) AIMD does not distinguish between mandatory and voluntary disclosure. This does not weaken the ex-planatory power of the results as a fixed, mandatory disclosure component will not affect the estimated coefficients except in the form of a constant. AIMD implements an information-retrieval vector space model (Salton, Wong, and Yang 1975) using artificial-intelligence (AI) techniques and consists of the two usual AI phases. First, in the training phase, a coding scheme is established based on a sample of annual reports. Second, in the application phase,

BuR - Business Research Official Open Access Journal of VHB Verband der Hochschullehrer für Betriebswirtschaft e.V.���� � � ���� � � ����� ���� � �8��2
��
AIMD applies the coding scheme to a large number of new texts. Subsequently, some technical details are discussed. Grüning (2011) provided further documentation. AIMD measures disclosure based on the occurrence of certain N-grams, i.e. ordered sequences of N words. For example, “order backlog” is a bigram and “order backlog development” is a trigram. In the training phase, a coding scheme is created on the basis of a sample of representative annual re-ports, attempting to classify and quantify the diver-sity of corporate disclosures. Empirical evidence suggests that the coding scheme quickly converges and a training sample of 24 exemplary annual re-ports is comprehensive and complete, i.e. covers all relevant aspects of corporate disclosure (Grüning 2011). To reduce complexity and to improve applicability the different orthographical (e.g., “labor” vs. “la-bour”) and grammatical forms (plural, conjugation, and word order within an N-gram) in the raw cod-ing scheme are standardized to a morphological canonical form. Accordingly, the final coding scheme is independent of (1) stopwords without meaning (e.g., “and”, “or”), (2) the morphology of elements of N-grams and (3) permutations of the elements of N-grams. For ex-ample, the standardized bigram “employee number” also represents the tetragram “number of the em-ployees”. AIMD uses the stopword list of the Infor-mation Retrieval Group of the University of Glasgow for the first step. For the grammatical and ortho-graphical normalization in the second step it per-forms a dictionary-based stemming process using the Automatically Generated Inflection Database (AGID) that contains 112,503 roots of 281,904 in-flected forms and the Variant Conversion Info (Var-Con) that lists spelling variants of 16,019 words. Following the morphological normalization, permu-tations of the elements of an N-gram are standard-ized. Different grammatical structures of the Eng-lish language result in varying word orders within a sentence. When measuring the level of corporate disclosure only semantic differences are of impor-tance. For instance, there is no relevant semantic difference between the N-grams “flexible arrange-ment of the work time” and “an arrangement of flexible working time”. The final coding scheme comprises 13,314 standardized N-grams, covering
about 1024 different semantic units relevant for cor-porate disclosure. In the application phase AIMD applies the coding scheme from the training phase to a larger number of annual reports. Following Weber (1990) AIMD establishes a disclosure measure for each informa-tion dimension using category counts. The entire application phase is automated using proprietary software written in C#. As it does not contain any random component the application phase of AIMD is perfectly reliable, being entirely objective. Grüning (2011) demon-strated that AIMD has criterion validity and con-struct validity based on large U.S. and German samples. Construct validity, i.e. the convergence of the results of different measurement techniques, is tested against several common disclosure proxies. The analysis reveals strong and highly significant correlations against the AIMR rating, Standard & Poor’s Transparency and Disclosure Scoring, the ratings of the business magazines Manager Magazin and Capital/Focus Money as well as against firms’ disclosure self evaluations. AIMD also has criterion validity, i.e. can replicate theoretically predicted relations empirically, in the information asymmetry reduction proxied by the spread and the probability of information based trading (PIN) for a sample of about 13,700 and 11,600 U.S. firm-year observa-tions, respectively. AIMD disclosure measures can be derived from different forms of disclosure, including an-nual/quarterly reports, records from analysts’ meet-ings, press news, conference calls, and corporate web pages. AIMD raw data is available from the author on request.
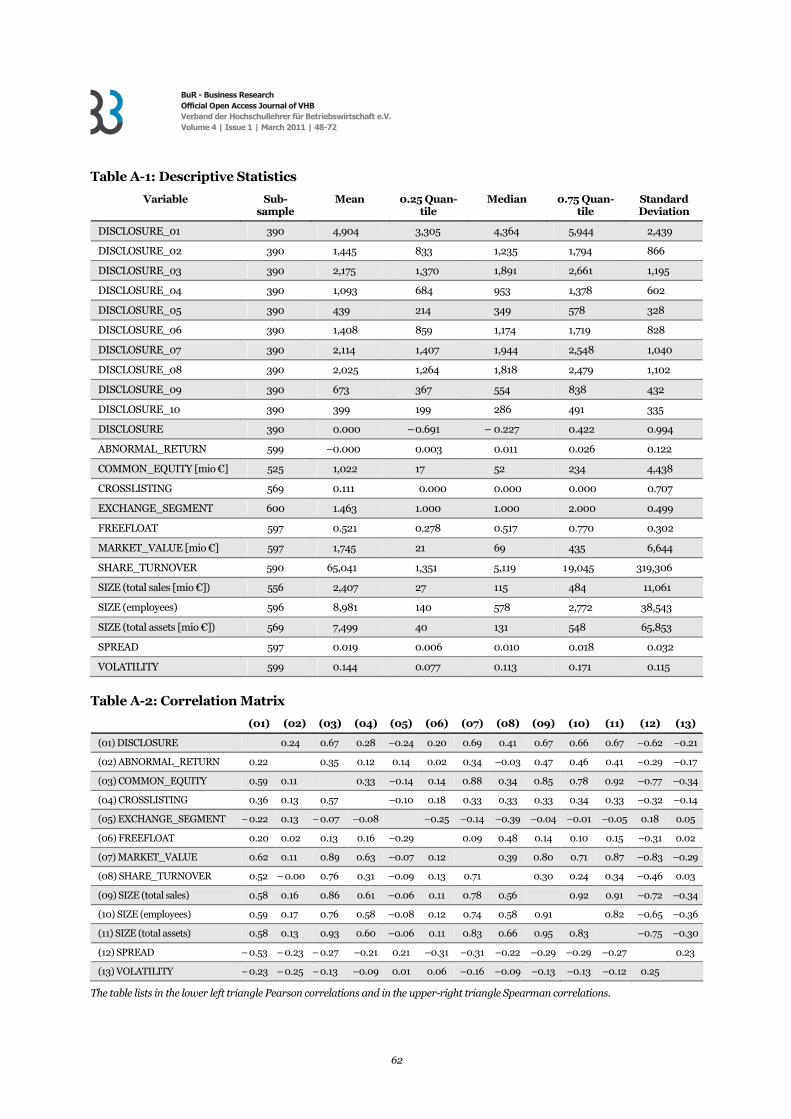
Appendix B: Descriptive Statistics Table A-1 provides descriptive statistics for the de-pendent and independent variables. The table lists the size of the available subsample, the mean, quan-tiles including the median, and the standard devia-tion. The disclosure level varies considerably be-tween industries (not reported) with highest mean disclosure for financial and lowest for service firms. It also varies with the exchange segment with higher mean disclosure for Prime Standard firms.
Table A-2 reports the correlation matrix between the variables. The correlations do not provide indi-cations of multicollinearity problems.
BuR - Business Research Official Open Access Journal of VHB Verband der Hochschullehrer für Betriebswirtschaft e.V. ���� � � ���� � � ����� ���� � �8��2
��
Table A-1: Descriptive Statistics
Variable Sub- sample
Mean 0.25 Quan- tile
Median 0.75 Quan- tile
Standard Deviation
DISCLOSURE_01 390 4,904 3,305 4,364 5,944 2,439
DISCLOSURE_02 390 1,445 833 1,235 1,794 866
DISCLOSURE_03 390 2,175 1,370 1,891 2,661 1,195
DISCLOSURE_04 390 1,093 684 953 1,378 602
DISCLOSURE_05 390 439 214 349 578 328
DISCLOSURE_06 390 1,408 859 1,174 1,719 828
DISCLOSURE_07 390 2,114 1,407 1,944 2,548 1,040
DISCLOSURE_08 390 2,025 1,264 1,818 2,479 1,102
DISCLOSURE_09 390 673 367 554 838 432
DISCLOSURE_10 390 399 199 286 491 335
DISCLOSURE 390 0.000 – 0.691 – 0.227 0.422 0.994
ABNORMAL_RETURN 599 –0.000 0.003 0.011 0.026 0.122
COMMON_EQUITY [mio €] 525 1,022 17 52 234 4,438
CROSSLISTING 569 0.111 0.000 0.000 0.000 0.707
EXCHANGE_SEGMENT 600 1.463 1.000 1.000 2.000 0.499
FREEFLOAT 597 0.521 0.278 0.517 0.770 0.302
MARKET_VALUE [mio €] 597 1,745 21 69 435 6,644
SHARE_TURNOVER 590 65,041 1,351 5,119 1 9,045 319,306
SIZE (total sales [mio €]) 556 2,407 27 115 484 11,061
SIZE (employees) 596 8,981 140 578 2,772 38,543
SIZE (total assets [mio €]) 569 7,499 40 131 548 65,853
SPREAD 597 0.019 0.006 0.010 0.018 0.032
VOLATILITY 599 0.144 0.077 0.113 0.171 0.115
Table A-2: Correlation Matrix
(01) (02) (03) (04) (05) (06) (07) (08) (09) (10) (11) (12) (13)
(01) DISCLOSURE 0.24 0.67 0.28 –0.24 0.20 0.69 0.41 0.67 0.66 0.67 –0.62 –0.21
(02) ABNORMAL_RETURN 0.22 0.35 0.12 0.14 0.02 0.34 –0.03 0.47 0.46 0.41 –0.29 –0.17
(03) COMMON_EQUITY 0.59 0.11 0.33 –0.14 0.14 0.88 0.34 0.85 0.78 0.92 –0.77 –0.34
(04) CROSSLISTING 0.36 0.13 0.57 –0.10 0.18 0.33 0.33 0.33 0.34 0.33 –0.32 –0.14
(05) EXCHANGE_SEGMENT – 0.22 0.13 – 0.07 –0.08 –0.25 –0.14 –0.39 –0.04 –0.01 –0.05 0.18 0.05
(06) FREEFLOAT 0.20 0.02 0.13 0.16 –0.29 0.09 0.48 0.14 0.10 0.15 –0.31 0.02
(07) MARKET_VALUE 0.62 0.11 0.89 0.63 –0.07 0.12 0.39 0.80 0.71 0.87 –0.83 –0.29
(08) SHARE_TURNOVER 0.52 – 0.00 0.76 0.31 –0.09 0.13 0.71 0.30 0.24 0.34 –0.46 0.03
(09) SIZE (total sales) 0.58 0.16 0.86 0.61 –0.06 0.11 0.78 0.56 0.92 0.91 –0.72 –0.34
(10) SIZE (employees) 0.59 0.17 0.76 0.58 –0.08 0.12 0.74 0.58 0.91 0.82 –0.65 –0.36
(11) SIZE (total assets) 0.58 0.13 0.93 0.60 –0.06 0.11 0.83 0.66 0.95 0.83 –0.75 –0.30
(12) SPREAD – 0.53 – 0.23 – 0.27 –0.21 0.21 –0.31 –0.31 –0.22 –0.29 –0.29 –0.27 0.23
(13) VOLATILITY – 0.23 – 0.25 – 0.13 –0.09 0.01 0.06 –0.16 –0.09 –0.13 –0.13 –0.12 0.25
The table lists in the lower left triangle Pearson correlations and in the upper-right triangle Spearman correlations.

BuR - Business Research Official Open Access Journal of VHB Verband der Hochschullehrer für Betriebswirtschaft e.V. ���� � � ���� � � ����� ���� � �8��2
��
Appendix C: Results of the Robustness Analysis This appendix provides results of the robustness analysis described in section 5.2. Table A-3 reports the Heckman-corrected results for the spread and abnormal return regressions that might potentially be affected by a sample selection error because of the significant lambda values. The Heckman-corrected results are structurally identical to the results shown in Tables 3 and 4 and therefore pro-vide no evidence for a sample selection bias.
Table A-4 reports results for selected alternative specifications of the share turnover regression from Table 2. The first column repeats the results of Pan-el A in Table 2 to allow a convenient comparison. I also examined non-logarithmic size measures and combinations of alternative measures. The results of these additional 135 regression models and the 143 rank regression models are not reported here but can be replicated using the publically available data-set. The results suggest that the share turnover in-crease with disclosure is robust.
Table A-3: Heckman-corrected multivariate regressions
Panel A: Multivariate regression of bid-ask spread on disclosure
(Standardized) Coefficient t-Statistics
DISCLOSURE – 0.0372* (–1.91)
FREEFLOAT – 0.0649*** (–4.83)
SIZE – 0.1701*** (–9.55)
SHARE_TURNOVER 0.0273** (2.06)
VOLATILITY 0.0157 (1.13)
EXCHANGE_SEGMENT – 2.4778*** (–14.63)
SIZE 0.6441*** (3.71)
LAMBDA 0.002*** (3.39)
N 555
Panel B: Multivariate regression of abnormal return on disclosure
(Standardized) Coefficient t-Statistics
DISCLOSURE – 0.2012*** (–2.98)
SIZE 0.5840*** (8.70)
EXCHANGE_SEGMENT – 2.7695*** (–13.68)
SIZE 0.8247*** (4.29)
LAMBDA 0.005*** (3.66)
N 555
The table reports standardized coefficients (except of LAMBDA where a non-standardized coefficient is reported) and t-statistics from linear OLS regressions using a Heckman selection model with two-step consistent estimates. Panel A reports results for the Heckman-corrected regression from Panel A of Table 3; Panel B reports results for the Heckman-corrected regression from Panel A of Table 4. The dependent variable in Panel A (SPREAD) is the annual average of daily proportionally quoted half-spreads 2006 obtained from Datastream. The dependent variable in Panel B (ABNORMAL_RETURN) is the 2006 annual average of daily abnormal stock returns against the industry average using four industry groups based on the NACE industry classification obtained from Datastream. DIS-CLOSURE is the factor (KMO 0.928; one eigenvalue of 8.123 above one) extracted from the ten AIMD disclosure measures derived from annual reports of 2005. FREEFLOAT is the percentage of shares not hold by strategic investors derived from the Deutsche Börse Weighting files 2006. SIZE is the natural logarithm of total sales 2006 obtained from the Hoppenstedt Firmendatenbank. SHARE_TURNOVER is the 2006 turnover in shares obtained from Datastream. VOLATILITY is the standard deviation of daily prices 2006 divided by the mean price 2006 with prices being obtained from Datastream. EXCHANGE_SEGMENT distinguishes between firms listed in the Prime (coding 1) and General Standard (coding 2). All metric variables are winsorized at the 0.02 level at both ex-tremes to adjust for potential outliers. * p<0.1, ** p<0.05, *** p<0.01.

BuR - Business Research Official Open Access Journal of VHB Verband der Hochschullehrer für Betriebswirtschaft e.V. ���� � � ���� � � ����� ���� � �8��2
��
Table A-4: Alternative multivariate regressions of share turnover on disclosure
Original Model
Alternative 1
Alternative 2
Alternative 3
Alternative 4
Alternative 5
Alternative 6
Alternative 7
Alternative 8
DISCLOSURE_1 0.4546*** 0.4150*** 0.3317*** 0.4343*** 0.4543*** 0.4543***
DISCLOSURE_2 0.2101***
DISCLOSURE_3 0.4457***
DISCLOSURE_4 0.2053***
FREEFLOAT 0.0580* 0.0774** 0.0610* 0.0760** 0.0681* 0.0738* 0.0548* 0.0599* 0.0585*
SIZE_1 0.0564 0.2213*** 0.0688* 0.2281*** 0.1053*** 0.0561 0.0558
SIZE_2 0.0687
SIZE_3 0.1686***
VOLATILITY_1 0.0510 0.0480 0.0492 0.0474 0.0471 0.0619** 0.0619*
VOLATILITY_2 0.0487
VOLATILITY_3 0.0499
EXCHANGE_SEGMENT 0.0106 – 0.0166 0.0135 – 0.0169 – 0.0173 – 0.0337 – 0.0022 0.0108 0.0111
CROSSLISTING_1 0.4414*** 0.4827*** 0.4435*** 0.4796*** 0.4671*** 0.4695*** 0.4420*** 0.4415***
CROSSLISTING_2 0.4290***
N 348 348 348 348 376 372 355 346 346
R2 0.6084 0.5406 0.6094 0.5402 0.6190 0.6451 0.6150 0.6080 0.6081
The table reports standardized coefficients from linear OLS regressions with heteroscedasticity-corrected errors. The results for the original model are also reported in Panel A of Table 2. The dependent variable is the share turnover (SHARE_TURNOVER) 2006 obtained from Datastream. DISCLOSURE_1 is the factor (KMO 0.928; one eigenvalue of 8.123 above one) extracted from the ten AIMD disclosure measures derived from annual reports of 2005. The alternative measure DISCLOSURE_2 is the factor (KMO 0.935; one eigenvalue of 8.216 above one) extracted from the natural logarithm of the ten AIMD disclosure measures derived from annual reports of 2005. The alternative measure DISCLOSURE_3 is the unweighted sum of the ten AIMD disclosure measures derived from annual reports of 2005. The alternative measure DISCLOSURE_4 is the unweighted sum of the natural logarithm of the ten AIMD disclosure measures derived from annual reports of 2005. FREEFLOAT is the percentage of shares not hold by strategic investors derived from the Deutsche Börse Weighting files 2006. SIZE_1 is the natural logarithm of total sales 2006 obtained from the Hoppenstedt Firmendatenbank. The alternative measure SIZE_2 is the natural logarithm of the number of group employees 2006 obtained from the Hoppenstedt Firmendatenbank. The alternative measure SIZE_3 is the natural logarithm of total assets 2006 obtained from the Hoppenstedt Firmendatenbank. VOLATILITY_1 is the standard deviation of daily prices 2006 divided by the mean price 2006 with prices being obtained from Datastream. The alternative VOLATILITY_2 is the standard deviation of monthly prices 2006 divided by the mean price 2006 with prices being obtained from Datastream. The alternative VOLATILITY_3 is the standard deviation of weekly prices 2006 divided by the mean price 2006 with prices being obtained from Datastream. EXCHANGE_SEGMENT distinguishes between firms listed in the Prime (coding 1) and General Standard (coding 2). CROSSLISTING_1 is the number of countries a firm is listed outside Germany based on the Datastream list of stock exchanges. The alternative CROSSLISTING_2 equals 1 if the firm is crosslisted in the U.S. and 0 otherwise. All metric vari-ables are winsorized at the 0.02 level at both extremes to adjust for potential outliers. * p<0.1, ** p<0.05, *** p<0.01.
BuR - Business Research Official Open Access Journal of VHB Verband der Hochschullehrer für Betriebswirtschaft e.V. ���� � � ���� � � ����� ���� � �8��2
��
Table A-5: Alternative multivariate regressions of bid-ask spread on disclosure
Original Model
Alternative 1
Alternative 2
Alternative 3
Alternative 4
Alternative 5
Alternative 6
Alternative 7
Alternative 8
Alternative 9
DISCLOSURE_1 – 0.1589*** – 0.2971*** – 0.2630** – 0.1557*** – 0.1542*** – 0.1578*** – 0.1624***
DISCLOSURE_2 – 0.1490***
DISCLOSURE_3 – 0.1420***
DISCLOSURE_4 – 0.1831***
FREEFLOAT – 0.2219*** – 0.2218*** – 0.2234*** – 0.2186*** – 0.2206*** – 0.2463*** – 0.2227*** – 0.2255*** – 0.2464*** – 0.2459***
SIZE_1 – 0.5549*** – 0.5594*** – 0.5661*** – 0.5327*** – 0.5632*** – 0.5578*** – 0.5028*** – 0.5072***
SIZE_2 – 0.3749***
SIZE_3 – 0.4353***
SHARE_TURNOVER 0.1181*** 0.0866*** 0.1128*** 0.0943*** 0.0990*** 0.1500*** 0.1210*** 0.1188*** 0.1170*** 0.1057***
VOLATILITY_1 0.0463 0.0490 0.0472 0.0490 0.0686 0.0738 0.0579 0.0446
VOLATILITY_2 0.0323
VOLATILITY_3 0.0496
N 354 354 354 354 382 376 352 352 353 353
R2 0.4820 0.4836 0.4805 0.4896 0.4178 0.4241 0.4821 0.4833 0.4356 0.4468
The table reports standardized coefficients from linear OLS regressions with heteroscedasticity-corrected errors. The results for the original model are also reported in Panel A of Table 3. The dependent variable of the original model and alternatives 1 to 7 is the annual average of daily proportionally quoted half-spreads 2006 obtained from Datastream. The dependent variable of alternative 8 is the annual average of monthly proportionally quoted half-spreads 2006 obtained from Datastream. The dependent variable of alternative 9 is the annual average of weekly proportionally quoted half-spreads 2006 obtained from Datastream. DISCLOSURE_1 is the factor (KMO 0.928; one eigenvalue of 8.123 above one) extracted from the ten AIMD disclosure measures derived from annual reports of 2005. The alternative measure DISCLOSURE_2 is the factor (KMO 0.935; one eigenvalue of 8.216 above one) extracted from the natural logarithm of the ten AIMD disclosure measures derived from annual reports of 2005. The alternative measure DISCLOSURE_3 is the unweighted sum of the ten AIMD disclosure measures derived from annual reports of 2005. The alternative measure DISCLOSURE_4 is the unweighted sum of the natural logarithm of the ten AIMD disclosure measures derived from annual reports of 2005. FREEFLOAT is the percentage of shares not hold by strategic investors derived from the Deutsche Börse Weighting files 2006. SIZE_1 is the natural logarithm of total sales 2006 obtained from the Hoppenstedt Firmendatenbank. The alternative measure SIZE_2 is the natural logarithm of the number of group employees 2006 obtained from the Hoppenstedt Firmendatenbank. The alternative measure SIZE_3 is the natural logarithm of total assets 2006 obtained from the Hoppenstedt Firmendatenbank. SHARE_TURNOVER is the 2006 turnover in shares obtained from Datastream. VOLATILITY_1 is the standard deviation of daily prices 2006 divided by the mean price 2006 with prices being obtained from Datastream. The alternative VOLATILITY_2 is the standard deviation of monthly prices 2006 divided by the mean price 2006 with prices being obtained from Datastream. The alternative VOLATILITY_3 is the standard deviation of weekly prices 2006 divided by the mean price 2006 with prices being obtained from Datastream. All metric variables are winsorized at the 0.02 level at both extremes to adjust for potential outliers. * p<0.1, ** p<0.05, *** p<0.01.

BuR - Business Research Official Open Access Journal of VHB Verband der Hochschullehrer für Betriebswirtschaft e.V. ���� � � ���� � � ����� ���� � �8��2
��
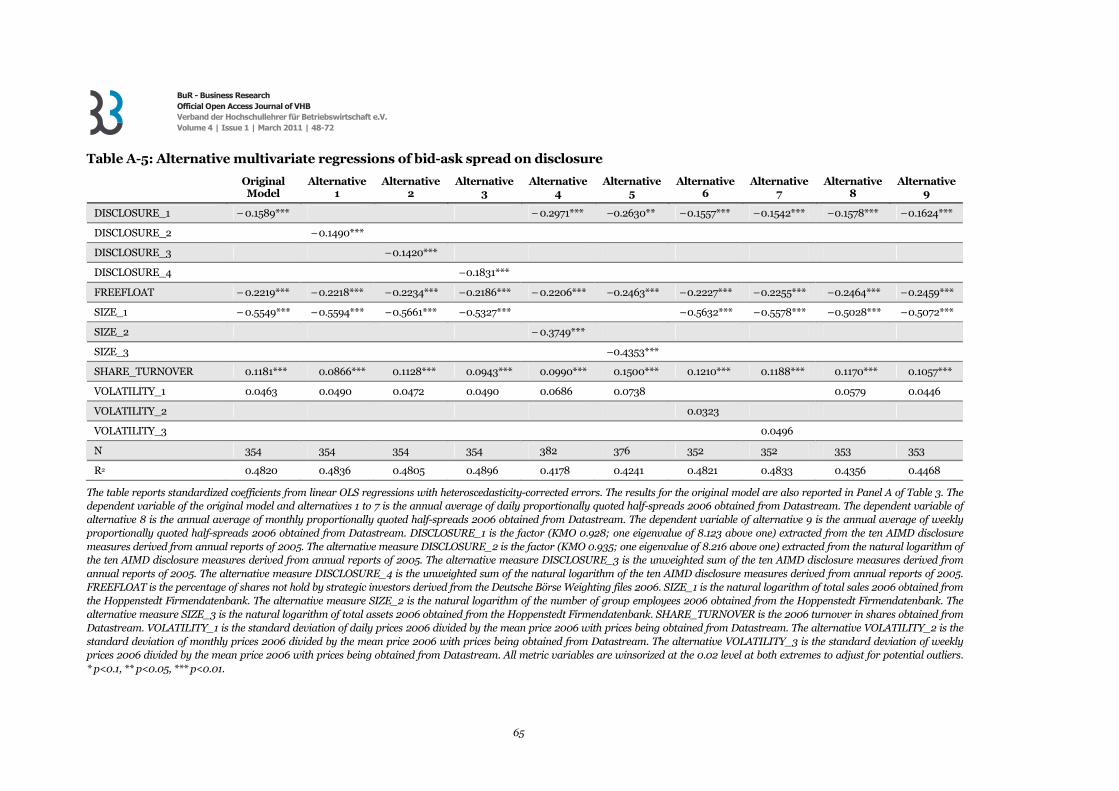
Table A-5 reports results for selected alternative specifications of the spread regression from Table 3. Again, the first column repeats the results of Panel A in Table 3 to allow a convenient comparison. Non-logarithmic size measures and combinations of alternative measures have also been examined. In line with the share turnover regression the results of these additional 368 regression models and the 377 alternative rank regression models are not reported here. The publically available dataset allows to repli-cate these regressions. The results provide evidence that the spread-reducing effect of disclosure is ro-bust against particular specifications of the model.
Table A-6 reports results for selected alternative specifications of the abnormal return regression from Table 4. Similar to the previous analyses the first column repeats the results of Panel A in Table 4 to allow a convenient comparison. Results for addi-tional 18 regression models that consider non-logarithmic size measures and combinations of
alternative measures and 24 alternative rank regres-sion models are not reported here. They can be eas-ily replicated using the publically available dataset. Altogether, the results suggest that the negative association of disclosure and abnormal returns is robust against particular model specifications.
Table A-7 reports results for selected alternative specifications of the market value regression from Table 5. The first column again repeats the results of Panel A in Table 5 to allow a convenient compari-son. I also considered non-logarithmic size meas-ures and combinations of alternative measures. The results of these additional 18 regression models and the 24 alternative rank regression models are not reported as they can be easily replicated using the publically available dataset. The robustness analysis provides evidence that the positive association of market value and disclosure is robust against the particular model specification.
Table A-6: Alternative multivariate regressions of abnormal returns on disclosure
Original Model
Alternative 1
Alternative 2
Alternative 3
Alternative 4
Alternative 5
DISCLOSURE_1 – 0.2504*** – 0.3157*** – 0.0543
DISCLOSURE_2 – 0.1642***
DISCLOSURE_3 – 0.2571***
DISCLOSURE_4 – 0.1398***
SIZE_1 0.5772*** 0.5088*** 0.5780*** 0.4905***
SIZE_2 0.5388***
SIZE_3 0.2071**
N 361 361 361 361 389 381
R2 0.1875 0.1717 0.1906 0.1681 0.1527 0.0293
The table reports standardized coefficients from linear OLS regressions with heteroscedasticity-corrected errors. The results for the origi-nal model are also reported in Panel A of Table 4. The dependent variable (ABNORMAL_RETURN) is the 2006 annual average of daily abnormal stock returns against the industry average using four industry groups based on the NACE industry classification obtained from Datastream. DISCLOSURE_1 is the factor (KMO 0.928; one eigenvalue of 8.123 above one) extracted from the ten AIMD disclosure measures derived from annual reports of 2005. The alternative measure DISCLOSURE_2 is the factor (KMO 0.935; one eigenvalue of 8.216 above one) extracted from the natural logarithm of the ten AIMD disclosure measures derived from annual reports of 2005. The alternative measure DISCLOSURE_3 is the unweighted sum of the ten AIMD disclosure measures derived from annual reports of 2005. The alternative measure DISCLOSURE_4 is the unweighted sum of the natural logarithm of the ten AIMD disclosure measures derived from annual reports of 2005. SIZE_1 is the natural logarithm of total sales 2006 obtained from the Hoppenstedt Firmendatenbank. The alternative measure SIZE_2 is the natural logarithm of the number of group employees 2006 obtained from the Hoppenstedt Firmen-datenbank. The alternative measure SIZE_3 is the natural logarithm of total assets 2006 obtained from the Hoppenstedt Firmendaten-bank. All metric variables are winsorized at the 0.02 level at both extremes to adjust for potential outliers. * p<0.1, ** p<0.05, *** p<0.01.

BuR - Business Research Official Open Access Journal of VHB Verband der Hochschullehrer für Betriebswirtschaft e.V. ���� � � ���� � � ����� ���� � �8��2
�
Table A-7: Alternative multivariate regressions of market value on disclosure
Original Model
Alternative 1
Alternative 2
Alternative 3
Alternative 4
Alternative 5
DISCLOSURE_1 0.1219*** 0.1265*** 0.1171***
DISCLOSURE_2 0.1062***
DISCLOSURE_3 0.1105***
DISCLOSURE_4 0.1136***
COMMON_EQUITY 0.1342** 0.1365*** 0.1386*** 0.1402***
SIZE_1 0.0219
SIZE_2 0.2094***
SIZE_3 0.7241*** 0.7408*** 0.7302*** 0.7330*** 0.8198*** 0.6455***
ABNORMAL_RETURN – 0.0428* – 0.0467** – 0.0426* – 0.0478** – 0.0244 – 0.0191
N 345 345 345 345 371 372
R2 0.8539 0.8532 0.8530 0.8541 0.8686 0.8730
The table reports standardized coefficients from linear OLS regression with heteroscedasticity-corrected errors. The results for the origi-nal model are also reported in Panel A of Table 5. The dependent variable is the natural logarithm of market value (MARKET_VALUE) obtained from Datastream. DISCLOSURE_1 is the factor (KMO 0.928; one eigenvalue of 8.123 above one) extracted from the ten AIMD disclosure measures derived from annual reports of 2005. The alternative measure DISCLOSURE_2 is the factor (KMO 0.935; one eigen-value of 8.216 above one) extracted from the natural logarithm of the ten AIMD disclosure measures derived from annual reports of 2005. The alternative measure DISCLOSURE_3 is the unweighted sum of the ten AIMD disclosure measures derived from annual reports of 2005. The alternative measure DISCLOSURE_4 is the unweighted sum of the natural logarithm of the ten AIMD disclosure measures derived from annual reports of 2005. COMMON_EQUITY is the natural logarithm of the book value of total equity obtained from Hop-penstedt Firmendatenbank. SIZE_1 is the natural logarithm of total sales 2006 obtained from the Hoppenstedt Firmendatenbank. The alternative measure SIZE_2 is the natural logarithm of the number of group employees 2006 obtained from the Hoppenstedt Firmen-datenbank. The alternative measure SIZE_3 is the natural logarithm of total assets 2006 obtained from the Hoppenstedt Firmendaten-bank. ABNORMAL_RETURN is the 2006 annual average of daily abnormal stock returns against the industry average using four indus-try groups based on the NACE industry classification obtained from Datastream. All metric variables are winsorized at the 0.02 level at both extremes to adjust for potential outliers. * p<0.1, ** p<0.05, *** p<0.01.
Acknowledgements I appreciate the comments of the participants of the 2008 European Accounting Association Annual Meeting, the 2008 American Accounting Associa-tion Annual Meeting, and the 2009 Business Re-search Conference in Finance, Accounting & Taxa-tion and two anonymous referees.
References
Abdolmohammadi, Mohammad J. (2005): Intellectual Capital Disclosure and Market Capitalization, Journal of Intellectual Capital, 6 (3): 397–416.
Aitken, Michael J., Alex Frino, Amelia M. Hill, and Elvis Jarnecic (2004): The Impact of Electronic Trading on Bid-Ask-Spreads: Evidence from Futures Markets in Hong Kong, London, and Sydney, The Journal of Future Markets, 24 (7): 675–696.
Ali, Ashiq, Tai-Yuan Chen, and Suresh Radhakrishnan (2007): Corporate Disclosure by Family Firms, Journal of Accounting and Economics, 44 (1–2): 238–286.
Amihud, Yakov and Haim Mendelson (1986): Asset Pricing and the Bid-Ask Spread, Journal of Financial Economics, 17 (2): 223–249.
Archambault, Jeffrey J. and Marie E. Archambault (2003): A Multinational Test of Determinants of Corporate Disclosure, The International Journal of Accounting, 38 (2): 173–194.
Attig, Najah, Wai-Ming Fong, Yoser Gadhoum, and Larry H. P. Lang (2006): Effects of Large Shareholding on Information Asymmetry and Stock Liquidity, Journal of Banking & Finance, 30 (10): 2875–2892.
Auer, Kurt V. (1998): Der Einfluss des Wechsels von Rechnungs-legungsstandards auf die Risikoparameter von schweizerischen Aktien, Zeitschrift für betriebswirtschaftliche Forschung, 50 (2): 129–155.
Bailey, Warren, G. Andrew Karolyi, and Carolina Salva (2006): The Economic Consequences of Increased Disclosure: Evidence from International Cross-Listings, Journal of Financial Econom-ics, 81 (1): 175–213.
Bailey, Warren, Haitao Li, Connie X. Mao, and Rui Zhong (2003): Regulation Fair Disclosure and Earnings Information: Market, Analysts, and Corporate Responses, The Journal of Finance, 58 (6): 2487–2514.
Bamber, Linda Smith (1986): The Information Content of Annual Earnings Releases: A Trading Volume Approach, Journal of Accounting Research, 24 (1): 40–56.
Bamber, Linda Smith, Orie E. Barron, and Thomas L. Stober (1997): Trading Volume and Different Aspects of Disagreement

BuR - Business Research Official Open Access Journal of VHB Verband der Hochschullehrer für Betriebswirtschaft e.V. ���� � � ���� � � ����� ���� � �8��2
�
Coincident with Earnings Announcements, The Accounting Review, 72 (4): 575–597.
Bamber, Linda Smith, Orie E. Barron, and Thomas L. Stober (1999): Differential Interpretations and Trading Volume, Journal of Financial and Quantitative Analysis, 34 (3): 369–386.
Bancel, Franck and Usha R. Mittoo (2001): European Managerial Perceptions of the Net Benefits of Foreign Stock Listings, Euro-pean Financial Management, 7 (2): 213–236.
Barron, Orie E. (1995): Trading Volume and Belief Revisions That Differ among Individual Analysts, The Accounting Review, 70 (4): 581–597.
Barth, Mary E. (1991): Relative Measurement Errors among Alternative Pension Asset and Liability Measures, The Accounting Review, 66 (3): 433–463.
Beattie, Vivien and Sarah Jane Thomson (2005): Intangibles and the OFR, Financial Management, (June): 29–30.
Beattie, Vivien, Bill McInnes, and Stella Fearnley (2004): A Meth-odology for Analysing and Evaluating Narratives in Annual Re-ports: A Comprehensive Descriptive Profile and Metrics for Dis-closure Quality Attributes, Accounting Forum, 28 (3): 205–236.
Beatty, Randolph P. and Jay R. Ritter (1986): Investment Bank-ing, Reputation, and the Underpricing of Initial Public Offerings, Journal of Financial Economics, 15 (1–2): 213–232.
Beaver, William H. (1968): The Information Content of Annual Earnings Announcements, Journal of Accounting Research, 6 (Suppl.): 67–92.
Belsley, David A., Edwin Kuh, and Roy E. Welsch (1980): Regres-sion Diagnostics: Identifying Influential Data and Sources of Collinearity, Wiley: New York.
Beneish, Messod D. and Robert E. Whaley (1996): An Anatomy of the „S&P Game“: The Effects of Changing the Rules, The Journal of Finance, 51 (5): 1909–1930.
Bernard, Victor L. (1995): The Feltham-Ohlson Framework: Implications for Empiricists, Contemporary Accounting Re-search, 11 (2): 733–747.
Bessembinder, Hendrik and Paul J. Seguin (1993): Price Volatil-ity, Trading Volume and Market Depth: Evidence from Futures Markets, Journal of Financial and Quantitative Analysis, 28 (1): 21–39.
Bessembinder, Hendrik, Kalok Chan, and Paul J. Seguin (1996): An Empirical Examination of Information, Differences of Opin-ion, and Trading Activity, Journal of Financial Economics, 40 (1): 105–134.
Black, Ervin L., Thomas A. Carnes, Tomas Jandik, and B. Char-lene Henderson (2007): The Relevance of Target Accounting Quality of the Long-Term Success of Cross-Border Mergers, Journal of Business Finance & Accounting, 34 (1–2): 139–168.
Bloomfield, Robert and Maureen O’Hara (1999): Market Trans-parency: Who Wins and Who Loses?, The Review of Financial Studies, 12 (1): 5–35.
Boone, Jeffery P. (1998): Oil and Gas Reserve Value Disclosures and Bid-Ask Spreads, Journal of Accounting and Public Policy, 17 (1): 55–84.
Boone, Jeffery P., Robert G. Luther, and K. K. Raman (1998): Market Microstructure Effects of U.S.-Canada Differences Relat-
ing to Reserve-Based Accounting Disclosures, Journal of Interna-tional Accounting, Auditing and Taxation, 7 (2): 195–214.
Botosan, Christine A. (1997): Disclosure Level and the Cost of Equity Capital, The Accounting Review, 72 (3): 323–349.
Botosan, Christine A. (2006): Disclosure and the Cost of Capital: What Do We Know?, Accounting and Business Research, 36 (Special Issue): 31–40.
Botosan, Christine A. and Marlene A. Plumlee (2002): A Re-Examination of Disclosure Level and the Expected Cost of Equity Capital, Journal of Accounting Research, 40 (1): 21–40.
Botosan, Christine A., Marlene A. Plumlee, and Yuan Xie (2004): The Role of Information Precision in Determining the Cost of Equity Capital, Review of Accounting Studies, 9 (2–3): 233–259.
Bowen, Robert M., Angela K. Davis, and Dawn A. Matsumoto (2005): Emphasis on Pro Forma versus GAAP Earnings in Quar-terly Press Releases: Determinants, SEC Intervention, and Market Reactions, The Accounting Review, 80 (4): 1011–1038.
Bowen, Robert M., Angela K. Davis, and Shivaram Rajgopal (2002): Determinants of Revenue-Reporting Practices for Inter-net Firms, Contemporary Accounting Research, 19 (4): 523–562.
Brennan, Michael J. and Avanidhar Subrahmanyam (1995): Investment Analysis and Price Formation in Securities Markets, Journal of Financial Economics, 38 (3): 361– 381.
Brockman, Paul and Dennis Y. Chung (2001): Managerial Timing and Corporate Liquidity: Evidence from Actual Share Repur-chases, Journal of Financial Economics, 61 (3): 417–448.
Brockman, Paul and Dennis Y. Chung (2003): Investor Protection and Firm Liquidity, The Journal of Finance, 58 (2): 921–938.
Bushee, Brian J. (2004): Discussion of Disclosure Practices of Foreign Companies Interacting with U.S. Markets, Journal of Accounting Research, 42 (2): 509–525.
Bushee, Brian J. and Christopher F. Noe (2000): Corporate Dis-closure Practices, Institutional Investors, and Stock Return Vola-tility, Journal of Accounting Research, 38 (Suppl.): 171–202.
Bushman, Robert M., Joseph D. Piotroski, and Abbie J. Smith (2004): What Determines Corporate Transparency?, Journal of Accounting Research, 42 (2): 207–252.
Carlin, Wendy and Colin Mayer (2003): Finance, Investment, and Growth, Journal of Financial Economics, 69 (1): 191–226.
Chang, Hsihui, Jengfang Chen, Woody M. Liao, and Birendra K. Mishra (2006): CEOs’/CFOs’ Swearing by the Numbers: Does It Impact Share Price of the Firm?, The Accounting Review, 81 (1): 1–27.
Chen, Shupin, Xia Chen, and Qiang Cheng (2008): Do Family Firms Provide More or Less Voluntary Disclosure?, Journal of Accounting Research, 46 (3): 499–536.
Cheng, C. S. Agnes, Denton Collins, and Henry He Huang (2006): Shareholder Rights, Financial Disclosure and the Cost of Equity Capital, Review of Quantitative Finance and Accounting, 27 (2): 175–204.
Chiang, Raymond and P. C. Venkatesh (1988): Insider Holdings and Perceptions of Information Asymmetry: A Note, The Journal of Finance, 43 (4): 1041–1048.

BuR - Business Research Official Open Access Journal of VHB Verband der Hochschullehrer für Betriebswirtschaft e.V. ���� � � ���� � � ����� ���� � �8��2
��
Chipalkatti, Niranjan (2005): Do Investors Reward Bank Disclo-sure Transparency? Evidence from India, Journal of Interna-tional Accounting Research, 4 (2): 25–52.
Choi, Frederick D. S. (1973): Financial Disclosure and Entry to the European Capital Market, Journal of Accounting Research, 11 (2): 159–175.
Clarkson, Pete, Jose Guedes, and Rex Thompson (1996): On the Diversification, Observability, and Measurement of Estimation Risk, Journal of Financial and Quantitative Analysis, 31 (1): 69–84.
Clarkson, Peter M., Jeniffer L. Kao, and Gordon D. Richardson (1994): The Voluntary Inclusion of Forecasts in the MD&A Sec-tion of Annual Reports, Contemporary Accounting Research, 11 (1): 423–450.
Coles, Jeffrey L., Uri Loewenstein, and Jose Suay (1995): On Equilibrium Pricing under Parameter Uncertainty, Journal of Financial and Quantitative Analysis, 30 (3): 347–364.
Coller, Maribeth and Teri Lombardi Yohn (1997): Management Forecasts and Information Asymmetry: An Examination of Bid-Ask Spreads, Journal of Accounting Research, 35 (2): 181–191.
Collins, Daniel W., Michael S. Rozeff, and Dan S. Dhaliwal (1981): The Economic Determinants of the Market Reaction to Proposed Mandatory Accounting Changes in the Oil and Gas Industry: A Cross-Sectional Analysis, Journal of Accounting and Economics, 3 (1): 37–71.
Cooke, T. E. (1993): Disclosure in Japanese Corporate Annual Reports, Journal of Business Finance & Accounting, 20 (4): 521–535.
Cooke, T. E. and S. A. Zeff (2007): A Continuum of Disclosure, Working Paper, University of Exeter.
Core, John E. (2001): A Review of the Empirical Disclosure Lit-erature: Discussion, Journal of Accounting and Economics, 31 (1–3): 441–456.
Davis, Frederick B. (1974): Standards for Educational & Psycho-logical Tests, American Psychological Association: Washington.
De Alencar, Roberta Carvalho (2005): Cost of Equity Capital and Disclosure Level in Brazilian Companies, Brazilian Business Review, 2 (1): 1–12.
Diamond, Douglas W. (1985): Optimal Release of Information By Firms, The Journal of Finance, 40 (4): 1071–1094.
Diamond, Douglas W. and Robert E. Verrecchia (1991): Disclo-sure, Liquidity, and the Cost of Capital, The Journal of Finance, 46 (4): 1325–1359.
Doidge, Craig, G. Andrew Karolyi, and René M. Stulz (2007): Why do Countries Matter so much for Corporate Governance?, Journal of Financial Economics, 86 (1): 1–39.
Durnev, Art and E. Han Kim (2005): To Steal or not to Steal: Firm Attributes, Legal Environment, and Valuation, The Journal of Finance, 60 (3): 1461–1493.
Dyckman, Thomas R. and Abbie J. Smith (1979): Financial Ac-counting and Reporting by Oil and Gas Producing Companies : A Study of Information Effects, Journal of Accounting and Eco-nomics, 1 (1): 45–75.
Dye, Ronald A. (2001): An Evaluation of „Essays on Disclosure“ and the Disclosure Literature in Accounting, Journal of Account-ing and Economics, 32 (1–3): 181–235.
Easley, David and Maureen O’Hara (2004): Information and the Cost of Capital, The Journal of Finance, 59 (4): 1553–1583.
Easley, David, Soeren Hvidkjaer, and Maureen O’Hara (2002): Is Information Risk a Determinant of Asset Returns?, The Journal of Finance, 57 (5): 2185–2221.
Eaton, Tim V., John R. Nofsinger, and Daniel G. Weaver (2007): Disclosure and the Cost of Equity in International Cross-Listing, Review of Quantitative Finance and Accounting, 29 (1): 1–24.
Ecker, Frank, Jennifer Francis, Irene Kim, Per M. Olsson, and Katherine Schipper (2006): A Returns-Based Representation of Earnings Quality, The Accounting Review, 81 (4): 749–780.
Elton, Edwin J., Martin J. Gruber, and Mustafa Gultekin (1981): Expectations and Share Prices, Management Science, 27 (9): 975–987.
Espahbodi, Hassan, Pouran Espahbodi, Zabihollah Rezaee, and Hassan Tehranian (2002): Stock Price Reaction and Value Rele-vance of Recognition versus Disclosure: The Case of Stock-Based Compensation, Journal of Accounting and Economics, 33 (3): 343–373.
Fama, Eugene F. and Kenneth R. French (1996): Multifactor Explanations of Asset Pricing Anomalies, The Journal of Finance, 51 (1): 55–84.
Feltham, Gerald A. and James A. Ohlson (1995): Valuation and Clean Surplus Accounting for Operating and Financial Activities, Contemporary Accounting Research, 11 (2): 689–731.
Francis, Jennifer, Dhananjay Nanda, and Xin Wang (2006): Re-Examining the Effects of Regulation Fair Disclosure Using For-eign Listed Firms to Control for Concurrent Shocks, Journal of Accounting and Economics, 41 (3): 271–292.
Francis, Jennifer, Ryan LaFond, Per M. Olsson, and Katherine Schipper (2004): Costs of Equity and Earnings Attributes, The Accounting Review, 79 (4): 967–1010.
Francis, Jere R., Inder K. Khurana, and Raynolde Pereira (2005): Disclosure Incentives and Effects on Cost of Capital around the World, The Accounting Review, 80 (4): 1125–1162.
Gebhardt, William R., Charles M. C. Lee, and Bhaskaran Swami-nathan (2001): Toward an Implied Cost of Capital, Journal of Accounting Research, 39 (1): 135–176.
Gillette, Ann B., Douglas E. Stevens, Susan G. Watts, and Arling-ton W. Williams (1999): Price and Volume Reactions to Public Information Releases: An Experimental Approach Incorporating Traders' Subjective Beliefs, Contemporary Accounting Research, 16 (3): 437–479.
Glosten, Lawrence R. and Lawrence E. Harris (1988): Estimating the Components of the Bid/Ask Spread, Journal of Financial Economics, 21 (1): 123–142.
Greenstein, Marilyn Magee and Heibatollah Sami (1994): The Impact of the SEC's Segment Disclosure Requirement on Bid-Ask Spreads, The Accounting Review, 69 (1): 179–199.
Grüning, Michael (2011): Artificial Intelligence Measurement of Disclosure (AIMD), European Accounting Review, forthcoming.

BuR - Business Research Official Open Access Journal of VHB Verband der Hochschullehrer für Betriebswirtschaft e.V. ���� � � ���� � � ����� ���� � �8��2
�
Guo, Re-Jin, Baruch Lev and Nan Zhou (2004): Competitive Costs of Disclosure by Biotech IPOs, Journal of Accounting Re-search, 42 (2): 319–355.
Hagerman, Robert L. and Mark E. Zmijewski (1979): Some Eco-nomic Determinants of Accounting Policy Choice, Journal of Accounting and Economics, 1 (2): 141–161.
Harris, Lawrence and Eitan Gurel (1986): Price and Volume Effects Associated with Changes in the S&P 500 List: New Evi-dence for the Existence of Price Pressures, The Journal of Fi-nance, 41 (4): 815–829.
Healy, Paul M., Amy P. Hutton, and Krishna G. Palepu (1999): Stock Performance and Intermediation Changes Surrounding Sustained Increases in Disclosure, Contemporary Accounting Research, 16 (3): 485–520.
Healy, Paul M. and Krishna G. Palepu (2001): Information Asymmetry, Corporate Disclosure, and the Capital Markets: A Review of the Empirical Disclosure Literature, Journal of Ac-counting and Economics, 31 (1–3): 405–440.
Heckman, James J. (1979): Sample Selection Bias as a Specifica-tion Error, Econometrica, 47 (1): 153–161.
Heflin, Frank L. and Kenneth W. Shaw (2000): Blockholder Ownership and Market Liquidity, Journal of Financial and Quantitative Analysis, 35 (4): 621–633.
Heflin, Frank L., Kenneth W. Shaw, and John J. Wild (2005): Disclosure Policy and Market Liquidity: Impact on Depth Quotes and Order Sizes, Contemporary Accounting Research, 22 (4): 829–865.
Hope, Ole-Kristian (2003): Disclosure Practices, Enforcement of Accounting Standards, and Analysts’ Forecast Accuracy: An International Study, Journal of Accounting Research, 41 (2): 235–272.
Hughes, K. E. (2000): The Value Relevance of Nonfinancial Measures of Air Pollution in the Electric Utility Industry, The Accounting Review, 75 (2): 209–228.
Hussainey, Khaled, Thomas Schleicher, and Martin Walker (2003): Undertaking Large-Scale Disclosure Studies when AIMR-FAF Ratings are not Available: The Case of Prices Leading Earn-ings, Accounting and Business Research, 33 (4): 275–294.
Indjejikian, Raffi J. (2007): Discussion of Accounting Informa-tion, Disclosure, and the Cost of Capital, Journal of Accounting Research, 45 (2): 421–426.
Karamanou, Irene and Nikos Vafeas (2005): The Association between Corporate Boards, Audit Committees, and Management Earnings Forecasts: An Empirical Analysis, Journal of Account-ing Research, 43 (3): 453–486.
Karolyi, G. Andrew (1998): Why do Companies List Shares Abroad?: A Survey of the Evidence and Its Managerial Implica-tions, Financial Markets, Institutions & Instruments, 7 (1): 1–60.
Karpoff, Jonathan M. (1986): A Theory of Trading Volume, The Journal of Finance, 41 (5): 1069–1087.
Karpoff, Jonathan M. (1987): The Relation between Price Changes and Trading Volume: A Survey, Journal of Financial and Quanti-tative Analysis, 22 (1): 109–126.
Kerins, Frank, Janet Kiholm Smith, and Richard Smith (2004): Opportunity Cost of Capital for Venture Capital Investors and
Entrepreneurs, Journal of Financial and Quantitative Analysis, 39 (2): 385–405.
Khanna, Tarun, Krishna G. Palepu, and Suraj Srinivasan (2004): Disclosure Practices of Foreign Companies Interacting with U.S. Markets, Journal of Accounting Research, 42 (2): 475–508.
Kim, Oliver and Robert E. Verrecchia (1991): Market Reaction to Anticipated Announcements, Journal of Financial Economics, 30 (2): 273–309.
Kim, Oliver and Robert E. Verrecchia (1994): Market Liquidity and Volume Around Earnings Announcements, Journal of Ac-counting and Economics, 17 (1–2): 41–67.
Klein, Roger W. and Vijay S. Bawa (1976): The Effect of Estima-tion Risk on Optimal Portfolio Choice, Journal of Financial Eco-nomics, 3 (3): 215–231.
Lambert, Richard, Christian Leuz, and Robert E. Verrecchia (2007): Accounting Information, Disclosure, and the Cost of Capital, Journal of Accounting Research, 45 (2): 385–420.
Landsman, Wayne (1986): An Empirical Investigation of Pension Fund Property Rights, The Accounting Review, 61 (4): 662–691.
Lang, Mark H. and Russell J. Lundholm (1993): Cross-sectional Determinants of Analyst Ratings of Corporate Disclosure, Journal of Accounting Research, 31 (2): 246–271.
Lang, Mark H. and Russell J. Lundholm (1996): Corporate Dis-closure Policy and Analyst Behaviour, The Accounting Review, 71 (4): 467–492.
Langberg, Nisan and K. Sivaramakrishnan (2010): Voluntary Disclosures and Analyst Feedback, Journal of Accounting Re-search, 48 (3): 603–646.
Lehmann, Bruce N. and David M. Modest (1988): The Empirical Foundations of the Arbitrage Pricing Theory, Journal of Financial Economics, 21 (2): 213–254.
Leuz, Christian (2003): IAS Versus U.S. GAAP: Information Asymmetry-Based Evidence from Germany's New Market, Jour-nal of Accounting Research, 41 (3): 445–472.
Leuz, Christian and Robert E. Verrecchia (2000): The Economic Consequences of Increased Disclosure, Journal of Accounting Research, 38 (Suppl.): 91–124.
Lev, Baruch (1988): Toward a Theory of Equitable and Efficient Accounting Policy, The Accounting Review, 63 (1): 1–22.
Lev, Baruch and James A. Ohlson (1982): Market-Based Empiri-cal Research in Accounting: A Review, Interpretation, and Exten-sion, Journal of Accounting Research, 20 (Suppl.): 249–322.
Leventis, Stergios and Pauline Weetman (2004): Timeliness of Financial Reporting: Applicability of Disclosure Theories in an Emerging Capital Market, Accounting and Business Research, 34 (1): 43–56.
Linsley, Philip M. and Philip J. Shrives (2006): Risk Reporting: A Study of Risk Disclosures in the Annual Reports of UK Compa-nies, The British Accounting Review, 38 (4): 387–404.
Linsmeier, Thomas J., Daniel B. Thornton, Mohan Venkatacha-lam, and Michael Welker (2002): The Effect of Mandated Market Risk Disclosures on Trading Volume Sensitivity to Interest Rate, Exchange Rate, and Commodity Price Movements, The Account-ing Review, 77 (2): 343–377.

BuR - Business Research Official Open Access Journal of VHB Verband der Hochschullehrer für Betriebswirtschaft e.V. ���� � � ���� � � ����� ���� � �8��2
�
Lintner, John (1965): The Valuation of Risk Assets and the Selec-tion of Risky Investments in Stock Portfolios and Capital Budgets, The Review of Economics and Statistics, 47 (1): 13–37.
Lundholm, Russell J. (1995): A Tutorial in the Ohlson and Fel-tham/Ohlson Models: Answers to Some Frequently Asked Ques-tions, Contemporary Accounting Research, 11 (2): 749–761.
Lundholm, Russell and Linda A. Myers (2002): Bringing the Future Forward: The Effect of Disclosure on the Returns-Earnings Relation, Journal of Accounting Research, 40 (3): 809–839.
Lynch, Anthony W. and Richard R. Mendenhall (1997): New Evidence on Stock Price Effects Associated with Changes in the S&P 500 Index, The Journal of Business, 70 (3): 351–383.
Mangena, Musa and Venancio Tauringana (2007): Disclosure, Corporate Governance and Foreign Share Ownership on the Zimbabwe Stock Exchange, Journal of International Financial Management and Accounting, 18 (2): 53–85.
McGuinness, Paul (1999): Volume Effects in Dual Traded Stocks: Hong Kong and London Evidence, Applied Financial Economics, 9 (6): 615–625.
McNichols, Maureen and Brett Trueman (1994): Public Disclo-sure, Private Information Collection, and Short-Term Trading, Journal of Accounting and Economics, 17 (1–2): 69–94.
Menyah, Kojo and Krishna Paudyal (2000): The Components of Bid-Ask Spreads on the London Stock Exchange, Journal of Banking & Finance, 24 (11): 1767–1785.
Morse, Dale (1981): Price and Trading Volume Reaction Sur-rounding Earnings Announcements: A Closer Examination, Journal of Accounting Research, 19 (2): 374–383.
Mossin, Jan (1966): Equilibrium in a Capital Asset Market, Eco-nometrica, 34 (4): 768–783.
Muntermann, Jan and Andre Guettler (2007): Intraday Stock Price Effects of Ad Hoc Disclosures: The German Case, Journal of International Financial Markets, Institutions and Money, 17 (1): 1–24.
Nikolaev, Valeri and Laurence Van Lent (2005): The Endogeneity Bias in the Relation between Cost-of-Debt Capital and Corporate Disclosure Policy, European Accounting Review, 14 (4): 677–724.
Ohlson, James A. (1995): Earnings, Book Values, and Dividends in Equity Valuation, Contemporary Accounting Research, 11 (2): 661–687.
Patten, Dennis M. (1990): The Market Reaction to Social Respon-sibility Disclosures: The Case of the Sullivan Principles Signings, Accounting, Organizations and Society, 15 (6): 575–587.
Peasnell, K. V. (1982): Some Formal Connections between Eco-nomic Values and Yields and Accounting Numbers, Journal of Business Finance & Accounting, 9 (3): 361–381.
Raman, K. K. and Niranjan Tripathy (1993): The Effect of Sup-plemental Reserve-Based Acounting Data on the Market Micro-structure, Journal of Accounting and Public Policy, 12 (2): 113–133.
Richardson, Alan J. and Michael Welker (2001): Social Disclo-sure, Financial Disclosure and the Cost of Equity Capital, Ac-counting, Organizations and Society, 26 (7–8): 597–616.
Ritter, Jay R. and Ivo Welch (2002): A Review of IPO Activity, Pricing, and Allocations, The Journal of Finance, 57 (4): 1795–1828.
Robinson, Rudy R. and Scott R. Lucas (2007): Seller Disclosure and Buyer Knowledge: How They Affect Market Value, Appraisal Journal, 75 (2): 134–139.
Rock, Kevin (1986): Why New Issues are Underpriced, Journal of Financial Economics, 15 (1–2): 187–212.
Roll, Richard (1988): R², The Journal of Finance, 43 (3): 541–566.
Ryan, Paul (2005): The Market Impact of Directors' Trades: Relationship to Various Measures of a Firm's Information Envi-ronment, The British Accounting Review, 37 (3): 319–337.
Ryan, Paul and Richard J. Taffler (2004): Are Economically Significant Stock Returns and Trading Volumes Driven by Firm-Specific News Releases?, Journal of Business Finance & Account-ing, 31 (1–2): 49–82.
�abac, Florin, Thomas W. Scott, and Heather A. Wier (2005): An Investigation of the Value Relevance of Alternative Foreign Ex-change Disclosures, Contemporary Accounting Research, 22 (4): 1027–1061.
Salton, G., A. Wong, and C. S. Yang (1975): A Vector Space Model for Automatic Indexing, Communications of the ACM, 18 (11): 613–620.
Sengupta, Partha (1998): Corporate Disclosure Quality and the Cost of Debt, The Accounting Review, 73 (4): 459–474.
Shapiro, Alan C. (1978): Financial Structure and Cost of Capital in the Multinational Corporation, Journal of Financial and Quanti-tative Analysis, 13 (2): 211–226.
Sharpe, William F. (1964): Capital Asset Prices: A Theory of Market Equilibrium under Conditions of Risk, The Journal of Finance, 19 (3): 425–442.
Shleifer, Andrei (1986): Do Demand Curves for Stocks Slope Down?, The Journal of Finance, 41 (3): 579–590.
Sivakumar, Kumar and Gregory Waymire (1994): Voluntary Interim Disclosure by Early 20th Century NYSE Industrials, Contemporary Accounting Research, 10 (2): 673–698.
Stoll, Hans R. (1989): Inferring the Components of the Bid-Ask Spread: Theory and Empirical Tests, The Journal of Finance, 44 (1): 115–134.
Stoll, Hans R. (2000): Friction, The Journal of Finance, 55 (4): 1479–1514.
Tkac, Paula A. (1999): A Trading Volume Benchmark: Theory and Evidence, Journal of Financial and Quantitative Analysis, 34 (1): 89–114.
Verrecchia, Robert E. (1982): The Use of Mathematical Models in Financial Accounting, Journal of Accounting Research, 20 (Suppl.): 1–42.
Verrecchia, Robert E. (2001): Essays on Disclosure, Journal of Accounting and Economics, 32 (1–3): 97–180.
Vijh, Anand M. (1994): S&P 500 Trading Strategies and Stock Betas, The Review of Financial Studies, 7 (1): 215–251.

BuR - Business Research Official Open Access Journal of VHB Verband der Hochschullehrer für Betriebswirtschaft e.V. ���� � � ���� � � ����� ���� � �8��2
�
Weber, Bruce W. (2006): Adoption of Electronic Trading at the International Securities Exchange, Decision Support Systems, 41 (4): 728–746.
Weber, Robert Philip (1990): Basic Content Analysis, 2nd ed., Sage: Newbury Park.
Welker, Michael (1995): Disclosure Policy, Information Asymme-try, and Liquidity in Equity Markets, Contemporary Accounting Research, 11 (2): 801–827.
Wu, Chunchi and Wei Zhang (2002): Trade Disclosure, Informa-tion Learning and Securities Market Performance, Review of Quantitative Finance and Accounting, 18 (1): 21–38.
Young, Danqing and David A. Guenther (2003): Financial Report-ing Environments and International Capital Mobility, Journal of Accounting Research, 41 (3): 553–579.
Zechman, Sarah L. (2010): The Relation Between Voluntary Disclosure and Financial Reporting: Evidence from Synthetic Leases, Journal of Accounting Research, 48 (3): 725–765.
Biography
Michael Grüning is Professor of Accounting and Management Control at Frankfurt School of Finance & Management. Previously he was a postdoctoral research fellow at the European University Viadrina Frankfurt (Oder) where he also completed his Habilita-tion. He received his Diploma in Business Administration and doctoral degree from Dresden University of Technology. He was a research fellow at Leipzig Graduate School of Management (HHL) and a visiting professor at the Universidad Católica de Córdoba (Argentina) and the Tecnológico de Monterrey (Mexiko). His main research interests lie in corporate disclosure, corporate communication, performance measurement, and corporate gov-ernance.