Capital Market Days November 12 and 22, 2013 Forward-looking statements The first choice for...
102
Capital Market Days November 12 and 22, 2013 Arne Frank CEO
-
Upload
trinhxuyen -
Category
Documents
-
view
214 -
download
0
Transcript of Capital Market Days November 12 and 22, 2013 Forward-looking statements The first choice for...

Capital Market Days November 12 and 22, 2013
Arne Frank CEO

2
Forward-looking statements
The first choice for value-added vegetable oil solutions
This presentation includes forward-looking statements that are subject to risks and uncertainties, including those pertaining to the anticipated benefits to be realized from the proposals described herein. This presentation contains a number of forward-looking statements including, in particular, statements about future events, future financial performance, plans, strategies, expectations, prospects, competitive environment, regulation and supply and demand. AAK has based these forward-looking statements on its views with respect to future events and financial performance. Actual financial performance of the entities described herein could differ materially from that projected in the forward-looking statements due to the inherent uncertainty of estimates, forecasts and projections, and financial performance may be better or worse than anticipated. Given these uncertainties, readers should not put undue reliance on any forward-looking statements. Forward-looking statements represent estimates and assumptions only as of the date that they were made. The information contained in this presentation is subject to change without notice and AAK does not undertake any duty to update the forward-looking statements, and the estimates and assumptions associated with them, except to the extent required by applicable laws and regulations.

3
Agenda
The first choice for value-added vegetable oil solutions
09.30 – 10.00 AAK Acceleration Arne Frank, CEO
10.00 – 10.15 Financial update Peter Korsholm, CFO
10.15 – 10.40 Infant Nutrition Karel Stoschek, Director Infant Nutrition
10.40 – 11.00 Break
11.00 – 11.15 CSR and palm oil update Anne Mette Olesen, CMO
11.15 – 11.40 Chocolate & Confectionery Fats René Schou, Marketing Director CCF
11.40 – 12.35 AAK’s growth markets Arne Frank, CEO Torben Friis Lange, President Asia Europe Africa Octavio Díaz de León, President AAK N. Latin America Edmond Borit, President AAK South America
12.35 – 13.00 Q&A
13.00 – 14.00 Lunch
AAK participants
Malin Thors Rosenquist Commercial Product Manager Dairy
Arne Frank President and CEO
Peter Korsholm CFO
Torben Friis Lange President Asia Europe Africa
Karel Stoschek Director Infant Nutrition
Octavio Díaz de León President AAK North Latin America
Anne Mette Olesen CMO
René Schou Marketing Director CCF
Lena Ingvarsson Marketing Director Dairy
Fredrik Nilsson Director Group Controlling & IR
Edmond Borit President AAK South America
The first choice for value-added vegetable oil solutions 4

5
Year to date
The first choice for value-added vegetable oil solutions
Volume ´000 MT
Sales
SEK Million
EBIT*
SEK Million
EBIT/kg*
SEK
EPS
SEK
+ 6%
- 4%
+ 7% (org. +2 %)
+ 16%
1,196 (1,117)
815 (711)
12,251 (12,706)
12.39 (10.65)
0.68 (0.64)
+ 15%
* Excl acquistions costs and at fixed FX rates
6
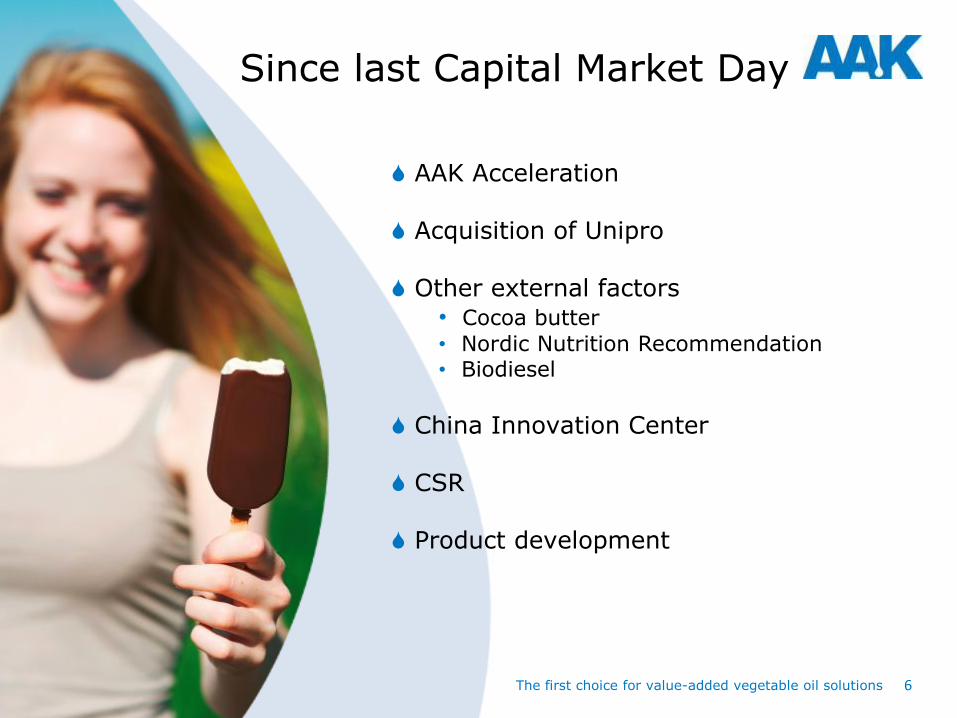
Since last Capital Market Day
The first choice for value-added vegetable oil solutions
AAK Acceleration Acquisition of Unipro Other external factors
• Cocoa butter
• Nordic Nutrition Recommendation • Biodiesel
China Innovation Center CSR Product development

7
AAK Acceleration
The first choice for value-added vegetable oil solutions
Ahead of plan Slightly ahead of plan On plan Behind plan
KPI Q3 13
KPI Q2 13
Bakery
Dairy
CCF
Infant Nutrition
Food Service
Merger & Acquisition N.A N.A
Fast-growing economies
Purchasing
Productivity
Sales
Mobilize ourselves
Internal communication
Growth
Efficiency
People

8
AAK Turkey, Unipro
The first choice for value-added vegetable oil solutions
Strong position and deep customer relationships in the Turkish Bakery market
Revenues of ~ SEK 700 million
The transaction included
• Unipro and 9 other established brands for Bakery and Industrial fats
• Core management and sales organization
• All related know-how
• Transaction closed Sept 1
• Integration is off to a good start

9
AAK Acceleration - Efficiency
The first choice for value-added vegetable oil solutions
Increased productivity since early 2010
• Karlshamn, Sweden, ~60%
• Aarhus, Denmark, ~35%
• Hull, UK, ~30% with shrinking volumes
• Mexico, ~30%
Part of the savings are reinvested in;
• New product development
• Sales force
• Customer innovation resources

10
Cocoa butter
The first choice for value-added vegetable oil solutions
0
1 000
2 000
3 000
4 000
5 000
6 000
7 000
8 000
9 000
10 000
US
D/t
on

11
Nordic Nutrition Recommendation - Focus on lipid quality rather than quantity
The first choice for value-added vegetable oil solutions
Recognise that a fat is not unhealthy
Recommend
• to decrease the intake of saturated fatty acids
• increased intake of polyunsaturated fatty acids
- 5-10%E* PUFA, of which min 1% n-3
• a high intake of monounsaturated fatty acids
• to avoid trans unsaturated fatty acids from any source
*%E: percent of total energy intake

12
Biodiesel
The first choice for value-added vegetable oil solutions
A proposal to limit Europe's use of food-based fuel crops has been stalled by a vote on the European Parliament's environment committee, and may not now be decided before 2015
The draft legislation would have limited to 6% the share of Europe's transport fuel that such crops could make up by 2020

13
China Innovation Center
The first choice for value-added vegetable oil solutions
Leading center for speciality oils and fats for food and nutritional products within the Chinese food industry
Customers offered the possibility to work closely with our Customer Innovation team Focus on Chocolate & Confectionery, Bakery and Dairy solutions Training at the industry reknowned AAK Academies Support execution of AAK Acceleration Located in Shanghai

AAK and palm oil
AAK follows UN Global Compact, and the RSPO standard and/or full traceability
AAK does not source from suppliers involved in deforestation nor destruction of peatland
According to NGO’s the issues about deforestation are concentrated to Indonesia and East Malaysia (Borneo)
For AAK, most palm oil, +90%, is sourced from peninsula Malaysia, Papua New Guinea and Latin America
Less than 10% of AAK´s palm oil is sourced from Indonesia, strong
additional measures are taken to ensure AAK suppliers are not involved in HCV deforestation nor destruction of peatland
Palm 51%
Laurics 14%
Softs 25%
Other 10%
Malaysia, pen 47%
Malaysia, East 0%
Indonesia 7%
LA 37%
PNG 10%
The first choice for value-added vegetable oil solutions 14

15
Product development – FI
The first choice for value-added vegetable oil solutions
Cisao 81-16 – for cake icings • Minimizes post-hardening over time • Smooth texture, good spreadability
Akoblend Flow & Fluid • Liquid butter replacers offering improved
productivity and lower handling and mixing costs
Akomix LS 25 • Developed for ice cream products • Reduce the SAFA with more than 70% • Nominated for FIE award,
Dairy Innovation of the year
Image courtesy of rakratchada torsap at FreeDigitalPhotos.net

16
Product development - CCF
The first choice for value-added vegetable oil solutions
ILLEXAOTM
MT 20
• Improved milk fat tolerance resulting in improved processing
CHOCOFILLTM
NH 110
• For steep melting non-hydrogenated fillings without tempering
• Nominated for Confectionery Innovation of the year at FIE

17
Product development – PC/LFC
The first choice for value-added vegetable oil solutions
Lipex® SheaLight
• New eco designed emollient ester
• Shea emollients known for their skin nourishing, moisturising and anti-inflammatory properties • Very first shea product that maintains the skin nourishing properties of shea, while leaving the skin with a dry and powdery feel
• Lipex® SheaLight hence an ideal emollient for new applications
• Significant interest in the product – sales expected from second half of 2014
18 The first choice for value-added vegetable oil solutions
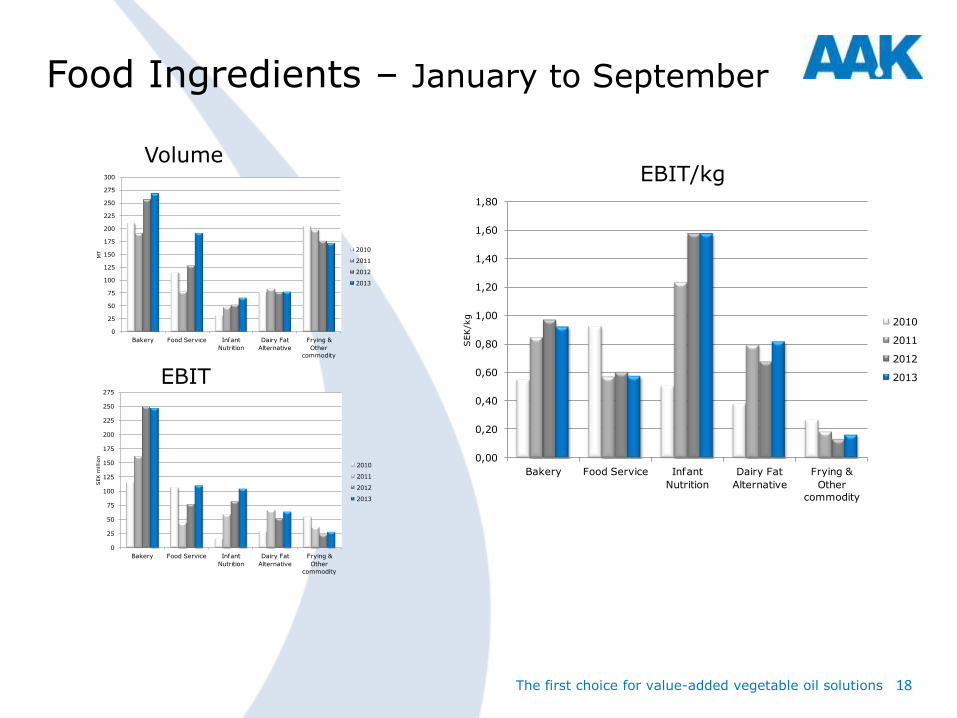
Food Ingredients – January to September
EBIT/kg Volume
EBIT
0
25
50
75
100
125
150
175
200
225
250
275
Bakery Food Service Infant
Nutrition
Dairy Fat
Alternative
Frying &
Other
commodity
SEK
million
2010
2011
2012
2013
0
25
50
75
100
125
150
175
200
225
250
275
300
Bakery Food Service Infant
Nutrition
Dairy Fat
Alternative
Frying &
Other
commodity
MT
2010
2011
2012
2013
0,00
0,20
0,40
0,60
0,80
1,00
1,20
1,40
1,60
1,80
Bakery Food Service Infant
Nutrition
Dairy Fat
Alternative
Frying &
Other
commodity
SEK
/kg
2010
2011
2012
2013

AAK Acceleration - Management growth ambition
Acquisitions
Organic growth
Productivity
Operating profit 2010
800 800
400
400
2010 In appr 5-6 years
*As expressed at the Capital Market Day November 10, 2010 and at fixed exchange rates. 19 The first choice for value-added vegetable oil solutions

2014 – Execution
20 The first choice for value-added vegetable oil solutions
Financial update
Peter Korsholm
CFO
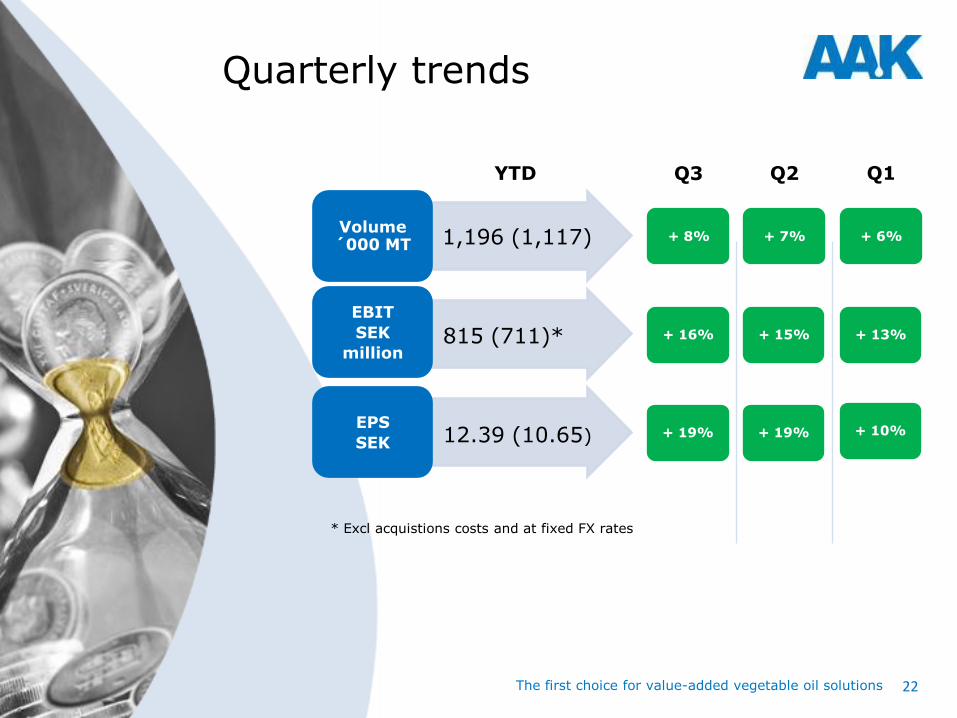
Quarterly trends
Volume ´000 MT
EBIT
SEK
million
EPS
SEK
+ 16%
+ 8%
+ 19%
+ 15%
+ 7%
+ 19%
+ 13%
+ 6%
+ 10%
Q3 Q2 Q1 YTD
1,196 (1,117)
815 (711)*
12.39 (10.65)
* Excl acquistions costs and at fixed FX rates
The first choice for value-added vegetable oil solutions 22

Financial summary
0,00
0,10
0,20
0,30
0,40
0,50
0,60
0,70
0,80
0,00
0,10
0,20
0,30
0,40
0,50
0,60
0,70
0,80
Q3 09
Q4 09
Q1 10
Q2 10
Q3 10
Q4 10
Q1 11
Q2 11
Q3 11
Q4 11
Q1 12
Q2 12
Q3 12
Q4 12
Q1 13
Q2 13
Q3 13
Ro
lling
12 m
onth
s, S
EK
/Kg
Quart
er,
SE
K/K
g
AAK Group - Operating profit per kilo
Quarter Rolling 12 months
0
200
400
600
800
1 000
1 200
1 400
1 600
1 800
0
50
100
150
200
250
300
350
400
450
Q3 09
Q4 09
Q1 10
Q2 10
Q3 10
Q4 10
Q1 11
Q2 11
Q3 11
Q4 11
Q1 12
Q2 12
Q3 12
Q4 12
Q1 13
Q2 13
Q3 13
Ro
lling
12 m
onth
s, '0
00 M
T
Quart
er,
'000 M
T
AAK Group - Volume
Quarter Rolling 12 months
0
200
400
600
800
1 000
1 200
0
50
100
150
200
250
300
350
Q3 09
Q4 09
Q1 10
Q2 10
Q3 10
Q4 10
Q1 11
Q2 11
Q3 11
Q4 11
Q1 12
Q2 12
Q3 12
Q4 12
Q1 13
Q2 13
Q3 13
Quart
er,
SE
K m
illio
n
AAK Group - Operating profit
Quarter Rolling 12 months
The first choice for value-added vegetable oil solutions 23

Food Ingredients
0
100
200
300
400
500
600
700
800
900
0
50
100
150
200
250
Q3 09
Q4 09
Q1 10
Q2 10
Q3 10
Q4 10
Q1 11
Q2 11
Q3 11
Q4 11
Q1 12
Q2 12
Q3 12
Q4 12
Q1 13
Q2 13
Q3 13
Ro
lling
12 m
onth
s, S
EK
millio
n
Quart
er,
SE
K m
illio
n
Food Ingredients - Operating profit
Quarter Rolling 12 months
0,00
0,10
0,20
0,30
0,40
0,50
0,60
0,70
0,80
0,90
1,00
0,00
0,10
0,20
0,30
0,40
0,50
0,60
0,70
0,80
0,90
1,00
Q3 09
Q4 09
Q1 10
Q2 10
Q3 10
Q4 10
Q1 11
Q2 11
Q3 11
Q4 11
Q1 12
Q2 12
Q3 12
Q4 12
Q1 13
Q2 13
Q3 13
Ro
lling
12 m
onth
s, S
EK
/kg
Quart
er,
SE
K/k
g
Food Ingredients - Operating profit per kilo
Quarter Rolling 12 months
Q3
+ 11%
Q3
0%
The first choice for value-added vegetable oil solutions 24

Food Ingredients - organic volume growth
+5%
+ 11%
-3%
+ 8%
-9%
+ 2%
Q3 Q2 Q1
-2%
+ 7%
YTD
+9% +2% -2% + 4%
Speciality & semi-speciality
Commodity
Total
The first choice for value-added vegetable oil solutions 25

Chocolate & Confectionery Fats
0
100
200
300
400
500
600
0
20
40
60
80
100
120
140
160
Q3 09
Q4 09
Q1 10
Q2 10
Q3 10
Q4 10
Q1 11
Q2 11
Q3 11
Q4 11
Q1 12
Q2 12
Q3 12
Q4 12
Q1 13
Q2 13
Q3 13
Ro
lling
12 m
onth
s, S
EK
millio
n
Quart
er,
SE
K m
illio
n
Chocolate & Confectionery Fats - Operating profit
Quarter Rolling 12 months
0,00
0,20
0,40
0,60
0,80
1,00
1,20
1,40
1,60
1,80
2,00
0,00
0,20
0,40
0,60
0,80
1,00
1,20
1,40
1,60
1,80
2,00
Q3 09
Q4 09
Q1 10
Q2 10
Q3 10
Q4 10
Q1 11
Q2 11
Q3 11
Q4 11
Q1 12
Q2 12
Q3 12
Q4 12
Q1 13
Q2 13
Q3 13
Ro
lling
12 m
onth
s, S
EK
/kg
Quart
er,
SE
K/k
g
Chocolate & Confectionery Fats - Operating profit per kilo
Quarter Rolling 12 months
Q3
+ 19%
Q3
+ 19%
The first choice for value-added vegetable oil solutions 26
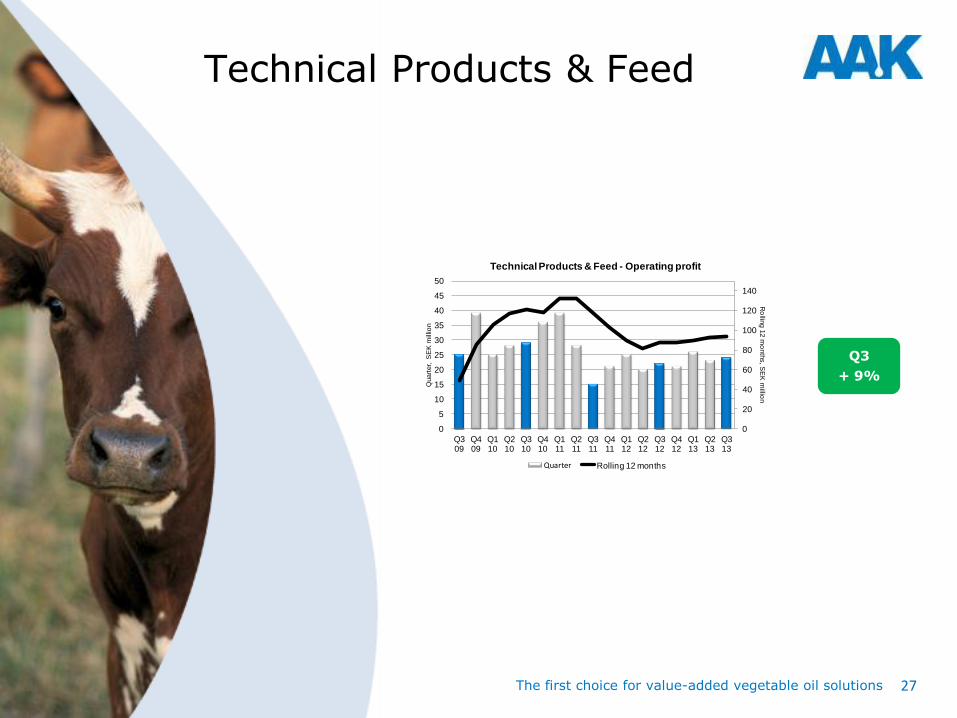
Technical Products & Feed
+9%
0
20
40
60
80
100
120
140
0
5
10
15
20
25
30
35
40
45
50
Q3 09
Q4 09
Q1 10
Q2 10
Q3 10
Q4 10
Q1 11
Q2 11
Q3 11
Q4 11
Q1 12
Q2 12
Q3 12
Q4 12
Q1 13
Q2 13
Q3 13
Ro
lling
12 m
onth
s, S
EK
millio
n
Quart
er,
SE
K m
illio
n
Technical Products & Feed - Operating profit
Quarter Rolling 12 months
Q3
+ 9%
The first choice for value-added vegetable oil solutions 27

Key raw material prices
For information regarding cocoa and cocoa butter please refer to information at www.icco.org.
700
800
900
1 000
1 100
1 200
1 300
1 400
USD
/tonne
Rapeseed oil Palm oil
0
200
400
600
800
1 000
1 200
1 400
1 600
1 800
USD
/tonne
Rapeseed oil Palm oil
10 percent change in all raw material prices will effect working capital by +/-SEK 250 million
Time lag of six to nine months
28

Working capital days Rolling 12 months
0
-3
-3
0
-6
Days reduction since year-end
2012
67 64 61 60 58
-40
-30
-20
-10
0
10
20
30
40
50
60
70
80
90
100
110
-40
-30
-20
-10
0
10
20
30
40
50
60
70
80
90
100
110
Q3 12 Q4 12 Q1 13 Q2 13 Q3 13
Inventory Accounts receivables Accounts payables Others AAK Group
The first choice for value-added vegetable oil solutions 29

Cash flow
SEK million Q3 2013
Q3 2012
YTD 2013
YTD 2012
EBITDA 390 361 1,050 965
Paid interest -27 -31 -80 -89
Paid tax -55 -111 -209 -259
Non-cash items 7 4 -4 6
Change in working capital -12 141 335 476
Cash flow from operating activities incl change in working capital
303 364 1,092 1,099
Cash flow from investments -329 -71 -589 -695
Free cash flow -26 293 503 404
The first choice for value-added vegetable oil solutions 30

8%
10%
12%
14%
16%
18%
Q3
09
Q4
09
Q1
10
Q2
10
Q3
10
Q4
10
Q1
11
Q2
11
Q3
11
Q4
11
Q1
12
Q2
12
Q3
12
Q4
12
Q1
13
Q2
13
Q3
13
Rolling 12 months Quarter
ROCE – 30 September 2013
Sep 2012
Full year 2012
Sep 2013
EBIT R12M 969 1,003* 1,091*
Fixed assets 4,028 4,067 4,285
Working capital 2,901 2,761 2,481
ROCE 14.0 14.7 16.1
* Adjusted for Sandy and acquisition costs
The first choice for value-added vegetable oil solutions 31

0.0
0.5
1.0
1.5
2.0
2.5
3.0
3.5
0
500
1 000
1 500
2 000
2 500
3 000
3 500
4 000
Q3
09
Q4
09
Q1
10
Q2
10
Q3
10
Q4
10
Q1
11
Q2
11
Q3
11
Q4
11
Q1
12
Q2
12
Q3
12
Q4
12
Q1
13
Q2
13
Q3
13
SEK m
illio
n
Net debt and Net debt/EBITDA
Net debt
The first choice for value-added vegetable oil solutions 32

7.0
8.0
9.0
10.0
11.0EUR/SEK
5.0
6.0
7.0
8.0
9.0USD/SEK
Currency Movement EBIT impact Sales impact
USD Weakened Negative Negative
MXN Weakened Negative Negative
GBP Weakened Negative Negative
EUR/DKK Weakened Negative Negative
YTD 2013 Effect
-17 MSEK -262 MSEK
FX exposure
Source oanda.com
The first choice for value-added vegetable oil solutions 33

Value creation priorities
Strengthen growth
• Customer co-development
• Emerging markets
• Selective acquisitions
Continue improving EBIT/Kg
• Speciality and semi-speciality vs. commodity
products
• Efficiency
Capital efficiency
• Working capital management
The first choice for value-added vegetable oil solutions 34
Infant Nutrition
Karel Stoschek
Director Infant Nutrition

2010
Volume growth
• Existing customers
• New customers
• New markets
Higher utilization in dedicated plant
Focus on speciality blends
2013
Operating profit - FI
5%
95%
19%
81%
The first choice for value-added vegetable oil solutions 36

37
Global baby food retail value
The first choice for value-added vegetable oil solutions
Global market
52.1 US$ B.
Dried baby food
4.8 US$ B.
Milk formula
36.1 US$ B.
Prepared baby food
8.6 US$ B.
Other baby food
2.6 US$ B.
Standard formula 35%
Follow-on formula 23%
Toddler formula 35%
Special formula 7%
69%
Key segments for AAK
Source: Euromonitor International, Jul 2013
38
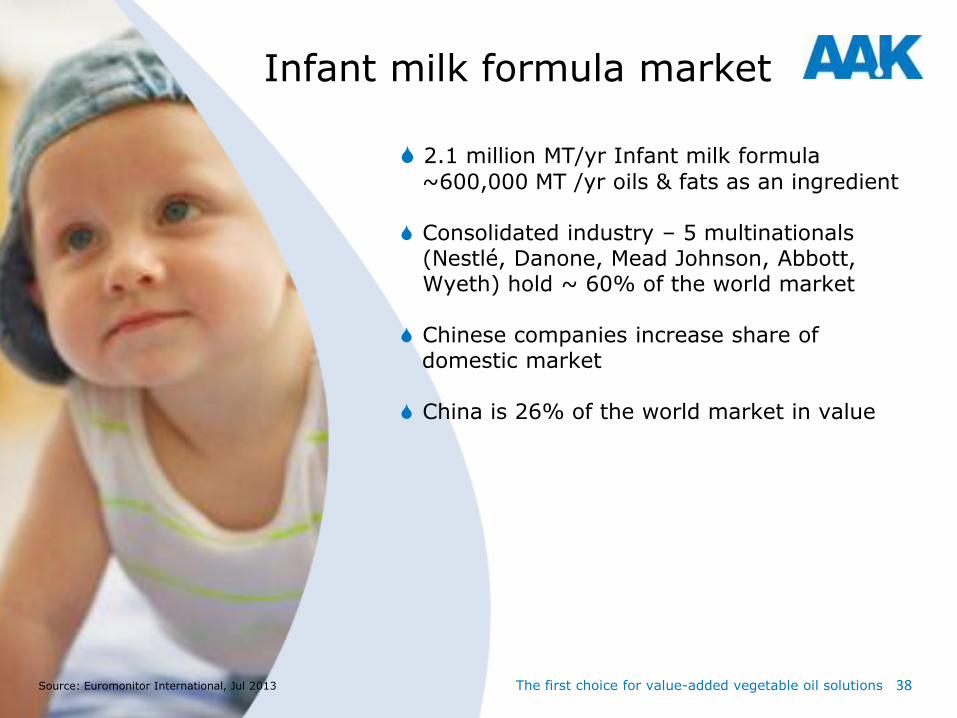
Infant milk formula market
The first choice for value-added vegetable oil solutions
2.1 million MT/yr Infant milk formula
~600,000 MT /yr oils & fats as an ingredient
Consolidated industry – 5 multinationals (Nestlé, Danone, Mead Johnson, Abbott, Wyeth) hold ~ 60% of the world market
Chinese companies increase share of domestic market
China is 26% of the world market in value
Source: Euromonitor International, Jul 2013
39 The first choice for value-added vegetable oil solutions
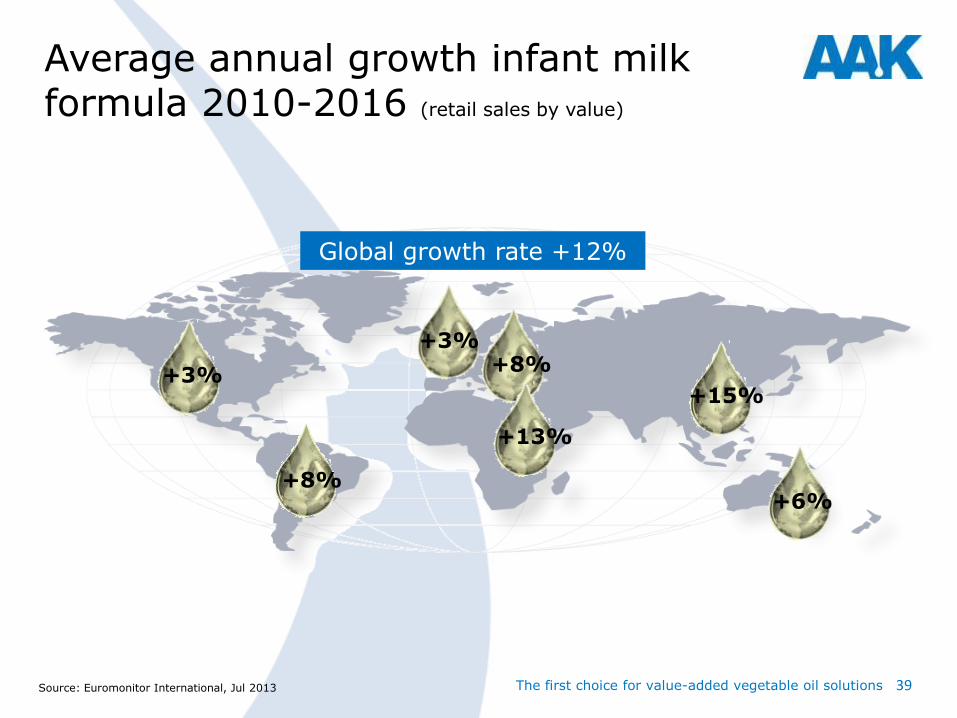
+8%
+3%
+3% +8%
+13%
+15%
+6%
Average annual growth infant milk formula 2010-2016 (retail sales by value)
Global growth rate +12%
Source: Euromonitor International, Jul 2013

40
Infant formula market characteristics
The first choice for value-added vegetable oil solutions
Key revenue drivers
Key pains
Key profit drivers
• Population growth in emerging markets • Urbanisation • Growth in middle class
• Changing regulatory • Share of voice in the global press • Global big brands
• Food safety • Consolidation of market • High demand for premium blends

41
Infant milk formula - the product
The first choice for value-added vegetable oil solutions
Spray dried powder or ”ready to eat” emulsion with milk protein, vegetable
oils and micronutrients (vitamins, minerals, amino acids etc.) Target is to mimic human breast milk as closely as possible Vegetable oils is around 25% by weight and 50% of calories AAK supplies vegetable oils as an ingredient, which gives energy and essential components

42
AAK operates in infant milk formula market with
The first choice for value-added vegetable oil solutions
High quality infant nutrition single oils Akonino ®
• Customized oil blends for infant milk formula producers
• Organic oil blends
Global Production • All AAK factories are audited to produce
high quality infant grade products

43
INFAT® sn2 palmitate
The first choice for value-added vegetable oil solutions
INFAT® is a clinically-proven SN2
palmitate ingredient that mimics the fat structure and properties of human milk fat This unique fat enables easy digestion and optimized uptake of calcium, fat recovery and energy INFAT® is sold and marketed by Advanced Lipids, a joint venture of AAK and Enzymotec

44 The first choice for value-added vegetable oil solutions
AAK gains market share
0%
5%
10%
15%
20%
25%
30%
Market AAK
CAGR (MT) 2010 - 2013
45 The first choice for value-added vegetable oil solutions
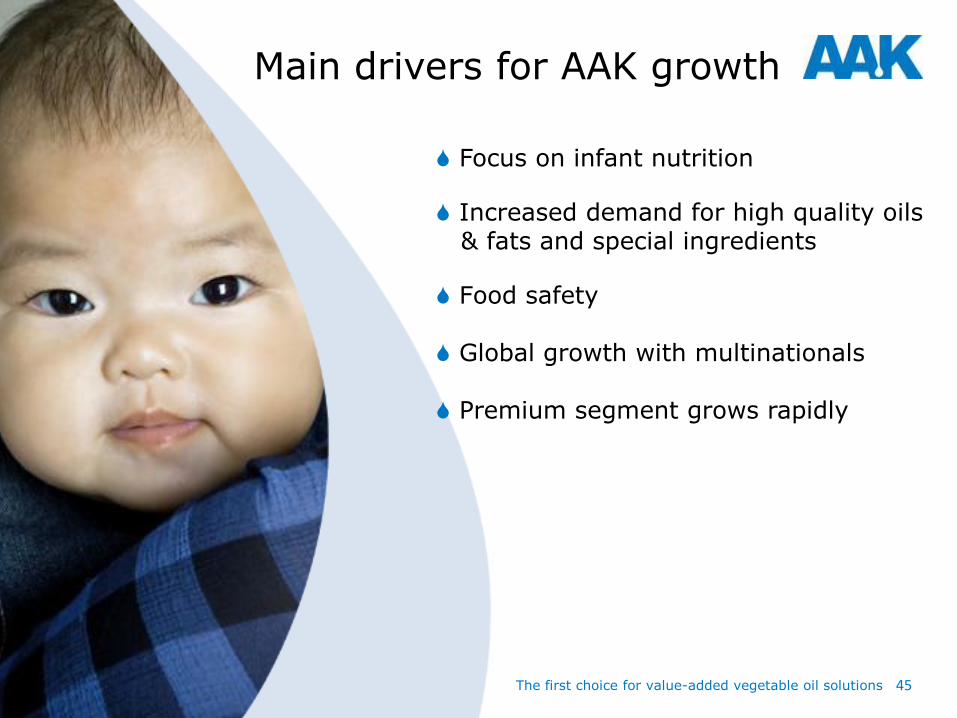
Focus on infant nutrition
Increased demand for high quality oils & fats and special ingredients
Food safety Global growth with multinationals Premium segment grows rapidly
Main drivers for AAK growth

46
AAK is well positioned for further growth
The first choice for value-added vegetable oil solutions
Comprehensive product range A track record to grow globally with major producers Global account management with local presence for key customers Strong focus on food safety and quality Strong position in Europe New supply chain in Asia through our Malaysian customisation plant

CSR and palm oil update
Anne Mette Olesen CMO

Responsible growth at AAK
The first choice for value-added vegetable oil solutions 48
0
10
20
30
40
50
60
Millio
n M
T (
2012)
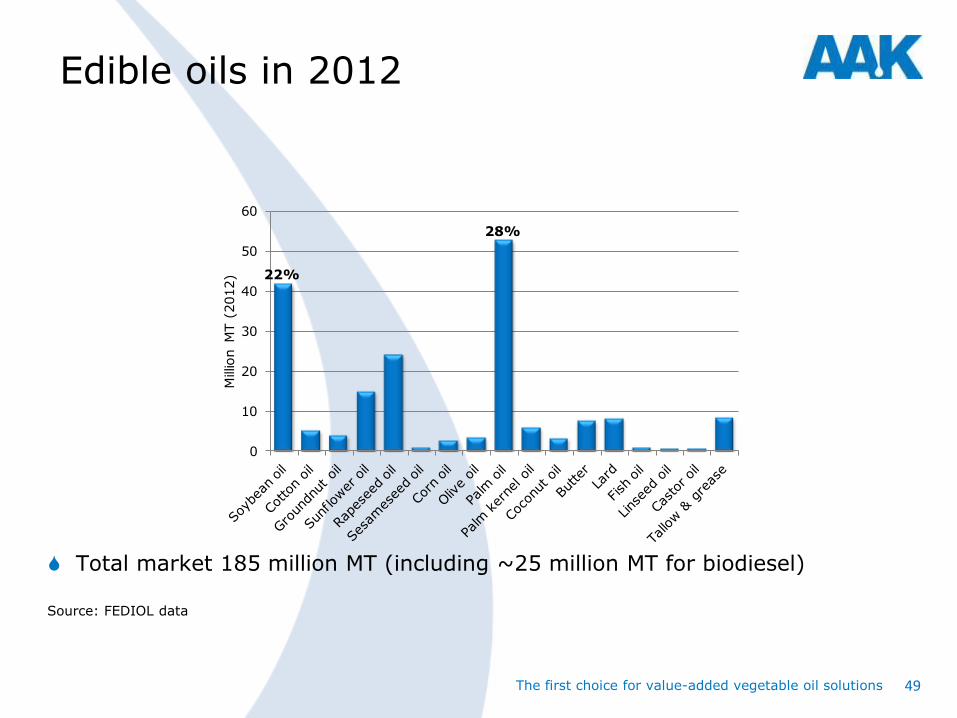
Edible oils in 2012
Total market 185 million MT (including ~25 million MT for biodiesel)
22%
28%
Source: FEDIOL data
The first choice for value-added vegetable oil solutions 49

Palm the most efficient crop
Around 10x the land usage is required to switch from palm to soybeans
Average yield per year (tonnes of oil per hectare)
Soybean:
0.36
Sunflower:
0.42
Rapeseed:
0.59
15mHAPalm oil 3.68
33mHA
25mHA
122mHA
Global land usage
Source: palmoilworld.org
The first choice for value-added vegetable oil solutions 50

Palm oil
A highly versatile vegetable oil
Used in many food and non-food
products
Produced in tropical countries
The world’s top selling vegetable
oil
Rapidly growing in market share
The first choice for value-added vegetable oil solutions 51
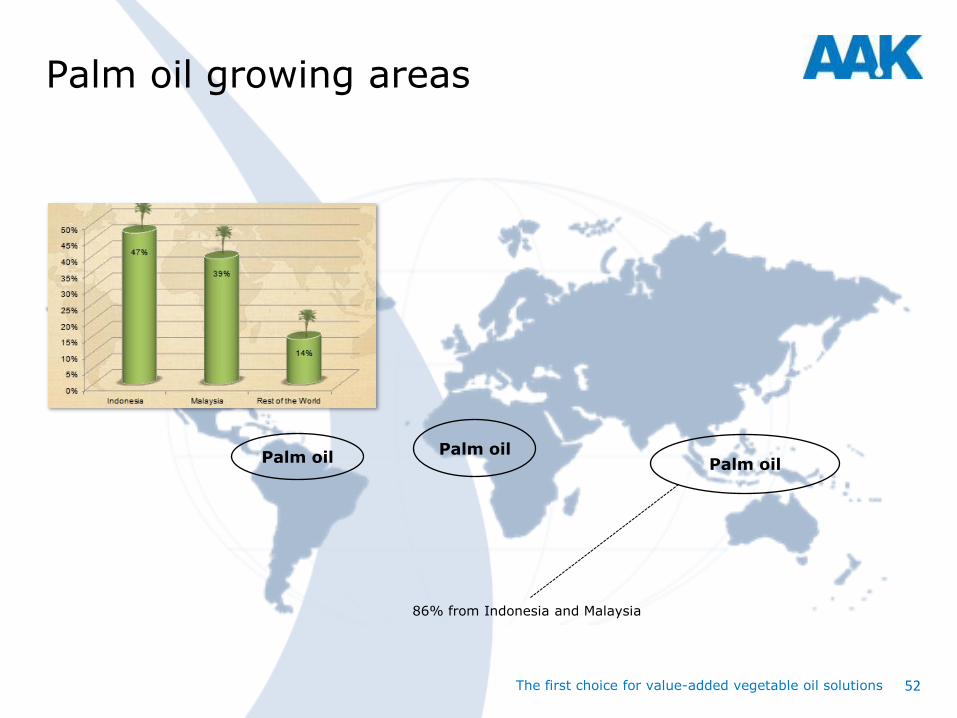
Palm oil growing areas
Palm oil Palm oil Palm oil
86% from Indonesia and Malaysia
The first choice for value-added vegetable oil solutions 52

Palm oil criticism
Pesticide use
Forest and peatland conversion
Biodiversity loss and animal
habitat
Climate change
Land ownership conflicts
Workers’ rights and conditions
Treatment of smallholders
The first choice for value-added vegetable oil solutions 53

Founded in 2004 with seven members
Multi-stakeholder association
Not for profit
Secretariat in Malaysia
AAK a founder member and on the Board
Seven constituencies – growers, traders and processors, consumer goods
manufacturers, retailers, banks, social NGO’s and environmental NGO’s
Consensus based
Roundtable on Sustainable Palm Oil
The first choice for value-added vegetable oil solutions 54

Reflections on RSPO today
Achievements
• Recognized benchmark for
sustainable palm
• More than 1,000 members across all
stakeholders
• Well founded third party certification
process
• 15% of palm production certified
(9 million MT)
• Established supply chain mechanisms
Criticisms
• Moves too slowly due to consensus based
decisions
• Complaint panel ineffective
• Membership is green-washing
• Not strong enough criteria on
deforestation and peatland development
• Moves too quickly for some producers
• Demand is only 50% of supply
An imperfect solution?
55 The first choice for value-added vegetable oil solutions
AAK palm oil policy
Founding member of and engaged in RSPO, and its
Board. Recognizes RSPO certification as the standard for sustainable palm
oil, however not perfect
Focus on one well established and recognized system is important to
progress towards a fully sustainable palm oil supply chain
Palm oil must be produced without HCV deforestation or destruction
of peatland
Need faster progress towards full sustainability in the palm oil supply
chain
The first choice for value-added vegetable oil solutions 56

AAK and palm oil
AAK follows UN Global Compact, and the RSPO standard and/or full traceability
AAK does not source from suppliers involved in deforestation nor destruction of peatland
According to NGO’s the issues about deforestation are concentrated to Indonesia and East Malaysia (Borneo)
For AAK, most palm oil, +90%, is sourced from peninsula Malaysia, Papua New Guinea and Latin America
Less than 10% of AAK´s palm oil is sourced from Indonesia, strong
additional measures are taken to ensure AAK suppliers are not involved in HCV deforestation nor destruction of peatland
Palm 51%
Laurics 14%
Softs 25%
Other 10%
Malaysia, pen 47%
Malaysia, East 0%
Indonesia 7%
LA 37%
PNG 10%
The first choice for value-added vegetable oil solutions 57

Chocolate & Confectionery Fats
René Schou
Marketing Director CCF

Confectionery in scope
• Market size USD Billion 116
• Market size MT Million 8.6 • Market growth 2013-2016 CAGR 2.4%
Chocolate
• Market size USD Billion 107
• Market size MT Million 7.5 • Avg fat content 30% • Growth 2013-16 CAGR 2.4%
Caramel and toffee • Market size USD Billion 9
• Market size MT Million 1.1 • Avg fat content 10% • Growth 2013-16 CAGR 2.5%
The market in scope
Source: Euromonitor The first choice for value-added vegetable oil solutions 59
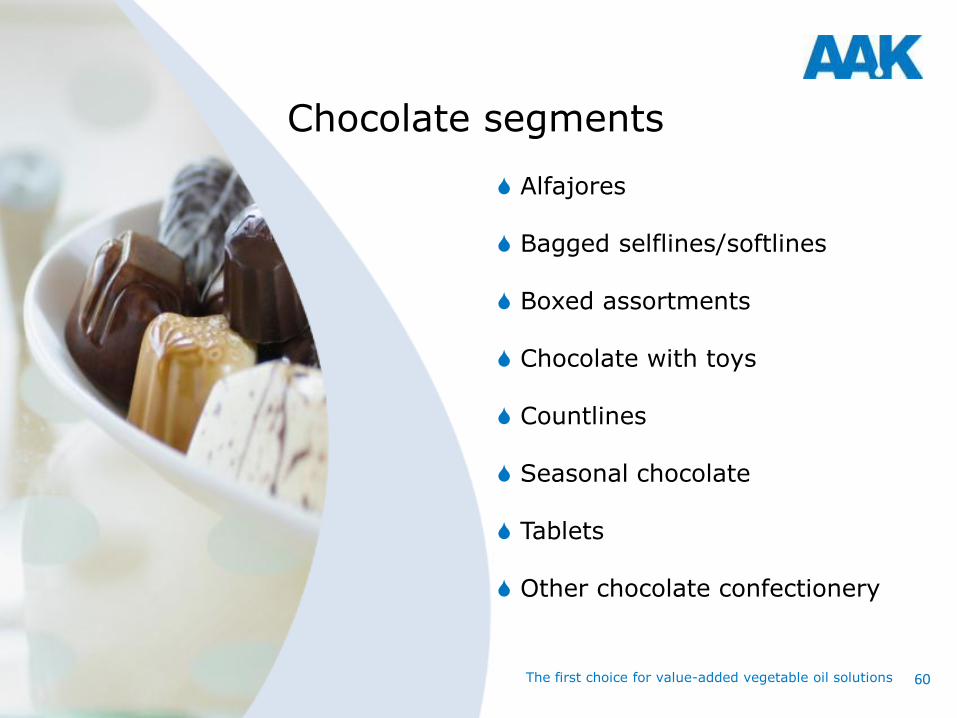
Chocolate segments
Alfajores Bagged selflines/softlines Boxed assortments Chocolate with toys Countlines Seasonal chocolate Tablets Other chocolate confectionery
The first choice for value-added vegetable oil solutions 60
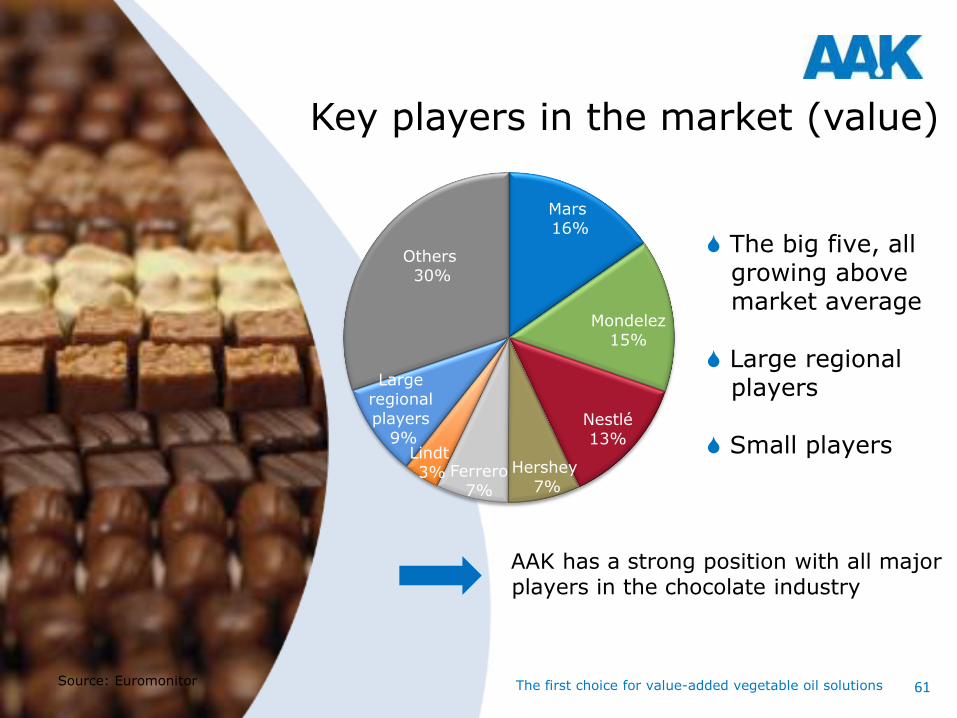
Mars 16%
Mondelez 15%
Nestlé 13%
Hershey 7%
Ferrero 7%
Lindt 3%
Large regional
players 9%
Others 30%
Key players in the market (value)
AAK has a strong position with all major players in the chocolate industry
Source: Euromonitor
The big five, all growing above market average Large regional players Small players
The first choice for value-added vegetable oil solutions 61
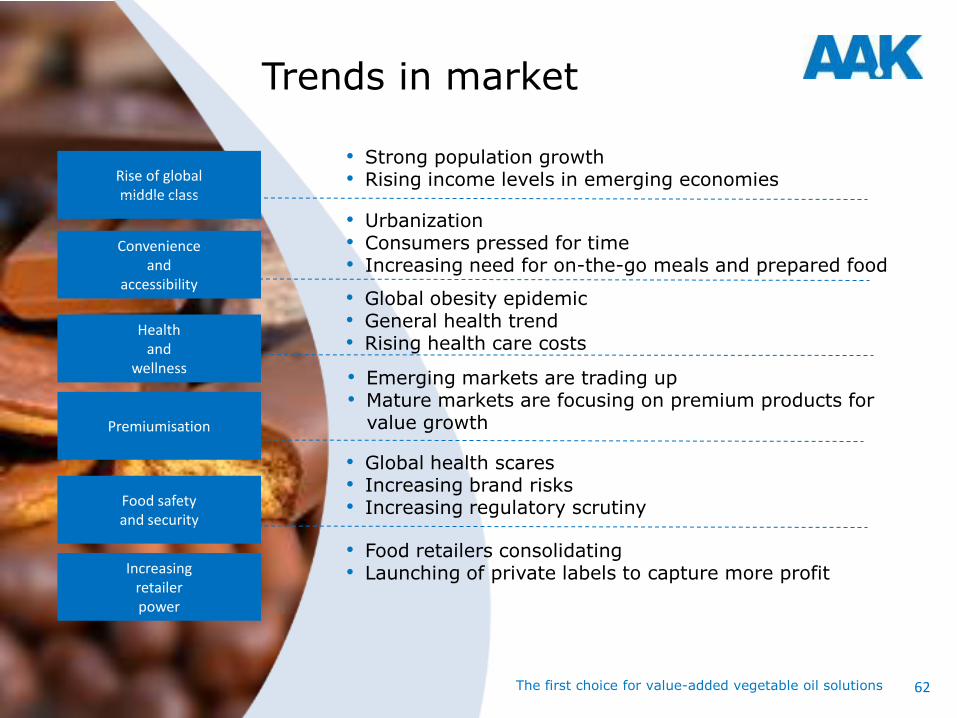
Rise of global middle class
Convenience and
accessibility
Health and
wellness
Increasing retailer power
Food safety and security
• Strong population growth • Rising income levels in emerging economies
• Urbanization • Consumers pressed for time • Increasing need for on-the-go meals and prepared food
• Global obesity epidemic • General health trend • Rising health care costs
• Food retailers consolidating • Launching of private labels to capture more profit
• Global health scares • Increasing brand risks • Increasing regulatory scrutiny
Premiumisation
• Emerging markets are trading up • Mature markets are focusing on premium products for value growth
Trends in market
The first choice for value-added vegetable oil solutions 62

Back to nature
Sustainability • Responsible and sustainable sourcing
Premiumisation
• Light
• Aerated
• Melting behaviour
• Soft fillings
• Creaminess
• Higher cocoa content
Health and
wellness
• Low/non-trans
• Low in saturated fatty acids
• Non-hydrogenated
• Low in fat
• Organic
• Natural
• Clean label
Trends in market – from a fat perspective
The first choice for value-added vegetable oil solutions 63
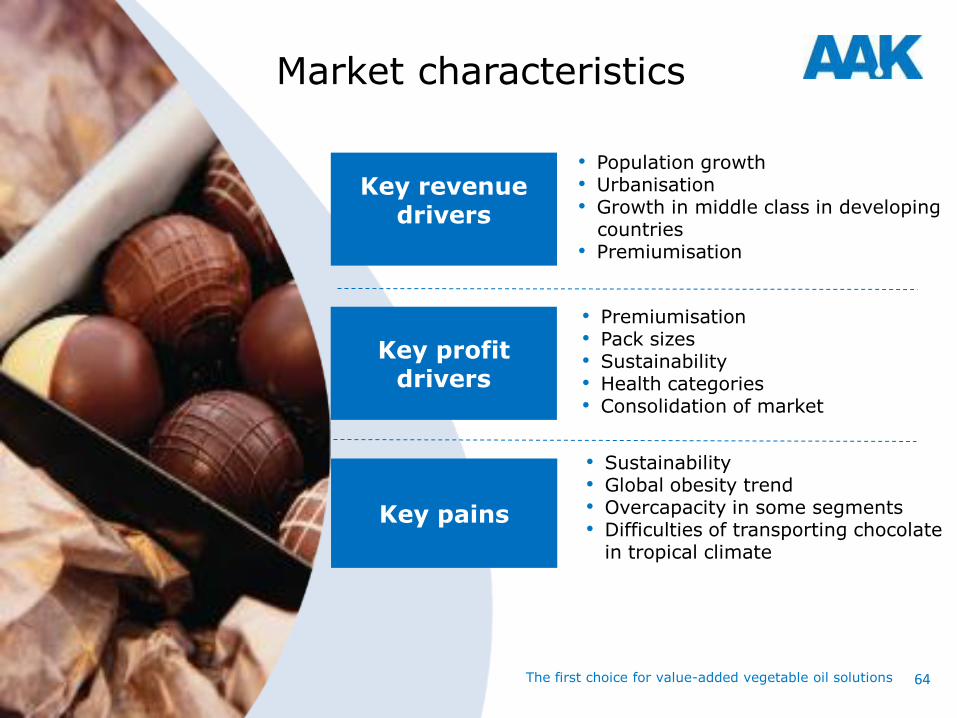
Key pains
Key revenue drivers
Key profit drivers
• Population growth • Urbanisation • Growth in middle class in developing countries • Premiumisation
• Premiumisation • Pack sizes • Sustainability • Health categories • Consolidation of market
• Sustainability • Global obesity trend • Overcapacity in some segments • Difficulties of transporting chocolate
in tropical climate
Market characteristics
The first choice for value-added vegetable oil solutions 64
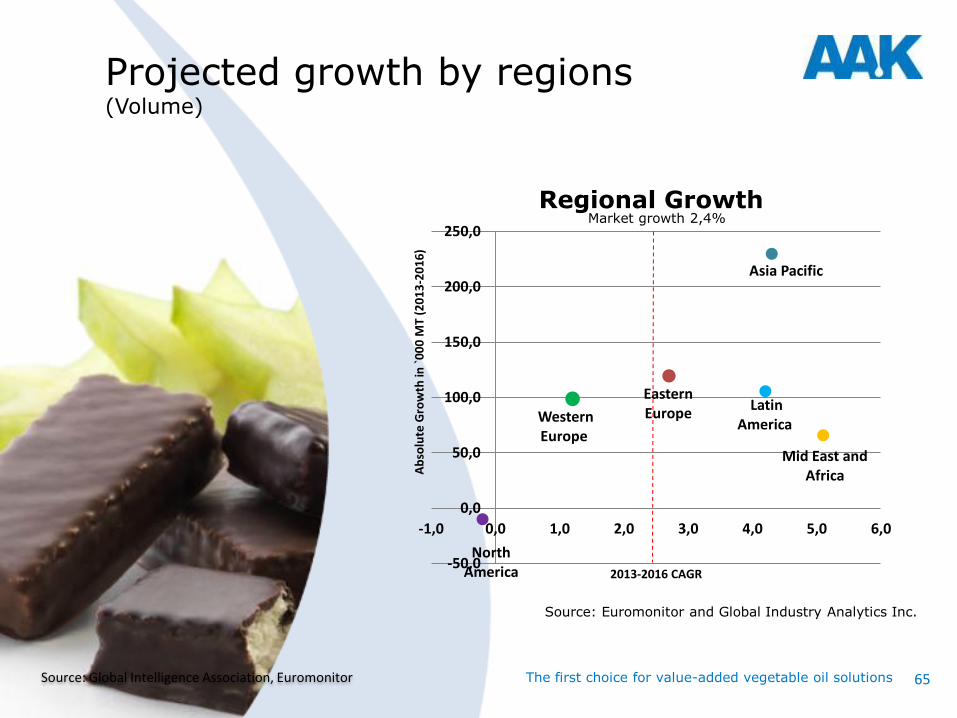
Source: Global Intelligence Association, Euromonitor
Asia Pacific
Eastern Europe
Latin America
Mid East and Africa
North America
Western Europe
-50,0
0,0
50,0
100,0
150,0
200,0
250,0
-1,0 0,0 1,0 2,0 3,0 4,0 5,0 6,0
Ab
solu
te G
row
th in
`0
00
MT
(20
13
-20
16
)
2013-2016 CAGR
Regional Growth Market growth 2,4%
Projected growth by regions (Volume)
Source: Euromonitor and Global Industry Analytics Inc.
The first choice for value-added vegetable oil solutions 65

Cocoa liquor 1.1 Million MT
Cocoa butter 1.0 Million MT
Cocoa powder 0.75 Million MT
Cocoa butter market
0
1 000
2 000
3 000
4 000
5 000
6 000
7 000
8 000
9 000
10 000
US
D/t
on
The first choice for value-added vegetable oil solutions 66

Strong growth potential
Increasing consumption of chocolate • Consumption of chocolate is rising in the
developing regions
Mature markets growing outside chocolate
• Growth to be found through alternative applications like Bakery, Dairy and Ice cream
Cost savings
• Manufacturers are seeking ways to reduce cost
Strong and broad portfolio of solutions • Addressing key needs in the industry • Chocolate improvers • Health and wellness
The first choice for value-added vegetable oil solutions 67

New product development
ILLEXAOTM
MT 20 • Improved milk fat tolerance
resulting in improved processing
CHOCOFILLTM
NH 110 • For steep melting non-
hydrogenated fillings without tempering
• Nominated for Confectionery Innovation of the year at FIE
CEBESTM
EG 80 • Providing extreme gloss to
chocolate
The first choice for value-added vegetable oil solutions 68

AAK is well positioned for future growth
A strong passion for chocolate
Unmatched on customer innovation and
customer co-development
Addresses key needs of the industry with
strong solutions
Far ahead of market on health trends
Second to none in oils & fats knowledge
A ”small” big company
The first choice for value-added vegetable oil solutions 69

AAK’s growth markets

71
AAK in the world
The first choice for value-added vegetable oil solutions

The answer to why is quite given
World population Million
Urbanisation is perhaps the single biggest driver of lifestyle change. By 2020 we expect 55% of the world’s population to live in towns and cities. This creates busier lives, bigger incomes, a growing need for convenience, and also delivers more sophisticated retail infrastructure. All of which underpin demand for processed food and beverages.
Euromonitor 2013
- the Ingredient Curve
16
Mature
Emerging
2020
7,540
1,237
6,303
Emerging
694
Mature 2010
6,830
1,221
5,609
Growth 2010-2020
The first choice for value-added vegetable oil solutions 72

Strengthen our presence in growth markets
Number of targets being assessed Hard to find focused speciality
targets and quality companies
M&A
Brown-field
Green-field
AAK Focus
1
2
3
Difficult to find suitable plants Attractive as an alternative
Longer lead time Possibility to get it right from the start Not necessarily more expensive
The first choice for value-added vegetable oil solutions 73

74
AAK’s focus regions/countries
The first choice for value-added vegetable oil solutions
China Turkey CIS South America Latin America

12.5
China is the growth engine of vegetable oils and fats
PN/LV
+30 %
UK
+35 %
17.8
16
+12.3%
15
15.8
14
14.0
13 12
11.2
Population 1.35 billion
The world’s second largest economy
Urbanisation rate constantly growing
Projected CAGR of key food segments: 7% from 2012 to 2016
Consumption* (MT million)
* Vegetable oils & fats Source: Euromonitor
The first choice for value-added vegetable oil solutions 75

76
Food industry market trends in China
The first choice for value-added vegetable oil solutions
Economic changes to a more sustainable growth model from an export driven
economy to a domestic consumption driven
• Increased individual consumption
Growing middle class with diversified needs
• Oils & fats demand will grow due to urbanisation increase, population growth and disposable income growth
Consumer loyalty to brands will drive growth within speciality oils & fats Significant growth rates in the industries and segments AAK operates within

77
Market potentials in China
The first choice for value-added vegetable oil solutions
Demand for oils & fats is estimated to be 12 million MT in 2013
• Mid and high-end speciality oils demand are estimated to be 1.0 million MT in 2013
• YoY growth estimated to be not less than 6% to +1.3 million MT in 2018
Provides room for AAK to grow core business Infant Nutrition is AAK’s fastest growing segment in China

78
Opportunities in China
The first choice for value-added vegetable oil solutions
Chocolate Infant Nutrition
Ice cream fats
Industrial bakery fats
Whipping
cream
Milk
beverage
Traditional bakery/ bakery chains

79
Market shares in the Chinese speciality and semi-speciality oil market
The first choice for value-added vegetable oil solutions
Competitor A Competitor B Competitor C Competitor D
Competitor E Other AAK
A
B
C
D
E
Other

Extensive exposure and activities in China
Food Ingredients Bakery
AAK Academy Visit by Finance Minister of Denmark
Innovation Prize at Personal Care Ingredients Exhibition
The first choice for value-added vegetable oil solutions 80

AAK China innovation center grand opening October 8, 2013
The first choice for value-added vegetable oil solutions 81

Turkey – our platform in South Eastern Europe and MENA
PN/LV
+30 %
UK
+35 %
1,8
16
+4,0%
15
1,7
14
1,7
13
1,6
12
1,5
76 million inhabitants
16th largest economy
Urbanisation rate constantly growing
Packaged food market valued at US$40 billion with 5.2% expected growth 2013-2017
US$16 billion in food exports
Consumption* (MT million)
* Vegetable oils & fats Source: Euromonitor, Turkish Ministry of Agriculture
The first choice for value-added vegetable oil solutions 82

83
AAK Turkey
The first choice for value-added vegetable oil solutions
The acquisition of Unipro will strengthen
AAK’s presence in the important Turkish market and the surrounding region AAK Turkey is the market leader within traditional bakery Opportunity for growth within the Industrial segment where AAK is strong

84
AAK Turkey opportunities
The first choice for value-added vegetable oil solutions
Retail volume and current value growth are increasing in Turkey, Middle East and Africa The baked goods category benefits from growth in the number of young consumers
as products like buns, doughnuts, croissants and bakhlava are especially popular among the younger population

85
AAK Turkey focus
The first choice for value-added vegetable oil solutions
New functional products for CCF, Bakery and Dairy will be introduced to the market in order to differentiate from competitors in the industrial segment
AAK customer innovation – AAK Academy and customer seminars in Turkey Strong focus on export opportunities in the neighbouring countries where there is a
large growth potential Mostly local competitors

CIS
+1.5%
16
4.2
15
4.2
14
4.1
13
4.0
12
4.0
+275 million inhabitants
GDP growth forecasted at 4-5% per year
Dominated by Russia, which is the 11th largest economy
Historically high growth in packaged food segment driven by demand in large cities
Consolidation among retailers
Consumption* (MT million)
* Vegetable oils & fats in Belarus, Russia and Ukraine Source: UN, Deutsche Bank, Euromonitor
The first choice for value-added vegetable oil solutions 86

87
AAK in CIS
The first choice for value-added vegetable oil solutions
Established sales in Russia and Ukraine with increased and more aggressive direct sales activities Customisation plant in Russia Speciality confectionery fats a focus area, but also emerging trends within Bakery and Dairy Proven customer innovation with focus on functionalities applying speciality and semi-speciality oils & fats

88 The first choice for value-added vegetable oil solutions
Very fast innovation cycles in the market A region with significant risk management applied Opportunities within Food Ingredients area with a strong supply chain
AAK in CIS focus

South America – Brazil a natural next step
PN/LV
+30 %
UK
+35 % +2.1%
16
7.5
15
7.3
14
7.2
13
7.0
12
6.9
Consumption* (MT million)
* Vegetable oils & fats in Argentina, Bolivia, Brazil, Chile, Colombia, Ecuador, Peru, Uruguay & Venezuela Source: Euromonitor; IMF; UN
Population 400 million
GDP growth 3.1% 2012-2016
High level of urbanisation – 325 million 2010 and growing to 385 million 2020
The packaged food market in Brazil was valued at $105 billion in 2010, having grown by 44% since 2005
The first choice for value-added vegetable oil solutions 89

90
South America - industry
The first choice for value-added vegetable oil solutions
A world leading industrial country;
• Chocolate; world’s 4th largest manufacturer
• Biscuits; world’s 3rd largest manufacturer
• Cosmetics; world’s 3rd largest market
Nestlé runs 31 factories in Brazil
Mondeléz (Kraft) has its world’s largest chocolate factory in Brazil
High protection to local industry

91
AAK South America
The first choice for value-added vegetable oil solutions
Unique platform for a CCF business
• Production in Montevideo, Uruguay, since 2006
• Multi-oil processing set-up
Only local supplier of CBE in South America
• Duty free in Mercosur
• Deliveries in bulk
Local commercial and customer innovation teams in Brazil

92
AAK South America
The first choice for value-added vegetable oil solutions
Customer innovation focus
• Sole oils & fats custom innovation partner of the main regional confectionery company
• 93% of the total products are low trans products
• Winner of “Customer A – a fortune 500 company” Supplier Challenge Biscuit in 2012
Source: IBRC – Insituto Brasileiro de Pesquisa e Relacionamento con Clientes

93
A truly fast-growing economy
The first choice for value-added vegetable oil solutions
Artisan bakeries grew 11.5% CAGR in the last 5 years
• 63,000 small bakeries
• 44 million customers/year
Dairy segment grew 3% CAGR in the last decade
Food Service segment grew 14% CAGR in the last 10 years
Chocolate segment’s growth has been ~ 5% in the past 5 years

Latin America (Mexico, Central America and Caribbean)
PN/LV
+30 %
UK
+35 %
+2.3%
16
3.0
15
2.9
14
2.8
13
2.8
12
2.7
Consumption* (MT million)
* Vegetable oils & fats (including hydrogenated) in Costa Rica, Dominican Republic, Guatemala and Mexico Source: Euromonitor; IMF; UN
Population 188 million
GDP growth 6.8% 2012-2016
High level of urbanisation – 122 million 2010 and growing to 130 million 2020
The packaged food market was valued at $55 billion in Mexico in 2011
The first choice for value-added vegetable oil solutions 94
95
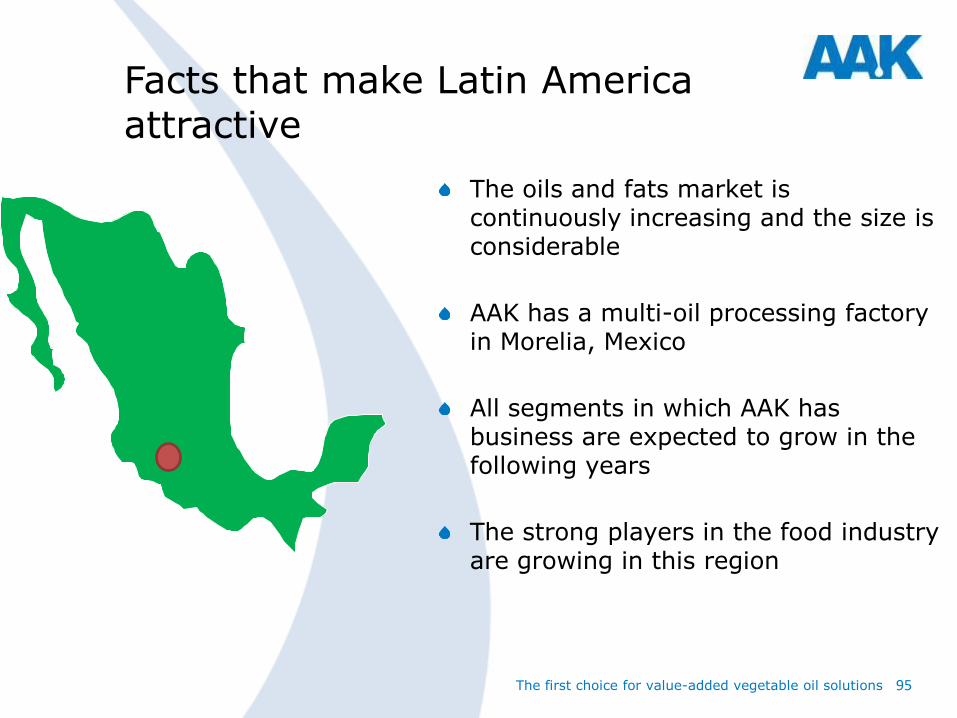
Facts that make Latin America attractive
The first choice for value-added vegetable oil solutions
The oils and fats market is continuously increasing and the size is considerable
AAK has a multi-oil processing factory in Morelia, Mexico
All segments in which AAK has business are expected to grow in the following years
The strong players in the food industry are growing in this region
96
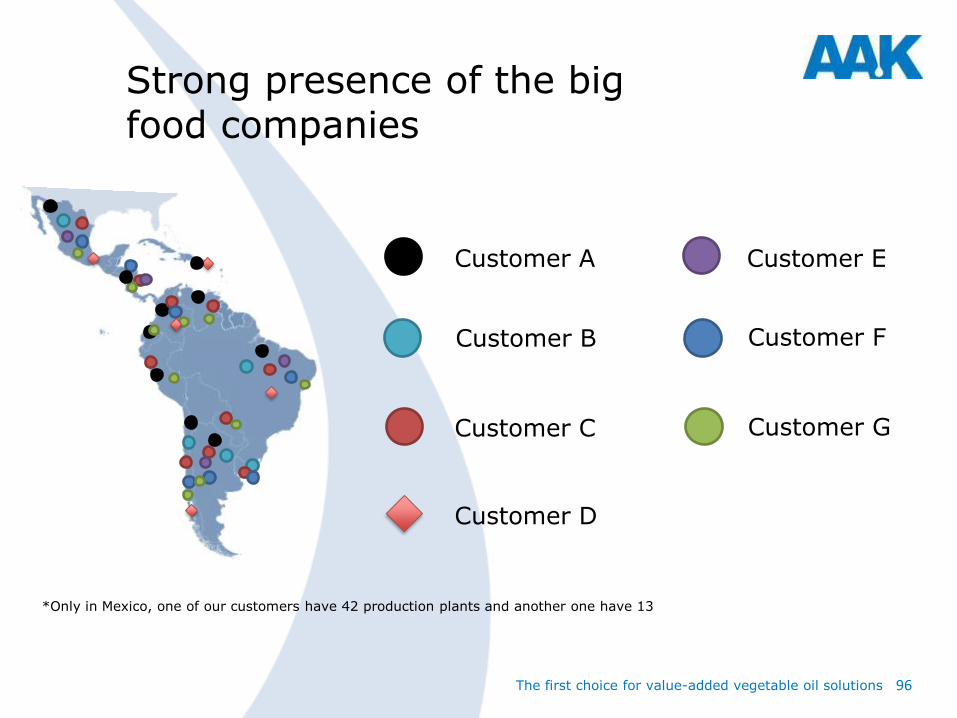
Strong presence of the big food companies
The first choice for value-added vegetable oil solutions
*Only in Mexico, one of our customers have 42 production plants and another one have 13
Customer A
Customer B
Customer C
Customer D
Customer E
Customer F
Customer G

97
Latin Amercia – Market
The first choice for value-added vegetable oil solutions
Bakery Dairy CCF Food
service Infant
Nutrition Mexico x x x x x Guatemala x x Belize x Colombia x x Costa Rica x El Salvador x Haití x Honduras x Dominican Republica x Nicaragua x Venezuela x x

98
Global food trends - new opportunities for Latin America
The first choice for value-added vegetable oil solutions
Consumers are more knowledgeable than ever about their food products
There is a challenge to innovate in functional foods
Healthy aging provides a rapidly growing platform for food producers to position new products
Consumers are well aware of the risks of a high intake of sugar in their diets
Brands are repositioning with more flavour and marketing goes towards niches
Source: Innova Market Insights – Data base

99
Innovation in AAK Mexico
The first choice for value-added vegetable oil solutions
Our focus on innovation has given us an important position in a high competitive environment
• We offer solutions rather than products
• Continuous customer training
• Strong product development
• Customer innovation

100
New special tax on packed food and soft drinks in Mexico
The first choice for value-added vegetable oil solutions
Special tax of 8% on production and services (IEPS) has been introduced in Mexico for the non-staple foods with a caloric density of 275 kcal or more per 100 grams
Soft drinks and sugar added beverages will be taxed $1 MXN per litre; approximately a 10% tax
Source: Ley del Impuesto Especial sobre Productos y Servicios (IEPS) - 20131031

101
Growth is focus in Latin America
The first choice for value-added vegetable oil solutions
Focus
Innovation Health trends M&A 1 2 3
Niches for more specialized solutions
New markets
Low saturated fats
Trans free oils
New segments (e.g. Infant Nutrition)
Labelling
Accelerated growth

102
Medium and fast growing markets – New management ambition
The first choice for value-added vegetable oil solutions
Nordics West Europe
USA CEE CIS
Asia Latin America
* Management ambition
* Management ambition – edible oil volume
69%62%
47%40%
30%
18%18%
31%35%
13%20% 22% 25%
70%
0%
10%
20%
30%
40%
50%
60%
70%
80%
90%
100%
2006 2009 2012 2013 2015-2016*
Slow growing markets Medium growing markets Fast growing markets