Capital Flows to Emerging Markets MAY 28, 2015
38
iif.com © Copyright 2015. The Institute of International Finance, Inc. All rights reserved. Capital Flows to Emerging Markets MAY 28, 2015 MAY 28, 2015 MAY 28, 2015 MAY 28, 2015 After a slow start to the year, private capital inflows to EMs are projected to cool to $981 billion in 2015, their lowest level since 2009. For 2016, we project a pickup to $1,158 billion. The projected drop in inflows in 2015 reflects disappointing EM growth, a challenging global interest rate outlook, and country-specific factors such as the Russia-Ukraine conflict. The acceleration in inflows in 2016 assumes a gradual Fed exit, a pickup in EM growth, and reduced political uncertainties. Resident capital outflows are projected to stabilize in 2015—with a continued shift towards private sources and away from official reserve accumulation. We stress downside risks to our capital flows outlook related to (1) continued stagnation in global growth and (2) more aggressive Fed rate increases that could be prompted by further U.S. labor market tightening. In these scenarios, capital flows to EMs would be even weaker in 2015 and would not experience the marked rebound in 2016 that we project in our baseline case. Fallout from a potential EM stress event would be exacerbated by a lack of secondary market liquidity and increased corporate indebtedness across EMs. The outlook for 2015 EM capital inflows has deteriorated since our January report. We now forecast private non-resident inflows to decline from $1,048 billion in 2014 to $981 billion this year, which would be the weakest outcome since the global financial crisis. Moreover, inflows are projected to slide to 3.5% of EM GDP, the lowest level since 2002. In part, the weakness in flows projected for 2015 reflects developments that have already occurred as we estimate that capital inflows reached a six-year low in 2015Q1 in the context of weak EM GDP growth (Chart 1). Table of Contents Overview 1 Growth Acceleration Delayed 5 Alternative Scenarios 8 Spike in Global Risk Aversion 10 EM Reserve Slowdown 13 EM Corporate Debt Risks 15 EM Liquidity—How Bad? 20 Emerging Asia 25 Emerging Europe 27 Latin America 29 Middle East 31 Sub-Saharan Africa 33 Tables and Annex 34 Chart 1 Chart 1 Chart 1 Chart 1 GLOBAL MACROECONOMIC ANALYSIS Felix Huefner CHIEF ECONOMIST [email protected] Robin Koepke ECONOMIST [email protected] Arpitha Bykere ASSOCIATE ECONOMIST [email protected] Scott Farnham RESEARCH ANALYST [email protected] Litia Shaw SENIOR PROGRAM ASSISTANT [email protected] CAPITAL MARKETS & EMERGING MARKETS POLICY Sonja Gibbs DIRECTOR [email protected] Emre Tiftik FINANCIAL ECONOMIST [email protected] Fiona Nguyen SENIOR RESEARCH ANALYST [email protected] Khadija Mahmood RESEARCH ANALYST [email protected] Charles Collyns CHIEF ECONOMIST [email protected] Hung Tran EXECUTIVE MANAGING DIRECTOR [email protected] 150 175 200 225 250 275 300 3.0 3.5 4.0 4.5 5.0 12Q4 13Q2 13Q4 14Q2 14Q4e 15Q2f 15Q4f 16Q2f 16Q4f EM GDP Growth 4-Quarter MA Total Capital Inflows 4-Quarter MA IIF Forecast Source: IMF, National Sources, IIF. $ billion EM EM EM EM GDP Growth and Total EM Capital Inflows GDP Growth and Total EM Capital Inflows GDP Growth and Total EM Capital Inflows GDP Growth and Total EM Capital Inflows percent, q/q, saar
Transcript of Capital Flows to Emerging Markets MAY 28, 2015

iif.com © Copyright 2015. The Institute of International Finance, Inc. All rights reserved.
Capital Flows to Emerging Markets MAY 28, 2015MAY 28, 2015MAY 28, 2015MAY 28, 2015
� After a slow start to the year, private capital inflows to EMs are projected to cool to
$981 billion in 2015, their lowest level since 2009. For 2016, we project a pickup to
$1,158 billion.
� The projected drop in inflows in 2015 reflects disappointing EM growth, a challenging
global interest rate outlook, and country-specific factors such as the Russia-Ukraine
conflict.
� The acceleration in inflows in 2016 assumes a gradual Fed exit, a pickup in EM growth,
and reduced political uncertainties.
� Resident capital outflows are projected to stabilize in 2015—with a continued shift
towards private sources and away from official reserve accumulation.
� We stress downside risks to our capital flows outlook related to (1) continued
stagnation in global growth and (2) more aggressive Fed rate increases that could be
prompted by further U.S. labor market tightening.
� In these scenarios, capital flows to EMs would be even weaker in 2015 and would not
experience the marked rebound in 2016 that we project in our baseline case.
� Fallout from a potential EM stress event would be exacerbated by a lack of secondary
market liquidity and increased corporate indebtedness across EMs.
The outlook for 2015 EM capital inflows has deteriorated since our January report. We
now forecast private non-resident inflows to decline from $1,048 billion in 2014 to $981
billion this year, which would be the weakest outcome since the global financial crisis.
Moreover, inflows are projected to slide to 3.5% of EM GDP, the lowest level since 2002.
In part, the weakness in flows projected for 2015 reflects developments that have already
occurred as we estimate that capital inflows reached a six-year low in 2015Q1 in the
context of weak EM GDP growth (Chart 1).
Table of Contents Overview 1 Growth Acceleration Delayed 5 Alternative Scenarios 8 Spike in Global Risk Aversion 10 EM Reserve Slowdown 13 EM Corporate Debt Risks 15 EM Liquidity—How Bad? 20 Emerging Asia 25 Emerging Europe 27 Latin America 29 Middle East 31 Sub-Saharan Africa 33 Tables and Annex 34
Chart 1Chart 1Chart 1Chart 1
GLOBAL MACROECONOMIC ANALYSIS
Felix Huefner CHIEF ECONOMIST [email protected]
Robin Koepke ECONOMIST [email protected]
Arpitha Bykere ASSOCIATE ECONOMIST [email protected]
Scott Farnham RESEARCH ANALYST [email protected]
Litia Shaw SENIOR PROGRAM ASSISTANT [email protected]
CAPITAL MARKETS & EMERGING MARKETS POLICY
Sonja Gibbs DIRECTOR [email protected]
Emre Tiftik FINANCIAL ECONOMIST [email protected]
Fiona Nguyen SENIOR RESEARCH ANALYST [email protected] Khadija Mahmood RESEARCH ANALYST [email protected]
Charles Collyns CHIEF ECONOMIST [email protected]
Hung Tran EXECUTIVE MANAGING DIRECTOR [email protected]
150
175
200
225
250
275
300
3.0
3.5
4.0
4.5
5.0
12Q4 13Q2 13Q4 14Q2 14Q4e 15Q2f 15Q4f 16Q2f 16Q4f
EM GDP Growth 4-Quarter MA
Total Capital Inflows 4-Quarter MA
IIF Forecast
Source: IMF, National Sources, IIF.
$ billionEMEMEMEM GDP Growth and Total EM Capital InflowsGDP Growth and Total EM Capital InflowsGDP Growth and Total EM Capital InflowsGDP Growth and Total EM Capital Inflowspercent, q/q, saar

iif.com © Copyright 2015. The Institute of International Finance, Inc. All rights reserved.
page 2 CAPITAL FLOWS TO EMERGING MARKETS | MAY 28, 2015
Chart 4Chart 4Chart 4Chart 4
Looking ahead, a key assumption is that the Fed tightening trajectory is broadly in line
with current economist consensus expectations—i.e. liftoff later this year and 4 hikes of
25 basis points each over the course of 2016. In this case any fallout should be limited
and concentrated on the more vulnerable EMs. However, it is important to highlight the
high degree of uncertainty surrounding market reactions to actual Fed hiking of policy
rates. Even if the Fed's schedule and trajectory of rate hikes are consistent with current
expectations, markets can become jittery on the occasion of actual rate hikes to the
detriment of EMs. Moreover, the two main risk scenarios to our baseline point to further
weakness in capital flows to EMs, rather than the revival we project for 2016 in our
baseline (pages 8-9). First, there could be a protracted slowdown in both emerging and
mature economy growth that would reduce incentives for cross-border investment, even
with lower interest rates. Second, the Fed may raise policy rates by more than expected,
perhaps in response to tightening conditions in labor markets even in the face of
moderate growth due to a weakening on the supply side of the U.S. economy.
Portfolio flows have continued to be volatile over the past few months. Introduction of
QE by the ECB and a shift in market expectations towards a slower Fed exit supported
portfolio flows in the first few months of 2015 (Chart 2). Subsequently, portfolio flows
suffered a retrenchment in May in the context of a sharp increase in mature economy
bond yields, led by a jump in bund yields that seems to have been related to a
stabilization in global oil prices and some alleviation of disinflation concerns. According
to our new Flows Alert, which aims to identify episodes of flow surges and reversals on a
real-time basis, the reversal episode lasted 18 days and was widespread across countries.
We estimate that total EM portfolio outflows in this episode may have amounted to
around $10-15 billion, compared to $35-50 billion during the taper tantrum of 2013
(Chart 3).
For 2015 as a whole, we project portfolio equity flows to climb to around $130 billion, a
30% increase from 2014 (Table 1), helped by improving EM economic prospects as the
year progresses and relatively attractive valuations (Chart 4). Portfolio debt flows will
Chart 2Chart 2Chart 2Chart 2
-30
-20
-10
0
10
20
30
40
50
Jan 14 May 14 Sep 14 Jan 15 May 15
Debt
Equity
Total
TotalTotalTotalTotal NonNonNonNon----Resident Portfolio Flows to Emerging MarketsResident Portfolio Flows to Emerging MarketsResident Portfolio Flows to Emerging MarketsResident Portfolio Flows to Emerging Markets$ billion
Source: IIF.
2010-14 Average: $22 bn
Chart 3Chart 3Chart 3Chart 3
6
8
10
12
14
16
18
2005 2008 2011 2014
Forward P/E RatiosForward P/E RatiosForward P/E RatiosForward P/E RatiosMSCI indices, price-to-12Mforward earnings estimates, dotted line=period average
Developed Markets
Emerging Markets
Source: MSCI, Datastream, IIF.
-1.6
-1.2
-0.8
-0.4
0.0
0.4
0.8
1.2
1.6
Apr 13 Oct 13 Apr 14 Oct 14 Apr 15
Confidence Band7-Day MA28-Day MA
Daily EM Equity and Bond FlowsDaily EM Equity and Bond FlowsDaily EM Equity and Bond FlowsDaily EM Equity and Bond Flows$ billion, all available countries (7)
Taper Tantrum
Oil Price and Ruble Collapse
Spring 2014 Surge
January 2014 Correction
Taper DelayRally
Flows Alerts (Selection)
Bund Bund Bund Bund TantrumTantrumTantrumTantrum
Source: IIF.
AAAA key assumption key assumption key assumption key assumption is that the Fed is that the Fed is that the Fed is that the Fed tightening tightening tightening tightening trajectory is trajectory is trajectory is trajectory is broadly in line broadly in line broadly in line broadly in line with current with current with current with current economist economist economist economist consensus consensus consensus consensus expectationsexpectationsexpectationsexpectations

iif.com © Copyright 2015. The Institute of International Finance, Inc. All rights reserved.
page 3 CAPITAL FLOWS TO EMERGING MARKETS | MAY 28, 2015
continue to be dampened by nervousness about rates in advance of Fed exit and less
favorable valuations compared to asset classes like U.S. high yield bonds (Chart 5).
Overall, we forecast these flows to be flat at around $170 billion.
Foreign direct investment (FDI) accounts for a large portion of the decline in capital flows
projected for 2015 (Table 1). We project FDI inflows to fall to $530 billion this year from
$580 billion in 2014, led by reduced inflows to China and Russia. Nonetheless, FDI
remains by far the largest (and most stable) source of external financing, and is likely to
account for around half of total non-resident inflows this year.
On a regional basis, a major factor behind the marked decline in total capital inflows in
2014/15 is the conflict between Russia and Ukraine (Chart 6). The slump particularly
affected non-bank lending to Russia (including bond flows), which fell from inflows of $85
billion in 2013 to outflows of $72 billion in 2014. For total non-resident flows to Russia,
we project a further retrenchment to the tune of $33 billion this year, led by bank lending
and portfolio debt flows. In addition, net debt-related inflows to China have turned
negative as Chinese corporates have sought to reduce dollar exposure in the face of
dollar strength, monetary policy easing, and more two-way movement in the RMB.
Resident capital outflows by emerging market investors are projected to stabilize at just
under $1.2 trillion in 2015. We expect the composition of EM outward investment to shift
Chart 5Chart 5Chart 5Chart 5
0
75
150
225
300
375
2010 2012 2014
Differential Between U.S.Differential Between U.S.Differential Between U.S.Differential Between U.S. HY HY HY HY Spread and CEMBI SpreadSpread and CEMBI SpreadSpread and CEMBI SpreadSpread and CEMBI Spreadbasis points
Source: Bloomberg, BAML, IIF.
2000-2015 Average
Table 1Table 1Table 1Table 1
Emerging Market Economies: Capital FlowsEmerging Market Economies: Capital FlowsEmerging Market Economies: Capital FlowsEmerging Market Economies: Capital Flows
$ billion 2013 2014 2015 2016
NonNonNonNon----Resident Capital Inflows Resident Capital Inflows Resident Capital Inflows Resident Capital Inflows 1301130113011301 1090109010901090 1049104910491049 1202120212021202
Private InflowsPrivate InflowsPrivate InflowsPrivate Inflows 1269126912691269 1048104810481048 981981981981 1158115811581158
Equity Investment 666 687 657 725
Direct Investment 582 586 529 561
Portfolio Investment 84 101 128 164
Private Creditors 603 361 325 433
Commercial Banks 172 175 119 184
Nonbanks 431 186 206 248
Official Inflows 33 42 68 44
International Financial Institutions -3 12 34 20
Bilateral Creditors 36 30 34 24
Resident Capital OutflowsResident Capital OutflowsResident Capital OutflowsResident Capital Outflows ----1518151815181518 ----1164116411641164 ----1179117911791179 ----1351135113511351
Private Outflows -978 -1054 -1105 -1065
Equity Investment Abroad -418 -397 -388 -406
Resident Lending/Other -560 -657 -716 -659
Reserves (- = Increase) -540 -110 -74 -286
----217217217217 ----74747474 ----130130130130 ----149149149149
Memo:
Net Errors and Omissions -3 -146 0 0
Current Account Balance 220 220 130 149
Source: IIF. See backcover page for guidance on how to interpret these data.
Net Capital FlowsNet Capital FlowsNet Capital FlowsNet Capital Flows

iif.com © Copyright 2015. The Institute of International Finance, Inc. All rights reserved.
page 4 CAPITAL FLOWS TO EMERGING MARKETS | MAY 28, 2015
further towards private sources of capital and away from official reserve accumulation.
Indeed, reserve accumulation is projected to slow to only $74 billion this year from $110
billion in 2014 and an average of $600 billion during 2004-2013. As discussed on pages
13-14, this reduction reflects three main factors: (1) declining oil revenues by major oil
exporters (see page 32), (2) weaker capital inflows mainly in Asian EMs, and (3) a
continued rise in outflows by Chinese corporates (see page 25). Thanks to China,
emerging markets on aggregate remain net exporters of capital (Chart 7). China is
projected to invest $540 billion overseas in 2015 (up $38 billion), of which over 50%
would be resident lending abroad and over a quarter in the form of FDI.
Chart 7Chart 7Chart 7Chart 7
-2000
-1500
-1000
-500
0
500
1000
1500
1995 1998 2001 2004 2007 2010 2013 2016f
"Private" Resident Outflows
Official Reserve Accumulation
Non-Resident Inflows
Net Flows
EM Capital Flows by Residency of InvestorsEM Capital Flows by Residency of InvestorsEM Capital Flows by Residency of InvestorsEM Capital Flows by Residency of Investors$ billion
Source: IIF.
IIF Forecast
Chart 6Chart 6Chart 6Chart 6
-1.5
0.0
1.5
3.0
4.5
6.0
7.5
9.0
10.5
-200
0
200
400
600
800
1000
1200
1400
2000 2004 2008 2012 2016
EM Europe Latin America
MENA EM Asia ex. China
China
Private NonPrivate NonPrivate NonPrivate Non----Resident Capital Inflows to Emerging MarketsResident Capital Inflows to Emerging MarketsResident Capital Inflows to Emerging MarketsResident Capital Inflows to Emerging Markets$ billion percent of EM GDP
Total, Percent of EM GDP
Source: IIF.
IIF Forecast
Thanks to China, Thanks to China, Thanks to China, Thanks to China, emerging markets emerging markets emerging markets emerging markets on aggregate on aggregate on aggregate on aggregate remain net remain net remain net remain net exporters of exporters of exporters of exporters of capitalcapitalcapitalcapital

iif.com © Copyright 2015. The Institute of International Finance, Inc. All rights reserved.
page 5 CAPITAL FLOWS TO EMERGING MARKETS | MAY 28, 2015
GLOBAL GROWTHGLOBAL GROWTHGLOBAL GROWTHGLOBAL GROWTH————ACCELEACCELEACCELEACCELERATION DELAYEDRATION DELAYEDRATION DELAYEDRATION DELAYED
Underlying our projections for reduced flows this year and a pick-up in 2016 is a global
macro outlook where growth is led by an acceleration in mature economies, with weaker,
but regionally differentiated growth in EMs. Fed policy rates are expected to be raised
gradually from later this year, but the ECB and BoJ continue their QE programs.
Relative to our January Capital Flows report, global activity has clearly disappointed so
far this year. We now estimate mature economy growth in the first quarter to have been a
mediocre 1.3%, and only 2.6% in EMs—the lowest rate since the global financial crisis
(Chart 8). While activity in Europe and Japan has gathered some momentum, growth
faltered in both the U.S. and China. More broadly, the global impact of lower oil prices
on consumption was less favorable than previously thought. Also, any beneficial
consumption effect was offset to varying degrees by cutbacks in investment (particularly
in the U.S.) and government spending (in EM oil exporters).
We still expect an acceleration of growth in the remainder of 2015 and 2016, as
temporary factors weighing on U.S. activity unwind, as stimulus measures have an impact
in China, and as conditions improve in a number of other EMs that have been very weak,
notably Brazil and Russia. Nonetheless, as reported in our April Global Economic
Monitor, we have reduced our 2015 global GDP forecasts by around 1/3 percentage
point, with lower annual growth in Latin America, the MENA region and in the U.S.
(Chart 10). Lower EM growth particularly affects FDI and banking inflows, which are
expected to suffer as a result (Chart 9).
DIVERGENT DIVERGENT DIVERGENT DIVERGENT MONETARY POLICY MONETARY POLICY MONETARY POLICY MONETARY POLICY ---- UNEASY BACKUNEASY BACKUNEASY BACKUNEASY BACKDROP DROP DROP DROP FOR PORTFOLIO FLOWSFOR PORTFOLIO FLOWSFOR PORTFOLIO FLOWSFOR PORTFOLIO FLOWS
Prospects for EM portfolio flows hinge crucially on prospects for increases in Fed policy
rates. Since January, expectations for Fed tightening have been pushed backwards,
0
2
4
6
8
10
2010 2012 2014
IIF EM Coincident IndicatorIIF EM Coincident IndicatorIIF EM Coincident IndicatorIIF EM Coincident Indicatorpercent change
SourceSource
EMCI, 3m/3m, saar
Source: IIF.
EM GDP, q/q, saar
Chart 8Chart 8Chart 8Chart 8
Chart 9Chart 9Chart 9Chart 9
Figure 1: Drivers of EM Capital Flows by Major Component Figure 1: Drivers of EM Capital Flows by Major Component Figure 1: Drivers of EM Capital Flows by Major Component Figure 1: Drivers of EM Capital Flows by Major Component
DriverDriverDriverDriver Portfolio EquityPortfolio EquityPortfolio EquityPortfolio Equity Portfolio DebtPortfolio DebtPortfolio DebtPortfolio Debt Banking FlowsBanking FlowsBanking FlowsBanking Flows FDIFDIFDIFDI
Global risk aversion
PushPushPushPush Mature economy interest rates
Mature economy output growth
Domestic output growth
PullPullPullPull Asset return indicators
Country risk indicators
Strong evidence for negative relationship
TypeTypeTypeType
Strong evidence for positive relationship
Some evidence for positive relationship
Mixed evidence, no clear relationship
Some evidence for negative relationship
Source: IIF Working Paper “What Drives Capital Flows to Emerging Markets?”, April 2015.

iif.com © Copyright 2015. The Institute of International Finance, Inc. All rights reserved.
page 6 CAPITAL FLOWS TO EMERGING MARKETS | MAY 28, 2015
reflecting the sluggish U.S. growth performance, even though the U.S. labor market has
continued to heal. While at the beginning of the year, a June 2015 rate hike seemed on
the cards, the first rate hike now seems unlikely to occur before September and then
only if the U.S. economy regains momentum in coming months. In addition, the
expected trajectory of rate increases has become less steep, helped by a downward shift
in the FOMC’s own interest rate projections (Chart 12). On the other side of the Atlantic,
sovereign QE by the ECB has delivered a substantial reduction in European bond yields
and expectations for future ECB policy rates, albeit partly reversed during the first half of
May (Chart 13).
We estimate that lower policy rate expectations in both the U.S. and the Euro Area have
had a positive direct impact on portfolio flows to EMs, in particular this year (Chart 11).
In the past, shifts in perceptions about Fed rates have been the dominant factor, but
ECB actions have risen in importance recently. In addition to this direct effect, lower
European bond yields were one factor weighing on U.S. rates (in part because portfolio
substitution effects coming from the ECB’s QE program drove down the term premium
-1.6
-1.2
-0.8
-0.4
0.0
0.4
0.82015 2016
Forecast Revisions to GDP GrowthForecast Revisions to GDP GrowthForecast Revisions to GDP GrowthForecast Revisions to GDP Growth Relative to January CFRRelative to January CFRRelative to January CFRRelative to January CFRpercentage points
Source: IIF.
Chart 10Chart 10Chart 10Chart 10
-20
-16
-12
-8
-4
0
4
8
12
16
2013 2014 2015
Fed
ECB
Estimated ContributionsEstimated ContributionsEstimated ContributionsEstimated Contributions to EM Portfolio Flowsto EM Portfolio Flowsto EM Portfolio Flowsto EM Portfolio Flows$ billion, cumulative contributions since 1/1/2013
Source: Bloomberg, IIF.
Taper Tantrum
Bund Tantrum
Chart 11Chart 11Chart 11Chart 11
Chart 12Chart 12Chart 12Chart 12 Chart 13Chart 13Chart 13Chart 13
Lower policy rate Lower policy rate Lower policy rate Lower policy rate expectations in expectations in expectations in expectations in both the U.S. and both the U.S. and both the U.S. and both the U.S. and the Euro Area the Euro Area the Euro Area the Euro Area have had a have had a have had a have had a positive direct positive direct positive direct positive direct impact on impact on impact on impact on portfolio flows to portfolio flows to portfolio flows to portfolio flows to EMsEMsEMsEMs
0
1
2
3
Jan 14 Apr 14 Jul 14 Oct 14 Jan 15 Apr 15
10101010----YearYearYearYear Govt. Bond YieldsGovt. Bond YieldsGovt. Bond YieldsGovt. Bond Yieldspercent
Germany
U.S.
Source: Haver.
0.0
0.5
1.0
1.5
2.0
2.5
3.0
3.5
4.0
2015 2016 2017 2018
Market Expectations as of 5/22/2015
Market Expectations as of 1/8/2015
FOMC as of 12/2014
FOMC as of 3/2015
Outlook for Federal Funds RateOutlook for Federal Funds RateOutlook for Federal Funds RateOutlook for Federal Funds Ratepercent, based on fed fund futures and Eurodollar contracts, FOMC = Median FOMC projection
Source: Bloomberg, Federal Reserve, IIF.

iif.com © Copyright 2015. The Institute of International Finance, Inc. All rights reserved.
page 7 CAPITAL FLOWS TO EMERGING MARKETS | MAY 28, 2015
in U.S. bond yields and in part because of the damping impact on the U.S. economy of
the US dollar appreciation against the Euro), supporting portfolio flows to EMs.
Going forward, we project that the Fed will start to tighten in September, and then raise
rates by an average of 25 basis points a quarter through 2016, in line with FOMC
projections and the current economist consensus. Market expectations for Fed rate hikes
would edge gradually higher and closer towards the FOMC’s own projected trajectory
(Chart 12) as the date of liftoff comes closer, assuming that U.S. growth recovers
momentum over the summer months and labor markets continue to tighten. It is
important to note, however, that the assumed Fed policy trajectory in this scenario does
not rely on strong U.S. growth outcomes – we assume quarterly growth rates in the range
of 2.5-3 percent from Q3 onwards—but instead is linked to growing evidence for a
closing output gap and a weakening of the supply side of the U.S. economy. This
weakening has occurred across several dimensions.
One is that U.S. productivity performance has been lackluster in the post-crisis period:
growth in real output per hour has been less than half of the pre-2008 average (Chart
14). In addition, labor force participation rates have failed to pick up from their post-crisis
lows and the matching function of the labor market has deteriorated as illustrated by an
outward shift of the Beveridge curve in recent years (Chart 15). This is likely to reflect
continued problems in the housing market, which weigh on labor mobility as well as
continued skills mismatches.
Under the baseline scenario, the drag on EM portfolio and banking flows from gradually
increasing U.S. interest rates would be offset to some extent by the moderate pickup in
mature economy growth. Nonetheless, the uncertainty surrounding the transition to Fed
liftoff and associated adjustment of market expectations is likely to lead to some volatility
of portfolio flows, notably for those EMs with vulnerable macro fundamentals and policy
frameworks. The beginning of this year gave some flavor of the effects of such an
adjustment in rate expectations as markets brought forward their expected timing of the
first rate hike against the background of strong employment data in the U.S. (only to shift
them back again from mid-March onwards).
-2
-1
0
1
2
3
4
5
6
1990 1995 2000 2005 2010 2015
Period averages
U.S. BusinessU.S. BusinessU.S. BusinessU.S. Business Sector ProductivitySector ProductivitySector ProductivitySector Productivitypercent, oya; real output per hour
Source: Haver, BLS.
Chart 14Chart 14Chart 14Chart 14
1.5
2.0
2.5
3.0
3.5
4.0
4 5 6 7 8 9 10 11unemployment rate, percent of labor force
2008H2
20112012
2009
2010
U.S. Beveridge Curve (2001U.S. Beveridge Curve (2001U.S. Beveridge Curve (2001U.S. Beveridge Curve (2001----2014 Data)2014 Data)2014 Data)2014 Data)job openings rate in percent of total jobs (filled and vacant)
2013
Source: BLS, IIF.
2014
2001-2008H1
Chart 15Chart 15Chart 15Chart 15
We project that We project that We project that We project that the Fed will start the Fed will start the Fed will start the Fed will start to tighten in to tighten in to tighten in to tighten in September, and September, and September, and September, and then raise rates by then raise rates by then raise rates by then raise rates by an average of 25 an average of 25 an average of 25 an average of 25 basis points a basis points a basis points a basis points a quarter through quarter through quarter through quarter through 2016201620162016

iif.com © Copyright 2015. The Institute of International Finance, Inc. All rights reserved.
page 8 CAPITAL FLOWS TO EMERGING MARKETS | MAY 28, 2015
WHAT IF REALITY DOES NOT FOLLOW THE BASEWHAT IF REALITY DOES NOT FOLLOW THE BASEWHAT IF REALITY DOES NOT FOLLOW THE BASEWHAT IF REALITY DOES NOT FOLLOW THE BASELINE SCENARIO?LINE SCENARIO?LINE SCENARIO?LINE SCENARIO?
Our baseline scenario is arguably a relatively benign one in current circumstances with a
pick-up in global growth, supporting a recovery of capital flows to EMs. However, after
years of post-crisis disappointments, there are rising doubts about global economic
performance. Here we consider how different scenarios for mature economy GDP growth
and U.S. policy tightening could affect EM growth and capital flows in various ways
(Chart 16).
The best outcome would be robust demand combined with improved supply side
performance and only moderate labor market tightening. This could be seen as a “return
to normal” or “sweetspot” case whereby U.S. growth potential is sufficiently high that
spare capacity is absorbed only slowly despite strong output growth—the best of all
worlds for EM capital flows. Compared to this, our baseline scenario is somewhat more
pessimistic as it combines weaker growth with the same degree of labor market and
policy tightening.
However, there are two alternative scenarios that would have much less benign
implications for EMs. In both cases, capital flows to EMs would remain under pressure,
rather than rebound markedly in 2016 as projected in our baseline scenario.
The first scenario would be a “secular stagnation” scenario, in which mature economy
aggregate demand growth continues to turn out weaker than projected. In these
circumstances, labor market tightening would occur much more gradually and price
inflation would remain well below central bank targets. This could occur as continuing
disappointment with growth outcomes feeds into rising concerns about prospects,
dampening both consumer confidence and business sentiment. This could be reinforced
by a sense that policymakers were running out of instruments to push economies against
strong secular drags, including aging populations, less productivity kick from
Chart 16Chart 16Chart 16Chart 16
FDI Bank Portfolio
Sweetspot
Baseline
Secular Stagnation
U.S. Supply Shock
Note: dark red denotes very adverse impact, dark green denotes
very positive impact.
EM GDP growth
U.S. labor market tightening /Fed policy rate hikes / global risk aversion
Sweetspot
Baseline
Secular Stagnation
EM Capital Flows EM Capital Flows EM Capital Flows EM Capital Flows ---- Different ScenariosDifferent ScenariosDifferent ScenariosDifferent Scenarios
U.S. Wage Shock
EM Capital Flows Scenarios Impact by Type of FlowEM Capital Flows Scenarios Impact by Type of FlowEM Capital Flows Scenarios Impact by Type of FlowEM Capital Flows Scenarios Impact by Type of Flow
We consider how We consider how We consider how We consider how different scenarios different scenarios different scenarios different scenarios for mature for mature for mature for mature economy GDP economy GDP economy GDP economy GDP growth and U.S. growth and U.S. growth and U.S. growth and U.S. policy tightening policy tightening policy tightening policy tightening could affect EM could affect EM could affect EM could affect EM growth and capital growth and capital growth and capital growth and capital flows flows flows flows

iif.com © Copyright 2015. The Institute of International Finance, Inc. All rights reserved.
page 9 CAPITAL FLOWS TO EMERGING MARKETS | MAY 28, 2015
technological progress, and slower convergence by EMs. This would lead the Fed to
signal that it will wait longer to start liftoff (thus more or less validating current market
rate expectations) and then raise rates very gradually with the end-point for rate
increases lower as expectations for longer term growth and equilibrium real rates come
down.
The lower trajectory for Fed rates would benefit portfolio flows thanks to lower global
interest rates than otherwise. However, EM growth would also turn out weaker due to
less demand from mature economies, which would weigh on capital flows, notably FDI.
Overall, we would expect capital flows to EMs to be stagnant in this scenario.
The second scenario—arguably an even more negative one from an EM perspective—
would be a negative U.S. wage shock, whereby even with U.S. demand growing only
moderately according to our baseline, wage pressures pick up more rapidly than
envisaged. This could be the case if the U.S. labor market supply response to rising labor
demand remains weak, implying that even meagre aggregate demand growth leads to a
pick-up in wage pressures. In this case, the Fed would tighten policy quicker than even
their own current projections suggest and market expectations could adjust quite
abruptly, triggering a “super taper tantrum.” Such an adjustment would likely be
accompanied by rising risk aversion.
For EM capital flows, this would be the worst of all worlds with higher global interest
rates, less favorable financing conditions and lackluster mature economy growth.
Movements in EM asset prices could be quite sharp, exacerbated by reduced market
liquidity. In such circumstances, the broad EM asset class could be affected by wide
outflows that would be less differentiated, as liquid markets could suffer quite heavy
withdrawals, at least until market stress subsides. Overall, EM flows could be substantially
lower, mainly because of weaker portfolio flows.
Chart 18Chart 18Chart 18Chart 18
0
10
20
30
40
50
60
70
0
1
2
3
4
5
6
7
8
9
2000 2002 2004 2006 2008 2010 2012 2014
U.S. BBBU.S. BBBU.S. BBBU.S. BBB----Rated Corporate Bond Spread and VIXRated Corporate Bond Spread and VIXRated Corporate Bond Spread and VIXRated Corporate Bond Spread and VIXpercent per annum
Source: Bank of America/ Merrill Lynch, CBOE.
U.S. Corp BBB Spread
VIX
Chart 17Chart 17Chart 17Chart 17
0.1
0.2
0.3
0.4
0.5
0.6
0.7
2008 2009 2010 2011 2012 2013 2014 2015
Pre-2008Crisis Average
Post-2008Crisis Average
Source: IIF, Bloomberg.
Correlation Across EM ExchangeCorrelation Across EM ExchangeCorrelation Across EM ExchangeCorrelation Across EM Exchange RatesRatesRatesRatesaverage 30-day rolling correlation between percentage change in MSCI EM FX index and USD/LC exchange rate for 22 EMs
A U.S. wage shock A U.S. wage shock A U.S. wage shock A U.S. wage shock would be the would be the would be the would be the worst scenario for worst scenario for worst scenario for worst scenario for EM capital flows.EM capital flows.EM capital flows.EM capital flows.

iif.com © Copyright 2015. The Institute of International Finance, Inc. All rights reserved.
page 10 CAPITAL FLOWS TO EMERGING MARKETS | MAY 28, 2015
WHO’S AT RISK FROM A SPIKE IN GLOBAL RISWHO’S AT RISK FROM A SPIKE IN GLOBAL RISWHO’S AT RISK FROM A SPIKE IN GLOBAL RISWHO’S AT RISK FROM A SPIKE IN GLOBAL RISK AVERSION K AVERSION K AVERSION K AVERSION
If history is any guide, global risk aversion would increase sharply, at least temporarily,
under a scenario in which market expectations for Fed policy shift abruptly. Recently,
most broad measures of global risk aversion have remained at relatively low levels, at
least when compared to historical averages (Chart 17). An increase in global risk aversion
would likely introduce additional volatility into capital flows to EMs. A structural decline
in market liquidity increases the degree of concern with volatility spikes (see pages 20-
24).
Not all EMs would be hit equally. In fact, markets have continued to differentiate
significantly across EMs, with cross-country correlations for different asset markets
remaining significantly lower than in the years prior to 2013 (Chart 18). To calibrate the
impact of risk shocks across EMs, we have estimated risk responsiveness betas for some
major EMs, which again supports the differentiation story (see Box).
Our IIF Heatmap of EM vulnerabilities attempts to compare macro fundamentals across
EMs. The country ranking identified in the Heatmap correlates well with market
performance across EMs (Chart 19; see also the discussion in our April Global Economic
Monitor). Much of the focus ever since the 2013 taper tantrum has been on external
vulnerabilities and more recently on policy vulnerabilities. Specifically, EMs with large
current account deficits, such as South Africa, Turkey and Brazil, have tended to
underperform. By contrast, India has used the time since the taper tantrum to reduce its
current account deficit and has been more resilient to market pressures in recent months.
The sharp decline in oil prices relative to its highs in early 2014, notwithstanding the
recent rebound, has tended to reduce external vulnerabilities of oil importers, but hurt oil
exporters. India, for example, clearly is a beneficiary and also took advantage of lower oil
prices to reduce fuel subsidies. While Turkey benefits from a lower oil import bill, much
BR
CLCN
CO
HU
IN
ID
MY
MX
PE
PH
PLRO
ZA
TRRU
-40
-20
0
20
40
60
80
100
0.3 0.4 0.5 0.6 0.7
average of domestic, external and policy vulnerability indices*
*A higher value implies higher vulnerability and vice-versa. Source: IIF, Bloomberg.
IIF Heat MapIIF Heat MapIIF Heat MapIIF Heat Map Vulnerability Measures Vulnerability Measures Vulnerability Measures Vulnerability Measures vs. EMBIG Spreadsvs. EMBIG Spreadsvs. EMBIG Spreadsvs. EMBIG Spreads
change in EMBIG spreads since Aug 2014
Chart 19Chart 19Chart 19Chart 19
AnAnAnAn increase in increase in increase in increase in global risk global risk global risk global risk aversion would aversion would aversion would aversion would likely introduce likely introduce likely introduce likely introduce additional additional additional additional volatility into volatility into volatility into volatility into capital flows to capital flows to capital flows to capital flows to EMsEMsEMsEMs

iif.com © Copyright 2015. The Institute of International Finance, Inc. All rights reserved.
page 11 CAPITAL FLOWS TO EMERGING MARKETS | MAY 28, 2015
Chart 20Chart 20Chart 20Chart 20
BOX: CALIBRATING THEBOX: CALIBRATING THEBOX: CALIBRATING THEBOX: CALIBRATING THE IMPACT OF A RISK SHIMPACT OF A RISK SHIMPACT OF A RISK SHIMPACT OF A RISK SHOCKOCKOCKOCK
A bumpy Fed exit could prompt a spike in global risk
aversion that would spill over into emerging markets. In a
recent research note, we estimate how responsive various
emerging markets’ asset prices are to changes in global risk
aversion. We refer to this relationship as the “EM risk beta,”
analogous to the relation between individual stock prices
and the overall stock market in the Capital Asset Pricing
Model (CAPM) framework. We cover 10 major EM
economies during the period from 2000–2015, and focus on
the MSCI EM stock market index and the U.S. corporate BBB
spread, which have been strongly correlated in recent years
(Chart 20). In addition, we consider other EM asset price
variables like EM bond spreads over U.S. Treasuries and the
exchange rate vis-à-vis the U.S. dollar. We also cross-check
our results by using an alternative measure of global risk
aversion (the VIX).
A useful estimate of the responsiveness of EM stocks to
changes in risk aversion can be obtained by running a simple
regression of the daily percent change in the MSCI EM on
the daily percent change in the BBB spread, plus a constant
term: %EM Asset Pricest = c + β * %BBBt
The coefficient β provides a measure of the elasticity of the
response to shifts in global risk aversion. Within the last 15
years, we look at three sample periods—the pre-crisis period
(2000-2007), the crisis years (2008-2009), and the most
recent years (2012-2015). It is notable that the estimated risk
betas have increased since as EMs have become more
interconnected with global markets (Chart 21).
Countries with high risk betas tend to be those that score
highly on two dimensions: greater vulnerability according to
our EM heat map, and greater openness. On the
vulnerability scale, external financing requirements as
measured by current account deficits shows a particularly
close relationship (Chart 22).
Aside from country vulnerabilities, higher risk betas may also
reflect greater openness, making countries more responsive
to changes in global investor sentiment. A related factor is
the degree to which domestic securities are owned by
foreign investors. We find that risk betas tend to be higher
when foreign investors own a sizeable share of a country’s
securities.
-7
-6
-5
-4
-3
-2
-1
0
1
2
3
0 1 2 3 4
Current Account Balance
Risk Betas EstimatedRisk Betas EstimatedRisk Betas EstimatedRisk Betas Estimated Using Bond Spreads Using Bond Spreads Using Bond Spreads Using Bond Spreads vs. CAvs. CAvs. CAvs. CA BalanceBalanceBalanceBalancepercent of GDP, IIF forecast for 2015 current account balance
Estimated % Response to 1% Increase in Global Risk Aversion
TurkeySouth Africa
China
BrazilIndonesia
PolandMexico
IndiaChile
Source: Bloomberg, IMF, IIF.
Chart 22Chart 22Chart 22Chart 22
Chart 21Chart 21Chart 21Chart 21
-1.2
-1.0
-0.8
-0.6
-0.4
-0.2
0.0
India
Poland
Indonesia
South Africa
China
Chile
Turkey
Mexico
Brazil
Russia
2000-2007
2008-2009
2012-2015
EM Risk Betas Estimated Using EM MSCI and U.S. EM Risk Betas Estimated Using EM MSCI and U.S. EM Risk Betas Estimated Using EM MSCI and U.S. EM Risk Betas Estimated Using EM MSCI and U.S. BBB SpreadBBB SpreadBBB SpreadBBB Spreadestimated % response to 1% increase in global risk aversion
Source: Bloomberg, IIF.
1.0
1.5
2.0
2.5
3.0
3.5800
900
1,000
1,100
1,200
2010 2011 2012 2013 2014 2015
MSCI EM and U.S. Corporate BBB SpreadMSCI EM and U.S. Corporate BBB SpreadMSCI EM and U.S. Corporate BBB SpreadMSCI EM and U.S. Corporate BBB Spreadindex percentage points
BBB Spread
MSCI EM
Source: Bloomberg, IIF.
iif.com © Copyright 2015. The Institute of International Finance, Inc. All rights reserved.
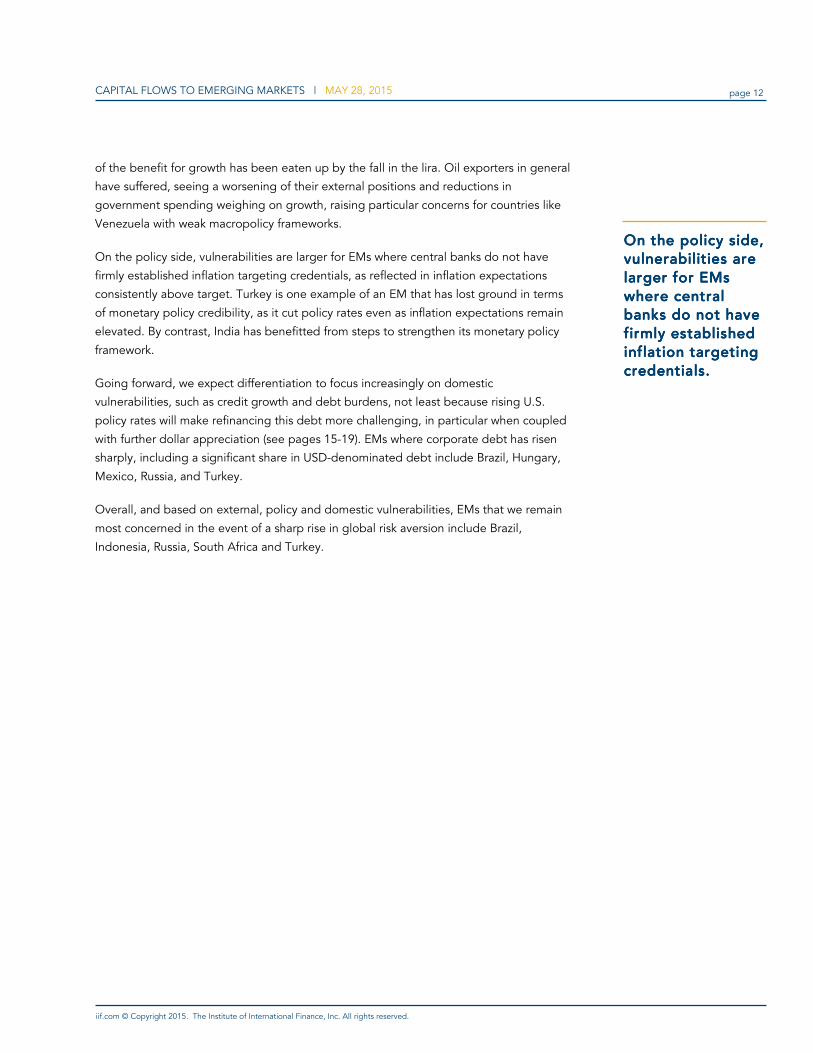
page 12 CAPITAL FLOWS TO EMERGING MARKETS | MAY 28, 2015
of the benefit for growth has been eaten up by the fall in the lira. Oil exporters in general
have suffered, seeing a worsening of their external positions and reductions in
government spending weighing on growth, raising particular concerns for countries like
Venezuela with weak macropolicy frameworks.
On the policy side, vulnerabilities are larger for EMs where central banks do not have
firmly established inflation targeting credentials, as reflected in inflation expectations
consistently above target. Turkey is one example of an EM that has lost ground in terms
of monetary policy credibility, as it cut policy rates even as inflation expectations remain
elevated. By contrast, India has benefitted from steps to strengthen its monetary policy
framework.
Going forward, we expect differentiation to focus increasingly on domestic
vulnerabilities, such as credit growth and debt burdens, not least because rising U.S.
policy rates will make refinancing this debt more challenging, in particular when coupled
with further dollar appreciation (see pages 15-19). EMs where corporate debt has risen
sharply, including a significant share in USD-denominated debt include Brazil, Hungary,
Mexico, Russia, and Turkey.
Overall, and based on external, policy and domestic vulnerabilities, EMs that we remain
most concerned in the event of a sharp rise in global risk aversion include Brazil,
Indonesia, Russia, South Africa and Turkey.
On the policy side, On the policy side, On the policy side, On the policy side, vulnerabilities are vulnerabilities are vulnerabilities are vulnerabilities are larger for EMs larger for EMs larger for EMs larger for EMs where central where central where central where central banks do not have banks do not have banks do not have banks do not have firmly established firmly established firmly established firmly established inflation targeting inflation targeting inflation targeting inflation targeting credentials. credentials. credentials. credentials.

iif.com © Copyright 2015. The Institute of International Finance, Inc. All rights reserved.
page 13 CAPITAL FLOWS TO EMERGING MARKETS | MAY 28, 2015
THE GREAT EM RESERVE SLOWDOWN THE GREAT EM RESERVE SLOWDOWN THE GREAT EM RESERVE SLOWDOWN THE GREAT EM RESERVE SLOWDOWN
EM reserve accumulation has moderated substantially since the global financial crisis, and
in 2014 slowed to the weakest pace since 2001 amidst weaker non-resident capital
inflows and higher private resident outflows (Chart 23). Moreover, overall EM current
account balance eased slightly, as a decrease in the current accounts of oil exporters
offset the increase in the current accounts of oil importers (Chart 24). Due to these two
factors, oil exporters’ FX reserves declined and oil importers’ reserve growth halved.
Most dramatically, FX reserves plunged in EM Europe for a second year (Chart 25). The
decline was largely driven by Russia, where non-resident capital inflows declined
significantly in the context of uncertainty associated with the Ukraine conflict. Unfavorable
non-resident capital inflow and private resident capital outflow dynamics also reduced
reserves in Ukraine, Turkey and Romania and slowed reserve accumulation in Hungary
and Poland. However, current account balances improved in most countries, including in
Russia (as lower oil exports were accompanied by demand compression) and Turkey.
In EM Asia, reserve accumulation was cut in half led by weaker capital flows even as
current account balances improved. The key driver was China, where reserve
accumulation slowed significantly amidst the largest private resident outflows since at
least 1983, causing the central bank to intervene towards the end of the year in order to
contain RMB depreciation. Non-resident capital inflows moderated as well as the Chinese
economy slowed. FX reserves declined in Thailand and oil-exporter Malaysia—where
increased risk aversion halved non-resident capital inflows from 2013—and in Philippines
where private resident outflows jumped.
The marked deceleration in reserve growth in Middle East & Africa was driven by
narrowing trade and current account surpluses among oil exporters Saudi Arabia, UAE
and Nigeria. Nigeria also witnessed weaker capital inflows. Reserve accumulation in
South Africa continued to slow rapidly amidst private resident outflows, even though
current account balance and non-resident capital inflows picked up from 2013.
-1200
-800
-400
0
400
800
1200
1600
2000
2000 2002 2004 2006 2008 2010 2012 2014 2016
Resident Private Outflows
Non-Resident Inflows
Current Account Balance
Reserve Accumulation
Source: IIF.
Drivers of EM Reserve AccumulationDrivers of EM Reserve AccumulationDrivers of EM Reserve AccumulationDrivers of EM Reserve Accumulation$ billion
IIF Forecast
Chart 23Chart 23Chart 23Chart 23
-200
0
200
400
600
800
1,000
1,200
2000 2002 2004 2006 2008 2010 2012 2014 2016
EM Asia
Middle East/Africa
Latin America
EM Europe
EM
EM FX Reserve Accumulation by RegionEM FX Reserve Accumulation by RegionEM FX Reserve Accumulation by RegionEM FX Reserve Accumulation by Region$ billion
Source: IIF.
IIF Forecast
Chart 25Chart 25Chart 25Chart 25
-200
-100
0
100
200
300
400
500
600
2003 2009 2015
Oil Importers
Oil Exporters
Source: IIF.
IIF Forecast
EM Current Account BalanceEM Current Account BalanceEM Current Account BalanceEM Current Account Balance$ billion
Chart 24Chart 24Chart 24Chart 24
EM reserve EM reserve EM reserve EM reserve accumulation has accumulation has accumulation has accumulation has moderated moderated moderated moderated substantially since substantially since substantially since substantially since the global financial the global financial the global financial the global financial crisis.crisis.crisis.crisis.

iif.com © Copyright 2015. The Institute of International Finance, Inc. All rights reserved.
page 14 CAPITAL FLOWS TO EMERGING MARKETS | MAY 28, 2015
By contrast, Latin America witnessed an increase in FX reserves following a drop in 2013
led by Brazil, Argentina and Venezuela as a deterioration in current account balances was
financed by higher capital inflows and/or reduced private resident outflows.
Looking ahead, we expect EM reserve accumulation to slow further in 2015. Current
account balances are projected to weaken in aggregate, as a decline in oil exporters’
current accounts will more than offset an improvement in oil importers’ current accounts.
Non-resident capital inflows are likely to moderate among most oil exporters as well as in
over half of oil importers. Overall, we expect oil exporters’ FX reserves to decline in
aggregate and to be only marginally offset by an improvement in oil importers’ FX
reserves (Chart 26).
In fact, monthly FX reserves data adjusted for valuation changes indicate a decline in EM
FX reserves in 2015Q1, in line with our projections for a decline in reserves this year in
countries like Saudi Arabia, Malaysia, Russia, South Africa and Nigeria and weaker reserve
accumulation in China but a further pick up in reserve accumulation in countries like Korea
(Chart 27). Data for Venezuela’s reserves have not been published, but are estimated to
have declined further.
In this environment, a number of countries with a low reserve coverage ratio based on FX
reserve holdings at the end of 2014 and large external financing needs for 2015 will be
vulnerable to periods of stress since the central bank’s ability to intervene to limit currency
depreciation will be constrained (Chart 28). Many of these countries are expected to
witness a decline in FX reserves (Venezuela, Argentina, Lebanon, Malaysia and South
Africa) or a slowdown in non-resident inflows (Indonesia, Malaysia, South Africa, Turkey,
Lebanon and Ecuador) during 2015. Countries like Argentina, Turkey and Czech Republic
also received large portfolio equity and debt inflows during 2009-13 relative to their FX
reserve holdings, thus making them susceptible to risk shocks. South Africa, Indonesia and
Turkey have been on our watch list for a while.
Chart 27Chart 27Chart 27Chart 27
ARPLBG
ZA
BR
MY
RO
RU
CO
KR
LB
MO
ID
CL
HU
PEPH
CZ
MX
IN
NG(9.1, 1.7)
TH
TR
VEUKEC
0.0
0.5
1.0
1.5
2.0
2.5
3.0
3.5
0.0 0.5 1.0 1.5 2.0 2.5 3.0 3.5 4.0
reserve coverage ratio in 2008*
CN(5.9, 5.1)
EG
EM Reserve AdequacyEM Reserve AdequacyEM Reserve AdequacyEM Reserve Adequacyreserve coverage ratio in 2015* (threshold=1.0)
FX reserves at end of previous year/(Current account deficit + short-term external debt + amortization payments due in current year). Source: IIF.
Chart 28Chart 28Chart 28Chart 28
-200
0
200
400
600
800
1,000
1,200
2003 2009 2015
Oil ImportersOil Exporters
Source: IIF.
IIF Forecast
EM FX ReservesEM FX ReservesEM FX ReservesEM FX Reserves$ billion
Chart 26Chart 26Chart 26Chart 26
-50
-40
-30
-20
-10
0
10
20
30
40
CN SARU
MY
NG
RO ZA
MO PECL
CO TR
AR
EG ID CZ
TH
BG
HU
UK
PH PL
LB BR
MX
KO IN
Valuation AdjustedValuation AdjustedValuation AdjustedValuation Adjusted Change in EM FX Reserves in 2015Q1Change in EM FX Reserves in 2015Q1Change in EM FX Reserves in 2015Q1Change in EM FX Reserves in 2015Q1$ billion
Source: IMF IFS, IIF Calculations.
We expect EM We expect EM We expect EM We expect EM reserve reserve reserve reserve accumulation to accumulation to accumulation to accumulation to slow further in slow further in slow further in slow further in 2015. 2015. 2015. 2015.

iif.com © Copyright 2015. The Institute of International Finance, Inc. All rights reserved.
page 15 CAPITAL FLOWS TO EMERGING MARKETS | MAY 28, 2015
EMERGING MARKET CORPORATE DEBTEMERGING MARKET CORPORATE DEBTEMERGING MARKET CORPORATE DEBTEMERGING MARKET CORPORATE DEBT————WHERE ARE THE RISKS? WHERE ARE THE RISKS? WHERE ARE THE RISKS? WHERE ARE THE RISKS?
A striking phenomenon in recent years has been the speed of growth in EM corporate bond
markets. This growth has been driven both by the hunt for yield as global investors look
further afield, and by the ongoing development of EM bond markets more broadly. Since
2008, total corporate bonds outstanding have almost doubled, surpassing $6.8 trillion at end
-2014, significantly outpacing the growth of bank credit. While both financial and non-
financial corporate bonds have contributed to this sharp increase, the rise has been more
pronounced in the EM non-financial corporate bond market, which now totals more than $2.6
trillion—almost triple its level in 2008 (Chart 29).1 With hard currency (mainly USD) corporate
issuance at or near record levels in 2013-14 (Charts 30 and 31), total EM international (hard
currency) debt securities outstanding now total over $1.8 trillion, i.e. one fourth of the total.
Of this, some $520 billion is non-financial corporate, $575 billion is financial corporate, and
about $750 billion is government bonds.
As a result of this rapid growth, outstanding debt of the emerging market non-financial
corporate sector is now over 80% of GDP on average, up from about 60% in 2008; China,
Singapore and Hungary now have corporate debt well over 80% of GDP. A significant part of
this debt has been denominated in foreign currencies, about 25-30% in USD, prompting
concerns about vulnerabilities in many EM countries given recent dollar strength and
widespread anticipation of higher U.S. rates. Many EM firms have “natural hedges,” i.e. dollar
revenue streams, or may have hedged their USD exposure in derivatives markets. However,
those that have limited or no protection against currency risk are likely to face a higher
degree of credit and refinancing risk over the next few years.
Shift towards more bond marketShift towards more bond marketShift towards more bond marketShift towards more bond market----based borrowingbased borrowingbased borrowingbased borrowing
Strong growth in EM bond markets has contributed to a notable shift towards non-financial
corporate financing in most emerging market countries. For example, the share of bond
financing in total non-financial corporate debt financing has increased more than 20
percentage points in Korea and Mexico. Other countries, including Hungary, South Africa,
Indonesia, and Brazil have also witnessed a marked shift towards bond financing (Chart 32).
Chart 29Chart 29Chart 29Chart 29 Chart 30Chart 30Chart 30Chart 30
Our thanks to Elif Aksoy for insights and contributions to this section based on her work on EM corporate debt markets.
1 The BIS statistics by residence of issuer underestimate the size of the EM non-financial corporate sector, as they don’t include issuance via overseas
and offshore subsidiaries—this is particularly true for Brazilian, Chinese and Russian corporates.
0
25
50
75
100
125
2007 2011 2015
Non-fin
Fin
USDUSDUSDUSD Bond IssuanceBond IssuanceBond IssuanceBond Issuance$ billion
Source: Thomson One, IIF.
15
20
25
30
35
40
45
0
100
200
300
400
500
600
700
800
2007 2009 2011 2013 2015ytd
Other foreign currencyEURUSDLocal currencyShare of FC (rhs)
EMEMEMEM Corporates: Bond Issuance, by CurrencyCorporates: Bond Issuance, by CurrencyCorporates: Bond Issuance, by CurrencyCorporates: Bond Issuance, by Currency$ billion
Source: Thomson One, IIF. Data contain financial and non-financial EM30 corporate bond issuances
0 2 4 6
Fin. Corp. LC
Fin. Corp. HC
Non-fin. Corp. HC
Non-fin. Corp. LC
Sov HC
Sov LC
2014
2007
EM Corporate and Sovereign BondEM Corporate and Sovereign BondEM Corporate and Sovereign BondEM Corporate and Sovereign Bond MarketsMarketsMarketsMarkets$ trillion
Source: BIS, IIF.
Chart 31Chart 31Chart 31Chart 31

iif.com © Copyright 2015. The Institute of International Finance, Inc. All rights reserved.
page 16 CAPITAL FLOWS TO EMERGING MARKETS | MAY 28, 2015
While the majority of this bond financing has been in local currency (65-75%) over the past
few years) , the share of the issuance in foreign currency was over 50% in the first five
months of 2015— a fresh record high (Chart 33). While a shift toward more bond market
financing is part of the structural development of EM capital markets—as such a welcome
development—the speed of the increase in non-financial corporate debt in some
emerging markets is a cause for concern.
CrossCrossCrossCross----border bank lending also rose sharply in 2008border bank lending also rose sharply in 2008border bank lending also rose sharply in 2008border bank lending also rose sharply in 2008----13131313
While the focus has been on the rise in bonded debt, growth in cross-border bank lending
to the corporate sector has also been strong in recent years. Indeed, data on BIS-
reporting banks’ international claims on the EM non-bank private sector suggest a
sustained pickup in cross-border bank lending in the aftermath of the 2008 crisis to nearly
$3 trillion in 2014 (Chart 34), driven mainly by non-EU banks—notably, U.S., Japan, and
China. While almost all countries in our sample have increased reliance on cross-border
bank credit, firms in EM Asia and in oil-exporting countries have recorded the largest
buildup in cross-border banking liabilities.
Although some 8-9% of the outstanding stock of international EM loans is denominated in
euro (and would thus be less exposed to a strengthening USD), most of the remainder—
nearly $3 trillion—is USD-denominated.2 While the share of EUR-denominated bank
lending has been broadly stable—and Japanese and Chinese banks are becoming
increasingly important as a source of cross-border credit, primarily in yen and RMB—over
45% of new cross-border lending to EM borrowers was denominated in USD in 2013-14.
A closer look at the USD exposure of EM nonA closer look at the USD exposure of EM nonA closer look at the USD exposure of EM nonA closer look at the USD exposure of EM non----financial firmsfinancial firmsfinancial firmsfinancial firms
To identify specific countries and sectors that would be particularly vulnerable to a
stronger USD and higher U.S. rates, it is worth looking more closely at both the stock of
EM non-financial corporate debt relative to GDP, and at its breakdown by currency and
sector. China is the clearly the elephant in the room—non-financial corporate debt has
grown by more than 50 percentage points since 2008 to around 150% of GDP. However,
Chart 32Chart 32Chart 32Chart 32 Chart 34Chart 34Chart 34Chart 34
2 The series on the currency decomposition of the cross-border bank lending is based on Bloomberg data.
Chart 33Chart 33Chart 33Chart 33
0
10
20
30
40
50
2007 2011 2015
NonNonNonNon----Fin.Fin.Fin.Fin. Corporate Bond Corporate Bond Corporate Bond Corporate Bond Issuance in Foreign Currency Issuance in Foreign Currency Issuance in Foreign Currency Issuance in Foreign Currency percent
Share of USD
Share of EUR
Source: Thomsone One, IIF.
0 10 20 30 40 50
Turkey
Hungary
China
Indonesia
Russia
Brazil
Thailand
South Africa
Korea
Mexico
2014
2008
ShareShareShareShare of Bond Financing for EM Nonof Bond Financing for EM Nonof Bond Financing for EM Nonof Bond Financing for EM Non----financial Corporatesfinancial Corporatesfinancial Corporatesfinancial Corporatespercentage of total debt financing
Source: BIS, IIF.
0.0
0.8
1.6
2.4
3.2
1996 1999 2002 2005 2008 2011 2014
Government
Banks
Nonbank Private Sector
International Claims of BIS reporting Banks in EM30International Claims of BIS reporting Banks in EM30International Claims of BIS reporting Banks in EM30International Claims of BIS reporting Banks in EM30$ trillion
Source: BIS-CBS, IIF.

iif.com © Copyright 2015. The Institute of International Finance, Inc. All rights reserved.
page 17 CAPITAL FLOWS TO EMERGING MARKETS | MAY 28, 2015
other EM countries have also seen a notable increase in non-financial corporate sector
indebtedness, including Turkey, Brazil, and Russia (Charts 35). While a number of
countries, notably Korea, China and Russia, now have less USD exposure relative to GDP
than in 2008 (in some cases due to deliberate efforts to reduce such exposure), for many
EM countries USD exposure continues to be a significant proportion of overall debt
(except in a number of Central and East European countries, where euro-denominated
borrowing has been more prevalent). Across the emerging market countries in our
sample, USD borrowing exposure of the non-financial corporate sector stands at over
10% of GDP on average (Chart 36).3
Which emerging marketsWhich emerging marketsWhich emerging marketsWhich emerging markets————and sectorsand sectorsand sectorsand sectors————are most at risk from USD liabilities?are most at risk from USD liabilities?are most at risk from USD liabilities?are most at risk from USD liabilities?
In an environment of rising global interest rates, Fed tightening, EM currency
depreciation (Chart 37) and slowing economic growth and capital flows, USD-
denominated debt may become increasingly difficult for EM non-financial corporate
borrowers to repay. Some of these firms also suffer from significant reduction in oil and
commodity prices as well as a general slowdown in growth of global trade. Indeed, for
EM-30 countries, maturing USD non-financial corporate bonds and cross-border loans
total around $375 billion for the 2016-18 period (Chart 38)—a period when U.S. rates are
likely to be higher, making roll-over of credits more difficult. Against this backdrop, a key
question is how well EM corporates are hedged against potential currency mismatches
during stress episodes.
To identify vulnerabilities for specific countries and sectors, it is helpful to look both at
the stock of EM non-financial corporate debt relative to GDP, and at its breakdown by
currency and sector. Looking at specific sectors, a key question is to what extent
currency risk may be hedged—either via a natural hedge such as export revenues, or via
derivatives markets. Some corporate borrowers may also maintain significant foreign
currency assets on their balance sheets to offer a degree of protection for FX liabilities.
Chart 35Chart 35Chart 35Chart 35
Chart 38Chart 38Chart 38Chart 38
Chart 37Chart 37Chart 37Chart 37
Chart 36Chart 36Chart 36Chart 36
-10 0 10 20 30 40 50 60
South AfricaKorea
Saudi ArabiaIndia
ThailandMexicoPoland
HungaryCzech Rep.Indonesia
RussiaBrazilTurkeyChina
ChangeChangeChangeChange in EM Nonin EM Nonin EM Nonin EM Non----Financial Corporate DebtFinancial Corporate DebtFinancial Corporate DebtFinancial Corporate Debt----totototo----GDP RatioGDP RatioGDP RatioGDP Ratio
percentage point change since 2008
Source: BIS, IIF.
3 Underlying data in Chart 8 cover international and domestic debt securities as well as domestic and cross-border bank credit provided by the BIS.
Data on currency breakdown is based on IIF estimates.
95
100
105
110
115
120
125
130
135
2013 2014 2015
USD vs DM
USD vs EM
U.S. DollarU.S. DollarU.S. DollarU.S. Dollar
index, end-2012=100
U
USD Appreciates
Source: Bloomberg, IIF.
020406080100120140160
2015 2018 2021
USD Loans
USD Bonds
EMEMEMEM----30303030 USD denominated USD denominated USD denominated USD denominated Debt Maturity ProfileDebt Maturity ProfileDebt Maturity ProfileDebt Maturity Profile$ billions
Source: Bloomberg, IIF.
0 20 40 60 80 100 120 140 160
Indonesia
Mexico
South Africa
Brazil
Turkey
Thailand
Russia
Hungary
Korea
China
LC
USD
Others
EMEMEMEM NonNonNonNon----Financial Corporate Debt in 2014Financial Corporate Debt in 2014Financial Corporate Debt in 2014Financial Corporate Debt in 2014percent of GDP
Source: BIS, IIF estimates.

iif.com © Copyright 2015. The Institute of International Finance, Inc. All rights reserved.
page 18 CAPITAL FLOWS TO EMERGING MARKETS | MAY 28, 2015
Looking across the diverse range of EM countries and taking into account both the level of
corporate external debt and the structure of the economy, the impact of a stronger U.S. dollar is
likely to vary considerably:
■ More protected: More protected: More protected: More protected: commodity producers and exporters of manufactured goods typically have
a natural hedge as their revenues are primarily USD-denominated. Within the internationally
tradable EM corporate bond universe, these sectors (energy and basic metals) account for
around 30% of total outstanding bonds (Chart 39). However, it is important to note that
many such “hedged” EM corporates—oil and commodity producers in particular—have
seen prices of their exports fall substantially over the past year, reducing the value of their
natural hedges.
■ Indirect exposureIndirect exposureIndirect exposureIndirect exposure: Financial corporates are typically adequately hedged against currency
risk via derivatives markets, mainly due to regulatory requirements that limit the extent to
which banks can have currency mismatches. However, as some non-financial corporates are
not hedged against this risk, their FX risk may translate into credit risk for banks at times of
market stress. For example, Turkish banks have relatively small net open foreign currency
positions (around 3% of bank capital). However, the Turkish non-financial corporate sector
has FX liabilities of over $250 billion, and over $140 billion of this accounts for domestic FX
loans.
■ Little direct impactLittle direct impactLittle direct impactLittle direct impact: For others, a rising U.S. dollar may have little impact. Countries with
managed and pegged currencies, like China, Hong Kong and GCC, would be better
protected from higher debt service costs due to currency depreciation (Chart 40), though
rising global rates would affect their refinancing costs. The flip side, however, is that where
a currency peg proves to be unsustainable, corporates may be exposed to a sharp and
unexpected rise in their foreign currency liabilities in local currency terms when its peg
breaks down.
■ Limited vulnerabilityLimited vulnerabilityLimited vulnerabilityLimited vulnerability: Some countries/sectors face fewer risks, either because corporate
USD exposure is modest, and/or because there is some degree of hedging in place.
Although reliable data on hedging activities are limited, corporate sectors in countries such
as Mexico and Korea have relatively better access to more liquid domestic and offshore
markets, which can help in hedging currency mismatches. However, hedging markets in
Chart 39Chart 39Chart 39Chart 39 Chart 40Chart 40Chart 40Chart 40
Others -22.4%
CA Surplus Countries- 25.6%
South Africa, Turkey, Indonesia, India & Brazil -23.2%
Russia -10.4%
China - 10%
Hong Kong -8.5%
EMEMEMEM Corporate Bond Corporate Bond Corporate Bond Corporate Bond ---- Country BreakdownCountry BreakdownCountry BreakdownCountry Breakdown
Source: Market Vectors, IIF.
GCC -12.8%
Financials -40%
Energy - 22%
Utilities -8.3%
Communications - 8.1%
Basic Materials-7.6%
Consumer -6.4% Other -
7.6%
Source: Market Vectors, IIF.
EMEMEMEM Corporate Bond Corporate Bond Corporate Bond Corporate Bond ---- Industry BreakdownIndustry BreakdownIndustry BreakdownIndustry Breakdown
The impact of a The impact of a The impact of a The impact of a stronger U.S. stronger U.S. stronger U.S. stronger U.S. dollar is likely to dollar is likely to dollar is likely to dollar is likely to vary considerably.vary considerably.vary considerably.vary considerably.

iif.com © Copyright 2015. The Institute of International Finance, Inc. All rights reserved.
page 19 CAPITAL FLOWS TO EMERGING MARKETS | MAY 28, 2015
most EMs are not well developed, with high associated costs continuing to
discourage many firms from hedging FX risk. As noted by the BIS, one big issue is
the lack of liquidity in hedging markets, particularly in times of stress. Given that
exposures are typically hedged with more liquid short-term contracts in an attempt
to reduce hedging costs, it becomes harder to roll over these contracts as swap
dealers become less willing to sell protection (as seen during the 2013 taper
tantrum and the oil price shock of H2 2014). In some countries, like Brazil, central
banks with ample reserves may step in to provide currency hedges to corporates at
times of stress. However, the expectation of such behavior can also serve to
discourage development of private hedging markets.
■ Higher riskHigher riskHigher riskHigher risk: Specific sectors in some countries are at higher risk due to high levels of
USD exposure and/or a lack of natural hedges and access to derivatives markets. In
particular, firms in the consumer and real estate sectors with local currency revenues
and FX expenses seem to be more exposed to currency risks. This may pose
particular problems for these sectors in countries with economic/political
vulnerabilities (see pages 10-12).
Against this backdrop, with EM corporate issuers facing a diverse set of risks, careful
attention to credit selection is warranted by investors. While broad valuation measures
(e.g., EMBIG spreads) continue to look attractive relative to those in comparable asset
classes (and relative to their long-run averages), bottom-up analysis of currency and
refinancing risks will be increasingly important in an environment of rising U.S. rates.
One big issue is One big issue is One big issue is One big issue is the lack of the lack of the lack of the lack of liquidity in liquidity in liquidity in liquidity in hedging markets, hedging markets, hedging markets, hedging markets, particularly in particularly in particularly in particularly in times of stress. times of stress. times of stress. times of stress.

iif.com © Copyright 2015. The Institute of International Finance, Inc. All rights reserved.
page 20 CAPITAL FLOWS TO EMERGING MARKETS | MAY 28, 2015
SECONDARY MARKET LIQSECONDARY MARKET LIQSECONDARY MARKET LIQSECONDARY MARKET LIQUIDITY IN EMERGING MARKETSUIDITY IN EMERGING MARKETSUIDITY IN EMERGING MARKETSUIDITY IN EMERGING MARKETS————HOW BAD IS ITHOW BAD IS ITHOW BAD IS ITHOW BAD IS IT? ? ? ?
The landscape of portfolio debt investment in emerging markets has evolved
considerably since the 2008 global crisis. The EM debt universe has more than doubled
from $6.5 trillion in 2007 to $13.5 trillion in 2014, supported by robust appetite for EM
debt securities related to the hunt for yield in a low-rate environment (Chart 41).1 Another
contributing factor has been the rapid pace of market development in recent years,
including development of local currency bond markets and capital markets infrastructure
more broadly. However, this robust expansion has also been associated with new
vulnerabilities, including a rapid rise in non-financial corporate indebtedness (see
previous section) and an increasing concern about the lack of liquidity, as market-making
capacity has not kept pace with growth in market capitalization.
Although secondary bond market liquidity more broadly has been under periodic
scrutiny since the onset of the 2008 crisis, the full extent of liquidity risk in EM bond
markets was not on most radar screens until the 2013 taper tantrum. The sharp
retrenchment in foreign portfolio flows into EM debt markets during the summer of 2013
was associated with a surge in EM asset price volatility and a decline in liquidity (Charts
42 and 43).
Notional trading activity in EM debt markets remains below pre-crisis levels (Chart 43)
and has lagged the growth in market capitalization. Hard currency sovereign bond
turnover ratio has more than halved since the crisis (Chart 45). Moreover, trading
volumes in both local currency and corporate debt markets have failed to keep pace with
the surge in bond issuance in recent years and turnover in these two markets is only
around 50% and 25% of the turnover in hard-currency sovereign bonds, respectively.
Available data suggest that the decline in sovereign turnover ratios has been widespread
across a range of both mature and emerging markets, but has been more pronounced in
emerging markets. Brazil and Hong Kong have recorded the largest drop among the
0
2
4
6
8
10
12
14
1998 2002 2006 2010 2014
Hard Currency Corporate
Local Currency Corporate
Hard Currency Sovereign
Local Currency Sovereign
EmergingEmergingEmergingEmerging Market Debt MarketsMarket Debt MarketsMarket Debt MarketsMarket Debt Markets$ trillion
Source: BIS, IIF.
Chart 41Chart 41Chart 41Chart 41
2
4
6
8
10
12
-2.5
-2.0
-1.5
-1.0
-0.5
0.0
0.5
1.0
1.5
2012 2013 2014 2015
Fund Flows
Volatility of yields*
EM Local Currency Bond Fund Flows EM Local Currency Bond Fund Flows EM Local Currency Bond Fund Flows EM Local Currency Bond Fund Flows $ billion percent, 180-days volatility
Source: Bloomberg, EPFR, IIF; *Volatilty of CEMBI yields
Chart 43Chart 43Chart 43Chart 43
1. Our sample includes Argentina, Brazil, China, Taiwan (China), Chile, Colombia, Croatia, Czech Republic, Hungary, India, Indonesia, Israel,
South Korea, Malaysia, Mexico, Pakistan, Peru, Philippines, Poland, Russia, Saudi Arabia, South Africa, Thailand, and Turkey.
3.5
5.0
6.5
8.0
May 12 Nov 13 May 15
BidBidBidBid----Ask Spreads for EM Ask Spreads for EM Ask Spreads for EM Ask Spreads for EM Local Currency Gov't BondsLocal Currency Gov't BondsLocal Currency Gov't BondsLocal Currency Gov't Bondsbps, 10-yr bonds
Source: Bloomberg, IIF.
Chart 42Chart 42Chart 42Chart 42
1
2
3
4
5
6
7
2002 2006 2010 2014
HC corp. HC gov't.LC bonds
Source: EMTA, IIF.
EEEEM Bond Trading Volumes M Bond Trading Volumes M Bond Trading Volumes M Bond Trading Volumes $ trillion, annual
Chart 44Chart 44Chart 44Chart 44

iif.com © Copyright 2015. The Institute of International Finance, Inc. All rights reserved.
page 21 CAPITAL FLOWS TO EMERGING MARKETS | MAY 28, 2015
MX
BR
JP
HK KR
MY
THID
CN
US IG
US HY
1
2
3
4
5
1 2 3 4 5
Corporate Bonds: Turnover Ratios in 2007 vs 2014Corporate Bonds: Turnover Ratios in 2007 vs 2014Corporate Bonds: Turnover Ratios in 2007 vs 2014Corporate Bonds: Turnover Ratios in 2007 vs 2014log of turnover ratio
Source: FINRA, ABO, BIS, IIF.
2014
2007Lower liquidity
CLCN
HU
IN
ID
KR
ML
PA
PEPH
ZATW
THBR
0
2
4
6
8
10
12
14
0 2 4 6 8 10 12 14
BidBidBidBid----AskAskAskAsk Spreads for EM 10Spreads for EM 10Spreads for EM 10Spreads for EM 10----yr Local Currency Gov't Bondsyr Local Currency Gov't Bondsyr Local Currency Gov't Bondsyr Local Currency Gov't Bondsbasis points
Source: Bloomberg, IIF;
2006/2007average
2013/2015average
Lower liquidity
countries in our sample (Chart 46). Sovereign bond turnover in emerging markets remains
generally lower than in mature markets. Market turnover for corporate bonds has also
fallen in most emerging markets, particularly in China, Brazil and Mexico (Chart 47).
Elevated bid-ask spreads also reveal evidence of reduced liquidity in many EM local
currency government bond markets. Spreads have shown a particular tendency to blow
out during stress episodes like the Euro Area debt crisis of 2011 and the Fed taper
tantrum of 2013. Indonesia, Hungary, Brazil and China have witnessed particularly marked
declines (Chart 48). However, it is important to note that assessing long-term trends in bid
-ask spreads requires careful interpretation. Although they can be useful indicators of
illiquidity, particularly in making cross-sectoral comparisons (Chart 49), bid-ask spreads
typically reflect a downward bias, as they are based on publicly available data for quoted
trades on exchange markets, which are more liquid compared to over-the-counter
trades.2,3
0
20
40
60
80
100
120
140
2000 2002 2004 2006 2008 2010 2012 2014
EmergingEmergingEmergingEmerging Markets: Bond Turnover Markets: Bond Turnover Markets: Bond Turnover Markets: Bond Turnover ratio, quarterly trading volumes over outstanding bonds
Local Currency Bonds
Hard Currency Corporate Bonds
Hard Currency Government Bonds
Source: EMTA, BIS, IIF.
Chart 45Chart 45Chart 45Chart 45
MXBR
JP
HK
KR
MY
PH
SG
TH
US
ID
CN
2
3
4
5
6
7
8
9
2 3 4 5 6 7 8 9
SovereignSovereignSovereignSovereign Bonds: Turnover Ratios in 2007 vs 2014Bonds: Turnover Ratios in 2007 vs 2014Bonds: Turnover Ratios in 2007 vs 2014Bonds: Turnover Ratios in 2007 vs 2014log of turnover ratio
Source: SIFMA, ABO, BIS, IIF.
2007
2014
Lower liquidity
Chart 46Chart 46Chart 46Chart 46
Chart 47Chart 47Chart 47Chart 47 Chart 48Chart 48Chart 48Chart 48
2. Frank J. Fabozzi, “Institutional Investment Management: Equity and Bond Portfolio Strategies and Applications”, August 2009.
3. Bao, J., J. Pan, and J. Wang, “Liquidity of Corporate Bonds,” MIT, March 2008
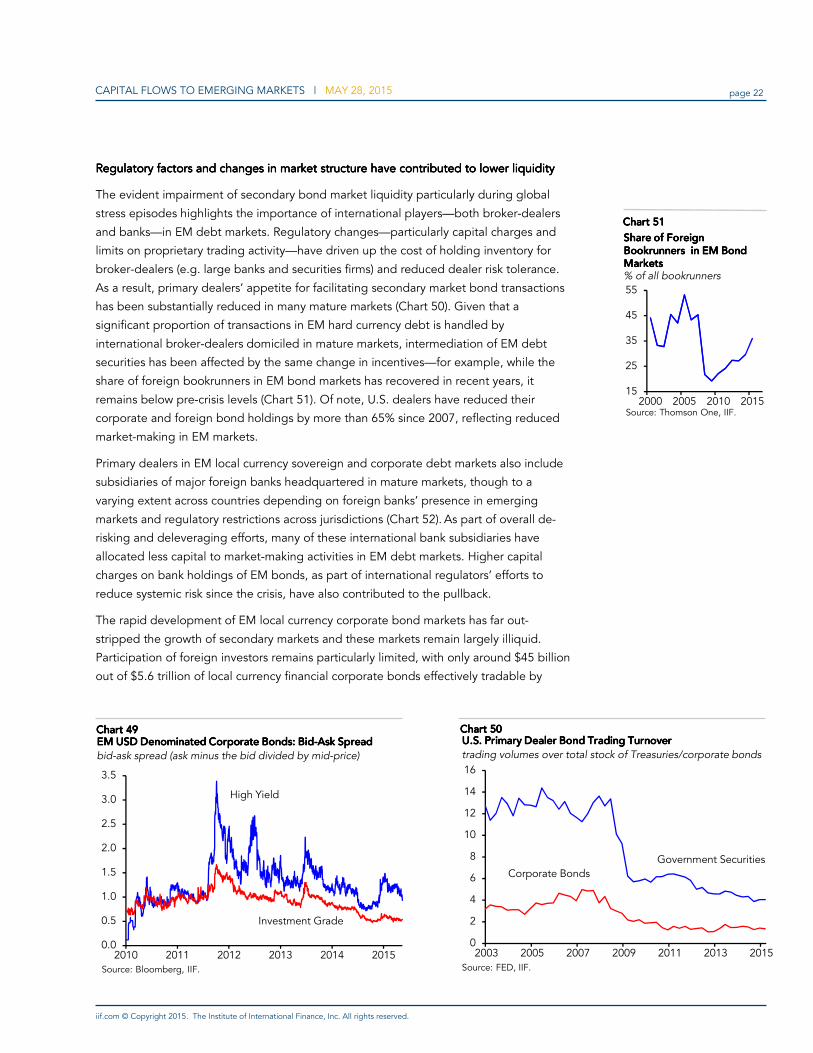
iif.com © Copyright 2015. The Institute of International Finance, Inc. All rights reserved.
page 22 CAPITAL FLOWS TO EMERGING MARKETS | MAY 28, 2015
Regulatory factors and changes in market structure have contributed to lower liquidityRegulatory factors and changes in market structure have contributed to lower liquidityRegulatory factors and changes in market structure have contributed to lower liquidityRegulatory factors and changes in market structure have contributed to lower liquidity
The evident impairment of secondary bond market liquidity particularly during global
stress episodes highlights the importance of international players—both broker-dealers
and banks—in EM debt markets. Regulatory changes—particularly capital charges and
limits on proprietary trading activity—have driven up the cost of holding inventory for
broker-dealers (e.g. large banks and securities firms) and reduced dealer risk tolerance.
As a result, primary dealers’ appetite for facilitating secondary market bond transactions
has been substantially reduced in many mature markets (Chart 50). Given that a
significant proportion of transactions in EM hard currency debt is handled by
international broker-dealers domiciled in mature markets, intermediation of EM debt
securities has been affected by the same change in incentives—for example, while the
share of foreign bookrunners in EM bond markets has recovered in recent years, it
remains below pre-crisis levels (Chart 51). Of note, U.S. dealers have reduced their
corporate and foreign bond holdings by more than 65% since 2007, reflecting reduced
market-making in EM markets.
Primary dealers in EM local currency sovereign and corporate debt markets also include
subsidiaries of major foreign banks headquartered in mature markets, though to a
varying extent across countries depending on foreign banks’ presence in emerging
markets and regulatory restrictions across jurisdictions (Chart 52). As part of overall de-
risking and deleveraging efforts, many of these international bank subsidiaries have
allocated less capital to market-making activities in EM debt markets. Higher capital
charges on bank holdings of EM bonds, as part of international regulators’ efforts to
reduce systemic risk since the crisis, have also contributed to the pullback.
The rapid development of EM local currency corporate bond markets has far out-
stripped the growth of secondary markets and these markets remain largely illiquid.
Participation of foreign investors remains particularly limited, with only around $45 billion
out of $5.6 trillion of local currency financial corporate bonds effectively tradable by
0
2
4
6
8
10
12
14
16
2003 2005 2007 2009 2011 2013 2015
U.S. PrimaryU.S. PrimaryU.S. PrimaryU.S. Primary Dealer Bond Trading TurnoverDealer Bond Trading TurnoverDealer Bond Trading TurnoverDealer Bond Trading Turnovertrading volumes over total stock of Treasuries/corporate bonds
Corporate BondsGovernment Securities
Source: FED, IIF.
Chart 49Chart 49Chart 49Chart 49 Chart 50Chart 50Chart 50Chart 50
0.0
0.5
1.0
1.5
2.0
2.5
3.0
3.5
2010 2011 2012 2013 2014 2015
EM USDEM USDEM USDEM USD Denominated Denominated Denominated Denominated Corporate Bonds: BidCorporate Bonds: BidCorporate Bonds: BidCorporate Bonds: Bid----AskAskAskAsk SpreadSpreadSpreadSpreadbid-ask spread (ask minus the bid divided by mid-price)
Investment Grade
High Yield
Source: Bloomberg, IIF.
15
25
35
45
55
2000 2005 2010 2015
Share of Share of Share of Share of Foreign Foreign Foreign Foreign Bookrunners in EM Bond Bookrunners in EM Bond Bookrunners in EM Bond Bookrunners in EM Bond Markets Markets Markets Markets % of all bookrunners
Source: Thomson One, IIF.
Chart 51Chart 51Chart 51Chart 51

iif.com © Copyright 2015. The Institute of International Finance, Inc. All rights reserved.
page 23 CAPITAL FLOWS TO EMERGING MARKETS | MAY 28, 2015
global investors—in part reflecting the lack of global benchmark indices for EM local
currency corporate bonds.4
All that said, the decline of EM secondary market liquidity should not be solely
attributed to regulatory changes. Indeed, lower liquidity (e.g. a reduction in trading
volumes) has also been a feature of EM equity markets, due in part to the decline in
investor interest in this asset class in the weak-growth environment of recent years (Chart
53). Other structural changes on the investor side have also contributed to the reduction
in secondary market liquidity. For example, institutional investors with long-term
investment horizons in emerging markets, such as pension funds and insurance
companies, are becoming increasingly important holders of EM bonds. Notably, such
investors tend to adopt a buy-and-hold-strategy, and the current low-rate environment
has prompted many to allocate more resources to fixed income securities. Taken
together, these changes have fed into a bigger concentration in ownership of EM bonds
over the past few years, which in turn has led to a further reduction in turnover. In
addition, the majority of EM domestic banks still hold a significant proportion of their
sovereign (and particularly corporate) bond holdings until maturity, putting further
downward pressure on turnover ratios. While a greater concentration of buy-and-hold
investors also means less demand for liquidity (as such investors tend not to sell during
stress episodes), less turnover nonetheless represents a structural reduction in secondary
market liquidity.
To what extent do mutual funds and ETFs enhance liquidity in emerging markets?To what extent do mutual funds and ETFs enhance liquidity in emerging markets?To what extent do mutual funds and ETFs enhance liquidity in emerging markets?To what extent do mutual funds and ETFs enhance liquidity in emerging markets?
With increasingly limited liquidity and significant transaction costs in emerging market
securities, retail and to a lesser degree institutional investors have increasingly turned to
non-dealer, non-bank entities as intermediaries in EM bond markets over the past
several years. The rise in the use of mutual funds and ETFs in cross-border EM portfolio
0
1
2
3
4
5
0.4
0.5
0.6
0.7
0.8
0.9
1.0
2005 2007 2009 2011 2013 2015
EMs (excl. China)
China (rhs)
EquityEquityEquityEquity Market TurnoverMarket TurnoverMarket TurnoverMarket Turnovermultiples of market cap, annualized (both scales)
Source: World Federation of Exchanges, IIF.
0
10
20
30
40
50
60
70
80
90Share of Foreign Banks in Total BankingSystem, by Asset Size# of Foreign Banks (%)
ForeignForeignForeignForeign Bank Presence in Emerging MarketsBank Presence in Emerging MarketsBank Presence in Emerging MarketsBank Presence in Emerging Marketspercent
Source: Bankscope, IIF.
Chart 52Chart 52Chart 52Chart 52 Chart 53Chart 53Chart 53Chart 53
4 Of the $13.5 trillion EM debt universe, only around $2.9 trillion is directly accessible to global investors as
bulk of the outstanding bonds are either hold by domestic institutional investors or cannot be traded
outside the local markets amid regulatory restrictions, particularly in China and India.
The decline of EM The decline of EM The decline of EM The decline of EM secondary market secondary market secondary market secondary market liquidity should liquidity should liquidity should liquidity should not be solely not be solely not be solely not be solely attributed to attributed to attributed to attributed to regulatory regulatory regulatory regulatory changes. changes. changes. changes.

iif.com © Copyright 2015. The Institute of International Finance, Inc. All rights reserved.
page 24 CAPITAL FLOWS TO EMERGING MARKETS | MAY 28, 2015
investment has been particularly striking, with funds investors’ allocations to EM fixed
income securities almost doubling between 2008 and 2013. Fund investors’ EM bond
and equity allocations comprise around 25% and 50% of the total outstanding cross-
border bond and equity investment in emerging markets, respectively (Charts 54 and
55). Notably, the marked increase in the EM allocations of open-ended funds (Chart 56),
which provide at least the appearance of liquidity by allowing investors to add or
redeem investment at any time, has been the main factor behind this rapid growth. As
such funds, particularly ETFs, appear to offer more liquidity than the cash market for
their underlying securities, they have been very attractive for both retail and institutional
investors planning to expand their exposure to less-liquid markets, such as emerging
market bonds and high-yield corporate bonds.5
Although open-ended funds have often been successful in providing market liquidity
since the 2008 crisis, secondary market turnover has as a consequence become
increasingly dependent on the portfolio allocation decisions of fund investors,
particularly during stress episodes. As investors in open-ended funds have the right to
redeem their shares on demand, and with “herding” behavior among such funds on the
rise,6 large redemptions during stress episodes could require open-ended funds—
particularly those with limited cash buffers—to sell underlying assets very quickly. Given
the limited liquidity of the underlying assets, large-scale sales during stress episodes
could have a significant impact on market liquidity and asset prices—in a manner
reminiscent of the 2013 taper tantrum (Charts 43, 56 and 57).
Chart 56Chart 56Chart 56Chart 56
-5
0
5
10
15
20
2011 2013 2015
ETFs: EM USD Bonds ETFs: EM USD Bonds ETFs: EM USD Bonds ETFs: EM USD Bonds bid-ask spread (ask minus bid price over mid-price)
Source: Bloomberg, IIF; ishares J.P. Morgan,USD EM Bond fund
Chart 57Chart 57Chart 57Chart 57
5 Institutional investors comprise around 99% of EM bond allocations of ETFs, while they account for
around 45% of EM bond allocations of open-end mutual funds.
6 As noted by the IMF and the BIS, fund managers tend to shift their asset allocations in a correlated
manner as their investment strategies are largely concentrated on benchmarks. Indeed, herding has been
on the rise since the 2008 crisis, with more pronounced herd behavior in less liquid markets such as EM
bond and equity markets. Notably, retail investors exhibit a slightly higher herding tendency compared to
institutional investors, though the persistent rise in herding has been a common practice regardless of the
investor type since the crisis.
0.0
0.4
0.8
1.2
1.6
0
5
10
15
20
25
2007 2010 2013
CrossCrossCrossCross----Border Investment in Border Investment in Border Investment in Border Investment in EM Bonds via FundsEM Bonds via FundsEM Bonds via FundsEM Bonds via Funds% of total nonresidential invest. in EM bonds, 2007-2013
ETFs
Mutual Funds
Source: CPIS, EPFR, IIF.
3
5
7
9
11
252729313335373941
2007 2010 2013
ETFs
Mutual funds
Source: CPIS, EPFR, IIF.
CrossCrossCrossCross----Border Investment in Border Investment in Border Investment in Border Investment in EM Equities via FundsEM Equities via FundsEM Equities via FundsEM Equities via Funds% of total nonresidential invest. in EM equities, 2007-2013
Chart 55Chart 55Chart 55Chart 55
Chart 54Chart 54Chart 54Chart 54
0
2
4
6
8
10
12
14
2008 2009 2010 2011 2012 2013 2014 2015
EmergingEmergingEmergingEmerging Market Bonds: Fund Portfolio WeightsMarket Bonds: Fund Portfolio WeightsMarket Bonds: Fund Portfolio WeightsMarket Bonds: Fund Portfolio Weightspercent, valuation adjusted series
Open-end Mutual Funds
Source: IIF, EPFR.
ETFs
Close-end Mutual Funds
iif.com © Copyright 2015. The Institute of International Finance, Inc. All rights reserved.
page 25 CAPITAL FLOWS TO EMERGING MARKETS | MAY 28, 2015
EMERGING ASIA: LIVING WITH VOLATILITYEMERGING ASIA: LIVING WITH VOLATILITYEMERGING ASIA: LIVING WITH VOLATILITYEMERGING ASIA: LIVING WITH VOLATILITY
We project aggregate non-resident private capital flows to Emerging Asia in 2015 to fall
well below 2014 levels and the 2013 high before some recovery in 2016 (Chart 58). A
large share of the projected reduction in 2015 reflects weaker capital flows to China due
to changing exchange rate dynamics and the impact on corporate behavior. Flows to EM
Asia outside China are likely to be restrained in advance of the Fed liftoff. However,
despite the uncertainty, the region should continue to benefit from still outperforming
growth along with commitment to macroeconomic stability and gradual reforms. In
particular, policy stimulus to prop up growth and continuing reforms in China, improving
fundamentals in India, and more focus on macrostabilization and structural challenges in
Indonesia, the three leading regional destinations, should provide support to inflows.
In China, the year got off to a very weak start as Chinese corporations sought to reduce
dollar exposure in the face of dollar strength, monetary policy easing, and more two-way
movement in the RMB. This led to both a decline in non-resident inflows and rising
resident outflows, implying a significant loss in international reserves in Q1 (Chart 59). We
expect an improving trend for the remainder of 2015 and into 2016. Non-resident inflows
should be supported by signs of an economic turnaround as stimulus measures take
effect, by interest in the booming stock market, and by further steps to reduce barriers to
fixed–income and equity inflows.
In late March, central bank governor Zhou set the stage by calling for a "basically open
capital account" by the end of 2015, partly with an eye to the inclusion of the RMB in the
SDR basket in the IMF review later this year. We expect further substantive liberalization
of the regimes controlling both inflows and outflows, although not a full dismantling of
quotas or “big bang” liberalization, with reforms focusing more on opening up to non-
resident inflows in order to avoid weakening the balance of payments position. Overall,
we expect a return to small reserve accumulation, supported by the trade surplus as well
as net capital inflows later in 2015 and into 2016.
Outside China, portfolio capital flows to the region were quite sizeable early this year -
supported by indications that Fed tightening would be delayed and follow a gradual
Bejoy Das Gupta
Chief Economist Asia/Pacific 1-202-857-3649 [email protected]
0
1
2
3
4
5
6
7
-200
-100
0
100
200
300
400
500
600
700
800
2008 2009 2010 2011 2012 2013 2014 2015 2016
Nonbank Bank Lending
Inward Portfolio Equity Inward Direct Equity
Net Private Capital Inflows to Emerging AsiaNet Private Capital Inflows to Emerging AsiaNet Private Capital Inflows to Emerging AsiaNet Private Capital Inflows to Emerging Asia$ billion percent of GDP
Source: IIF.
% of GDPIIF Forecast
Chart 58Chart 58Chart 58Chart 58
-300-250-200-150-100-50050100150200
2013 2014 2015
Other Inflows Other OutflowsPortfolio Debt Inflows Portfolio Debt OutflowsPortfolio Equity Inflows Portfolio Equity OutflowsFDI ODIReserves (- = increase) Current Account Balance
China: Capital Flows and Current AccountChina: Capital Flows and Current AccountChina: Capital Flows and Current AccountChina: Capital Flows and Current Account BalanceBalanceBalanceBalance$ billion
Source: SAFE, IIF.
IIF Forecast
Chart 59Chart 59Chart 59Chart 59
Aggregate private Aggregate private Aggregate private Aggregate private capital inflows to capital inflows to capital inflows to capital inflows to Emerging Asia will Emerging Asia will Emerging Asia will Emerging Asia will fall in 2015 to fall in 2015 to fall in 2015 to fall in 2015 to below the 2013 below the 2013 below the 2013 below the 2013 high before some high before some high before some high before some recovery in 2016recovery in 2016recovery in 2016recovery in 2016
iif.com © Copyright 2015. The Institute of International Finance, Inc. All rights reserved.
page 26 CAPITAL FLOWS TO EMERGING MARKETS | MAY 28, 2015
path - but dropped in May (Chart 60). External bond issuance remained large as issuers
took advantage of low yields and ample demand in advance of Fed policy tightening
(Chart 61). The outlook is for flows to remain at moderate levels, with continuing
volatility related to shifting expectations about Fed liftoff.
Countries with large foreign holdings of domestic bonds such as Malaysia and Indonesia
are likely to be particularly affected by shifts in market views about the Fed (Chart 62).
Malaysia has become more vulnerable because, as an oil and gas exporter, it has lost
the cushion of its previously large current account surplus. In Indonesia, the sizeable
external financing requirement means that the central bank has to keep monetary policy
tight, despite a soft economy. The new Jokowi government still has work to do to
navigate political challenges to improve the business climate and tackle infrastructure
bottlenecks. A sharper-than-expected slowdown in China could also negatively impact
growth and flows in the region, including export-dependent Korea. Growth in a number
of countries in the region, including Thailand, Korea and Indonesia, is also dependent
on the advancing of planned fiscal stimulus, in the absence of which FDI and portfolio
equity inflows could be impacted.
In India, after a tantrum-related dip in 2013, private capital inflows rose sharply in the
run up to and following the election of Prime Minister Modi last May, bolstered by rising
expectations of reforms to strengthen the economy’s foundations. In practice, reforms
have been incremental but still helpful to encourage inflows. In particular, FDI is being
spurred by the raising of ownership limits for insurance, defense, pensions and opening
up of railways projects along with the stepped-up focus on cutting red tape and tax
reform. While there was a pullback in portfolio equity inflows recently following the
minimum alternative tax (MAT) being applied to pre-April 2015 capital gains of foreign
portfolio investors from non-treaty countries, this should prove temporary as the
government intends to resolve the issue soon. Limits on foreign holdings of domestic
bonds and maturing of Non-resident Indian (NRI) deposits could dampen net inflows,
although India should be better placed to weather a broader EM stress episode when
the Fed starts to raise rates than at the time of the 2013 tantrum because of improved
macro management, reduced external financing needs and better reform prospects.
-30
-20
-10
0
10
20
2013 2014 2015
Equity Debt Total
Portfolio Flows to EMPortfolio Flows to EMPortfolio Flows to EMPortfolio Flows to EM AsiaAsiaAsiaAsia$ billion
Source: National Sources, IIF. Includes India, Indonesia, Malaysia, Philippines, South Korea, and Thailand. *Through May 22, 2015. **Debt flows in May only include India, Indonesia, and Thailand.
Chart 60Chart 60Chart 60Chart 60
0 10 20 30 40 50
China*
India
Thailand
Korea
Indonesia
Malaysia
Local CurrencyGovernment BondsEquity
Foreign Holdings ofForeign Holdings ofForeign Holdings ofForeign Holdings of Domestic Domestic Domestic Domestic SecuritiesSecuritiesSecuritiesSecuritiespercent of total
Source: National Sources, CEIC, IIF. *Includes gov't and corporate bonds.
Chart 62Chart 62Chart 62Chart 62
0
5
10
15
20
25
30
2013 2014 2015
EMEMEMEM Asia: External Bond Asia: External Bond Asia: External Bond Asia: External Bond IssuanceIssuanceIssuanceIssuance$ billion
Source: ThomsonOne. *15Q2 through May 14.
Chart 61Chart 61Chart 61Chart 61
Countries with Countries with Countries with Countries with large foreign large foreign large foreign large foreign holdings of holdings of holdings of holdings of domestic bonds domestic bonds domestic bonds domestic bonds will be most will be most will be most will be most affected by shifts affected by shifts affected by shifts affected by shifts in market views in market views in market views in market views about the Fedabout the Fedabout the Fedabout the Fed
A sharperA sharperA sharperA sharper----thanthanthanthan----expected expected expected expected slowdown in China slowdown in China slowdown in China slowdown in China could negatively could negatively could negatively could negatively impact growth and impact growth and impact growth and impact growth and flows in the regionflows in the regionflows in the regionflows in the region

iif.com © Copyright 2015. The Institute of International Finance, Inc. All rights reserved.
page 27 CAPITAL FLOWS TO EMERGING MARKETS | MAY 28, 2015
EMERGING EUROPE: POLITICS STILL THE KEYEMERGING EUROPE: POLITICS STILL THE KEYEMERGING EUROPE: POLITICS STILL THE KEYEMERGING EUROPE: POLITICS STILL THE KEY
Nonresident capital inflows to Emerging Europe have reversed sharply since the middle
of 2014, mainly driven by sizable outflows from Russia. These outflows cut the full year
inflows of foreign capital to Emerging Europe to $40 billion in 2014 from $213 billion in
2013. Outflows continued in the first quarter of 2015. However, foreign capital inflows
are expected to return in the second half of 2015 assuming that the Russia/Ukraine con-
flict stabilizes and the Fed lift off is gradual. This should give rise to a moderate increase
in foreign capital inflows on an annual basis in 2015 relative to 2014 before moving up
more strongly in 2016.
Foreign capital outflows from Russia accelerated to $31 billion during January-March
2015, from $24 billion a quarter during the second half of 2014 (Chart 63). The accelera-
tion was centered in portfolio equity and bank-related outflows, although Russian compa-
nies were able to step up their Eurobond issuances during the first quarter as some re-
covery in oil prices helped to stabilize economic conditions. This boosted international
bond issuance in the region to $19 billion during January-March from $7 billion a quarter
during June-December 2014 (Chart 64). Foreign holdings of local currency government
bonds, meanwhile, fell in Turkey, Hungary and Russia during the first quarter of 2015
(Chart 65). Given the importance of portfolio capital inflows to finance Turkey’s still siza-
ble current account deficit, intensified concerns about the Turkish central bank’s ability to
resist pressures from the government to ease monetary policy led foreign investors to
reduce their exposure to Turkey in early 2015.
Outside Russia, bank related credits have benefited from the ECB’s QE since January.
This helped banks in Emerging Europe access foreign funding more easily, especially
those in countries where credit demand remained strong, such as Turkey. Banks in Tur-
key increased their net foreign borrowing to $10 billion during the first quarter of 2015
from $8 billion a quarter during the second half of 2014. With credit demand remaining
weak and current accounts in surplus, banks in most of CEE as well as Russia continued
to make net foreign bank credit repayments during January-March 2015.
-150
-100
-50
0
50
100 Resident
Foreign
2011 2012 2013 2014Source: Bank of Russia.
Russia: CapitalRussia: CapitalRussia: CapitalRussia: Capital FlowsFlowsFlowsFlows$ billion
Source: Bank of Russia, IIF.
Net Capital
Chart 63Chart 63Chart 63Chart 63
0
5
10
15
20
25
14Q1 14Q2 14Q3 14Q4 15Q1
CEE
Russia
Turkey
EmergingEmergingEmergingEmerging Europe: Eurobond Issuance, GrossEurope: Eurobond Issuance, GrossEurope: Eurobond Issuance, GrossEurope: Eurobond Issuance, Gross$ billion
Source: IIF.
Chart 64Chart 64Chart 64Chart 64
Ugras Ulku Senior Economist Emerging Europe 1-202-857-3617 [email protected]
Nonresident Nonresident Nonresident Nonresident capital inflows to capital inflows to capital inflows to capital inflows to Emerging Europe Emerging Europe Emerging Europe Emerging Europe have reversed have reversed have reversed have reversed sharply since the sharply since the sharply since the sharply since the middle of 2014middle of 2014middle of 2014middle of 2014
Bank related Bank related Bank related Bank related credits have credits have credits have credits have benefited from the benefited from the benefited from the benefited from the ECB’s QE since ECB’s QE since ECB’s QE since ECB’s QE since JanuaryJanuaryJanuaryJanuary

iif.com © Copyright 2015. The Institute of International Finance, Inc. All rights reserved.
page 28 CAPITAL FLOWS TO EMERGING MARKETS | MAY 28, 2015
After taking out roughly $130 billion in 2014, residents in Russia repatriated a moderate
$2.8 billion during January-March 2015 as confidence in local stability improved. As a
result, resident outflows from Emerging Europe slowed to $20 billion in the first quarter
from $66 billion in the last quarter of 2014 ($60 billion of which was from Russia). Capital
outflows from Russia, both foreign and resident, brought the ruble under extreme de-
preciation pressures in 2014, prompting the Russian central bank to intervene heavily.
This was the main reason that Emerging Europe’s FX reserves fell by a cumulative
$108 billion last year. Foreign exchange reserves declined further in the first quarter of
2015 by a cumulative $9 billion, again mainly driven by Russia.
Net inflows of nonresident capital to the region are projected to increase from
$40 billion last year to $86 billion this year as a whole and further to $131 billion in 2016
(Chart 66). Assuming no escalation of the Russia-Ukraine conflict, private foreign capital
outflows look likely to continue at a moderate pace from both countries during the re-
mainder of 2015. The rest of the region should benefit from rising inflows, provided that
the Fed rate hikes occur at a gradual pace and that the ECB’s QE ensures continued
easy funding conditions (even in the event of a Greek exit from the euro). After the June
parliamentary elections in Turkey, political uncertainty should dissipate, leading to a
pick-up in foreign capital inflows to Turkey during the second half of 2015 assuming that
key figures in Turkey’s economic team remain in office. Ukraine, meanwhile, will remain
shut off from private markets as it goes through a restructuring of private debt in the
context of its IMF program.
Downside risks to foreign capital inflows remain substantial, especially if the Fed’s tight-
ening leads to a broad selloff of emerging market assets or if the Russian-Ukraine con-
flict escalates. If Greece exits the euro, the resulting uncertainty might prompt some
investors to sell at least part of their assets in neighboring countries. Moreover, a signifi-
cant loss of confidence in Turkey’s economic management after the June elections
could also prompt foreign investors to reduce their exposure to Turkish assets.
-15
-10
-5
0
5
10
15
14Q1 14Q2 14Q3 14Q4 15Q1
Russia Hungary
Poland Turkey
Czech Republic
EmergingEmergingEmergingEmerging Europe: Net Foreign Purchases of Local Currency Europe: Net Foreign Purchases of Local Currency Europe: Net Foreign Purchases of Local Currency Europe: Net Foreign Purchases of Local Currency Denominated Government BondsDenominated Government BondsDenominated Government BondsDenominated Government Bonds$ billion
Source: IIF.
Chart 65Chart 65Chart 65Chart 65
-50
0
50
100
150
200
250
300
2011 2012 2013 2014 2015 2016
Nonbanks Debt FDI
Bank Lending Portfolio Equity
EmergingEmergingEmergingEmerging Europe: Foreign Private Capital InflowsEurope: Foreign Private Capital InflowsEurope: Foreign Private Capital InflowsEurope: Foreign Private Capital Inflows$ billion
Source: IIF.
Total
IIF Forecast
Chart 66Chart 66Chart 66Chart 66
Downside risks to Downside risks to Downside risks to Downside risks to foreign capital foreign capital foreign capital foreign capital inflows remain inflows remain inflows remain inflows remain substantialsubstantialsubstantialsubstantial
Resident outflows Resident outflows Resident outflows Resident outflows from Emerging from Emerging from Emerging from Emerging Europe slowed in Europe slowed in Europe slowed in Europe slowed in the first quarter the first quarter the first quarter the first quarter
iif.com © Copyright 2015. The Institute of International Finance, Inc. All rights reserved.
page 29 CAPITAL FLOWS TO EMERGING MARKETS | MAY 28, 2015
LATIN AMERICA: STILL IN THE GAMELATIN AMERICA: STILL IN THE GAMELATIN AMERICA: STILL IN THE GAMELATIN AMERICA: STILL IN THE GAME
Private capital inflows to the region have revived somewhat in the first months of the
year, helped by receding market fears of further depreciation of local currencies and indi-
cations that Fed liftoff would be at a gradual pace. Nonetheless, we still forecast private
capital inflows to Latin America to decline this year vis-à-vis 2014 due to the impending
monetary tightening by the Fed and sluggish economic growth. Private capital inflows
should gain strength next year as macroeconomic fundamentals and growth prospects in
the region’s largest economies improve (Chart 67). In Brazil, the ongoing policy adjust-
ment should create the conditions for some growth recovery; in Mexico, the economy
should benefit from solid U.S. growth and reform implementation; and in Argentina, a
new, more pragmatic administration, post presidential elections in October, is widely
expected to resolve the holdout creditors issue, thereby re-opening the country to global
financial markets.
Foreign purchases of local currency securities resumed in early 2015 (Chart 68). This
largely reflects a turnaround in flows to Brazil as the central bank has progressively tight-
ened monetary policy and fiscal policy has been put on a consolidation path. Inflows for
the purchase of local currency securities have also been resilient in Colombia and Peru,
although Mexico has seen outflows in recent months, mainly in short term instruments,
reflecting heightened FX volatility and a portfolio rebalancing towards higher yielding
assets.
Portfolio equity inflows to the region rebounded in the first part of this year following
outflows at the end of 2014 (Charts 69 and 70). Inflows are being spurred by idiosyncratic
factors, strategic market positioning, and greater exchange rate stability. In Brazil, a ma-
jor factor boosting the stock market was the release of Petrobras’ 2014 audited financial
statements, whose delay had contributed to increasing uncertainty about growth pro-
spects (Chart 71). Mexico has also attracted portfolio equity as investors positioned
themselves for stronger growth in the second half of the year and in 2016 amid increased
Chart 67Chart 67Chart 67Chart 67
-10-8-6-4-20246810121416
Mar 14 Jun 14 Sep 14 Dec 14 Mar 15
PeruColombiaMexicoBrazil
Latin America: Inflows intoLatin America: Inflows intoLatin America: Inflows intoLatin America: Inflows into Local Sovereign Debt MarketsLocal Sovereign Debt MarketsLocal Sovereign Debt MarketsLocal Sovereign Debt Markets$ billion
Source: IIF based on national sources
Chart 68Chart 68Chart 68Chart 68
Ramón Aracena Chief Economist Latin America 1-202-857-3630 [email protected]
Private capital Private capital Private capital Private capital inflows to the inflows to the inflows to the inflows to the region have region have region have region have revived somewhat revived somewhat revived somewhat revived somewhat in the first months in the first months in the first months in the first months of the yearof the yearof the yearof the year
-1
0
1
2
3
4
5
6
7
8
2007 2008 2009 2010 2011 2012 2013 2014 2015 2016
Non Bank DebtBank LendingPortfolio EquityFDI
Latin America:Latin America:Latin America:Latin America: Foreign Private Capital Inflows Foreign Private Capital Inflows Foreign Private Capital Inflows Foreign Private Capital Inflows percent of GDP
Source: IIF.
IIF Forecast

iif.com © Copyright 2015. The Institute of International Finance, Inc. All rights reserved.
page 30 CAPITAL FLOWS TO EMERGING MARKETS | MAY 28, 2015
reform-related opportunities in key sectors of the economy. By contrast in Chile, debt
inflows have dominated as banks and corporates pre-finance themselves in anticipation
of higher external borrowing costs.
Even Argentina has raised private FX financing despite its noncompliance with the NY
district court ruling on holdout creditors. In April, the government issued, under domestic
law, a dollar bond for $1.4 billion in the local market (Bonar 2024), which reportedly, has
been sold overseas. Further FX debt issues, even under local law, however, run the risk of
legal action as the Republic is already in contempt of court. Also in April, the state oil
company, YPF, raised $1.5 billion abroad. We expect private capital inflows to Argentina
to revive next year assuming that whoever wins the presidency this year will quickly reach
an agreement with holdout creditors in order to normalize access to global capital mar-
kets and restart growth.
Reluctant to implement the policy shift needed to adjust the economy to lower oil reve-
nues, Venezuela has resorted to multiple channels to maximize external borrowing. Dur-
ing the first four months of the year, the Republic secured a $5 billion loan from China;
issued $2.8 billion in bonds through Citgo (PDVSA’s refining unit in the U.S.), settled Pet-
roCaribe debt with the Dominican Republic ($1.9 billion), and entered into a $1.0 billion
cash-for-gold swap with Citibank. However, deepening policy imbalances and sizable
external debt service coming due have intensified pressure on international reserves and
failed to dispel the specter of default. With financing options rapidly narrowing and no
signs of a coherent policy adjustment in sight, we expect reserves to continue to decline
this year and next, thereby, raising the risk of a default on external obligations.
Despite improved prospects for 2016, the region remains vulnerable to heightened finan-
cial volatility. If this were to happen, we expect across-the-board currency depreciation
and slower growth recovery momentum, taking a toll on our envisaged outlook for capi-
tal flows.
-15
-10
-5
0
5
10
15
20
Dec 14 Jan 15 Feb 15 Mar 15 Apr 15
Brazil
Colombia
Chile
Mexico
LatinLatinLatinLatin America: America: America: America: Stock Market ReturnsStock Market ReturnsStock Market ReturnsStock Market Returns in $ terms in $ terms in $ terms in $ terms percent m/m, $ terms
Source: Bloomberg.
Chart 69Chart 69Chart 69Chart 69
-3
-1
1
3
5
7
9
Mar 14 Jun 14 Sep 14 Dec 14 Mar 15
Chile
Brazil
Mexico
Latin America: PortfolioLatin America: PortfolioLatin America: PortfolioLatin America: Portfolio Equity Inflows Equity Inflows Equity Inflows Equity Inflows $ billion
Source: IIF based on National Sources.
Chart 70Chart 70Chart 70Chart 70
1.5
2.0
2.5
3.0
3.5
2013 2014 2015
Chart XChart XChart XChart XBrazil: Exchange RateBrazil: Exchange RateBrazil: Exchange RateBrazil: Exchange Ratereais per $
We expect private We expect private We expect private We expect private capital inflows to capital inflows to capital inflows to capital inflows to Argentina to Argentina to Argentina to Argentina to reviverevivereviverevive next year next year next year next year
Chart 71Chart 71Chart 71Chart 71

iif.com © Copyright 2015. The Institute of International Finance, Inc. All rights reserved.
page 31 CAPITAL FLOWS TO EMERGING MARKETS | MAY 28, 2015
MENA: DIGESTING LOWER OIL PRICESMENA: DIGESTING LOWER OIL PRICESMENA: DIGESTING LOWER OIL PRICESMENA: DIGESTING LOWER OIL PRICES
Capital inflows to our selected five MENA countries (the UAE, Saudi Arabia, Egypt,
Morocco, and Lebanon) are projected to increase slightly to $70.8 billion in 2015 driven
by an increase in FDI and official loans in Egypt and a significant increase in portfolio
investment in Saudi Arabia. The largest component of private inflows remains FDI, which
accounts for more than half of the total (Chart 72).
Private capital flows to the UAE remains the highest among MENA counties. The Emir-
ates has been the beneficiary of private capital flows from other MENA countries follow-
ing the political unrest in the Arab world since 2011. FDI more than doubled to $14.5
billion and portfolio flows have increased five-fold from 2011 to 2014. Capital flows to
domestic banks have also risen sharply. However, the strong U.S. dollar has made the
real estate market more expensive for foreign investors and may adversely affect FDI.
In Saudi Arabia, a relatively closed market is being opened up in June, as foreigners will
be allowed to buy shares listed on the Tadawul stockmarket (see Saudi Arabia: Opening
Capital Markets to Foreign Investment, May 2015). This could boost foreign portfolio
inflows in the second half of this year and in 2016 (Chart 73).
In Egypt, private inflows revived in 2014 on the back of greater political stability, and are
expected to rise further in 2015. Efforts are under way to tackle the regulatory and bu-
reaucratic obstacles that stand in the way of investors. Encouraged by the political stabil-
ity and improvements in the business environment, investors and governments from
around the globe have recently pledged to invest around $30 billion in Egypt over the
next four years. Inflows will be supported by the recent $6 billion deposit at the Central
Bank of Egypt from Saudi Arabia, the UAE and Kuwait which will help to boost official
reserves (Chart 74).
In Morocco, the capital and financial accounts are expected to improve further,
particularly FDI, as political and social stability and improvement in the business environ-
ment make Morocco an attractive destination.
Garbis Iradian Chief Economist Middle East and North Africa 1-202-857-3304 [email protected]
03691215182124273033
2014
2015
2016
2014
2015
2016
2014
2015
2016
2014
2015
2016
2014
2015
2016
Private Creditors
Portfolio Investment
Direct Investment
Private Inflows to Selected MENA EconomiesPrivate Inflows to Selected MENA EconomiesPrivate Inflows to Selected MENA EconomiesPrivate Inflows to Selected MENA Economies$ billion
U.A.E. Saudi A. Egypt Morocco Lebanon
Source: IIF.
Chart 73Chart 73Chart 73Chart 73
-2
0
2
4
6
8
10
12
14
2010 2011 2012 2013 2014 2015 2016
Private Flows
Official flows, net
Egypt: Net Private and Official FlowsEgypt: Net Private and Official FlowsEgypt: Net Private and Official FlowsEgypt: Net Private and Official Flows$ billion
Source: Central Bank of Egypt and IIF Forecast for 2015 and 2016.
Chart 74Chart 74Chart 74Chart 74
0
20
40
60
80
2014 2015 2016
Other
Portfolio
FDI
MENA: Private InflowsMENA: Private InflowsMENA: Private InflowsMENA: Private Inflows$ billion
Source: IIF.
Chart 72Chart 72Chart 72Chart 72

iif.com © Copyright 2015. The Institute of International Finance, Inc. All rights reserved.
page 32 CAPITAL FLOWS TO EMERGING MARKETS | MAY 28, 2015
Until recently, MENA oil exporting countries (Saudi Arabia, UAE, Qatar, Kuwait, Oman,
Bahrain, Algeria, Iran, Iraq and Libya) were major exporters of capital (Chart 75), recycling
their huge oil and gas revenues. Their combined current account surplus peaked at $432
billion in 2012, but this surplus has disappeared as the oil price has dropped while do-
mestic spending has been largely sustained supported. As a result, the aggregate current
account is projected to shift to a deficit of $45 billion in 2015 from a surplus of $248
billion in 2014. Accordingly, we project a dramatic swing from resident capital outflows of
around $380 billion in 2012 to a small net inflow of $50 billion in 2015. Resident capital
outflow would increase modestly in 2016 as oil prices recover to around $70/bbl. Net
foreign assets of MENA exporting countries are expected to decline by about $100 bil-
lion to $2.45 trillion in 2015 (Chart 76), about half of the assets are managed by SWFs
with diversified portfolios of public equities, fixed income securities, and minority shares
in global companies, while the other 45% is in official reserves, mostly of Saudi Arabia,
and is invested in liquid assets, notably highly rated government debt securities and
deposits with banks abroad. The projected decline in foreign assets for will be reflected
in the running down of reserves (by $79 billion in Saudi Arabia, $23 billion in Algeria, $13
billion in Iraq, and $24 billion in Libya) and smaller increase SWFs for the UAE, Qatar and
Kuwait (Table 2). The decline in official reserves will lead to lower deposits with foreign
banks and debt securities, while the smaller accumulations in SWFs will be reflected in
smaller FDI and portfolio investment abroad.
600
900
1200
1500
1800
2100
2400
2700
2005 2010 2015Source: IIF
MENA Oil Exportes:MENA Oil Exportes:MENA Oil Exportes:MENA Oil Exportes:Net Foreign AssetsNet Foreign AssetsNet Foreign AssetsNet Foreign Assets$ billion
Chart 75Chart 75Chart 75Chart 75
-400
-300
-200
-100
0
100
200
300
400
500
2008 2010 2012 2014 2016
Resident Capital OutflowsCurrent Account
MENA Oil Exporters:MENA Oil Exporters:MENA Oil Exporters:MENA Oil Exporters: Capital Outflows and Current AccountCapital Outflows and Current AccountCapital Outflows and Current AccountCapital Outflows and Current Account$ billion
Source: IIF.
IIF forecast
Chart 76Chart 76Chart 76Chart 76 Chart 77Chart 77Chart 77Chart 77
-250
-200
-150
-100
-50
0
50
2008 2010 2012 2014 2016
Other
Portfolio Abroad
FDI Abroad
SaudiSaudiSaudiSaudi Arabia plus UAE:Arabia plus UAE:Arabia plus UAE:Arabia plus UAE: Breakdown of Capital OutflowsBreakdown of Capital OutflowsBreakdown of Capital OutflowsBreakdown of Capital Outflows$ billion
Source: IIF.
IIF forecast
Table 2 Table 2 Table 2 Table 2
Current Account Balance, $ bn Official Reserves, $ bn Sovereign Wealth Funds, $ bn
2014 2015 2016 2014 2015 2016 2014 2015 2016
Kuwait 56.5 20.6 29.8 35 37 40 Kuwait Investestment Auth. 404 408 416
Qatar 50.0 6.5 6.8 43 35 35 Qatar Investment Auth. 314 323 327
Saudi Arabia 75.4 -34.8 11.8 732 653 617 UAE SWFs 539 560 587
UAE 48.6 13.0 26.2 78 79 82 Libya Investment Auth. 36 30 25
Algeria -9.6 -25.1 -19.8 179 156 141 Saudi Arabia (AGI) 144 120 110
Iraq 17.2 -11.1 0.1 64 51 45
Libya -17.0 -23.4 -17.3 98 74 56
Source: IIF
MENA Oil Exporters: Current Account Balance, Official Reserves, and Sovereign Wealth FundsMENA Oil Exporters: Current Account Balance, Official Reserves, and Sovereign Wealth FundsMENA Oil Exporters: Current Account Balance, Official Reserves, and Sovereign Wealth FundsMENA Oil Exporters: Current Account Balance, Official Reserves, and Sovereign Wealth Funds

iif.com © Copyright 2015. The Institute of International Finance, Inc. All rights reserved.
page 33 CAPITAL FLOWS TO EMERGING MARKETS | MAY 28, 2015
SUB SAHARAN AFRICA: WANING APPETITESUB SAHARAN AFRICA: WANING APPETITESUB SAHARAN AFRICA: WANING APPETITESUB SAHARAN AFRICA: WANING APPETITE
We expect capital flows to Sub Saharan Africa to pick up slightly following the recent
period of heightened volatility driven by the slump in oil prices, elections in Nigeria and
continued global uncertainty over the timing of U.S. monetary policy tightening. Overall
flows are likely to remain subdued, however, dampened by weak commodity prices.
In Nigeria, portfolio outflows in Q4 2014 likely continued in the first few months of 2015
as evidenced by a further decline in official reserves (Chart 78). This may turn out to be
the low point, however, as a decisive election victory for the opposition and an orderly
transfer of power have reduced uncertainty and fuelled a strong post-election rebound in
financial markets. Nonetheless, the new Buhari government faces enormous economic
challenges as both fiscal and monetary policy will remain restrictive and growth subdued.
Against this background, we expect capital inflows to remain weak this year and next,
notwithstanding a recovery in investment if/when promised reforms are implemented.
Portfolio flows into South Africa, which held up reasonably well in 2014 despite swings in
sentiment influenced by both global market gyrations and local events, have continued
to ebb and flow this year. After outflows in January and February, sentiment reversed in
March, benefiting equities (Chart 79). A tighter fiscal stance, continued weak growth and
a drop in inflation in early 2015 have reduced pressure on monetary policy. However, we
still expect the SARB to raise rates later this year with the timing dependent on the Fed
and how quickly inflation picks up from its recent trough. This suggests that capital in-
flows will remain weak this year, with noticeable improvement only when confidences
picks up and growth improves.
Inflows into other Sub-Saharan Africa countries will again be mainly FDI and through
international bond issues (Chart 80). Given the diversification benefits offered by frontier
markets, we expect continued appetite for sovereign issues. Cote d’Ivoire has already
issued a $1 billion bond this year, Kenya will probably tap the markets again following its
successful debut in 2014, Tanzania has taken steps for a maiden issue in FY2015/16, and
cash-strapped Ghana has indicated that it will go back to the market now that an IMF
program is in place.
20
25
30
35
40
45
50
Apr 13 Jul 13 Oct 13Jan 14Apr 14 Jul 14 Oct 14Jan 15Apr 15
Nigeria: Gross Foreign ReservesNigeria: Gross Foreign ReservesNigeria: Gross Foreign ReservesNigeria: Gross Foreign Reserves$ billion
Source: Nigeria Central Bank.
Chart 78Chart 78Chart 78Chart 78
-2
-1
0
1
2
3
4
Jan Feb Mar Apr May Jun Jul Aug Sep Oct Nov Dec
South Africa: Nonresidents' Purchases/Sales of EquitiesSouth Africa: Nonresidents' Purchases/Sales of EquitiesSouth Africa: Nonresidents' Purchases/Sales of EquitiesSouth Africa: Nonresidents' Purchases/Sales of Equities$ billion, cumulative year-to-date
20132015
2012
Source: South African Reserve Bank
2014
Chart 79Chart 79Chart 79Chart 79
David Hedley Chief Economist Sub-Saharan Africa 1-202-857-3605 [email protected]
We expect capital We expect capital We expect capital We expect capital flows to Sub flows to Sub flows to Sub flows to Sub Saharan Africa to Saharan Africa to Saharan Africa to Saharan Africa to pick up slightly pick up slightly pick up slightly pick up slightly following a period following a period following a period following a period of heightened of heightened of heightened of heightened
0
1
23
4
5
6
7
8
2011 2012 2013 2014
SSA Sovereign Bond SSA Sovereign Bond SSA Sovereign Bond SSA Sovereign Bond Issuance (ExclIssuance (ExclIssuance (ExclIssuance (Excl South Africa)South Africa)South Africa)South Africa)$ billion
Source: Bloomberg.
Chart 80Chart 80Chart 80Chart 80

iif.com © Copyright 2015. The Institute of International Finance, Inc. All rights reserved.
page 34 CAPITAL FLOWS TO EMERGING MARKETS | MAY 28, 2015
Table 3Table 3Table 3Table 3
Emerging Asia: Capital FlowsEmerging Asia: Capital FlowsEmerging Asia: Capital FlowsEmerging Asia: Capital Flows
$ billion 2013 2014 2015 2016
NonNonNonNon----Resident Capital Inflows Resident Capital Inflows Resident Capital Inflows Resident Capital Inflows 677677677677 622622622622 562562562562 631631631631
Private InflowsPrivate InflowsPrivate InflowsPrivate Inflows 670670670670 617617617617 554554554554 623623623623
Equity Investment 396 445 416 444
Direct Investment 350 372 330 335
Portfolio Investment 47 73 86 109
Private Creditors 274 172 138 180
Commercial Banks 127 73 67 90
Nonbanks 147 99 71 90
Official Inflows 8 5 7 7
International Financial Institutions 3 3 3 3
Bilateral Creditors 5 2 4 4
Resident Capital OutflowsResident Capital OutflowsResident Capital OutflowsResident Capital Outflows ----962962962962 ----805805805805 ----845845845845 ----858858858858
Private Outflows -507 -624 -663 -584
Equity Investment Abroad -211 -221 -233 -243
Resident Lending/Other -296 -403 -431 -341
Reserves (- = Increase) -455 -181 -181 -273
----285285285285 ----184184184184 ----283283283283 ----227227227227
Memo:
Net Errors and Omissions 62 -85 0 0
Current Account Balance 223 269 284 227
Source: IIF. See backcover page for guidance on how to interpret these data.
Net Capital FlowsNet Capital FlowsNet Capital FlowsNet Capital Flows

iif.com © Copyright 2015. The Institute of International Finance, Inc. All rights reserved.
page 35 CAPITAL FLOWS TO EMERGING MARKETS | MAY 28, 2015
Table 4Table 4Table 4Table 4
Emerging Europe: Capital FlowsEmerging Europe: Capital FlowsEmerging Europe: Capital FlowsEmerging Europe: Capital Flows
$ billion 2013 2014 2015 2016
NonNonNonNon----Resident Capital Inflows Resident Capital Inflows Resident Capital Inflows Resident Capital Inflows 213213213213 40404040 86868686 131131131131
Private InflowsPrivate InflowsPrivate InflowsPrivate Inflows 217217217217 32323232 63636363 126126126126
Equity Investment 71 52 45 58
Direct Investment 73 59 44 51
Portfolio Investment -2 -7 1 7
Private Creditors 146 -20 18 68
Commercial Banks 19 37 3 40
Nonbanks 126 -57 15 28
Official Inflows -4 7 23 4
International Financial Institutions -12 3 20 6
Bilateral Creditors 8 4 3 -2
Resident Capital OutflowsResident Capital OutflowsResident Capital OutflowsResident Capital Outflows ----177177177177 ----55555555 ----152152152152 ----197197197197
Private Outflows -179 -163 -174 -178
Equity Investment Abroad -101 -56 -45 -46
Resident Lending/Other -78 -106 -130 -132
Reserves (- = Increase) 1 107 22 -19
35353535 ----16161616 ----67676767 ----67676767
Memo:
Net Errors and Omissions -8 -6 0 0
Current Account Balance -27 21 67 67
Source: IIF. See backcover page for guidance on how to interpret these data.
Net Capital FlowsNet Capital FlowsNet Capital FlowsNet Capital Flows

iif.com © Copyright 2015. The Institute of International Finance, Inc. All rights reserved.
page 36 CAPITAL FLOWS TO EMERGING MARKETS | MAY 28, 2015
Table 5Table 5Table 5Table 5
Latin America: Capital FlowsLatin America: Capital FlowsLatin America: Capital FlowsLatin America: Capital Flows
$ billion 2013 2014 2015 2016
NonNonNonNon----Resident Capital Inflows Resident Capital Inflows Resident Capital Inflows Resident Capital Inflows 318318318318 321321321321 296296296296 327327327327
Private InflowsPrivate InflowsPrivate InflowsPrivate Inflows 298298298298 297297297297 268268268268 304304304304
Equity Investment 140 137 138 159
Direct Investment 120 115 113 129
Portfolio Investment 20 22 25 30
Private Creditors 159 159 131 145
Commercial Banks 23 34 25 31
Nonbanks 135 125 105 113
Official Inflows 19 24 28 23
International Financial Institutions 3 5 8 9
Bilateral Creditors 16 19 20 14
Resident Capital OutflowsResident Capital OutflowsResident Capital OutflowsResident Capital Outflows ----151151151151 ----145145145145 ----139139139139 ----181181181181
Private Outflows -155 -123 -143 -157
Equity Investment Abroad -63 -63 -66 -68
Resident Lending/Other -92 -60 -77 -89
Reserves (- = Increase) 4 -23 4 -24
167167167167 176176176176 157157157157 146146146146
Memo:
Net Errors and Omissions -25 -11 0 0
Current Account Balance -142 -165 -157 -146
Source: IIF. See backcover page for guidance on how to interpret these data.
Net Capital FlowsNet Capital FlowsNet Capital FlowsNet Capital Flows
iif.com © Copyright 2015. The Institute of International Finance, Inc. All rights reserved.
page 37 CAPITAL FLOWS TO EMERGING MARKETS | MAY 28, 2015
Table 6Table 6Table 6Table 6
Africa/Middle East: Capital FlowsAfrica/Middle East: Capital FlowsAfrica/Middle East: Capital FlowsAfrica/Middle East: Capital Flows
$ billion 2013 2014 2015 2016
NonNonNonNon----Resident Capital Inflows Resident Capital Inflows Resident Capital Inflows Resident Capital Inflows 93939393 108108108108 106106106106 114114114114
Private InflowsPrivate InflowsPrivate InflowsPrivate Inflows 84848484 102102102102 96969696 104104104104
Equity Investment 59 53 58 64
Direct Investment 39 40 42 46
Portfolio Investment 20 12 15 19
Private Creditors 25 49 38 40
Commercial Banks 2 31 23 23
Nonbanks 22 18 15 17
Official Inflows 10 6 10 10
International Financial Institutions 3 1 3 3
Bilateral Creditors 7 5 7 7
Resident Capital OutflowsResident Capital OutflowsResident Capital OutflowsResident Capital Outflows ----228228228228 ----158158158158 ----43434343 ----115115115115
Private Outflows -138 -144 -124 -146
Equity Investment Abroad -43 -56 -45 -49
Resident Lending/Other -95 -88 -78 -97
Reserves (- = Increase) -90 -14 81 31
----134134134134 ----50505050 63636363 ----1111
Memo:
Net Errors and Omissions -32 -44 0 0
Current Account Balance 166 94 -63 1
Source: IIF. See backcover page for guidance on how to interpret these data.
Net Capital FlowsNet Capital FlowsNet Capital FlowsNet Capital Flows

iif.com © Copyright 2015. The Institute of International Finance, Inc. All rights reserved.
page 38 CAPITAL FLOWS TO EMERGING MARKETS | MAY 28, 2015
IIF CAPITAL FLOWS REPORT COUNTRY SAMPLE (30)IIF CAPITAL FLOWS REPORT COUNTRY SAMPLE (30)IIF CAPITAL FLOWS REPORT COUNTRY SAMPLE (30)IIF CAPITAL FLOWS REPORT COUNTRY SAMPLE (30)
Emerging EuropeEmerging EuropeEmerging EuropeEmerging Europe Bulgaria Latin AmericaLatin AmericaLatin AmericaLatin America Argentina
(8)(8)(8)(8) Czech Republic (8)(8)(8)(8) Brazil
Hungary Chile
Poland Colombia
Romania Ecuador
Russian Federation Mexico
Turkey Peru
Ukraine Venezuela
Emerging AsiaEmerging AsiaEmerging AsiaEmerging Asia China Africa/Middle EastAfrica/Middle EastAfrica/Middle EastAfrica/Middle East Egypt
(7)(7)(7)(7) India ((((7)7)7)7) Lebanon
Indonesia Morocco
Malaysia Nigeria
Philippines Saudi Arabia
South Korea South Africa
Thailand UAE
ANNEX 1: IIF CAPITAL FLOWS DATA ANNEX 1: IIF CAPITAL FLOWS DATA ANNEX 1: IIF CAPITAL FLOWS DATA ANNEX 1: IIF CAPITAL FLOWS DATA –––– A LAYMAN’S GUIDEA LAYMAN’S GUIDEA LAYMAN’S GUIDEA LAYMAN’S GUIDE
Capital flows arise through the transfer of ownership of assets from one country to
another. When analyzing capital flows, we care about who buys an asset and who
sells it. If a foreign investor (a non-resident) buys an emerging market asset, we refer
to this as a capital inflow in our terminology. We report capital inflows on a net
basis. For example, if foreign investors buy $10 billion of assets in a particular
country and sell $2 billion of that country’s assets during the same period, we show
this as a (net) capital inflow of $8 billion. Note that net capital inflows can be
negative, namely if foreign investors sell more assets of a country than they buy in a
given period. Our “net private capital inflows to emerging markets” measure is the
sum of all net purchases of EM assets by private foreign investors.
Correspondingly, if an investor from an emerging market country (a resident) buys a
foreign asset, we call this a capital outflow. Net capital outflows can also be positive
or negative. Following standard balance of payments conventions, we show a net
increase in the assets of EM residents (a capital outflow) with a negative sign.
For further details regarding terminology, concepts and compilation of our data,
please consult our User Guide located on our website at www.iif.com/emr/global/
capflows.