CAPITAL FLOWS QUARTERLY, 2010 Q2 How Dangerous Is … · CAPITAL FLOWS QUARTERLY, 2010 Q2 How ......
19
CAPITAL FLOWS QUARTERLY, 2010 Q2 How Dangerous Is U.S. Government Debt? The Risks of a Sudden Spike in U.S. Interest Rates Francis E. Warnock June 2010
Transcript of CAPITAL FLOWS QUARTERLY, 2010 Q2 How Dangerous Is … · CAPITAL FLOWS QUARTERLY, 2010 Q2 How ......

C A P I T A L F L O W S Q U A R T E R L Y , 2 0 1 0 Q 2
How Dangerous Is U.S. Government Debt? The Risks of a Sudden Spike in U.S. Interest Rates
Francis E. Warnock June 2010

The Council on Foreign Relations (CFR) is an independent, nonpartisan membership organization, think tank, and publisher dedicated to being a resource for its members, government officials, business executives, journalists, educators and students, civic and religious leaders, and other interested citizens in order to help them better understand the world and the foreign policy choices facing the United States and other countries. Founded in 1921, CFR carries out its mission by maintaining a diverse membership, with special programs to promote interest and develop expertise in the next generation of foreign policy leaders; convening meetings at its headquarters in New York and in Washington, DC, and other cities where senior government officials, members of Congress, global leaders, and prominent thinkers come together with CFR members to discuss and debate major international issues; supporting a Studies Program that fosters independent research, enabl-ing CFR scholars to produce articles, reports, and books and hold roundtables that analyze foreign policy is-sues and make concrete policy recommendations; publishing Foreign Affairs, the preeminent journal on inter-national affairs and U.S. foreign policy; sponsoring Independent Task Forces that produce reports with both findings and policy prescriptions on the most important foreign policy topics; and providing up-to-date in-formation and analysis about world events and American foreign policy on its website, CFR.org. The Council on Foreign Relations takes no institutional positions on policy issues and has no affiliation with the U.S. government. All statements of fact and expressions of opinion contained in its publications are the sole responsibility of the author or authors. For further information about CFR or this paper, please write to the Council on Foreign Relations, 58 East 68th Street, New York, NY 10065, or call the Director of Communications at 212.434.9400. Visit CFR’s website, www.cfr.org. Copyright © 2010 by the Council on Foreign Relations®, Inc. All rights reserved. Printed in the United States of America. This paper may not be reproduced in whole or in part, in any form beyond the reproduction permitted by Sections 107 and 108 of the U.S. Copyright Law Act (17 U.S.C. Sections 107 and 108) and excerpts by re-viewers for the public press, without express written permission from the Council on Foreign Relations. For information, write to the Publications Office, Council on Foreign Relations, 58 East 68th Street, New York, NY 10065.

1
I N T R O D U C T I O N
In 1961, the Belgian economist Robert Triffin described the dilemma faced by the country at the center of the international monetary system.1 To supply the world’s risk-free asset, the center country must run a current account deficit and in doing so become ever more indebted to foreigners, until the risk-free asset that it issues ceases to be risk free. Precisely because the world is happy to have a dependable asset to hold as a store of val-ue, it will buy so much of that asset that its issuer will become unsustainably burdened. The endgame to Trif-fin’s paradox is a global, wholesale dumping of the center country’s securities. No one knows in advance when the tipping point will be reached, but the damage brought about by higher interest rates and slower economic growth will be readily apparent afterward.
For a long time now, the United States has seemed vulnerable to the fate that Triffin predicted. Since 1982 it has run a current account deficit every year but one, steadily piling up obligations to foreigners. Because foreigners have been eager to hold dollar assets, they have willingly enabled this pattern, pouring capital into the United States and financing the nation’s surplus of spending over savings. The dollar’s status as the world’s reserve currency has become a facet of U.S. power, allowing the United States to borrow effortlessly and sustain large debt-financed military commitments. Capital has tended to flood into the United States es-pecially readily during moments of geopolitical stress, ensuring that the nation has had the financial wherewi-thal to conduct an assertive foreign policy precisely at moments when crises demanded it. But the capital in-flows associated with the dollar’s reserve-currency status have created a vulnerability, too, opening the door to a foreign sell-off of U.S. securities that could drive up U.S. interest rates and render the nation’s formidable stock of debt far more expensive to service.
Late last year, this potential danger came close to becoming reality. Largely thanks to homegrown pres-sures, unrelated to Triffin’s dilemma, the world’s risk-free asset, the ten-year U.S. Treasury bond, was sagging. With sizeable budget deficits, the prospects of an ever-increasing amount of government debt, the end of the Federal Reserve’s crisis-driven program of accumulating Treasury bonds, and an uptick in inflation expecta-tions, the ten-year Treasury yield increased by fifty basis points from 3.25 percent to 3.75 percent. And fur-ther increases were likely. Such increases would not only substantially raise the cost of future government borrowing, but would also threaten any recovery in housing and other interest-rate-sensitive sectors.
At the same time, moreover, foreigners seemed poised to drive U.S. borrowing costs higher. The dollar was falling sharply. Early in 2009 it fetched almost eighty euro cents in Frankfurt or Athens; by autumn it was worth sixty-seven euro cents. Foreign investors, who held more than half of the U.S. Treasury market, were getting nervous. Luo Ping, a director-general at the China Banking Regulatory Commission, summed up the angst:
Except for U.S. Treasuries, what can you hold? Gold? You don’t hold Japanese government bonds or UK bonds. U.S. Treasuries are the safe haven. For everyone, including China, it is the only option . . . . We know the dollar is going to depreciate, so we hate you guys, but there is nothing much we can do.2
Was Triffin’s endgame—sudden reserve diversification, or the act of foreign governments abruptly shift-ing their funds from dollars to other currencies—about to become a reality? If so, the likeliest benefactor was the eurozone. Prominent economists opined that the euro would become the world’s reserve currency by as early as 2015.3 Through the first half of 2009 global investors seemed to agree: net inflows into eurozone debt instruments—that is, the rest of the world’s purchases of eurozone bonds less euro-area purchases of

2
foreign bonds—surged to record levels. The related plummeting of the dollar relative to the euro added to the fear that global investors were abandoning the center country.
But then began the eurozone phase of the global financial crisis. This has provided the U.S. government with a timely respite from both domestic forces and Triffin’s endgame. U.S. policymakers need to understand that this is not a reset, not a new beginning; it is a lucky break. How the United States uses this reprieve will affect the nation’s ability to borrow for years to come, with broad implications for the sustainability of an ac-tive U.S. foreign policy.
In what follows we will walk through the domestic pressures on U.S. long-term interest rates, the role of global investors, the respite provided by the eurozone crisis, and policy implications. The story will be told primarily through pictures. For those interested in the methodology used to measure foreign official flows and a more detailed perspective on U.S. capital flows, a box and appendix are also provided.
D O M E S T I C P R E S S U R E S O N L O N G - T E R M R A T E S
In the autumn of 2009 at least three factors were weighing heavily on U.S. Treasury bond prices, driving in-terest rates (or “yields”) upward. Significantly, none of the three factors has diminished.
The first factor is the hangover from the financial crisis. On top of tax cuts and spending increases over the past decade, the stimulus spending and the decline in tax revenues resulting from the recession worsened the U.S. fiscal situation. The budget deficit reached 10 percent of potential GDP in 2008, and even the baseline Congressional Budget Office forecast, which must include the implausible assumption that Congress will allow various “temporary” tax relief measures to expire, has U.S. public debt skyrocketing toward 100 per-cent of GDP (Figure 1, left panels).4 Various economic theories provide a link from increases in either gov-ernment debt (a stock figure) or budget deficits (a flow) and increases in interest rates, be it through the crowding out of private investment or through Keynesian increases in demand. Whatever theory one prefers, Thomas Laubach showed that for each percentage point rise in the projected deficit-to-GDP ratio, longer-term interest rates increase by about twenty-five basis points (or 0.25 percent); alternatively, each percentage point rise in the public debt-to-GDP ratio increases long rates by three to four basis points.5 Combining defi-cit (or debt) projections with the Laubach analysis, one might expect the fiscal situation to lead to a full per-centage point (or even much greater) increase in long rates.
The second domestic factor exerting upward pressure on long rates is that demand from one source—the Federal Reserve—is likely to be scaled back. In 2009, the Fed purchased $300 billion in long-dated treasuries (Figure 1, right top panel). To the extent this put downward pressure on rates, the cessation of the Fed’s cre-dit-easing policy might be expected to lead to higher long rates.
A third factor on the radar screen is inflation expectations. An increase in inflation expectations can have a one-for-one impact on long-term nominal interest rates. Longer-term inflation expectations (Figure 1, right bottom panel) have been on a post-crisis upward march, putting yet more upward pressure on long rates. In the autumn of 2009, the one domestic factor that was pulling rates lower was anything but comforting: concerns about a potential double-dip recession. As the U.S. recovery has strengthened, this factor has grown less significant. The result is that the balance of domestic forces in the United States now points to higher bor-rowing costs for the U.S. government. Adding together the pressure from large deficits, the cessation of the Fed’s crisis-response policies, and rising inflation expectations, one might expect the ten-year Treasury rate to be at least one hundred basis points higher than it was a year ago. Oddly, and perhaps ominously, the actual ten-year Treasury rate at the start of June 2010 languishes at 3.4 percent, roughly unchanged from a year ago, implying plenty of room for an upward spike.

3
Figure 1
US Treasury Bonds Held by the Federal Reserve
EOP, Mil. $
090807060504Sour ce: Feder al Reser ve Boar d /Haver Analytics
750000
675000
600000
525000
450000
375000
750000
675000
600000
525000
450000
375000
Federal Surplus as a Percent of Potential GDP
Fiscal Year , %
100500959085
Sour ce: Congr essional Budget Office /Haver Analytics
2. 5
0. 0
-2. 5
-5. 0
-7. 5
-10. 0
-12. 5
2. 5
0. 0
-2. 5
-5. 0
-7. 5
-10. 0
-12. 5
Gross Federal Debt as a Percentage of GDP
%
201510050095
Sour ce: Congr essional Budget Office/Haver Analytics
97. 5
90. 0
82. 5
75. 0
67. 5
60. 0
52. 5
97. 5
90. 0
82. 5
75. 0
67. 5
60. 0
52. 5
Implied 5-Year Forward Inflation Rate
%
090807060504Sour ce: Feder al Reser ve Boar d /Haver Analytics
2. 8
2. 4
2. 0
1. 6
1. 2
0. 8
0. 4
2. 8
2. 4
2. 0
1. 6
1. 2
0. 8
0. 4

4
T H E R O L E O F G L O B A L I N V E S T O R S
Not too long ago many were skeptical that foreign accumulation of U.S. debt securities materially affected U.S. rates. The view that such intervention did not matter was summed up concisely by the chief economist of an investment bank: “U.S. bond yields . . . have fluctuated over a wide range in response to many factors . . . but foreign buying . . . ha(s) simply not had much impact. Foreigners don’t have much influence . . .”6 At a July 2005 briefing, Senator Richard Shelby (R-AL) asked Federal Reserve chairman Alan Greenspan if foreign flows could affect long-term U.S. interest rates. In Greenspan’s response to the senator, he noted that while foreign accumulation probably lowered long-term U.S. interest rates, the effect was likely small, and so the unwinding of those positions, were it to occur, would only add a small amount to long rates.
But at that time no one had a good sense of the dynamics of foreign demand for U.S. bonds. To calculate the effect of this demand on Treasury rates, economists seek to isolate the portion of foreign demand that comes from governments: Unlike private foreign purchases, which may fluctuate in response to Treasury rates, foreign government purchases are presumed to be insensitive to Treasury rates, so that changes in those rates can be presumed to be driven by government buying rather than the other way around. Greenspan’s response to Senator Shelby was based on calculations that used data on bonds held at the New York Fed on behalf of foreign governments. But, while governments use the New York Fed’s custodial services for some purchases, they also hold U.S. bonds elsewhere, so the analysis was based on partial data. And while there have been many user-friendly improvements over the past few years, international capital flows data remain hard to navigate. (For a discussion of various sources of data on foreign governments’ purchases and sales of U.S. securities, see Box 1).
However, a 2005 Federal Reserve discussion paper pointed to a better answer than the one that was gen-erally accepted at the time of Shelby’s question.7 The paper began by showing how reported capital flows data could be adjusted for use in empirical analysis. Briefly, because of a bias in the Treasury International Capital data collected by the U.S. government, flows from foreign official institutions were often reported as being from private investors. Infrequent but high-quality snapshots of stocks (as opposed to flows) do not suffer from this bias (although they are subject to a less severe bias, described in the box) and so can be used to cor-rect flows data. Armed with such data, the authors found that foreign official purchases of treasuries had little if any impact on shorter-term U.S. rates (which are well anchored by the Fed Funds rate) but a substantial im-pact on U.S. long-term interest rates. The accumulation of U.S. treasuries (and near substitutes) by foreign official institutions, then running at about $400 billion per year, lowered long-term U.S. interest rates by anywhere from fifty to one hundred basis points; if foreign governments ceased adding treasuries to their portfolios, U.S. long-term rates could spike upward by the same amount. The increase would be much greater if foreign governments actively sold existing Treasury positions. Equally, a cessation of purchases or a sell-off by foreign private investors could add even more to the upward pressure on U.S. interest rates, since foreign private investors remain large buyers.
The potential impact on the United States resulting from a sell-off has not diminished since the original discussion paper calculations, because foreigners have not reduced the size of their positions. Foreigners now hold over half of the Treasury bond market and almost a fifth of the corporate debt market. Table 1 summa-rizes foreigners’ share of various U.S. asset classes.

5
Table 1. Foreign-owned Long-term U.S. Securities ($billions)
Note: Data are from Table 2 of the Treasury’s “Foreign Holdings of U.S. Securities” documents. 2000 is from the June 2008 report; 20022009 are from the June 2009 report. * December 2009 data are author’s estimates. Amounts outstanding for December 2009 are calculated as follows. Equities: Federal Reserve Statistical Release Z.1, Flow of Funds Accounts of the Unit-ed States, Table L213 row 1, minus L213 row 3, plus L214 row 1, plus L206 row 1. Marketable U.S. Treasury: Bureau of Public Debt Table 1 Summary of Public Debt Summary of Treasury Securities Outstanding, Total marketable held by the public minus Bills. U.S. government agency: Flow of Funds L210 row 1, minus a guesstimate of the amount that is short-term ($946 billion in June 2009). Corporate and other debt: Flow of Funds L212 row 1, less L212 row 3, plus L211 row 1, less L211 row 3. Holdings for December 2009 are based on the following sources. Equities: Flow of Funds L213 row 9, plus L214 row 6, plus L206 row 6. Marketable U.S. Treasury: Flow of Funds L209 row 11, minus http://www.treas.gov/tic/bltype.txt lines 5, 10, and 15. U.S. government agency: Flow of Funds L210 row 10, minus http://www.treas.gov/tic/bltype.txt line 37. Corporate and other debt: Flow of Funds L212 row 16, plus two-thirds of L211 row 12 (other one-third assumed short-term).

6
T H E N E A R M I S S O F 2 0 0 9
The large foreign holdings of U.S. assets presented in Table 1 are only a threat to the United States if there is a risk that foreigners might abandon past patterns and decide to put their money elsewhere. In 2009, with do-mestic conditions pointing toward a surge in Treasury yields, major investors were thinking aloud about doing just that—witness the concern expressed by China’s Luo Ping that his country’s accumulation of risk-free dollar assets was anything but risk-free. At the same time, other senior foreign officials were actively de-bating the future of the dollar as the global reserve currency. On a visit to Beijing in May 2009, Brazil’s presi-dent, Luiz Inácio Lula da Silva, picked up on his hosts’ frustration with the U.S. currency. Calling for a “new economic order,” he suggested that it was time to stop denominating trade in dollars.
Sure enough, foreign flows into U.S. Treasury bonds declined steeply in the first months of 2009. Yet they remained positive, and recovered in the second half of the year (Figure 2). While not as pronounced as in 20032004, foreign appetite for the reserve asset remained at a high level.
Figure 2
Net Foreign Flows into US Treasury Bonds12-month total $ billions
050095Source: US Treasury /Haver Analytics
500
400
300
200
100
0
-100
500
400
300
200
100
0
-100
Identified Foreign Official FlowsTotal Foreign Flows
Last data point: 2009 October.
Even though foreign appetite for U.S. treasuries remained healthy, this did not eliminate the risk to the
United States. The reason was that U.S. debt issuance was increasing sharply, and foreigners were holding a

7
smaller share of outstanding U.S. bonds (Table 1 and Figure 3). This raised the specter of a future in which the United States would likely have to issue more and more bonds, but foreign demand might not keep pace.
Figure 3
US Long-term Debt Securities, Amount Outstanding$ billions
US Long-term Debt Securities, Share Owned by Foreigners
09080706050403020100Source: US Treasury /Haver Analytics
28000
24000
20000
16000
12000
8000
0.28
0.26
0.24
0.22
0.20
0.18
0.16
Foreign OwnershipAmount Outstanding

8
Figure 4
Debt Instruments: Net inflows into the euro area
4-qtr MovingTotal (USD billions)
0908070605040302010099
Sour ce: Haver Analytics
800
600
400
200
0
-200
800
600
400
200
0
-200
Last data point: 2009 Q2.
At the same time, the eurozone was experiencing an unprecedented increase in net bond inflows (Figure 4). Global fixed income investors had warmed to the euro area. Luo Ping’s lament that foreigners have no choice but to accumulate U.S. assets seemed to be less true. If the euro was emerging as a popular reserve asset, was an abandonment of U.S. bonds the next step?
In sum, by the autumn of 2009 the scene was set for a wholesale abandonment of U.S. debt markets. But then the eurozone’s crisis accelerated. Spreads between Greek and German long rates skyrocketed, and net bond flows into the euro area fell sharply (Figure 5).

9
Figure 5
10-Yr Government Bond Yields (%): Greece and Germany
09080706Sour ce: Reuter s /Haver Analytics
12
10
8
6
4
2
12
10
8
6
4
2
Debt Instruments: Net inflows into the euro area
4-qtr moving total (USD billions)
0908070605040302010099
Sour ce: Haver Analytics
800
600
400
200
0
-200
800
600
400
200
0
-200
Last data point: 2009 Q4.
10
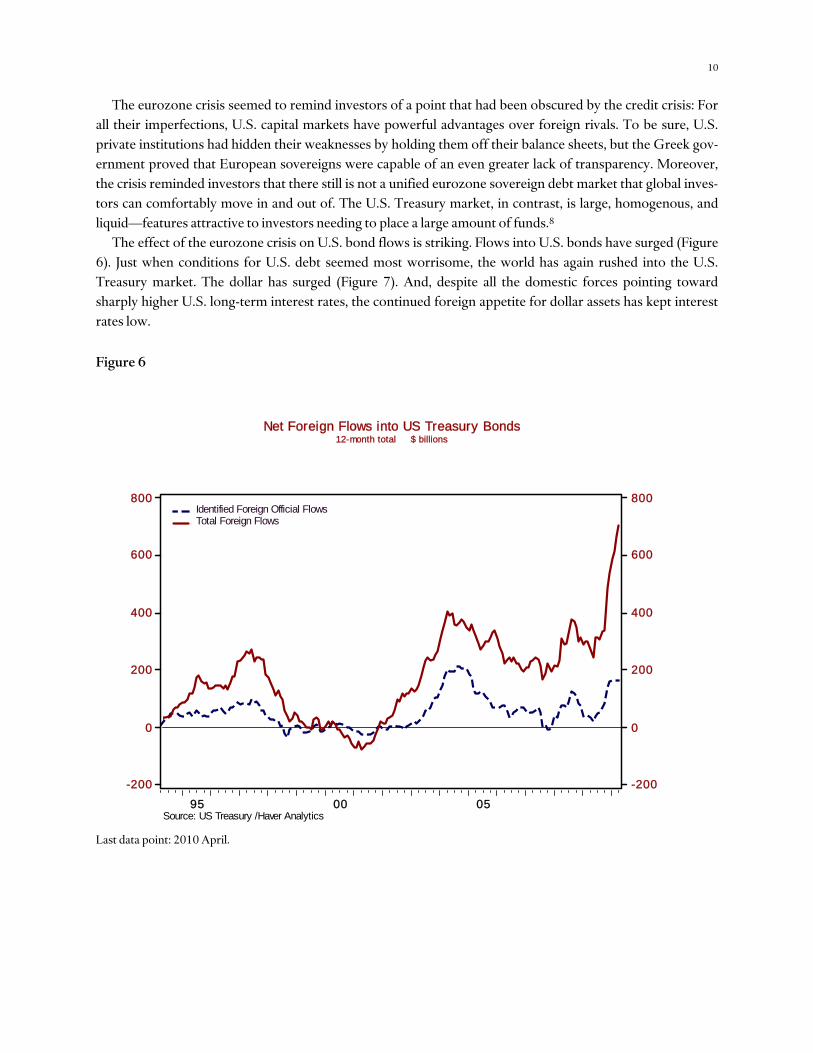
The eurozone crisis seemed to remind investors of a point that had been obscured by the credit crisis: For all their imperfections, U.S. capital markets have powerful advantages over foreign rivals. To be sure, U.S. private institutions had hidden their weaknesses by holding them off their balance sheets, but the Greek gov-ernment proved that European sovereigns were capable of an even greater lack of transparency. Moreover, the crisis reminded investors that there still is not a unified eurozone sovereign debt market that global inves-tors can comfortably move in and out of. The U.S. Treasury market, in contrast, is large, homogenous, and liquid—features attractive to investors needing to place a large amount of funds.8
The effect of the eurozone crisis on U.S. bond flows is striking. Flows into U.S. bonds have surged (Figure 6). Just when conditions for U.S. debt seemed most worrisome, the world has again rushed into the U.S. Treasury market. The dollar has surged (Figure 7). And, despite all the domestic forces pointing toward sharply higher U.S. long-term interest rates, the continued foreign appetite for dollar assets has kept interest rates low.
Figure 6
Net Foreign Flows into US Treasury Bonds12-month total $ billions
050095Source: US Treasury /Haver Analytics
800
600
400
200
0
-200
800
600
400
200
0
-200
Identified Foreign Official FlowsTotal Foreign Flows
Last data point: 2010 April.

11
Figure 7
US$/Euro
090807060504Sour ce: Financial Times /Haver Analytics
1. 6
1. 5
1. 4
1. 3
1. 2
1. 1
1. 6
1. 5
1. 4
1. 3
1. 2
1. 1
10-Year Treasury Bond Yield at Constant Matur ity
%
090807060504Sour ce: U. S. Tr easur y /Haver Analytics
5. 25
4. 50
3. 75
3. 00
2. 25
5. 25
4. 50
3. 75
3. 00
2. 25

12
P O L I C Y I M P L I C A T I O N S : W H A T T O D O W I T H T H E R E S P I T E ?
Global markets have given the United States a respite. Policymakers could use this respite to avoid making tough decisions and increase borrowing, taking advantage of historically low interest rates and heightened global demand for U.S. bonds. But if the United States adds further to its debt, the privilege of borrowing in-ternationally in its own currency might not last much longer. Therefore the Obama administration’s deficit review commission, which is due to report by December 1, 2010, presents an important national opportuni-ty. Though it has been written off as a political sideshow by many commentators, a failure to act on its pro-posals will jeopardize U.S. economic and national security. In order to continue to attract foreign capital, the United States needs to control its appetite for it. Moreover, it should do so while foreign capital is still readily available rather than waiting for a crisis, at which point adjustment will be far more painful.
Fiscal adjustment is all the more urgent, as some sources of the dollar’s reserve currency status may not last. In particular, the eurozone, if it holds together, now recognizes the need for a unified sovereign bond market; the newly created bailout facility will be financed partially by eurozone bonds, and proposals exist to go much further.9 In the future, there will be rivals to the U.S. Treasury market in terms of market depth and liquidity. To remain the world’s reserve currency, with all the associated perks and duties, the United States must provide the world with both a stable currency not eroded by inflation and conditions, including deep and transparent markets, in which outsiders (be they domestic or foreign) are comfortable committing funds.10
The United States also needs to consider how it uses borrowed funds. While borrowing to finance con-sumption (whether public or private) is not sustainable, borrowing to finance the expansion of the capital stock—improving the economy’s productive capacity—is more benign. If debts are used to expand output, the debt-to-GDP ratio can remain stable or even fall, even as borrowing remains large. But persistent borrow-ing from abroad cannot be accompanied by persistent increases in government and household consumption.
Box 1: Have Foreign Official Flows Into the United States Surged or Plummeted This Year?
Readers will often see references to whether (and how much) foreign governments are purchasing U.S. se-curities (Treasury bonds as well as other securities). These data are much discussed, but can be perplexing. The table below shows foreign official flows based on the Bureau of Economic Analysis’s Balance of Pay-ments presentation, Treasury’s TIC data, and the New York Fed’s H.4.1 release. Depending on the source, in 2009 foreign official inflows either decreased or increased, and the amount of inflows was as high as $448 billion or as little as $36 billion. Nor is this extraordinary discrepancy confined to 2009. For 2010, such data as are currently available suggest that foreign official flows have either surged or plummeted. Which is it?
Foreign Official Flows ($billions, annual averages)
20042007 2008 2009 2010 BEA’s Quarterly Balance of Payment (BOP) Data
Foreign official flows into the United States 406 487 448 U.S. Treasury securities 173 478 490
Short-term bills and certificates -7 272 63 Medium-to-long-term bonds and notes 181 205 427
U.S. agency securities 133 66 -39 Other foreign official inflows 100 -56 -4

13
Treasury’s Monthly TIC Data through
March Foreign official flows into the United States 213 158 36 -38
U.S. Treasury securities 82 336 238 2 Short-term bills and certificates -3 259 76 -28 Medium-to-long-term bonds and notes 86 77 161 30
U.S. agency securities 66 -32 -43 -4 Other foreign official inflows 64 -147 -159 -36
memo items: Selected Federal Reserve adjustments Treasury bonds, foreign official flows 113 198 Treasury bonds, private flows -75 -104
New York Fed’s Weekly H.4.1 Custodial Data through
May Foreign official flows into the United States 253 383 418 319
Change in holdings of Treasury securities 116 203 543 304 Change in holdings of agency securities 137 180 -125 14
Annual averages, except for partial 2010 data.
The three data sources conflict because of different methodologies. The monthly TIC data “identifies” for-eign official flows as those that originate from a recognized foreign official institution. Any transaction run through a shell company or even a non-U.S. intermediary shows up in the TIC data, but not as a foreign official flow. That is, the TIC data on foreign official flows should be viewed as a lower bound. Hence, in Figures 2 and 6 both “identified” foreign official flows and total foreign flows are shown; true foreign offi-cial flows are likely somewhere between the two lines.
One read on the extent of private flows that should be “shuffled” into foreign official flows is provided by Federal Reserve adjustments.11 Those adjustments, shown in the “memo items” listed under the TIC data in the above table, shift roughly $100 billion a year from private to foreign official inflows. These adjustments are, however, also partial, as they are based on a reconciliation of the monthly flows with annual snapshots of custodial holdings. That is, they replace a severe transaction center bias with a much less severe custodial center bias.12 While this is an improvement, even this adjustment cannot be viewed as complete as any for-eign official institution that wants to mask its holdings can do so by using a foreign custodian.13
The different reported amounts of foreign official inflows can be reconciled. The New York Fed’s H.4.1 data, the most timely, is custodial based and for only one custodian, the New York Fed. If foreign central banks choose not to utilize the New York Fed, or move bonds from their accounts at the New York Fed to other custodians, the H.4.1 data will not provide an accurate read of foreign official inflows. The TIC data by itself has a transaction center bias that in some cases will cause foreign official flows to be reported as private flows. Federal Reserve adjustments, by making monthly flows consistent with annual data on posi-tions, transform this transaction center bias into a more benign custodial center bias (and also correct for some other problems with the flows data). The Bureau of Economic Analysis moves last and thus can in-corporate all of these sources into what should be the most comprehensive view of foreign official flows into the United States. That view shows that foreign official inflows maintained a high level of over $400

14
billion per year during the financial crisis, although the composition changed dramatically. In particular, foreign official institutions no longer accumulate agency and corporate bonds, instead focusing their pur-chases on Treasury securities.
To date in 2010, by focusing solely on TIC’s reported foreign official flows, one would conclude that for-eign governments have greatly reduced their demand for U.S. Treasury securities. But, recognizing that many foreign official flows are not identified as such in the TIC data, and that (1) total foreign flows into treasuries remain strong (as evident in Figure 6) and (2) governments’ holdings of Treasury securities at the New York Fed have increased sharply, the opposite conclusion would be reached. Foreign governments’ demand for U.S. Treasury securities remains as strong as ever.
A P P E N D I X : F I N A N C I A L F L O W S I N T H E U N I T E D S T A T E S
This paper has zeroed in on a particular type of capital flow: foreigners’ purchases (and sales) of U.S. Treasury securities. But it is also useful to keep the broader picture in mind. Thus, the appendix provides a broader (but cursory) view of U.S. international capital flows, primarily through an annotated table of U.S. capital flows (Appendix Table 1), which will be updated each quarter.
Net financial flows into the United States (line 7) slowed only slightly during the financial crisis, even as fo-reigners sharply curtailed their purchases of U.S. securities (included in line 15). Reason: At the same time, U.S. investors ceased their purchases of foreign securities (line 10). But in 2009, foreigners’ demand for U.S. securities remained tepid and U.S. investors’ purchases of foreign securities resumed to some extent, and thus net financial inflows into the U.S. slowed substantially. Things to consider over the rest of 2010: Will foreign official institutions (line 16) maintain their large flows into the United States? Will FDI (line 24) and equity flows (line 25) into the United States maintain their recent levels and perhaps even increase? Will U.S. corpo-rate bonds (line 30) become a desirable asset class once again? And will U.S. investors step up their diversifi-cation into foreign markets?
An oddity in recent BOP data is U.S. government assets abroad (line 14). Most years these flows are ap-proximately zero, but in 2008 they were very large. Reason: Included in this category are the currency swaps initiated by the Fed. When they were put on (in 2008), they were recorded as large outflows; as they were un-done in 2009, a large inflow was recorded. Over time these currency swaps are designed to sum to zero in BOP terms.

16
Appendix Table 1. Annotated U.S. BOP Presentation ($billions)
Source: BEA. Note all data are in BOP accounting terms (that is, outflows [-], inflows [+]).
17
Endnotes
1. Robert Triffin, Gold and the Dollar Crisis: The Future of Convertibility (New Haven: Yale University Press, 1961). 2. Henny Sender, “China to Stick with U.S. Bonds,” FT.com, February 11, 2009. 3. See http://content.ksg.harvard.edu/blog/jeff_frankels_weblog/2008/02/23/the-euro-could-surpass-the-dollar-within%2010-years/. 4. The baseline CBO forecast must assume policies remain as they currently are, which means that temporary spending provisions are assumed to expire, even if in practice they are often extended. For a discussion of various deficit and debt forecasts, see Alan Auerbach and William Gale, “Déjà Vu All Over Again: On the Dismal Prospects for the Federal Budget” (Brookings Institution mimeograph, 2010), which notes that the main concern is not in deficits over the next year or two, but medium- and long-term deficits. 5. Laubach’s analysis is explicitly about five-year projections of deficits (and debt), so one should caution against using it to make statements about the impact of cyclical deficits. It is more appropriate for longer-term fiscal trends. See Thomas Laubach, “New Evidence on the Interest Rate Effects of Budget Deficits and Debt,” Journal of the European Economic Association, vol. 7, no. 4, pp. 858–885. 6. David Malpass, chief economist of Bear Stearns, quoted in “Their Money, Our Strength,” Wall Street Journal, August 5, 2004. 7. See Francis E Warnock and Veronica Cacdac Warnock, “International Capital Flows and U.S. Interest Rates,” Journal of International Money and Finance, vol. 28 (2009), pp. 90319. 8. For a more eloquent discussion of salient features of the U.S. Treasury market, see Brian Sack, “Dollar Asset Markets: Prospects after the Cri-sis,” remarks at the ACI 2010 World Congress, Sydney, Australia, March 26, 2010. 9. See, for example, Jacques Delpla and Jakob von Weizsäcker, “The Blue Bond Proposal,” Bruegel Policy Brief 2010/03. 10. See Sack, “Dollar Asset Markets.” 11. These adjustments, developed by Charles Thomas, Francis E. Warnock, and Jon Wongswan in “The Performance of International Equity Portfolios” (NBER Working Paper 12346, 2006) and refined by Carol Bertaut and Ralph Tryon in “Monthly Estimates of U.S. Cross-Border Securities Positions” (FRB International Finance Discussion Paper No. 910, 2007), are updated each year on http://www.federalreserve.gov/ pubs/ifdp/2007/910/default.htm. 12. The transactions center bias in the TIC data on long-term securities flows derives from the fact that the respondents are asked to identify the country through which the transaction was made, which can differ from the country of the ultimate buyer (in the case of inflows) or of the issuer (in the case of outflows). Liabilities data collected on a custodial basis can also have a bias if the custodian and ultimate investor reside in different countries. To see that the Federal Reserve adjustment is largely a removal of the transaction center bias, note that for Treasury bills, which are collected by the TIC system on a custodial basis, the discrepancy between TIC and BOP data is quite modest. 13. Note that even with all available information, there is nothing pristine about transactions-based international capital flows data collected for BOP purposes. A fundamental difficulty with such a data collection system is that it asks reporters to submit data that they would never collect on their own. A financial intermediary would not naturally care about the residency of the parties on either side of a trade, but that is exactly what BOP accounting rules ask them to do. More natural might be to obtain higher frequency reads on cross-border positions, something naturally collected by custodians, and use them to calculate flows.
18
About the Author
Francis E. Warnock is Paul M. Hammaker associate professor of business administration at the Darden Business School, University of Virginia, research associate at the National Bureau of Economic Research, senior fellow at the Federal Reserve Bank of Dallas’s Globalization and Monetary Policy Institute, and re-search associate at Trinity College Dublin’s Institute for International Integration Studies.