CAPE MAY COUNTY HURRICANE EVACUATION AND ELEVATION STUDY
23
DRAFT FINAL REPORT CAPE MAY COUNTY HURRICANE EVACUATION AND ELEVATION STUDY EXTENSION Submitted to SOUTH JERSEY TRANSPORTATION PLANNING ORGANIZATION 782 S. Brewster Road, Unit B6 Vineland, NJ 08361 Submitted by NEW JERSEY INSTITUTE OF TECHNOLOGY National Center for Transportation and Industrial Productivity University Heights Newark, NJ 07102-1983 njit.edu 30 June, 2007
Transcript of CAPE MAY COUNTY HURRICANE EVACUATION AND ELEVATION STUDY

DRAFT FINAL REPORT
CAPE MAY COUNTY HURRICANE EVACUATION AND ELEVATION STUDY EXTENSION
Submitted to SOUTH JERSEY TRANSPORTATION PLANNING ORGANIZATION 782 S. Brewster Road, Unit B6 Vineland, NJ 08361 Submitted by NEW JERSEY INSTITUTE OF TECHNOLOGY National Center for Transportation and Industrial Productivity University Heights Newark, NJ 07102-1983
njit.edu 30 June, 2007

I SUMMARY
The objective of this research effort was to extend the work completed under the previous study
“Analysis and Modeling of Cape May County Roadway Elevations and Evacuation Routes”,
henceforth referred to as the ‘initial study’. The initial study was sponsored by the New Jersey
Department of Transportation (NJDOT) to fill the needs of the NJDOT and the New Jersey State
Police Office of Emergency Management. The report summarizing this initial effort is available
online at http://transportation.njit.edu/nctip/final_report/CapeMayElevEvac.pdf.
This initial study contained two main sections of work, and this study extends both efforts as follows:
• Evacuation Simulation Modeling: Further simulation analysis of evacuations of Cape May
County traffic via the NJ 47/347 corridor was conducted. The evacuation analysis consisted
of a Paramics-based microsimulation model that determined how long it would take to
evacuate Cape May County traffic along the NJ 47/347 corridor. Several more permutations
of conditions were tested, many of which tested higher amounts of vehicles evacuating from
the NJ 47/347 corridor. Due to the ineffectiveness of the current NJ 47/347 lane reversal
plan (as shown in the initial study), a new lane reversal plan was tested that would extend
the reversal section further south to the intersection with US 9.
• Roadway Elevation Surveying: Surveying more roadways in the county was conducted to
determine elevation and to determine under what category of storm the roadways would be
inundated and impassable by either emergency response vehicles or by evacuees. The
survey was conducted using GPS instrumentation in survey vehicles that traveled the
roadways.
The findings of the research effort are as follows:
• Evacuation Simulation Modeling: The higher evacuation demands for the NJ 47/347
corridor resulted in much higher total evacuation times than the initial scenarios tested in
the initial study. The total evacuation times for the corridor now vary from 16 to 89 hours.
The ineffectiveness of the current contraflow or lane reversal plan (between NJ 83 and NJ 55)
shown in the initial study is reiterated. The extended contraflow scenarios (GSP to NJ 55)
show dramatic potential in evacuating the county’s population, especially when the higher
vehicle per household rates and the maximum routing of vehicles into the NJ 47/347
corridor is assumed. Based on these results, the extension of the lane reversal section to the
current planned southern terminus of NJ 83 is highly encouraged. The potential exists to
shorten the worst case evacuation scenario from 89 hours to 40 hours.

• Roadway Elevation Surveying: The survey and analysis reveals that while the majority of the
surveyed roadways will remain passable during a category 1 hurricane, there were surveyed
locations in each of the roadways that would be flooded from a category 1 hurricane strike.
The fact that all the surveyed roadways will be at least partially impassable during the peak
levels of a storm surge from a category 1 hurricane, indicates the importance of having a
evacuation plan in place that allows enough time for evacuation before the maximum storm
surge levels are reached.

II EVACUATION SIMULATIONS The evacuation analysis was performed using the network and methods developed during the initial
study. The simulations were conducted using the Quadstone Paramics software, an advanced
microscopic traffic simulation modeling system. Further details about the network development and
methods used to perform a multi-day evacuation simulation analysis in Paramics are described in the
initial report.
II.1 Study Area
Figure 1 illustrates the studied evacuation region. The simulated study area, shown in green, begins
in Rio Grande, New Jersey in the south (at approximately milepost 5.5 of Route 47) and extends to
the north and ends shortly after Route 55 begins. The actual simulation network (shown in Figure
2) includes every public road (state, county, and local jurisdictions) within this primary study area.
The secondary study regions, shown in Figure 1 in pink, are areas within Cape May County that
were not explicitly included in the simulation network. However, any traffic presumed to feed from
the secondary study areas into the Routes 47/347 corridor was included in the simulation. The
evacuation routes (Routes 47/347) are highlighted in yellow.
II.2 Analysis Scenarios
Scenarios are defined by varying the amount of evacuating traffic (demand) and / or the roadway
conditions that are provided to allow the traffic to evacuate (network). A single scenario is defined
as the combination of one demand condition and one network condition. While network conditions
are relatively straight forward and can be described as one parameter, five different parameters are
used to define the demand side of the evacuation problem (i.e. when, where, and how many
vehicles will be evacuating via the study corridor). The following parameters were considered in the
evacuation simulation analysis.
II.2.1 Traffic Operations / Network Conditions:
The network available for the evacuation population to exit the region is defined as a single
parameter in the scenarios. Consistent to all the networks is a single zone structure. Origin zones
are placed at various vehicle generation locations along the edges of the network (to load traffic
entering the network from the secondary study areas) and within the study area (to load traffic
residing in the study area). A single destination zone was located at the northern end of the
network on Route 55 to receive all evacuating traffic. Variations to the network among the networks

Figure 1. Evacuation Study Area

Figure 2. Cape May Simulation Network
include variations in the reversed lane or contraflow operations that are implemented in the
corridor. The three study options for the network include:
1. No Lane Reversal:
This scenario assumes normal lane usage in the NJ 47/347 corridor (predominantly one
travel lane in each direction), but assumes police are directing traffic at key intersections to
allow side street traffic which is normally stop controlled to enter the evacuation corridor.
2. Current Lane Reversal Plan:
This scenario assumes the operation of Routes 47/347 under contraflow conditions between
the junctions of Route 83 in the south to Route 55 in the north. This alternative follows the
instructions specified in the State Police Routes 47/347 Reverse Lane Plan.

3. Extended Lane Reversal Plan
This scenario assumes that contraflow operations are extended to the south along NJ 47 to
the Garden State Parkway. This scenarios results in 2 lanes available for northbound
evacuating traffic along the NJ 47/347 corridor from the Garden State Parkway in the south
and feeding into NJ 55 in the north. Intersection controls for the extended contraflow
sections operate in a similar fashion to the current plan (e.g. police control directing
intersections, forced detours or barricades channel evacuating traffic onto the northbound
evacuation route).
II.2.2 Area Population
The first demand related parameter, the area population parameter, defines how many people are in
the region that could potentially need to evacuate. The primary source of determining the at-risk
population is an estimate of housing units that are in the region and how many of them would be
occupied. An additional source of potential people in the region is the large number of trips that
travel into the region only for the day. The size of the day-tripper population is thus not able to be
estimated by counting housing units (since they have no need for housing in the region). The
assumption under the initial study and carried through to this current study is that no day-trippers
would be in the area due to the impending threat of a hurricane strike on the region. This leaves
the threaten population to be derived from examining the number of housing units in the county.
All estimates of housing units are taken from the US Army Corp of Engineers estimates of vulnerable
housing units, included as part of the Hurricane Evacuation Study (HES). The HES study categorizes
all housing units as either permanent, seasonal, or hotel / motel units. A separate estimate of mobile
homes is included due to the increased risk to this type of housing unit from a hurricane. The
number of housing units are then subcategorized by the evacuation district (subgroups of
municipalities) and by the potential for being inundated by different categories of hurricanes.
Missing from the HES study was an estimate of campground sites throughout the county. A survey
of campgrounds sites conducted during the initial study was added to the HES vulnerable housing
unit estimates. Variations in the area population demand parameter include:
1. Peak Season (estimated Labor Day weekend)
This alternative assumes that 100% of permanent resident housing units, seasonal housing
units, hotel / motel units, and campgrounds are occupied and will contribute to the
potential evacuating population.
2. Off-Peak Season (estimated late September)
This alternative assumes that 100% of permanent resident housing units and 50% of
seasonal housing units, hotel / motel units, and campgrounds are occupied and will
contribute to the potential evacuating population.

II.2.3 Evacuating Vehicles per Household Assumptions
Since the focus is on vehicle evacuation from the region using the NJ 47/347corridor, the number of
housing units is used to derive the number of vehicles that would be evacuating, rather than the
evacuating population. In this study, two options existed to determine the number of vehicles that
would be evacuating:
1. Census-based Vehicles per household rates
This first option is the assumption made during the initial study. Similar to other hurricane
evacuation studies, particularly one study conducted for the Delmarva Peninsula, vehicle per
household rates for permanent housing units are based on census data. While the Delmarva
Study assumed one vehicle per seasonal housing unit, it was deemed that this was too low
for Cape May County. Instead, the initial report used the same vehicle per household rate
for seasonal units as for the permanent housing units. The vehicle per household rates from
the initial study are as follows:
Type of Housing Unit Vehicles per Household Rate (& Source)
Permanent 1.54 (2000 Census for Cape May County)
Seasonal 1.54 (2000 Census for Cape May County))
Hotel / Motel 1.0 (Assumption)
Campgrounds: 1.0 (Assumption)
2. Increased Vehicles per Household
Following the initial report, some comments were received that even the increased census-
based vehicle rates were too low for the typical vehicles per household conditions seen in
Cape May County. As such, a new alternative was tested using the following vehicles rates:
Type of Housing Unit Vehicles per Household Rate (& Source)
Permanent 3.0 (Assumption)
Seasonal 3.0 (Assumption)
Hotel / Motel 1.0 (Assumption)
Campgrounds: 1.0 (Assumption)
II.2.4 Routing Assumptions
Once the number and originating location of the evacuating vehicles is know, there must be an
estimate of how many vehicles would be evacuating using the NJ 47/347 corridor. In all cases, the
housing unit location was deemed the origin point for the evacuating trip. Adding to the initial
study, two options of vehicle usage of the NJ 47/347 corridor are tested here:

1. Balanced NJ 47/347 and Other Corridor Routing:
Used in the initial study, this routing option assumed that traffic exiting from the barrier
islands was allowed to use both the study corridor of NJ 47/347 and other routes (including
the US 9 / Garden State Parkway corridor and the NJ 50 / NJ 49 corridors) for evacuation.
The percentage of vehicles using the NJ 47/347 corridor was based on the originating
evacuation location and the total roadway capacity of evacuation roadways from the county.
In this assumption, a balance of traffic among all potential evacuation corridors for the
region was sought. This requires that the other corridors are operating under acceptable
conditions and that they are available for use by some of the evacuees from the barrier
islands.
2. Heavy NJ 47/347 Routing:
This alternative assumes that all (100%) barrier island traffic from Avalon and south and all
mainland traffic south of NJ 83 will evacuate via the study corridor of NJ 47/347, and none
of this traffic will be evacuated via other corridors. Traffic from the barrier islands north of NJ
83 (Sea Isle City and north) are assumed to be evacuated (100%) via other routes as in the
previous option. This alternative tests the worst case conditions that would exist if the other
evacuation corridors from the region, including the Garden State Parkway, US 9, NJ 49, NJ
50, and the Atlantic City Expressway, were overwhelmed and no additional capacity existed
to help evacuate the majority of the Cape May peninsula population.
II.2.5 Hurricane Intensity
The strength of the hurricane striking the region has a significant impact on the percentage of
people that will participate in the evacuation versus the percentage that will stay at home and try to
ride out the storm. The factors affecting whether or not someone will participate in the evacuation
include the type of housing unit and the relative threat of inundation from the storm. People in
permanent housing units are much more likely to remain in an attempt to secure and protect their
property. Persons occupying seasonal housing units (including seasonal rentals and hotel / motel
units) are much more likely to leave for safer ground. Mobile home units, which may be either
permanent or seasonal, have different participation rates due to the added threat of hurricane
strength winds. All occupied campsites are always assumed to evacuate, regardless of the threat of
inundation. Voluntary evacuations will also occur from housing units where the threat of inundation
by storm surge is not high, but other dangers from a hurricane still exist. The participation rates
used are those that were developed from surveys conducted for the Delmarva Evacuation Study.
1. Category 1 Hurricane:
In this scenario, the evacuation prior to a category 1 hurricane strike is examined. The
scenario includes the evacuation of all category 1 inundation areas, plus volunteer evacuees
based on the participation rates for a category 1 storm.
Category 1 Hurricane Inundation Permanent Mobile Seasonal Campgrounds
Level Units Homes Units Units 1 100% 100% 100% 100% 2 2% 70% 90% 100% 3 1% 50% 50% 100% 4 1% 50% 50% 100%
No Flood 1% 50% 50% 100%
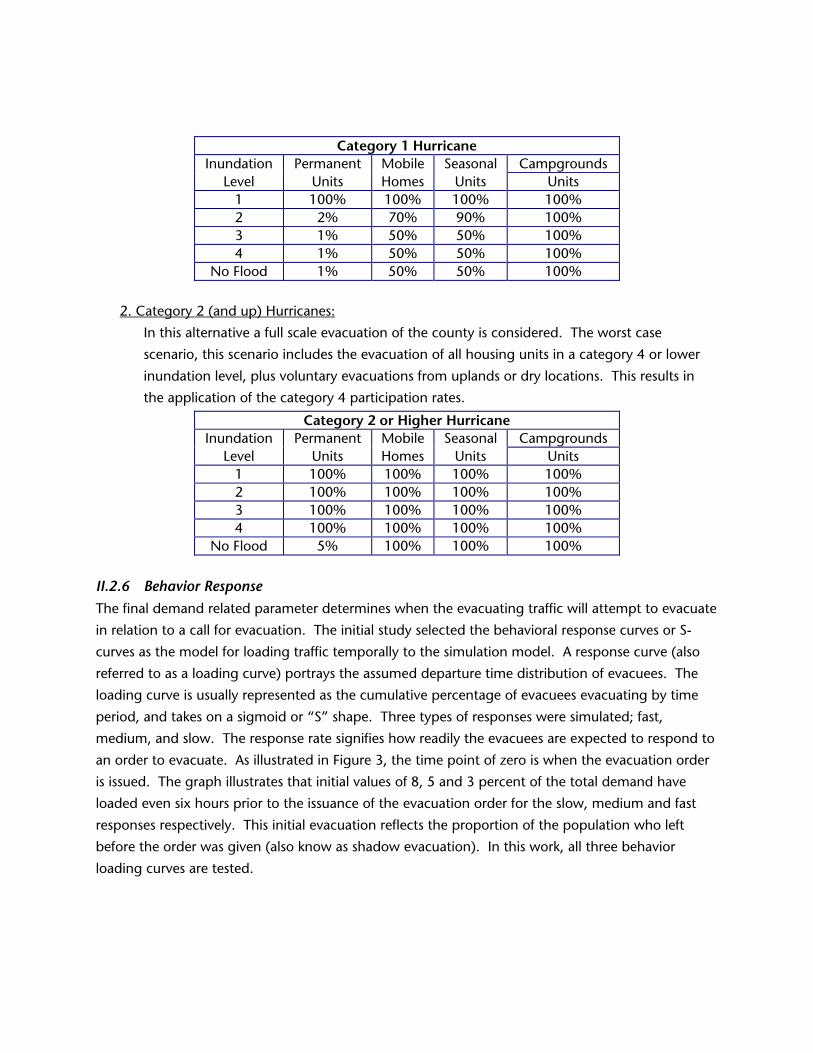
2. Category 2 (and up) Hurricanes:
In this alternative a full scale evacuation of the county is considered. The worst case
scenario, this scenario includes the evacuation of all housing units in a category 4 or lower
inundation level, plus voluntary evacuations from uplands or dry locations. This results in
the application of the category 4 participation rates.
Category 2 or Higher Hurricane Inundation Permanent Mobile Seasonal Campgrounds
Level Units Homes Units Units 1 100% 100% 100% 100% 2 100% 100% 100% 100% 3 100% 100% 100% 100% 4 100% 100% 100% 100%
No Flood 5% 100% 100% 100%
II.2.6 Behavior Response
The final demand related parameter determines when the evacuating traffic will attempt to evacuate
in relation to a call for evacuation. The initial study selected the behavioral response curves or S-
curves as the model for loading traffic temporally to the simulation model. A response curve (also
referred to as a loading curve) portrays the assumed departure time distribution of evacuees. The
loading curve is usually represented as the cumulative percentage of evacuees evacuating by time
period, and takes on a sigmoid or “S” shape. Three types of responses were simulated; fast,
medium, and slow. The response rate signifies how readily the evacuees are expected to respond to
an order to evacuate. As illustrated in Figure 3, the time point of zero is when the evacuation order
is issued. The graph illustrates that initial values of 8, 5 and 3 percent of the total demand have
loaded even six hours prior to the issuance of the evacuation order for the slow, medium and fast
responses respectively. This initial evacuation reflects the proportion of the population who left
before the order was given (also know as shadow evacuation). In this work, all three behavior
loading curves are tested.

0%
10%
20%
30%
40%
50%
60%
70%
80%
90%
100%
-6 -4 -2 0 2 4 6 8 10 12 14 16 18 20 22 24
Time (hr)
Cum
ulat
ive
Perc
enta
ge L
oade
d
Slow
Medium
Fast
Figure 3. Behavioral Response Curves
II.3 Combined Analysis Scenarios All combinations of the alternatives were tested. Thus, a total of 144 scenarios were analyzed based
on all permutations of the study parameters:
3 Traffic Operations / Network Conditions
x 2 Area Population
x 2 Evacuating Vehicles per Household Assumptions
x 2 Routing Assumptions
x 2 Hurricane Intensity
x 3 Behavior Response Profiles
= 144 Scenarios
In the initial study, 24 scenarios contained within this list were analyzed. This left the remaining 120
scenarios to be tested under this extension effort. In addition, to account for the stochastic nature
of traffic simulation analysis, three different simulations using random seeds were conducted for
each scenario. The three simulations were then averaged to determine the total evacuation time for
the scenarios.

II.4 Evacuation Results The higher evacuation demands for the NJ 47/347 corridor resulted in much higher total evacuation
times than the initial scenarios tested in the initial study. The total evacuation times for the corridor
now vary from 16 to 89 hours. The large degree of variance accounts for the newly tested
parameters that have a dramatic increase on the amount of population assumed to evacuate
through the NJ 47/347 corridor.
Table 1 summarizes the total evacuation time required under the assumed demand scenarios for all
three network configurations for a fast behavior response to the call to evacuate. Similarly, Tables 2
and 3 summarize, respectively, the total evacuation times required for a medium and slow behavior
response.
The ineffectiveness of the current contraflow or lane reversal plan (between NJ 83 and NJ 55) is
reiterated. The extended contraflow scenarios (GSP to NJ 55) show dramatic potential in evacuating
the county’s population, especially when the higher vehicle per household rates and the maximum
routing of vehicles into the NJ 47/347 corridor is assumed.
Based on these results, the extension of the lane reversal section to the current planned southern
terminus of NJ 83 is highly encouraged. The potential exists to shorten the worst case evacuation
scenario from 89 hours to 40 hours. Given the speed of which hurricanes often approach the mid-
Atlantic region and the resulting notice that could be given of a potential hurricane strike, the
difference could mean the lives of tens of thousands.

Table 1. Total Evacuation Times Assuming a Fast Behavior Response
Demand Scenarios Fast Behavior Response
Season Storm Category
Vehicles Rates
Routing Assumption
No Lane Reversal
Current Contraflow
Extended Contraflow
Current Contraflow
Savings
Extended Contraflow
Savings
Off-Peak Cat. 1 Census Balanced 16.4 16.4 16.4 0.0 0.0
Off-Peak Cat. 1 Assumed Balanced 16.5 16.5 16.5 0.0 -0.1
Off-Peak Cat. 1 Census Max to 47 20.2 20.0 16.5 0.2 3.6
Off-Peak Cat. 1 Assumed Max to 47 37.9 37.7 19.2 0.2 18.5
Off-Peak Cat. 2+ Census Balanced 16.5 16.5 16.5 0.0 0.0
Off-Peak Cat. 2+ Assumed Balanced 24.6 24.5 16.4 0.1 8.1
Off-Peak Cat. 2+ Census Max to 47 32.4 32.1 16.8 0.3 15.3
Off-Peak Cat. 2+ Assumed Max to 47 59.9 59.0 29.3 0.9 29.7
Peak Cat. 1 Census Balanced 16.5 16.5 16.5 0.0 0.0
Peak Cat. 1 Assumed Balanced 27.1 27.0 16.5 0.2 10.4
Peak Cat. 1 Census Max to 47 33.3 32.7 16.7 0.6 16.0
Peak Cat. 1 Assumed Max to 47 64.5 63.4 29.4 1.1 34.1
Peak Cat. 2+ Census Balanced 20.9 20.4 16.5 0.5 3.9
Peak Cat. 2+ Assumed Balanced 36.5 36.2 19.0 0.3 17.2
Peak Cat. 2+ Census Max to 47 46.9 45.9 21.9 1.1 24.0
Peak Cat. 2+ Assumed Max to 47 88.8 87.0 39.3 1.7 47.7

Table 2. Total Evacuation Times Assuming a Medium Behavior Response
Demand Scenarios Medium Behavior Response
Season Storm Category
Vehicles Rates
Routing Assumption
No Lane Reversal
Current Contraflow
Extended Contraflow
Current Contraflow
Savings
Extended Contraflow
Savings
Off-Peak Cat. 1 Census Balanced 21.5 21.5 21.5 0.0 0.0
Off-Peak Cat. 1 Assumed Balanced 21.5 21.5 21.5 0.0 0.0
Off-Peak Cat. 1 Census Max to 47 21.5 21.5 21.6 0.0 0.0
Off-Peak Cat. 1 Assumed Max to 47 37.4 37.4 21.6 0.1 15.8
Off-Peak Cat. 2+ Census Balanced 21.5 21.5 21.5 0.0 0.0
Off-Peak Cat. 2+ Assumed Balanced 24.7 24.5 21.5 0.3 2.9
Off-Peak Cat. 2+ Census Max to 47 32.0 31.8 21.5 0.2 10.3
Off-Peak Cat. 2+ Assumed Max to 47 58.4 57.8 29.3 0.6 28.5
Peak Cat. 1 Census Balanced 21.5 21.5 21.5 0.0 0.0
Peak Cat. 1 Assumed Balanced 28.0 27.5 21.5 0.5 5.9
Peak Cat. 1 Census Max to 47 32.5 32.2 21.5 0.3 10.6
Peak Cat. 1 Assumed Max to 47 62.9 61.8 29.4 1.2 32.3
Peak Cat. 2+ Census Balanced 22.4 22.3 21.6 0.1 0.7
Peak Cat. 2+ Assumed Balanced 36.1 35.8 21.5 0.3 14.3
Peak Cat. 2+ Census Max to 47 46.1 45.2 22.6 0.9 22.6
Peak Cat. 2+ Assumed Max to 47 86.7 84.9 39.0 1.8 45.9

Table 3. Total Evacuation Times Assuming a Slow Behavior Response
Demand Scenarios Slow Behavior Response
Season Storm Category
Vehicles Rates
Routing Assumption
No Lane Reversal
Current Contraflow
Extended Contraflow
Current Contraflow
Savings
Extended Contraflow
Savings
Off-Peak Cat. 1 Census Balanced 24.5 24.5 24.5 0.0 0.0
Off-Peak Cat. 1 Assumed Balanced 24.5 24.5 24.5 0.0 0.0
Off-Peak Cat. 1 Census Max to 47 24.5 24.5 24.5 0.0 0.0
Off-Peak Cat. 1 Assumed Max to 47 37.6 37.5 24.6 0.0 13.0
Off-Peak Cat. 2+ Census Balanced 24.5 24.5 24.5 0.0 0.0
Off-Peak Cat. 2+ Assumed Balanced 26.1 26.0 24.5 0.2 1.5
Off-Peak Cat. 2+ Census Max to 47 32.6 32.4 24.5 0.2 7.9
Off-Peak Cat. 2+ Assumed Max to 47 57.6 57.2 30.1 0.4 27.1
Peak Cat. 1 Census Balanced 24.5 24.5 24.5 0.0 0.0
Peak Cat. 1 Assumed Balanced 29.3 28.8 24.5 0.5 4.3
Peak Cat. 1 Census Max to 47 33.1 32.6 24.5 0.5 8.1
Peak Cat. 1 Assumed Max to 47 62.1 61.0 30.4 1.1 30.6
Peak Cat. 2+ Census Balanced 24.5 24.5 24.5 0.0 0.0
Peak Cat. 2+ Assumed Balanced 36.6 36.1 24.5 0.4 11.6
Peak Cat. 2+ Census Max to 47 45.9 45.0 24.6 1.0 20.4
Peak Cat. 2+ Assumed Max to 47 84.6 83.1 39.2 1.5 43.9

Figure 4. Cumulative Percentage Evacuated by Hour for a Category 2+ Peak Season Hurricane Strike
Assuming a High Vehicle per Household Rates and a Balanced Routing between NJ 47/347 and Other Routes
Hours after Call for Evacuation
Cum
ulat
ive
Perc
enta
ge
of
Veh
icle
eva
cuat
ed v
ia N
J 47/
347
Co
rrid
or

Cape May County Hurricane Evacuation and Elevation Study Extension DRAFT FINAL REPORT
National Center for Transportation and Industrial Productivity New Jersey Institute of Technology
Page 1
III Elevation Survey
As Cape May County has such a low topography, the potential for inundation from hurricane storm
surges is great. This greatly complicates evacuation issues, as a critical issue in any evacuation plan
is to determine which roadways would be available to carry out the evacuation plan, including
providing access for both evacuees and for emergency vehicle access. The initial study determined
the elevations and degree of inundation for the NJ 47/347 corridor. The survey work completed
under this work effort does the same for the key feeder roadways into the NJ 47/347 evacuation
corridor. The analysis of both sets of survey results follows.
III.1 Selection of Roadways
The following roadways were selected by examining the official evacuation routes that pass through
low-lying areas, as well as non-evacuation routes that could be prove useful for persons evacuating
via the NJ 47/347 Corridor.
Cape May County Route 657: Dennisville Rd (Est. Length: 3.0 Miles)
From CO 646 (Swainton-Goshen Rd) to NJ 47 (Delsea Rd)
Cape May County Route 603: Bayshore Rd (Est. Length: 3.0 Miles)
From CO 654 (Fulling Mill Rd) to NJ 47 (Delsea Rd)
Cape May County Route 615: Goshen Rd (Est. Length: 4.3 Miles)
From CO 654 (Mechanic St) to NJ 47 (Delsea Rd)
Cape May County Route 618: Indian Trail Rd (Est. Length: 3.2 Miles)
From US 9 (Shore Rd) to NJ 47 (Delsea Rd)
Cape May County Route 658: Hand Ave (Est. Length: 3.0 Miles)
From CO 654 (Fulling Mill Rd) to NJ 47 (Delsea Rd)
The total length of roadway covered by the above sections is approximately 16.5 miles. The survey
roadways are illustrated highlighted in yellow in the following Figure 5, which overlays the estimated
inundation zones of different categories of hurricane strikes.

Cape May County Hurricane Evacuation and Elevation Study Extension DRAFT FINAL REPORT
National Center for Transportation and Industrial Productivity New Jersey Institute of Technology
Page 2
Figure 5: Roadways Selected for GPS Elevation Survey (shown with HES inundation levels)

Cape May County Hurricane Evacuation and Elevation Study Extension DRAFT FINAL REPORT
National Center for Transportation and Industrial Productivity New Jersey Institute of Technology
Page 3
III.2 Methodology III.2.1 Kinematic GPS Survey
The kinematic GPS survey mode provides the ability to establish positions and elevations of new
points while a GPS receiver is in motion. A second stationary GPS receiver at a nearby benchmark
location (with known horizontal positions/coordinates and elevation) that provides accuracy control
for other newly established points. The survey was completed on June 11, 2007. During the initial
study, the needed level of accuracy was found to be achievable even when the vehicle was moving
at reasonable speeds along the roadway. As such, the survey conducted for this work effort was
completed without a safety escort vehicle. The surveyed elevation points were combined with
those surveyed from the initial study to produce the maps and analysis that follows. An electronic
copy of the survey points and the accompanying analysis of each survey point is available and was
delivered along with this report.
III.2.2 Storm Surge Elevations
The storm surge elevations for different hurricane categories were obtained from the Hurricane
Evacuation Study or HES map (June 2006 version) produced by the Philadelphia District of the U.S.
Army Corps of Engineers (USACE). The map shows storm surge elevations at selected points around
Cape May County and the areas that are predicted to be inundated by the anticipated storm surge
from different categories of hurricanes. The HES maps list elevations in the NGVD’29 (National
Geodetic Vertical Datum of 1929) datum rather than in NAVD’88 (North American Vertical Datum
of 1988) datum which is the vertical datum currently used by NJDOT. The difference between these
vertical (elevation) datums is more than one foot in the Cape May area. Given the general
characteristics of the area (very flat topography), an elevation error of one foot could have a
significant impact on whether the roadways are passable or not. Therefore, a datum conversion
from NAVD’88 to NGVD’29 was performed for the GPS surveyed elevations in order to ensure
compatibility with the information provided by the USACE.
III.3 Survey Results
In order to determine what category of hurricane would cause storm surges to inundate the
surveyed roadways, the storm surge predictions (reported at various points around the region on
the HES maps) were transcribed to the surveyed elevations. For each of the surveyed points, the
nearest of these ‘surge points’ was selected. For survey points east of the high point ‘ridgeline’ that
runs down the middle of the peninsula, surge points from the bayside of the barrier islands were
used. For the survey points west of the highest point on the peninsula, surge points from the

Cape May County Hurricane Evacuation and Elevation Study Extension DRAFT FINAL REPORT
National Center for Transportation and Industrial Productivity New Jersey Institute of Technology
Page 4
bayside of the peninsula were used. The resulting mapping of the HES storm surge prediction
points to the surveyed roadway elevation points is shown in Figure 6.
Figure 6: Mapping the HES Storm Surge Prediction Points
to the Surveyed Roadway Elevation Points

Cape May County Hurricane Evacuation and Elevation Study Extension DRAFT FINAL REPORT
National Center for Transportation and Industrial Productivity New Jersey Institute of Technology
Page 5
After determining the level of storm surge that would be experienced for the surveyed roadways, the GPS elevation points were classified as being always dry or always inundated at a given hurricane category. For example, if the HES map showed storm surge elevations of 4, 6, 8 and 10 feet for hurricane categories 1, 2, 3 and 4, respectively, and the GPS point was at elevation 11.25 feet, this point was deemed to remain dry under any conditions. If, however, the GPS point was at elevation 6.48 feet, it was classified as a point that will be inundated in the event of a hurricane of level 3. The results of the classification of the GPS surveyed points into various hurricane categories are shown in Figure 7. Within this figure, the color of the survey point along the roadways indicates the lowest category of hurricane for which the storm surge would inundate the roadway. The survey and analysis reveals that the majority of the surveyed roadways will remain passable during a category 1 hurricane, however, there were surveyed locations in each of the roadways that would be flooded from a category 1 hurricane strike. These locations correspond with the low points predicted by the HES maps. This reiterates the findings from the initial study that the HES maps are a good tool in predicting the category of hurricane that would inundate the regions roadways. However, for a roadway to be used as an evacuation route, the entire length must be passable. The fact that all the surveyed roadways will be at least partially impassable during the peak levels of a storm surge from a category 1 hurricane, indicates the importance of having a evacuation plan in place that allows enough time for evacuation before the maximum storm surge levels are reached.

Cape May County Hurricane Evacuation and Elevation Study Extension DRAFT FINAL REPORT
National Center for Transportation and Industrial Productivity New Jersey Institute of Technology
Page 6
Figure 7: Category of Storm to Inundate the Surveyed Roadways

Cape May County Hurricane Evacuation and Elevation Study Extension DRAFT FINAL REPORT
National Center for Transportation and Industrial Productivity New Jersey Institute of Technology
Page 7
IV REFERENCES
1. Chien, I-Jy, and E. Keir Opie, “Analysis and Modeling of Cape May County Roadway Elevations and Evacuation Routes”, June 2006.
2. New Jersey Office of Emergency Management (NJOEM), “Routes 47/347 Reverse Lane
Plan”, July 2004.
3. Ozbay, K., and M.A. Yazici and S. I-Jy Chien, “Study Of The Network-Wide Impact Of Various Demand Generation Methods Under Evacuation Conditions”, TRB Annual Meeting, Washington, D.C., 2006.
4. New Jersey Hurricane Evacuation Study (HES) Draft Maps and Data, US Army Corps of
Engineers Website, www.nap.usace.army.mil/HES/nj/maps/Capemay_Vul_HSG_Units_06June14.pdf
5. U.S. Army Corps of Engineers, “Delmarva Hurricane Evacuation Study”, 2003.