
CAPE LAMBERT RESOURCES LIMITED ABN 71 095 047 920 AND … · Guinea, ote d’Ivoire, ongo, South...
79
CAPE LAMBERT RESOURCES LIMITED ABN 71 095 047 920 AND ITS CONTROLLED ENTITIES Annual Report For the Year Ended 30 June 2019 For personal use only
Transcript of CAPE LAMBERT RESOURCES LIMITED ABN 71 095 047 920 AND … · Guinea, ote d’Ivoire, ongo, South...

CAPE LAMBERT RESOURCES LIMITED
ABN 71 095 047 920
AND ITS CONTROLLED ENTITIES
Annual Report For the Year Ended
30 June 2019
For
per
sona
l use
onl
y

ANNUAL REPORT 2019
CONTENTS
Corporate Directory 1
Principal Activities and Review of Operations 2
Directors' Report 6
Auditor’s Independence Declaration 19
Corporate Governance Statement 20
Consolidated Statement of Profit or Loss and Other Comprehensive Income 21
Consolidated Statement of Financial Position 22
Consolidated Statement of Changes in Equity 23
Consolidated Statement of Cash Flows 25
Notes to the Consolidated Financial Statements 26
Directors' Declaration 69
Independent Auditor’s Report 70
Additional Stock Exchange Information 75
For
per
sona
l use
onl
y

ANNUAL REPORT 2019
CORPORATE DIRECTORY
1
Directors Bankers Mr Tony Sage - Executive Chairman National Australia Bank Mr Tim Turner - Non-Executive Director 100 St George’s Terrace Mr Stefan Müller - Non-Executive Director Perth, WA 6000 Company Secretary Auditors Ms Melissa Chapman BDO Audit (WA) Pty Ltd 38 Station Street Stock Exchange Listing Subiaco, WA 6008 Australian Securities Exchange Tel: +61 8 6382,4600 ASX code: CFE Fax: +61 8 6382 4601 Website Share Registry www.capelam.com.au Computershare Investor Services Pty Limited Level 11 Country of Incorporation 172 St Georges Terrace Australia Perth, WA 6000 AUSTRALIA Registered Address Tel: 1300 85 05 05 (Australia) 32 Harrogate Street +61 3 9415 4000 (Overseas) West Leederville, WA 6007 Australia Tel: +61 8 9380 9555
For
per
sona
l use
onl
y

ANNUAL REPORT 2019
PRINCIPAL ACTIVITIES AND REVIEW OF OPERATIONS
2
Marampa Project
The Marampa Iron Ore Project (Marampa) is a brownfields hematite iron ore project that remains at the development and permitting stage and is located 90 km northeast of Freetown in Sierra Leone, West Africa (Figure 1). Marampa comprises one mining licence (ML05/2014) comprising 97.40km2 and one granted exploration licence (EL46A/2011 – 145.86km2). The licences are held by Marampa Iron Ore (SL) Limited (MIOL), indirectly a wholly owned subsidiary of the Company. Marampa has access to a stockpiling and ship loading facility located at Pepel Port via a 73km railway operated by African Railway and Port Services (SL) Limited (ARPS). For further detailed information on Marampa refer to ASX announcement dated 31 July 2013.
Figure 1: Regional Map showing the Company's Assets in Sierra Leone
In its September 2018 quarterly, the Company reported that it had received a letter from the Sierra Leone Ministry of Mines (MoM) informing MIOL of the cancellation of the Marampa mining license ML05/2014 due to non-payment of fees. In September 2014, Marampa SL had submitted to the MoM an application letter entitled “Force Majeure to all Cape Lambert Operations in Sierra Leone” which was acknowledged by the MoM. The Company understood that the agreement with the MoM was that force majeure events were acknowledged and authorised and as such no fees would accrue or be payable until a processing facility was operating and Marampa SL was producing iron ore from Marampa.
For
per
sona
l use
onl
y

ANNUAL REPORT 2019
PRINCIPAL ACTIVITIES AND REVIEW OF OPERATIONS
3
The Company believed that the notice of cancellation of license letter had been incorrectly issued by the new Sierra Leone government who were not aware of the agreement. In order to protect it’s position, Marampa SL engaged Sierra Leone based lawyers BMT Law Chambers who commenced legal action in the High Court of Sierra Leone against the cancellation of the licence. In August 2019, the Company announce that the relatively high iron price throughout 2019 has resulted in third parties showing an interest in the Marampa Project and therefore the Company would refocus its efforts in pursuing the interested third parties and others with the hope of progressing the Marampa Project to development. The Company has commenced the process for reinstatement of the relevant licences. Kukuna Project
The Kukuna Project (Kukuna) is located 120 km northeast of Freetown in the northwest of Sierra Leone and comprises one exploration licence covering 68km2 (refer Figure 1). The licence area is located approximately 70km due north of Marampa. The Kukuna Project remains under care and maintenance. Kipushi Copper-Cobalt Project (JV with Paragon Mining SARL)
The Kipushi Cobalt Copper Tailings Project consisted of a tailings dam located on PE 12347 and the Kipushi Processing Plant located adjacent mining licence PE481 (Kipushi Project), located approximately 25km from Lubumbashi, the second largest city in the Democratic Republic of Congo DRC. The Company had a 50/50 joint venture agreement with Paragon Mining SARL (Paragon) to develop the project via the joint venture company is Soludo Lambert Mining SAS (Soludo Lambert). Paragon’s 70% interest in the Kipushi Project was via a contract it had with La Patience SPRL (Patience), which gave Paragon the right to exploit and process the tailings from the Kipushi TSF and sell the product. Late H1 2018, Soludo Lambert had engaged the services of Minnovo Pty Ltd (Minnovo) to undertake the detailed design of a 1Mtpa leaching plant to process the tailings from the Kipushi tailings dam. The detailed design work progressed through H2 2018 and included the tendering of major equipment required for the project, as well as tendering the civil construction works that were scheduled to commence Q4 2018. On 8 January 2019, the Company’s securities were suspended from official quotation pending an announcement on the Project, and in particular the security of tenure over the Kipushi tailings. In May 2019, the Company announced that it was informed in Q4 2018 that Patience had purported to terminate its agreement with Paragon, on the basis of delays in the production timeline that had resulted from the development change of repairing the existing flotation plant to a much more efficient leaching plant. Whilst a leaching plant provided better Project financial outcomes, this has delayed the revenues Patience, and State-owned mining company La Générale des Carrières et des Mines (Gecamines), had anticipated receiving from the Project in 2018. Paragon disputed the purported termination. Due to the concerns raised, the Company had minimized the work undertaken on the Kipushi Project, pending a resolution of the matter. In May 2019, the Company announced that Paragon and Patience had reached a commercial settlement and executed a settlement agreement (Settlement Agreement). The Settlement Agreement reconfirmed the terms of the contractual arrangement that Patience had with Paragon for the exploitation of the tailings from the Kipushi TSF, which provided the security of tenure for the Project to recommence and move forward. The Settlement Agreement is subject to the Company providing certain warranties as outlined below. These warranties were negotiated in parallel with the Settlement Agreement and reflect the basis of the Soludo Lambert joint venture arrangement whereby the Company was responsible for funding the working capital and capital costs of the Project.
For
per
sona
l use
onl
y

ANNUAL REPORT 2019
PRINCIPAL ACTIVITIES AND REVIEW OF OPERATIONS
4
Subsequent to the year end, in August 2019, the Company announced that it had been unable to source project funding for the development of the Kipushi Project and that as no more extensions were being granted by Paragon to enable the Company to source project funding, the joint venture agreement with Paragon had been terminated. Kitwe Tailings Project The Kitwe Tailings Project is an historic cobalt-copper rich tailings dump located on exploration licence No 21853-HQ-SEL (Licence) approximately 3km on the outskirts of Kitwe in Zambia. The Licence is held by Zambian entity Australian Mining Company Zambia Limited (AMCZL). The Company had an interest in the Kipushi Tailings Project via a renegotiated agreement executed with AMCZL on 3 May 2018, which included the requirement for the Company to make stipulated Milestone Payments. During September 2018, the Company completed an air core drilling programme at the project, with 114 holes drilled for a total of 1082m. In its March 2019 quarterly, the Company announced that After completion of review and interpretation of the assay data from the drilling programme the Company had elected not to pay the Milestone Payments due and withdrew from the Kitwe Tailings Project. Wee MacGregor Project
Mining International Pty Ltd (Mining International) is a fully owned subsidiary of Cape Lambert. The Company holds tenure to 4 mining leases and 4 granted exploration permits for minerals (EPM’s) at the Wee MacGregor Project located 40 km southeast of Mt Isa in Queensland (refer Figure 2). The total granted land package covers an area of approximately 124km2. The tenements are located within in the Eastern Fold Belt of the Mt Isa inlier. The eastern-most tenements are located in the Mary Kathleen Zone/Wonga Sub-province. The western group of tenements are located in the Kalkadoon Leichhardt Belt. These areas are prospective for a variety of deposit types, most notably structurally controlled epigenetic copper and gold deposits. Cohiba Minerals Limited (Cohiba) has a Farm-in agreement with the Company for mining licences ML 2504, ML 2773 and ML 90098. In August 2018, Cohiba announced that results from its first phase drilling programme at Wee Macgregor had returned encouraging results. Results reported included:
Hole GC5: 8-10m 1.2% Cu 10-12m 1.38% Cu
Hole WM03: 2-4m 2.15% Cu, 0.063% Co, 1.1ppm Au 4-6m 1.49% Cu, 0.066% Co, 1.3ppm Au
On 10 December 2018, Cohiba announced more results from its first phase drilling programme at Wee Macgregor had returned encouraging results. Results reported included:
Hole WM03c: 0-1m 1,76% Cu 2-4m 7.03% Cu, 0.1% Co, 1.34ppm Au 8-10m 1.2% Cu, 0.05% Co
Hole WM04: 0-10m 2.84% Cu, 0.5ppm Au, 0.063% Co
(refer Cohiba ASX announcements dated 30 August 2018 and 10 December 2018 for further detail). No other activities were reported on the Project.
For
per
sona
l use
onl
y

ANNUAL REPORT 2019
PRINCIPAL ACTIVITIES AND REVIEW OF OPERATIONS
5
Figure 2: Wee MacGregor Project Location and Geology
Competent Persons Statement
The contents of this Report relating to Exploration Results are based on information compiled by Olaf Frederickson, a
Member of the Australasian Institute of Mining and Metallurgy. Mr Frederickson is a consultant to Cape Lambert and
has sufficient experience relevant to the style of mineralisation and the deposit under consideration and to the activity he
is undertaking to qualify as a Competent Person, as defined in the 2012 edition of the “Australasian Code for Reporting
of Exploration Results, Mineral Resources and Ore Reserves”. Mr Frederickson consents to the inclusion in this report
of the matters compiled by him in the form and context in which they appear.
For
per
sona
l use
onl
y

ANNUAL REPORT 2019
DIRECTORS’ REPORT
6
Your Directors submit the financial report of Cape Lambert Resources Limited (Cape Lambert or the Company) and its controlled entities (collectively referred to as the Group) for the year ended 30 June 2019. DIRECTORS In order to comply with the provisions of the Corporations Act 2001, the directors report as follows: The names and details of the Company’s directors in office during the financial year and until the date of this report are as follows. Directors were in office for this entire period unless otherwise stated. Tony Sage Tim Turner Stefan Müller
Tony Sage Executive Chairman Qualifications B.Com, FCPA, CA, FTIA Experience Mr Sage has in excess of 30 years’ experience in the fields of corporate advisory
services, funds management and capital raising. Mr Sage is based in Western Australia and has been involved in the management and financing of listed mining and exploration companies for the last 20 years. Mr Sage has operated in Argentina, Brazil, Peru, Romania, Russia, Sierra Leone, Guinea, Cote d’Ivoire, Congo, South Africa, Indonesia, China and Australia. Mr Sage is currently Chairman of ASX-listed Australian companies, Cape Lambert Resources Ltd (which was AIM Company of the year in 2008), European Lithium Limited and Fe Ltd. Mr Sage is also a Non-Executive Director of National Stock Exchange of Australia (NSX) listed International Petroleum Ltd. Mr Sage is also the sole owner of A League football club Perth Glory that plays in the National competition in Australia.
Directorships of listed Cauldron Energy Limited June 2009 to November 2018 companies held within the Fe Limited August 2009 to Present last 3 years International Petroleum Limited¹ January 2006 to Present European Lithium Limited September 2016 to Present Caeneus Minerals Limited December 2010 to 18 January 2016 -
¹ Listed on the National Stock Exchange of Australia
Interest in Shares & Options at the date of this report
Fully Paid Ordinary Shares 77,766,681
Tim Turner Non-Executive Director, Chairman of Remuneration Committee Qualifications B.Bus, FCPA, FTIA, Registered Company Auditor Experience Timothy Turner is the senior partner of accounting and advisory Firm, HTG Partners.
Mr Turner heads the audit and assurance division and is responsible for the issue of
For
per
sona
l use
onl
y

ANNUAL REPORT 2019
DIRECTORS’ REPORT
7
audit opinions for self-managed superannuation funds through to full reporting entities. He also has in excess of 30 years’ experience in business development, structuring and general business consultancy.
Timothy has a Bachelor of Business (Accounting), is a Registered Company, SMSF and Organisation Auditor, is a Fellow of CPA Australia and a Fellow of the Tax Institute of Australia.
With over 15 years’ experience on listed company boards and 30 years’ experience in the Australian accounting, taxation and business fields, Mr Turner brings a wealth of experience and knowledge in corporate compliance, governance and corporate manoeuvring
Directorships of listed International Petroleum Limited1 January 2006 to Present companies held within the Petronor E&P² November 2007 to Present last 3 years Legacy Iron Ore Limited July 2008 to August 2017 ¹ Company listed on the National Stock Exchange of Australia
² Company delisted from the National Stock Exchange of Australia December 2015 to list on the Oslo Stock Exchange, previously named African Petroleum Ltd
Interest in Shares & Options at the date of this report
Fully Paid Ordinary Shares
1,523,000
Mr Stefan Müller Non-Executive Director, Remuneration Committee member Qualifications Executive Program, INSEAD Experience Mr Muller has extensive financial markets and investment banking knowledge and
experience built over his 25-year career. Mr. Müller is CEO and founder of DGWA Deutsche Gesellschaft für Wertpapieranalyse GmbH, a boutique European investment and financial markets consulting firm for national and international SMEs based in Frankfurt, Germany. Mr. Müller began his career at Dresdner Bank AG as senior vice president of global equity trading. He held senior positions with Equinet AG, Bankhaus Sal Oppenheim (largest European private bank at that time) as Head of global proprietary trading and managing partner at Proprietary Partners AG, a Swiss based hedge fund advisory company.
Directorships of listed European Lithium Limited October 2017 to present companies held within the Jadar Lithium Limited July 2018 to present last 3 years Interest in Shares & Options at the date of this report
Fully Paid Ordinary Shares
3,500,000
COMPANY SECRETARY Ms Chapman is a certified practising accountant with over 15 years of experience in the mining industry. She has worked extensively in Australia and the United Kingdom. Ms Chapman has a Bachelor of Accounting from Murdoch University and has been a member of CPA Australia since 2000. Melissa has completed a Graduate Diploma of Corporate Governance with the Governance Institute of Australia, and the company directors course with the Australian Institute of Company Directors. Ms Chapman is a director of Bellatrix Corporate Pty Ltd (Bellatrix), a company that provides company secretarial and accounting services to a number of ASX Listed companies.
For
per
sona
l use
onl
y

ANNUAL REPORT 2019
DIRECTORS’ REPORT
8
DIVIDEND AND RETURN OF CAPITAL No dividend was declared or paid during the current or prior year. REVIEW OF RESULTS AND OPERATIONS Principal Activity The principal activity of the Group during the year was mineral investment, exploration and evaluation. There were no significant changes in the nature of the principal activity during the year. Review of Operations A summary of the most significant transactions during the year ended 30 June 2019 is set out below: Kitwe Tailings Project – Zambia On 22 May 2017, the Company announced that it had executed a binding terms sheet to conditionally acquire 70% of the shares in Zambian entity Australian Mining Company Zambia Limited (Seller or AMCZL), which is the holder of exploration licence No 21853-HQ-SEL (Licence or Kitwe Project) (Acquisition). The Licence covers an historic cobalt-copper rich tailings dump located near Kitwe in Zambia (refer ASX announcement dated 22 May 2017). The Kitwe Project is located approximately 3km from the outskirts of Kitwe, in the Copperbelt region of Zambia. Kitwe is the second largest city, in terms of size and population, in Zambia and is one of the most developed commercial and industrial areas in the nation, alongside Ndola and Lusaka. The Copperbelt is centered around the towns of Ndola, Kitwe, Chingola, Luanshya and Mufulira – a string of towns on Zambia's northern border with the Democratic Republic of Congo. The original share sale agreement was executed on 4 December 2017. Due to some frustration to the completion process by the Zambian authorities and then by AMCZL, following discussions with AMZCL, the terms of the transaction were renegotiated and a new share sale agreement executed on 3 May 2018. Under the terms of the new agreement (Agreement), Cape Lambert will acquire a 60% interest in the Project on satisfaction of the following:
• Payment of US$150,000 on execution of the Agreement (of which US$50,000 had already been paid);
• Milestone Payments of: o US$300,000 payable on the later of AMZCL entering in to an agreement with the owner of an adjacent
licence to allow the storage of processed tailings from the Project on a portion of its license area or 3 months from the date of execution of the Agreement, and
o US$350,000 to AMZCL 6 months from the date of execution of the Agreement. During the year, the Company engaged drilling contractor Wallis Drilling Pty Ltd and completed an air core drilling of the tailings dump, with 114 holes drilled for a total of 1082m. After completion of review and interpretation of the assay data from the recent drilling programme the Company elected not to pay the milestone payments due and withdrew from the Kitwe Project. Financing Facilities On 19 November 2018, the Company entered into a loan of USD$500,000 (AUD$711k) from First Investments Holding Ltd secured by the Company’s shareholding in European Lithium Ltd to three times the value of the loan, interest rate of 5% per annum and to be repaid 18 months from the date of advancement. On 17 December 2018, the Company announced that it has secured a A$7.5m finance facility with MEF I, L.P. (Magna) to fast-track the development of the Kipushi Cobalt-Copper tailings project in the DRC. An initial amount of A$750k was drawn down on 19 December 2018. During the year, Magna converted 50,000 notes (6,526,176 shares) and repaid in cash 164,493 notes. As at 30 June 2019, Magna had 333,817 convertible notes remaining with a fair value of $459,737.
For
per
sona
l use
onl
y

ANNUAL REPORT 2019
DIRECTORS’ REPORT
9
On 12 March 2019, the Company entered into a second loan of USD$500,000 (AUD$711k) from First Investments Holding Ltd secured by the Company’s shareholding in European Lithium Ltd to three times the value of the loan, interest rate of 5% per annum and to be repaid 18 months from the date of advancement. On 29 May 2019, the Company announced that it had executed a non-binding terms sheet for an A$15m finance facility with Winance Investment LLC (Winance). Timis Mining Corporation Bridging Finance
In October 2014, the Company provided bridging financing of US$8 million and purchased a royalty of US12 million to Timing Mining Corporate SL Limited and TImis Mining Corporation Limited (collectively Timis Mining). The bridging finance principal and interest (interest is calculated on 3-month US LIBOR plus 6%) was due to be repaid to the Company on 21 October 2015 and could be extended by the parties on mutually agreed terms. In May 2017, the Company commenced legal action against Mr Craig Dean (First Defendant), Gerald Metals Limited (Second Defendant), Timis Mining Corporation SL Ltd (Fourth Defendant) and Frank Timis (Third Defendant) (jointly the Defendants) in the High Court of Sierra Leone seeking damages and injunctions against the Defendants (refer ASX announcement dated 15 May 2017), with an interim injunction subsequently granted (refer ASX announcement dated 19 May 2017). On 7 July 2017, the Company announced that the High Court of Sierra Leone issued a Court Order in relation to the Notice of Motion lodged by the Company, which ordered the Parties to proceed to arbitration if desired, refused the Fourth Defendant’s application for a stay of proceedings and maintained the interlocutory injunction against the First Defendant, Second Defendant and Third Defendant that prevents liquidating the Fourth Defendant’s company, pending the hearing and determination of the matter. The Company has entered into a damages-based agreement with a UK based legal firm to proceed further with the legal matter. Placements and Capital Movements
On 3 July 2018, the Company completed a placement of 1,000,000 fully paid ordinary shares at $0.03 per share to raise cash proceeds of $30,000 (before costs). On 13 July 2018 the Company completed a placement of 10,600,000 fully paid ordinary shares at $0.03 per share to raise cash proceeds of $300,000 (before costs) and settle liabilities of the Company of $18,000. On 23 July 2018 the Company completed a placement of 38,924,698 fully paid ordinary shares at $0.03 per share to raise cash proceeds of $1,104,741 (before costs) and settle liabilities of the Company of $63,000. On 23 July 2018 the Company issued 23,500,000 fully paid ordinary shares to Gulf Energy International Limited upon the exercise of options to raise cash proceeds of $1,175,000. On 13 December 2018, the Company issued 15,000,000 unlisted options exercisable at $0.03 each on or before 30 June 2021, 5,000,000 unlisted options exercisable at $0.05 each on or before 13 December 2020 and 10,000,000 unlisted options exercisable at $0.075 each on or before 30 June 2019 as approved at the 2018 AGM. On 21 December 2018, the Company announced the issue of 1,666,667 fully paid ordinary shares to Magna which represented Tranche 1 commitments shares. On 13 May 2019, the Company issued 6,526,176 fully paid ordinary shares to Magna upon the conversion of 50,000 notes. On 30 June 2019 a total of 10m unlisted options exercisable at $0.075 each expired.
For
per
sona
l use
onl
y

ANNUAL REPORT 2019
DIRECTORS’ REPORT
10
Trading Suspension On 8 January 2019, the Company’s securities were suspended from official quotation pending an announcement on the Project, and in particular the security of tenure over the Kipushi Cobalt-Copper Tailings Project (Project). On 2 May 2019 the Company’s securities were reinstated to trading following the release of an announcement in respect to the Project. The board intends to continue to follow its strategy of acquiring and investing in undervalued and/or distressed mineral assets and companies (Projects) and improve the value of these Projects, through a hands on approach to management, exploration, evaluation and development and retaining a long-term exposure to these Projects through a production royalty and/or equity interest. Cape Lambert aims to deliver shareholder value by adding value to these undeveloped Projects. If Projects are converted into cash, the Company intends to follow a policy of distributing surplus cash to Shareholders. RESULTS The Group made a loss after income tax for the year ended 30 June 2019 of $6,459,163 (2018: loss of $828,296). CHANGES IN STATE OF AFFAIRS During the financial year there was no significant change in the state of affairs of the Group other than those referred to in the Review of Operations. EVENTS SUBSEQUENT TO REPORTING DATE On 12 July 2019, the Company announced that African banks AFC and Afreximbank had conducted a site visit in respect to providing funding to the Kipushi Cobalt-Copper Tailings Project (Project). The Company also announced that it was in discussions with China Everbright Bank regarding a US$40m LC facility by way of Project offtake sales. On 28 July 2019, Magna consented to the Company entering into the Winance facility. In return, the parties agreed that prior to shareholder approval the maximum number of shares that the outstanding Magna notes could convert to was 39,150,137 shares, to reduce the floor price of $0.005, that the Company would redeem Magna notes with a face value of US$69,361.22 and that the Company would not make any cash payments to Winance whilst Manga notes were outstanding. On 31 July 2019, the Company announced that it had executed binding documentation with Winance Investment LLC (Winance) in respect to the A$15m finance facility. The finance facility is by way of the issue of convertible securities in the Company. An initial amount of A$1.2m (before expenses) has been drawn down and further drawdowns of A$500,000 each are available upon full conversion of the notes from the previous drawdown, subject to cooling off periods. On 9 August 2019, the Company issued 10,082,093 fully paid ordinary shares to Magna upon the conversion of 54,831 notes and issued 1,200 convertible notes to Winance. On 14 August 2019, the Company announced that it had been unable to source project funding for the development of the Kipushi Project (Kipushi Project) in the DRC and as such had withdrawn from the Kipushi Project and from being a 50% partner in the incorporate joint venture company Soludo-Lambert SAS (Soludo-Lambert). The Company has received liquidation claims from its previous joint venture partner in respect to the liquidation of Soludo-Lambert. The Company is disputing these claims and at this stage are unable to quantify the potential liability. On 14 August 2019, the Company announced that its renewed focus is on the Marampa Iron Ore Project in Sierra Leone. On 29 August 2019, following the Company’s failure to redeem a total of 164,493 notes, Magna issued a default notice. Magna subsequently agreed to withdraw the default notice, subject to the Company paying Magna, US$200,000 over four payments between 31 August 2019 and 20 November 2019. These payments are in addition to the redemption
For
per
sona
l use
onl
y

ANNUAL REPORT 2019
DIRECTORS’ REPORT
11
value of the notes which are to be repaid form a capital raising that the Company proposes to undertake by 20 December 2019. On 11 September 2019, the Company lodged a cleansing prospectus for the offer of up to 20,000 shares at an issue price of $0.007 per share to raise up to $140 (before expenses). On 11 September 2019 the Company issued 6,000,000 fully paid ordinary shares to Winance upon the conversion of 30 notes and issued 22,464,026 fully paid ordinary shares to Magna upon the conversion of 71,000 notes. On 19 September 2019 the Company issued 4,000,000 fully paid ordinary shares to Winance upon the conversion of 20 notes. On 23 September 2019, the Company entered into various Deed of Discharge and Conversion of Debt Agreements to settle debts of $458,766.64 (including debts owing to Directors and Director related entities of $359,307.90) through the issue of up to 45,876,664 fully paid ordinary shares. Approval for the settlement of these debts will sought at the Company’s 2019 Annual General Meeting. On 24 September 2019 the Company issued 4,000,000 fully paid ordinary shares to Winance upon the conversion of 20 notes. There have been no other events subsequent to 30 June 2019 up to the date of this report that would materially affect the operations of the Group or its state of affairs which have not otherwise been disclosed in this financial report. LIKELY DEVELOPMENTS AND EXPECTED RESULTS OF OPERATIONS The board intends to continue to follow its strategy of acquiring and investing in undervalued assets and adding value through a hands on approach to management, exploration and evaluation. ENVIRONMENTAL REGULATION AND PERFORMANCE The Group is aware of its environmental obligations with regards to its exploration activities and ensures that it complies with all regulations when carrying out any exploration work. There have been no significant known breaches of the Groups environmental regulations to which it is subject. The Group is also subject to the reporting requirements of the National Greenhouse and Energy Reporting Act 2007. The National Greenhouse and Energy Reporting Act 2007 require the Group to report its annual greenhouse gas emissions and energy use. For the year ended 30 June 2019 the Group was below the reported threshold for legislative reporting requirements therefore is not required to register or report. The Group will continue to monitor its registration and reporting requirements however it does not expect to have future reporting requirements. INDEMNIFICATION OF OFFICERS In accordance with the Company’s constitution, except as may be prohibited by the Corporations Act 2001, every officer or agent of the Company shall be indemnified out of the property of the Company against any liability incurred by him in his capacity as officer or agent of the Company or any related corporation in respect of any act or omission whatsoever and howsoever occurring or in defending any proceedings, whether civil or criminal. During the financial year, the Company has paid insurance premiums in respect of directors’ and officers’ liability insurance. The insurance premiums relate to:
• Costs and expenses incurred by the relevant officers in defending legal proceedings, whether civil or criminal and whatever their outcome; and
• Other liabilities that may arise from their position, with the exception of conduct involving wilful breach of duty or improper use of information to gain a personal advantage.
For
per
sona
l use
onl
y

ANNUAL REPORT 2019
DIRECTORS’ REPORT
12
In accordance with a confidentiality clause under the insurance policy, the amount of the premium paid to insurers has not been disclosed. This is permitted under section 300(9) of the Corporations Act 2001. INDEMNIFICATION OF AUDITORS To the extent permitted by law, the Company has agreed to indemnify its auditors, BDO, as part of the terms of its audit engagement agreement against claims by third parties arising from the audit (for an unspecified amount). No payment has been made to indemnify BDO during or since the financial year. DIRECTORS’ MEETINGS The following table sets out the number of directors’ meetings (including meetings of committees of directors) held during the financial year and the number of meetings attended by each director (while they were a director or committee member).
Board of Directors Remuneration Committee Directors Eligible to Attend Attended Eligible to Attend Attended
Tony Sage 4 4 - - Tim Turner 4 4 - - Stefan Müller 4 3 - -
For
per
sona
l use
onl
y

ANNUAL REPORT 2019
DIRECTORS’ REPORT
13
REMUNERATION REPORT (AUDITED) This remuneration report for the year ended 30 June 2019 outlines the remuneration arrangements of the Company and the Group in accordance with the requirements of the Corporations Act 2001 and its regulations. The information provided in this remuneration report has been audited as required by section 308(3C) of the Corporations Act 2001. Remuneration Policy for Directors and Other Key Management Personnel The remuneration report details the remuneration arrangements for key management personnel (KMP), defined as those persons having authority and responsibility for planning, directing and controlling the major activities of the Company and the Group, directly or indirectly, including any director (whether executive or otherwise) of the Company. Details of Directors and Other Key Management Personnel Directors T Sage – Executive Chairman T Turner – Non-Executive Director S Müller – Non-Executive Director Principles used to determine the nature and amount of remuneration The remuneration policy of the Company has been designed to align director objectives with shareholder and business objectives by providing a fixed remuneration component which is assessed sporadically in line with market rates. The Board of the Company believes the remuneration policy to be appropriate and effective in its ability to attract and retain appropriately skilled directors to run and manage the Company. The Board’s policy for determining the nature and amount of remuneration for Board members and other key management personnel is as follows: The remuneration policy, setting the terms and conditions for the executive directors and other senior staff members, was developed by the Executive Chairman and approved by the Board after benchmarking against the market. All executives receive a base salary (which is based on factors such as length of service and experience). The Group is an exploration entity, and therefore speculative in terms of performance. Consistent with attracting and retaining talented individuals, directors and senior executives are paid market rates associated with individuals in similar positions within the same industry. The Board endorses the use of incentive and bonus payments for directors and senior executives. Options and performance incentives may also be issued as the Group invests in projects which are subsequently successfully monetised, and key performance indicators such as profits and growth can then be used as measurements for assessing Board performance. Shares awarded to directors and executives are valued as the difference between the market price of those shares and the amount paid by the director or executive. Options are valued using the Black-Scholes option pricing model. The Board’s policy is to remunerate non-executive directors at market rates for comparable companies for time, commitment and responsibilities. The Executive Chairman determines payments to the non-executive directors and reviews their remuneration annually, based on market practice, duties and accountability. The maximum aggregate amount of fees that can be paid to non-executive directors as approved at the 2009 Annual General Meeting is $750,000. Any modifications to this amount is subject to approval by shareholders at the Company’s Annual General Meeting. To align directors’ interests with shareholder interests, the directors are encouraged to hold shares in the Company. The Company did not engage external remuneration consultants to advise the Board on remuneration matters during the year.
For
per
sona
l use
onl
y

ANNUAL REPORT 2019
DIRECTORS’ REPORT
14
Company Performance, Shareholder Wealth and Directors’ and Executives’ Remuneration The remuneration policy aims to increase goal congruence between shareholders and directors via the issue of options to directors to encourage the alignment of personal and shareholder interests. During the financial year, the Company’s share price traded between a low of $0.009 and a high of $0.038. The price volatility is a concern to the Board but is not considered abnormal for medium sized exploration entities and in the context of volatile global equity markets. In order to keep all investors fully informed and minimise market fluctuations, the Board is determined to maintain promotional activity amongst the investment community so as to increase awareness of the Company and to stabilise the Company’s share price in line with a consistent and stable financial position and base value of assets.
2015 2016 2017 2018 2019
Closing Share Price 30 June
$0.026 $0.019 $0.029 $0.03 $0.009
Profit/(Loss) for the year attributable to members of Cape Lambert Resources Limited
($178,909,136) ($30,470,607) ($10,781,531) ($651,170) ($6,459,163)
Basic EPS ($0.2852) ($0.0469) ($0.0148) ($0.0748) ($0.64) Details of Remuneration
Remuneration packages contain the key elements incorporated in the Company’s Remuneration Policy as detailed above. The following table discloses the remuneration of the directors and key management personnel of the Company:
% of Total Remuneration
Short Term Benefits
Cash Salary & Fees
Post-employ
ment benefits
Long term
benefit Leave
Share Based Payments –
Equity Options Total Fixed
At Risk Short Term
Incentive
At Risk Long Term Incentive (Options)
$ $ $ $ $ % % %
30 June 2019 Directors T Sage 700,000 - - - 700,000 100% 0% 0% T Turner 60,000 - - - 60,000 100% 0% 0% S Müller 24,000 - - 3,005 27,3005 99% 0% 1%
Total 784,000 - - 3,005 787,005 99% 0% 1%
30 June 2018 Directors T Sage 700,000 - - - 700,000 100% 0% 0% T Turner 60,000 - - - 60,000 100% 0% 0% S Müller 12,000 - - - 12,000 100% 0% 0% J Brewer 32,000 - - - 32,000 100% 0% 0% Other Key Management Personnel J Hamilton 204,000 - - - 204,000 100% 0% 0% M Chapman1 73,951 7,758 - - 81,709 100% 0% 0%
Total 1,081,951 7,758 - - 1,089,709 100% 0% 0%
For executives who were appointed or resigned during the year, the remuneration reflected above is that from date of appointment or to date of resignation. Notes 1 A portion of Ms M Chapman’s salary was recharged to related entity European Lithium Limited and unrelated entities MCS Services Limited and Latin Resources Limited. Long term leave balance represents accrued annual leave. Ms Chapman was an employee and disclosed as a KMP of the Company until 31 October 2017. Since 1 November 2017, Bellatrix Corporate Pty Ltd (Bellatrix) has been engaged via a consultancy agreement to provide company secretarial and accounting services. Ms Chapman is a director of Bellatrix.
For
per
sona
l use
onl
y

ANNUAL REPORT 2019
DIRECTORS’ REPORT
15
Additional disclosures relating to options and shares Options awarded, vested and lapsed There were 10,000,000 share options granted to Mr Stefan Muller during the year ended 30 June 2019 which lapsed on 30 June 2019. There were no other share options granted to executives as remuneration during the year ended 30 June 2019. No other share options lapsed during the current year ended 30 June 2019. Option holdings of directors and key management personnel
Balance 1-Jul-18
Granted as remuneration
Lapsed during the
year
Exercised during the
year Other Balance
30-Jun-19
Vested and exercisable 30-Jun-19
No. No. No. No. No. No. No.
Directors T Sage - - - - - - - T Turner - - - - - - - S Müller - 10,000,000 (10,000,000) - - - -
- 10,000,000 (10,000,000) - - - -
There were no shares issued on the exercise of options during the year. Share holdings of directors and key management personnel Details of fully paid ordinary shares of Cape Lambert Resources Limited held by directors and key management personnel are set out below:
Balance 1-Jul-18
Share based
payment received
Received on exercise of options
On market purchases
On market sales
Off market purchase
Balance 30-Jun-19
No. No. No. No. No. No. No.
Directors T Sage 77,766,681 - - - - - 77,766,681 T Turner 1,523,000 - - - - - 1,523,000 S Müller 1,000,000 - - 2,000,000 - - 3,000,000
80,289,681 - - 2,000,000 - - 82,289,681
Other transactions with director related entities
Sales to related parties
Purchases from related
parties Consulting fees paid
Amounts owed by related parties
Amounts owed to related parties
Director related entities: DGWA GmbH 2019 - 114,647 - - 38,356 DGWA GmbH 2018 - 58,199 - - 11,162 Fashion Council WA 2019 - 2,955 - - - Fashion Council WA 2018 - 4,855 - - - Perth Glory Football Club 2019 - - - - - Perth Glory Football Club 2018 - 65,641 - - - Okewood Pty Ltd 2019 - 568,020 - - - Okewood Pty Ltd 2018 - 569,694 - - -
DGWA GmbH (DGWA) is an entity controlled by Stefan Müller. During the year ended 30 June 2019 a total amount of $114,647 (2018: $58,199) was paid to DGWA for the provision of investor relations and public relation consulting services.
For
per
sona
l use
onl
y
ANNUAL REPORT 2019
DIRECTORS’ REPORT
16
Perth Fashion Festival Pty Ltd, Okewood Pty Ltd and Okewood Pty Ltd trading as Perth Glory Football Club are entities controlled by Tony Sage. During the year ended 30 June 2019 a total amount of $Nil (30 June 2018: $65,641) was paid to Okewood Pty Ltd for a corporate box and events of the Perth Glory Football Club. During the year ended 30 June 2019 a total amount of $2,955 (30 June 2018: $4,855) was paid to Perth Fashion Festival Pty Ltd for events held by the Perth Fashion Festival. All transactions were on an arm’s length basis. Office lease agreement with Okewood Pty Ltd On 1 April 2012 the Company entered into a lease agreement with Okewood Pty Ltd, a company owned by Tony Sage, for the lease of 32 Harrogate Street, West Leederville WA 6007, as varied by a deed of variation dated 22 June 2015 (Lease Agreement). The term of the Lease Agreement is 1 April 2012 to 31 March 2020 with an option to extend. The lease is based on an area of 1,148m² at a rent of $459,200 (excluding GST) per annum, subject to an annual CPI increase, with variable outgoings and parking charged separately at market rates. The Company has entered into a series of sub-lease agreements whereby the Company is entitled to receive rental income. The above minimum lease payments have not been adjusted for any sub-lease rental income payments. Service Agreements Executive Director On 26 September 2013, the Company entered into a consultancy contract with the Executive Chairman, Tony Sage for a period of 3 years from 28 August 2013. Pursuant to the terms of the contract, Mr Sage is paid an annual fee of $700,000 per annum (plus GST) for performing the role as Executive Chairman of the Company with the specific responsibility for all negotiations and strategic networking to facilitate the acquisition and disposal of assets of the Company. Under that contract, Mr Sage is not entitled to any set long or short term bonus or incentive. For the avoidance of doubt, there is no fixed formula under which any incentives or bonuses are payable by the Company to Mr Sage. During the term of the contact, the Remuneration Committee may consider incentive plans and bonus structures that will be focussed on the Executive Chairman achieving performance hurdles based on a material increase in the net market capitalisation of the Company and returns to shareholders of the Company, such as dividends. The contract may be terminated by either party, without cause, providing 3 months’ notice (or payment in lieu). Upon expiry of the Executive Chairman contract on 28 August 2016, the Company has entered into a new 3 year consultancy contract. The key terms of the new contract are consistent with those of the existing one with the exception of the inclusion of an incentive structure of 10-20%, subject to Remuneration Committee approval, which is dependent on the achievement of all key performance milestones detailed in the consultancy contract. As at the date of this report, the Company is in negotiation with Mr Sage regarding the terms of a new contract. Non-Executive Directors The engagement conditions of non-executive director Tim Turner were approved by the Board on 30 November 2007. A fee of $60,000 per annum plus GST was subsequently approved by the Board on 28 August 2009. The engagement conditions of non-executive director Stefan Müller were approved by the Board on 4 December 2017 with a fee of $24,000 per annum exclusive of GST. Director Loans At 30 June 2019, there was a loan of $2,934 owing from Tony Sage to the Company. 2018 Annual General Meeting The Company received 95.95% of ‘yes’ votes and 3.81% ‘no’ votes on its remuneration report for the year ending 30 June 2018. This is the end of the audited remuneration report
For
per
sona
l use
onl
y

ANNUAL REPORT 2019
DIRECTORS’ REPORT
17
Proceedings on Behalf of the Company No person has applied for leave of Court to bring proceedings on behalf of the Group or intervene in any proceedings to which the Group is a party for the purpose of taking responsibility on behalf of the Group for all or any part of those proceedings. The Group was not a party to any such proceedings during the year. Non Audit Services The Board of Directors is satisfied that the provision of any non-audit services by the Company’s auditors is compatible with the general standard of independence for auditors imposed by the Corporations Act 2001 because:
• All non-audit services are reviewed and approved by the Board of Directors prior to commencement to ensure they do not adversely affect the integrity and objectivity of the auditor; and
• The nature of the services provided is reviewed to ensure that they do not compromise the general principles relating to auditor independence in accordance with APES 110: Code of Ethics for Professional Accountants set by the Accounting Professional and Ethical Standards Board.
During the year $Nil was paid or payable (2018: $Nil) to the auditor or its related practices for non-audit services. Share Options Share Options Granted to Directors and Employees and Consultants On 13 December 2018, the Company issued 10,000,000 unlisted options to Director Stefan Muller as approved at the Company’s 2018 AGM. The options are exercisable at $0.075 each on or before 30 June 2019 and were issued to provide a performance linked incentive component in the remuneration package of Mr Muller in order to motivate and reward the performance of Mr Muller in a manner that aligns with shareholders’ interests. On 30 June 2019 these options lapsed. Share Options Granted to Corporate Advisors On 13 December 2018, the Company issued 5,000,000 unlisted options to Steubing as approved at the Company’s 2018 AGM. The options are exercisable at $0.05 each on or before 13 December 2020 and were issued for services provided in relation to a placement. The fair value of services provided could not be reliably estimated and as such the value has been based on the fair value of options issued. On 13 December 2018, the Company issued 15,000,000 unlisted options to Gulf Energy International Limited as approved at the Company’s 2018 AGM. The options are exercisable at $0.03 each on or before 30 June 2021 and were issued for services provided in relation to a placement. The fair value of services provided could not be reliably estimated and as such the value has been based on the fair value of options issued.
For
per
sona
l use
onl
y

ANNUAL REPORT 2019
DIRECTORS’ REPORT
18
Share Options on Issue at Year End Unissued ordinary shares of Cape Lambert under option at the date of this report are as follows:
Date options granted Expiry date Exercise price of shares Number under option
12 March 2018 12 March 2020 $0.07 15,336,363 19 March 2018 19 March 2020 $0.07 7,667,727 31 March 2018 31 March 2020 $0.04 5,250,000 29 November 2018 30 June 2021 $0.03 15,000,000 29 November 2018 13 December 2020 $0.05 5,000,000
No option holder has any right under the options to participate in any other share issue of the Company or any other entity. During the year, 23,500,000 share options were exercised for total consideration of $1,175,000. No amounts are unpaid on any of the shares. AUDITOR’S INDEPENDENCE DECLARATION The auditor’s independence declaration under section 307C of the Corporations Act 2001 is set out on page 19 for the year ended 30 June 2019. This report is signed in accordance with a resolution of the Board of Directors. _____________________ Tony Sage Director Dated this 27 September 2019
For
per
sona
l use
onl
y

BDO Audit (WA) Pty Ltd ABN 79 112 284 787 is a member of a national association of independent entities which are all members of BDO Australia Ltd ABN 77 050 110 275,an Australian company limited by guarantee. BDO Audit (WA) Pty Ltd and BDO Australia Ltd are members of BDO International Ltd, a UK company limited by guarantee, andform part of the international BDO network of independent member firms. Liability limited by a scheme approved under Professional Standards Legislation.
Tel: +61 8 6382 4600Fax: +61 8 6382 4601www.bdo.com.au
38 Station StreetSubiaco, WA 6008PO Box 700 West Perth WA 6872Australia
DECLARATION OF INDEPENDENCE BY PHILLIP MURDOCH TO THE DIRECTORS OF CAPE LAMBERTRESOURCES LTD
As lead auditor of Cape Lambert Resources Ltd for the year ended 30 June 2019, I declare that, to thebest of my knowledge and belief, there have been:
1. No contraventions of the auditor independence requirements of the Corporations Act 2001 inrelation to the audit; and
2. No contraventions of any applicable code of professional conduct in relation to the audit.
This declaration is in respect of Cape Lambert Resources Ltd and the entities it controlled during theperiod.
Phillip Murdoch
Director
BDO Audit (WA) Pty Ltd
Perth, 27 September 2019
For
per
sona
l use
onl
y

ANNUAL REPORT 2019
CORPORATE GOVERNANCE STATEMENT
20
The Company’s Corporate Governance Statement for the year ended 30 June 2019 (which reports against these ASX Principles) may be accessed from the Company’s website at www.capelam.com.au.
For
per
sona
l use
onl
y

ANNUAL REPORT 2019
CONSOLIDATED STATEMENT OF PROFIT OR LOSS AND OTHER COMPREHENSIVE INCOME FOR THE YEAR ENDED 30 JUNE 2019
21
The Consolidated Statement of Profit or Loss and Other Comprehensive Income should be read in conjunction with the
accompanying notes.
Note 2019 2018 $ $
Revenue 3(a) 278,746 368,377 Other income 3(b) 79,316 700,069 Share based payments 5(c) (3,005) (162,224) Directors remuneration and employee benefits expenses (827,806) (570,026) Consulting and professional services (969,026) (1,614,757) Occupancy expenses 3(d) (639,961) (672,291) Compliance and regulatory expenses (141,087) (183,148) Travel and accommodation (82,145) (219,465) Depreciation and amortisation expense 3(c) (29,430) (28,251) (Loss)/Gain on fair value of financial assets through profit & loss 3(f) (721,956) (1,001,618) Finance expenses (132,949) (241) Other expenses 3(e) (359,169) (1,017,437) (Impairment)/Reversal of impairment of receivable (42,942) 211,419 De-recognition of capitalised exploration 13 - (2,109,292) Impairment of investment in associate 11(e) (718,723) (6,852,289) De-recognition of accrued liabilities 13 2,647,350 - Impairment of investment (52,565) - Impairment of investment in joint venture 12 (3,383,317) - Share of net losses of associates accounted for using the equity method 11(b) (919,462) 148,108 Share of net losses of joint venture accounted for using the equity method 12(a) (1,006,302) (157,895) Gain on dilution of interest in associate 11(b) 565,270 881,851 Gain transfer from associate accounting to fair value through profit and loss 11(b) - 1,408,338 Share of net losses of deconsolidated entity 32 - (224,376) Gain on deconsolidation 32 - 10,242,555
Loss before income tax (6,459,163) (852,593) Income tax (expense)/benefit 4 - 24,297
Net loss for the year (6,459,163) (828,296)
Other comprehensive income/(expenditure) net of tax Items that may be reclassified subsequently to profit and loss Foreign exchange differences arising on translation of foreign operations (151,579) (153,928) Share of reserves of associates accounted for using the equity method 187,007 186,871
Total comprehensive loss for the year (6,423,735) (795,353)
Loss for the year attributable to: Members of Cape Lambert Resources Ltd (6,459,163) (651,170) Non-controlling interests - (177,126)
(6,459,163) (828,296)
Total comprehensive loss for the year attributable to: Members of Cape Lambert Resources Ltd (6,423,735) (618,227) Non-controlling interests - (177,126)
(6,423,735) (795,353)
Loss per share attributable to members of Cape Lambert Resources Ltd: Basic loss per share (cents per share) 22 (0.64) (0.07) Diluted loss per share (cents per share) 22 (0.64) (0.07)
For
per
sona
l use
onl
y

ANNUAL REPORT 2019
CONSOLIDATED STATEMENT OF FINANCIAL POSITION AS AT 30 JUNE 2019
22
Note 2019 2018 $ $
CURRENT ASSETS Cash and cash equivalents 29(a) 210,106 1,015,522 Restricted cash and cash equivalents 9 12,500 44,546 Trade and other receivables 7 224,612 320,355
TOTAL CURRENT ASSETS 447,218 1,380,423
NON-CURRENT ASSETS Other financial assets 8 997,055 2,567,722 Restricted cash 9 81,833 81,833 Plant and equipment 10 94,725 109,576 Investments accounted for using equity method 11 6,030,739 7,115,698 Investment in joint venture accounted for using equity method 12 - 2,882,726 Exploration and evaluation expenditure 13 - 1,107,642
TOTAL NON-CURRENT ASSETS 7,204,352 13,865,197
TOTAL ASSETS 7,651,570 15,245,620
CURRENT LIABILITIES Trade and other payables 14 4,626,822 8,251,795 Provisions 15 206,257 1,055,262 Current tax liabilities 18 1,041,679 5,203,442 Convertible note 16 459,737 - Short term loan payable 17 733,001 -
TOTAL CURRENT LIABILITIES 7,067,496 14,510,499
NON-CURRENT LIABILITIES Long term loan payable 17 689,734 - Non-current tax liabilities 18 2,861,893 -
TOTAL NON-CURRENT LIABILITIES 3,551,627 -
TOTAL LIABILITIES 10,619,123 14,510,499
NET ASSETS/(NET LIABILITIES) (2,967,553) 735,121
EQUITY Issued capital 19 203,295,135 200,730,049 Reserves 20 23,796,340 23,604,936 Accumulated losses 21 (230,059,028) (223,599,865)
Parent interests (2,967,553) 735,120
TOTAL EQUITY/(DEFICIENCY) (2,967,553) 735,121
The above Consolidated Statement of Financial Position should be read in conjunction with the accompanying notes.
F
or p
erso
nal u
se o
nly

ANNUAL REPORT 2019
CONSOLIDATED STATEMENT OF CHANGES IN EQUITY FOR THE YEAR ENDED 30 JUNE 2019
23
Note Issued Capital
Accumulated Losses
Share Based
Payment Reserve
Foreign Currency
Translation Reserve
Equity Reserve
Parent Equity
Interest Total
Non-
controlling interest Total
$ $ $ $ $ $ $ $
Balance at 1 July 2018 200,730,051 (223,599,865) 2,392,942 22,302,495 (1,090,501) 735,120 - 735,121 Loss for the year - (6,459,163) - - - (6,459,162) - (6,459,162) Other comprehensive income
Share of reserves of associates 20 - - 128,966 58,041 - 187,007 - 187,007 Forex (gain) / loss on translation of foreign operations 20 - - - (151,579) - (151,579) - (151,579)
Total comprehensive loss for the year - (6,459,163) 128,966 (93,538) - (6,423,734) - (6,423,734)
Transactions with owners in their capacity as owners Placement of shares (net of costs) 19 2,799,055 - - - - 2,799,055 - 2,799,055 Share based payments expense (152,971) - 155,976 - - 3,005 - 3,005 Capital raising costs (81,000) - - - - (81,000) - (81,000)
Transactions with equity holders in their capacity as owners 2,565,084 - 155,976 - - 2,721,060 - 2,721,060
Balance at 30 June 2019 203,295,135 (230,059,028) 2,677,884 22,208,957 (1,090,501) (2,967,553) - (2,967,553)
For
per
sona
l use
onl
y

ANNUAL REPORT 2019
CONSOLIDATED STATEMENT OF CHANGES IN EQUITY FOR THE YEAR ENDED 30 JUNE 2019
24
Note Issued Capital
Accumulated Losses
Share Based
Payment Reserve
Foreign Currency
Translation Reserve
Equity Reserve
Parent Equity
Interest Total
Non-
controlling interest Total
$ $ $ $ $ $ $ $
Balance at 1 July 2017 196,771,578 (222,948,696) 2,167,905 22,332,366 (1,179,630) (2,856,477) 217,066 (2,639,411) Loss for the year - (651,170) - - - (651,170) (177,126) (828,296) Other comprehensive income
Share of reserves of associates 20 - - 62,814 124,057 - 186,871 - 186,871 Forex (gain) / loss on translation of foreign operations 20 - - - (153,928) - (153,928) - (153,928)
Total comprehensive income/(loss) for the year - (651,170) 62,814 (29,871) - (618,227) (177,126) (795,353)
Transactions with owners in their capacity as owners Placement of shares (net of costs) 19 3,958,473 - - - - 3,958,473 - 3,958,473 Share based payments expense - - 162,224 - - 162,224 - 162,224 Movement in non-controlling interest
- - -
- 89,129 89,129 412,071 501,201
Deconsolidation of Fe Ltd 32 - - - - - - (452,011) (452,011)
Transactions with equity holders in their capacity as owners 3,958,473 - 162,224 - 89,129 4,209,826 (39,940) 4,169,887
Balance at 30 June 2018 200,730,051 (223,599,866) 2,392,942 22,302,495 (1,090,501) 735,120 - 735,121
The above Consolidated Statement of Changes in Equity should be read in conjunction with the accompanying notes.F
or p
erso
nal u
se o
nly

ANNUAL REPORT 2019
CONSOLIDATED STATEMENT OF CASH FLOWS FOR THE YEAR ENDED 30 JUNE 2019
25
Note 2019 2018 $ $
CASHFLOWS FROM OPERATING ACTIVITIES Payments to suppliers and employees (inclusive of GST) (2,438,431) (3,448,618) Interest received 3,048 8,998 Income tax paid 18 (1,299,869) -
Net cash used in operating activities 29(b) (3,735,252) (3,439,620)
CASHFLOWS FROM INVESTING ACTIVITIES Payment for acquiring interests in associated entities 11(b) (3,854) - Payments for other investments - 150,000 Payments for exploration and evaluation (978,792) (1,266,224) Investment in joint venture 12(a) (1,506,893) (324,819) Proceeds on sale of royalty - 500,000 Purchase or property, plant and equipment 10 (14,579) - Proceeds from sale of equity investments 999,052 540,283 Cash balances on disposal of controlled entity (FEL) 32 - (381,805) Proceeds from sale of property, plant and equipment - (6,794)
Net cash (used in) investing activities (1,505,066) (789,360)
CASHFLOWS FROM FINANCING ACTIVITIES Proceeds from issue of shares, net of costs 19 2,609,741 3,684,455 Transaction costs related to issue of shares, convertible notes or options
(37,350)
-
Proceeds from issue of convertible note 750,000 - Proceeds from issuing loan note 1,395,169 65,000 Repayment of loan note (282,658) 384,759
Net cash (used in) financing activities 4,434,902 4,134,214
Net decrease in cash and cash equivalents (805,416) (94,765) Cash and cash equivalents at beginning of period 1,015,522 1,110,287
Cash and cash equivalents at end of period 29(a) 210,106 1,015,522
The above Consolidated Statement of Cash Flows should be read in conjunction with the accompanying notes.
For
per
sona
l use
onl
y

ANNUAL REPORT 2019
NOTES TO THE CONSOLIDATED FINANCIAL STATEMENTS
26
1. CORPORATE INFORMATION The consolidated financial statements of Cape Lambert Resources Limited and its subsidiaries (collectively, the Group) for the year ended 30 June 2019 were authorised for issue in accordance with a resolution of the directors on 27 September 2019. Cape Lambert Resources Limited (the Company or the Parent) is a for profit company limited by shares incorporated in Australia whose shares are publicly traded on the Australian Securities Exchange. The nature and operations and principal activities of the Group are described in the directors’ report. Information of the Group’s structure is provided in Note 26. Information on other related party relationships is provided in Note 28. 2. SUMMARY OF SIGNIFICANT ACCOUNTING POLICIES (a) Basis of preparation The financial report is a general purpose financial report that has been prepared in accordance with Australian Accounting Standards including Australian Accounting Interpretations, other authoritative pronouncements of the Australian Accounting Standards Board and the Corporations Act 2001. The financial report has been prepared on the basis of historical cost, except for the revaluation of certain financial instruments. Cost is based on the fair values of the consideration given in exchange for assets. The financial report is presented in Australian dollars. The Group is a for-profit public listed company, incorporated and domiciled in Australia. (b) Going concern The consolidated financial statements of Cape Lambert have been prepared on a going concern basis which contemplates the continuity of normal business activities and the realisation of assets and the settlement of liabilities in the ordinary course of business. For the year ended 30 June 2019 the Group incurred a loss after income tax of $6,459,163 (30 June 2018: $828,296 loss), net cash outflows from operating activities of $3,735,252 (30 June 2018: $3,439,620), and at that date had cash on hand of $210,106 (30 June 2018: $1,015,522) with a working capital deficiency of $6,620,278 (30 June 2018: Deficit $13,130,076).
The Group’s ability to continue as a going concern and to continue to fund its planned expanded activities is dependent on raising further capital and / or generating additional revenues from its operations and / or reducing operational costs. These conditions indicate a material uncertainty that may cast a significant doubt about the Group’s ability to continue as a going concern and, therefore, that it may be unable to realise its assets and discharge its liabilities in the normal course of business. The Directors believe the Group will continue as a going concern, after consideration of the following factors:
▪ The Group has recent successful experience in raising capital having raised $2.6 million in cash proceeds through share placements and the conversion of options in the year ended 30 June 2019; and
▪ The Group is progressing towards the reissuance of the relevant licences at the Marampa Iron Ore Project and developing the project; and
▪ The Company has established the Winance convertible loan note facility allowing access to funds for the purposes of further developing this project; and
For
per
sona
l use
onl
y

ANNUAL REPORT 2019
NOTES TO THE CONSOLIDATED FINANCIAL STATEMENTS
27
▪ The Group has successfully completed the planned first phase of its commercial strategy and now requires additional capital for its next phase. The Company’s current intention is to raise additional capital prior to the end of the calendar year through equity or debt in order to fund its expansion and working capital requirements. Initial discussions have commenced with a number of Australian stock brokers and the directors are confident of a successful outcome within the next 12 months; and
▪ The Group has successfully negotiated for the settlement of various liabilities into equity; and ▪ Realisation of certain of the Groups financial assets through the sale of its listed shares; and ▪ The Group is continuing efforts to secure key customers in key markets and are similarly confident of
generating additional sales revenue within the next 12 months. Should the Group not be able to continue as a going concern, it may be required to realise its assets and discharge its liabilities other than in the ordinary course of business. The financial report does not include any adjustments relating to the recoverability and classification of recorded asset amounts or liabilities that might be necessary should the Group not continue as a going concern. (c) Compliance with IFRS The financial report complies with Australian Accounting Standards and International Financial Reporting Standards (IFRS) as issued by the International Accounting Standards Board (IASB). Accounting policies are selected and applied in a manner which ensures that the resulting financial information satisfies the concepts of relevance and reliability, thereby ensuring that the substance of the underlying transactions or other events is reported. (d) Changes in accounting policy, disclosures, standards and interpretations New accounting standards adopted in the current period The Company has adopted all of the new, revised or amending Accounting Standards and Interpretations issued by the Australian Accounting Standards Board (AASB) that are mandatory for the current reporting period. Adoption of these standards and interpretations did not have any effect on the statements of financial position or performance of the Company. The Company has not elected to early adopt any new standards or amendments.
The following relevant standards and interpretations have been applied for the first time for the year ended 30 June 2019: AASB 9 Financial Instruments (AASB 9) The Group has adopted AASB 9 as issued in July 2014 with the date of initial application being 1 July 2018. In accordance with the transitional provisions in AASB 9, comparative figures have not been restated. AASB 9 replaces AASB 39 Financial Instruments: Recognition and Measurement (AASB 39), bringing together all three aspects of the accounting for financial instruments: classification and measurement; impairment; and hedge accounting. The accounting policies have been updated to reflect the application of AASB 9 for the period from 1 July 2018. Measurement and classification Under AASB 9, debt instruments are subsequently measured at fair value through profit or loss (FVPL), amortised cost, or fair value through other comprehensive income (FVOCI). The classification is based on two criteria: the Group’s business model for managing the assets; and whether the instruments’ contractual cash flows represent ‘solely payments of principal and interest’ on the principal amount outstanding (the ‘SPPI criterion’). The SPPI test is applied to the entire financial asset, even if it contains an embedded derivative. Consequently, a derivative embedded in a debt instrument is not accounted for separately. At the date of initial application, existing financial assets and liabilities of the Group were assessed in terms of the requirements of AASB 9. The assessment was conducted on instruments that had not been derecognised as at 1 July
For
per
sona
l use
onl
y
ANNUAL REPORT 2019
NOTES TO THE CONSOLIDATED FINANCIAL STATEMENTS
28
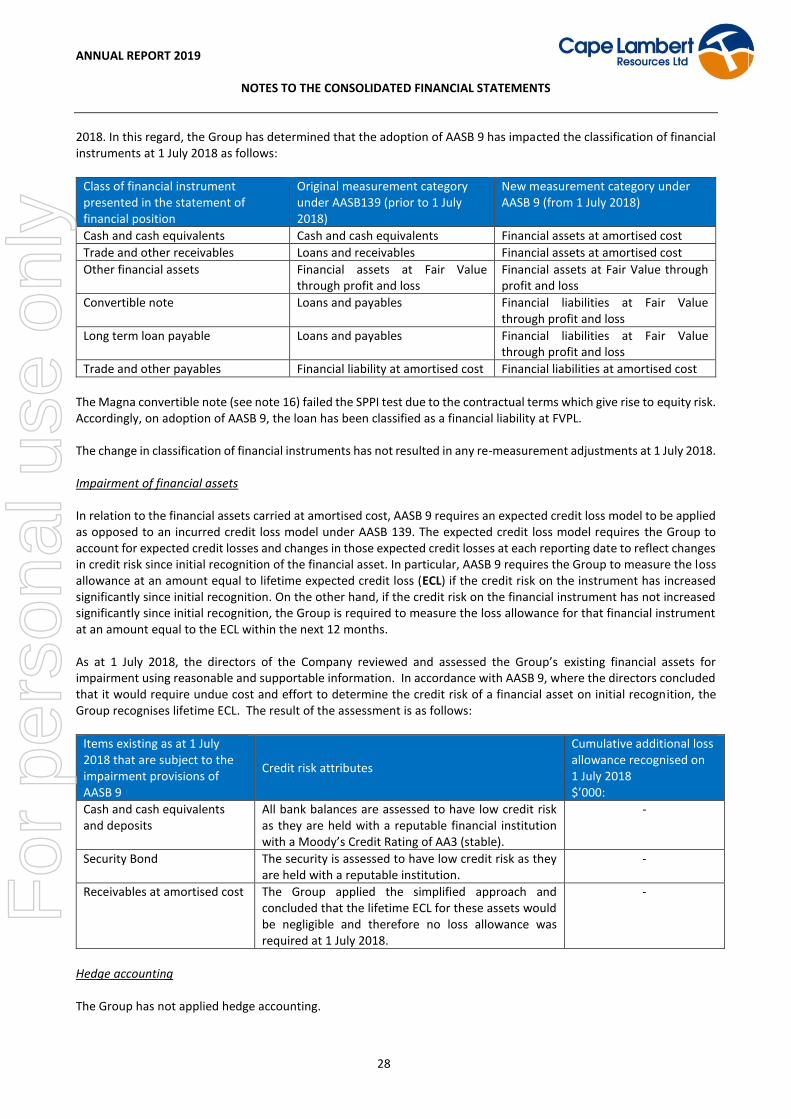
2018. In this regard, the Group has determined that the adoption of AASB 9 has impacted the classification of financial instruments at 1 July 2018 as follows:
Class of financial instrument presented in the statement of financial position
Original measurement category under AASB139 (prior to 1 July 2018)
New measurement category under AASB 9 (from 1 July 2018)
Cash and cash equivalents Cash and cash equivalents Financial assets at amortised cost
Trade and other receivables Loans and receivables Financial assets at amortised cost
Other financial assets Financial assets at Fair Value through profit and loss
Financial assets at Fair Value through profit and loss
Convertible note Loans and payables Financial liabilities at Fair Value through profit and loss
Long term loan payable Loans and payables Financial liabilities at Fair Value through profit and loss
Trade and other payables Financial liability at amortised cost Financial liabilities at amortised cost
The Magna convertible note (see note 16) failed the SPPI test due to the contractual terms which give rise to equity risk. Accordingly, on adoption of AASB 9, the loan has been classified as a financial liability at FVPL. The change in classification of financial instruments has not resulted in any re-measurement adjustments at 1 July 2018. Impairment of financial assets In relation to the financial assets carried at amortised cost, AASB 9 requires an expected credit loss model to be applied as opposed to an incurred credit loss model under AASB 139. The expected credit loss model requires the Group to account for expected credit losses and changes in those expected credit losses at each reporting date to reflect changes in credit risk since initial recognition of the financial asset. In particular, AASB 9 requires the Group to measure the loss allowance at an amount equal to lifetime expected credit loss (ECL) if the credit risk on the instrument has increased significantly since initial recognition. On the other hand, if the credit risk on the financial instrument has not increased significantly since initial recognition, the Group is required to measure the loss allowance for that financial instrument at an amount equal to the ECL within the next 12 months. As at 1 July 2018, the directors of the Company reviewed and assessed the Group’s existing financial assets for impairment using reasonable and supportable information. In accordance with AASB 9, where the directors concluded that it would require undue cost and effort to determine the credit risk of a financial asset on initial recognition, the Group recognises lifetime ECL. The result of the assessment is as follows:
Items existing as at 1 July 2018 that are subject to the impairment provisions of AASB 9
Credit risk attributes
Cumulative additional loss allowance recognised on 1 July 2018 $’000:
Cash and cash equivalents and deposits
All bank balances are assessed to have low credit risk as they are held with a reputable financial institution with a Moody’s Credit Rating of AA3 (stable).
-
Security Bond The security is assessed to have low credit risk as they are held with a reputable institution.
-
Receivables at amortised cost The Group applied the simplified approach and concluded that the lifetime ECL for these assets would be negligible and therefore no loss allowance was required at 1 July 2018.
-
Hedge accounting The Group has not applied hedge accounting.
For
per
sona
l use
onl
y

ANNUAL REPORT 2019
NOTES TO THE CONSOLIDATED FINANCIAL STATEMENTS
29
AASB 15 Revenue from Contracts with Customers (AASB 15) The Group has adopted AASB 15 as issued in May 2014 with the date of initial application being 1 July 2018. In accordance with the transitional provisions in AASB 15 the standard has been applied using the full retrospective approach. AASB 15 supersedes AASB 18 Revenue, AASB 111 Construction Contracts and related Interpretations and it applies to all revenue arising from contracts with customers, unless those contracts are in the scope of other standards. The new standard establishes a five-step model to account for revenue arising from contracts with customers. Under AASB 15, revenue is recognised at an amount that reflects the consideration to which an entity expects to be entitled in exchange for transferring goods or services to a customer. At 1 July 2018 it was determined that the adoption of AASB 15 had no material impact on the Group. AASB 2016-5 Amendments to Australian Accounting Standards – Classification and Measurement of Share-based Payment Transactions This Standard amends AASB 2 Share-based Payment, clarifying how to account for certain types of share-based payment transactions. The amendments provide requirements on the accounting for:
▪ The effects of vesting and non-vesting conditions on the measurement of cash-settled share-based payments ▪ Share-based payment transactions with a net settlement feature for withholding tax obligations ▪ A modification to the terms and conditions of a share-based payment that changes the classification of the
transaction from cash-settled to equity-settled. At 1 July 2018 it was determined that the adoption of AASB 2016-5 had no impact on the Group. New accounting standards and interpretations issued but not yet effective
Australian Accounting Standards and Interpretations that have recently been issued or amended but are not yet mandatory, have not been early adopted by the Company for the annual reporting period ended 30 June 2019. The Company’s assessment of the impact of these new or amended Accounting Standards and Interpretations, most relevant to the Company, are set out below.
Reference Title Summary Application date of standard
Application date for CFE
Interpretation 23
Uncertainty over Income Tax Treatments
The Interpretation clarifies the application of the recognition and measurement criteria in AASB 12 Income Taxes when there is uncertainty over income tax treatments. The Interpretation specifically addresses the following: - Whether an entity considers uncertain tax
treatments separately - The assumptions an entity makes about the
examination of tax treatments by taxation authorities - How an entity determines taxable profit (tax loss), tax
bases, unused tax losses, unused tax credits and tax rates
- How an entity considers changes in facts and circumstances.
1 January 2019
1 July 2019
AASB 16 Leases AASB 16 eliminates the operating and finance lease classifications for lessees currently accounted for under AASB 117 Leases. It instead requires an entity to bring
1 January 2019
1 July 2019
For
per
sona
l use
onl
y

ANNUAL REPORT 2019
NOTES TO THE CONSOLIDATED FINANCIAL STATEMENTS
30
Reference Title Summary Application date of standard
Application date for CFE
most leases into its statement of financial position in a similar way to how existing finance leases are treated under AASB 117. An entity will be required to recognise a lease liability and a right of use asset in its statement of financial position for most leases. There are some optional exemptions for leases with a period of 12 months or less and for low value leases. Lessor accounting remains largely unchanged from AASB 117. The Group is in the process of evaluating the impact of the new lease standard. The changes in the Group's accounting policies from the adoption of AASB 16 will be applied from 1 July 2019 onwards.
The Group is in the process of determining the impact of the above on its financial statements. The Group has not elected to early adopt any new Standards or Interpretations. (e) Basis of consolidation The consolidated financial statements comprise the financial statements of Cape Lambert Resources Limited (Cape Lambert) and its subsidiaries as at 30 June 2019 (the Group). Control is achieved when the Group is exposed, or has rights, to variable returns from its involvement with the investee and has the ability to affect those returns through its power over the investee. Specifically, the Group controls an investee if and only if the Group has:
▪ Power over the investee (i.e. existing rights that give it the current ability to direct the relevant activities of the investee);
▪ Exposure, or rights, to variable returns from its involvement with the investee; and ▪ The ability to use its power over the investee to affect its returns.
When the Group has less than a majority of the voting or similar rights of an investee, the Group considers all relevant facts and circumstances in assessing whether it has power over an investee, including:
▪ The contractual arrangement with the other vote holders of the investee ▪ Rights arising from other contractual arrangements ▪ The Group’s voting rights and potential voting rights
The Group re-assesses whether or not it controls an investee if facts and circumstances indicate that there are changes to one or more of the three elements of control. Consolidation of a subsidiary begins when the Group obtains control over the subsidiary and ceases when the Group loses control of the subsidiary. Assets, liabilities, income and expenses of a subsidiary acquired or disposed of during the year are included in the statement of comprehensive income from the date the Group gains control until the date the Group ceases to control the subsidiary. Profit or loss and each component of other comprehensive income (OCI) are attributed to the equity holders of the parent of the Group and to the non-controlling interests, even if this results in the non-controlling interests having a deficit balance. When necessary, adjustments are made to the financial statements of subsidiaries to bring their accounting policies into line with the Group’s accounting policies. All intra-group assets and liabilities, equity, income, expenses and cash flows relating to transactions between members of the Group are eliminated in full on consolidation.
For
per
sona
l use
onl
y

ANNUAL REPORT 2019
NOTES TO THE CONSOLIDATED FINANCIAL STATEMENTS
31
A change in the ownership interest of a subsidiary, without a loss of control, is accounted for as an equity transaction. If the Group loses control over a subsidiary, it:
▪ De-recognises the assets (including goodwill) and liabilities of the subsidiary ▪ De-recognises the carrying amount of any non-controlling interests ▪ De-recognises the cumulative translation differences recorded in equity ▪ Recognises the fair value of the consideration received ▪ Recognises the fair value of any investment retained ▪ Recognises any surplus or deficit in profit or loss ▪ Reclassifies the parent’s share of components previously recognised in OCI to profit or loss or retained
earnings, as appropriate, as would be required if the Group had directly disposed of the related assets or liabilities
Business combinations are accounted for using the acquisition method. (f) Associates Associates are entities over which the Group has significant influence but not control, generally accompanying a shareholding of between 20% and 50% of the voting rights. Investments in associates are accounted for using the equity method of accounting, after initially being recognised at cost. The Group’s investment in associates includes goodwill (net of any accumulated impairment loss) identified on acquisition. The Group’s share of its associates’ post-acquisition profits or losses is recognised in the consolidated statement of comprehensive income, and its share of post-acquisition movements in reserves is recognised in statement of comprehensive income and reserves. The cumulative post-acquisition movements are adjusted against the carrying amount of the investment. Dividends receivable from associates reduce the carrying amount of the investment. When the Group’s share of losses in an associate equals or exceeds its interest in the associate, including any other unsecured long-term receivables, the Group does not recognise further losses, unless it has incurred obligations or made payments on behalf of the associate. Unrealised gains on transactions between the Group and its associates are eliminated to the extent of the Group’s interest in the associates. Unrealised losses are also eliminated unless the transaction provides evidence of an impairment of the asset transferred. (g) Cash and Cash Equivalents Cash and cash equivalents include cash on hand, deposits held at call with banks, other short-term highly liquid investments with original maturities of three months or less, and bank overdrafts. Bank overdrafts are shown within borrowings in current liabilities on the statement of financial position. Restricted cash relates to term deposits held with various financial institutions as security for bank guarantees. (h) Trade and other receivables Trade receivables are initially recognised at their transaction price and other receivables at fair value. Receivables that are held to collect contractual cash flows and are expected to give rise to cash flows representing solely payments of principal and interest are classified and subsequently measured at amortised cost. Receivables that do not meet the criteria for amortised cost are measured at fair value through profit or loss. The Group assesses on a forward-looking basis the expected credit losses associated with its debt instruments carried at amortised cost. The amount of expected credit losses is updated at each reporting date to reflect changes in credit risk since initial recognition of the respective financial instrument. The Consolidate Entity always recognises the lifetime expected credit loss for trade receivables carried at amortised cost. The expected credit losses on these financial assets are estimated based on the Consolidate Entity’s historic credit loss experience, adjusted for factors that are specific to the debtors, general economic conditions and an assessment of both the current as well as forecast conditions at the reporting date.
For
per
sona
l use
onl
y

ANNUAL REPORT 2019
NOTES TO THE CONSOLIDATED FINANCIAL STATEMENTS
32
For all other receivables measured at amortised cost, the Consolidate Entity recognises lifetime expected credit losses when there has been a significant increase in credit risk since initial recognition. If the credit risk on the financial instrument has not increased significantly since initial recognition, the Consolidate Entity measures the loss allowance for that financial instrument at an amount equal to expected credit losses within the next 12 months. The Consolidate Entity considers an event of default has occurred when a financial asset is more than 120 days past due or external sources indicate that the debtor is unlikely to pay its creditors, including the Consolidate Entity. A financial asset is credit impaired when there is evidence that the counterparty is in significant financial difficulty or a breach of contract, such as a default or past due event has occurred. The Consolidate Entity writes off a financial asset when there is information indicating the counterparty is in severe financial difficulty and there is no realistic prospect of recovery. (i) Property, Plant and Equipment Plant and equipment is stated at cost less accumulated depreciation and impairment. Cost includes expenditure that is directly attributable to the acquisition of the item. In the event that settlement of all or part of the purchase consideration is deferred, cost is determined by discounting the amounts payable in the future to their present value as at the date of acquisition. Depreciation is provided on plant and equipment. Depreciation is calculated on a straight line basis so as to write off the net cost or other revalued amount of each asset over its expected useful life to its estimated residual value. The estimated useful lives, residual values and depreciation method are reviewed at the end of each annual reporting period. The following estimated useful lives are used in the calculation of depreciation: Office equipment 3 years Plant and equipment 3 years Motor vehicles 3 years Furniture and fittings 5 years Leasehold improvements over the period of the lease
(j) Financial Assets Investments are recognised and derecognised on trade date where purchase or sale of an investment is under a contract whose terms require delivery of the investment within the timeframe established by the market concerned, and are initially measured at fair value, net of transaction costs. Other financial assets are classified into the following specified categories: financial assets ‘at fair value through profit or loss’ and ‘loans and receivables’. The classification depends on the nature and purpose of the financial assets and is determined at the time of initial recognition. The Group has the following financial assets: Financial Assets at Fair Value through Profit or Loss Certain shares and options held for trading have been classified as financial assets at fair value through profit or loss. Financial assets held for trading purposes are stated at fair value, with any resultant gain or loss recognised in profit or loss. The fair value of investments that are actively traded in organised financial markets is determined by reference to quoted market bid prices at the close of business on the reporting date. Assets in this category are classified as current assets if they are expected to be realised within 12 months otherwise they are classified as non-current assets. Loans and Receivables Trade receivables, loans, and other receivables are non-derivative financial assets with fixed or determinable payments that are not quoted in an active market. They are recorded at amortised cost less impairment. Impairment is determined by review of the nature and recoverability of the loan or receivable with reference to its terms of repayments and capacity of the debtor entity to repay the debt. If the recoverable amount of a receivable is estimated to be less than its carrying amount, the carrying amount of receivable is reduced to its recoverable amount. An impairment loss is recognised in profit or loss immediately. They are included in current assets, other than those with maturities greater than 12 months from reporting date which are classified as non-current assets.
For
per
sona
l use
onl
y

ANNUAL REPORT 2019
NOTES TO THE CONSOLIDATED FINANCIAL STATEMENTS
33
(k) Debt and Equity Instruments Issued by the Group Debt and equity instruments Debt and equity instruments are classified as either liabilities or as equity in accordance with the substance of the contractual arrangement. Interest and dividends Interest and dividends are classified as expenses or as distributions of profit consistent with the statement of financial position classification of the related debt or equity instruments or component parts of compound instruments. (l) Foreign Currency Foreign currency transactions and balances All foreign currency transactions occurring during the financial year are recognised at the exchange rate in effect at the date of the transaction. Foreign currency monetary items at reporting date are translated at the exchange rate existing at reporting date. Non-monetary assets and liabilities carried at fair value that are denominated in foreign currencies are translated at the rates prevailing at the date when the fair value was determined. Exchange differences are recognised in the profit or loss in the period in which they arise except those exchange differences which relate to assets under construction for future productive use which are included in the cost of those assets where they are regarded as an adjustment to interest costs on foreign currency borrowings. Functional and presentation currency Items included in the financial statements of each of the companies within the Group are measured using the currency of the primary economic environment in which they operate (the functional currency). The consolidated financial statements are presented in Australian dollars, which is Cape Lambert’s functional and presentation currency. Group companies The results and financial position of all the group entities (none of which has the currency of a hyperinflationary economy) that have a functional currency different from the presentation currency are translated into the presentation currency as follows: a. assets and liabilities for each Statement of Financial Position presented are translated at the closing rate at the date
of that Statement of Financial Position; b. income and expenses for each statement of profit or loss and other comprehensive income are translated at average
exchange rates (unless this is not a reasonable approximation of the cumulative effect of the rates prevailing on the transaction dates, in which case income and expenses are translated at the dates of the transactions), and
c. all resulting exchange differences are recognised in other comprehensive income. On consolidation, exchange differences arising from the translation of any net investment in foreign entities are recognised in other comprehensive income. When a foreign operation is sold, a proportionate share of such exchange differences is reclassified to profit or loss, as part of the gain or loss on sale where applicable. Goodwill and fair value adjustments arising on the acquisition of a foreign entity are treated as assets and liabilities of the foreign entities and translated at the closing rate. (m) Trade and other payables These amounts represent liabilities for goods and services provided to the Group prior to the end of financial year which are unpaid. The amounts are unsecured and are usually paid within 30 days of recognition. Trade and other payables are presented as current liabilities unless payment is not due within 12 months from the reporting date. They are recognised initially at their fair value and subsequently measured at amortised cost using the effective interest method.
For
per
sona
l use
onl
y

ANNUAL REPORT 2019
NOTES TO THE CONSOLIDATED FINANCIAL STATEMENTS
34
(n) Employee Benefits Provision is made for benefits accruing to employees in respect of wages and salaries, annual leave and long service leave when it is probable that settlement will be required and they are capable of being measured reliably. Provisions made in respect of employee benefits expected to be wholly settled within 12 months are measured at their nominal values using the remuneration rate expected to apply at the time of settlement. Provisions made in respect of employee benefits which are not expected to be wholly settled within 12 months are measured as the present value of the estimated future cash outflows to be made by the Group in respect of services provided by employees up to the reporting date. The liability for long service leave is recognised in the provision for employee benefits and measured as the present value of expected future payments to be made in respect of services provided by employees up to the reporting date. Refer also to note 2(t) for accounting policy regarding share based payments. (o) Provisions Provisions are recognised when the Group has a present obligation, the future sacrifice of economic benefits is probable, and the amount of the provision can be measured reliably. The amount recognised as a provision is the best estimate of the consideration required to settle the present obligation at reporting date, taking into account the risks and uncertainties surrounding the obligation. Where a provision is measured using the cashflows estimated to settle the present obligation, its carrying amount is the present value of those cashflows. When some or all of the economic benefits required to settle a provision are expected to be recovered from a third party, the receivable is recognised as an asset if it is virtually certain that recovery will be received and the amount of the receivable can be measured reliably. Costs of site restoration are provided over the life of the facility from when exploration commences and are included in the costs of that stage. Site restoration costs include the dismantling and removal of mining plant, equipment and building structures, waste removal, and rehabilitation of the site in accordance with clauses of the mining permits. Such costs have been determined using estimates of future costs, current legal requirements and technology. Any changes in the estimates for the costs are accounted on a prospective basis. In determining the costs of site restoration, there is uncertainty regarding the nature and extent of the restoration due to community expectations and future legislation. (p) Convertible notes Convertible notes that do not contain an equity component are accounted for as a financial liability through profit or loss with a value equating to the total proceed/face value with no day one gain or loss and subsequently value will change depending on the changes in the share price/ redemption event and or accretion of the value of the discount on the note. If the convertible note is converted, the carrying amounts of the derivative and liability components are transferred to share capital as consideration for the shares issued. If the note is redeemed, any difference between the amount paid and the carrying amounts of both components is recognised in the statement of profit or loss. (q) Impairment of non-current assets Goodwill and intangible assets that have an indefinite useful life are not subject to amortisation and are tested annually for impairment or more frequently if events or changes in circumstances indicate that they might be impaired. Other assets are tested for impairment whenever events or changes in circumstances indicate that the carrying amount may not be recoverable. An impairment loss is recognised for the amount by which the asset's carrying amount exceeds its recoverable amount. The recoverable amount is the higher of an asset's fair value less costs to sell and value in use. For
For
per
sona
l use
onl
y

ANNUAL REPORT 2019
NOTES TO THE CONSOLIDATED FINANCIAL STATEMENTS
35
the purposes of assessing impairment, assets are grouped at the lowest levels for which there are separately identifiable cash inflows which are largely independent of the cash inflows from other assets or groups of assets (cash-generating units). Non-financial assets other than goodwill that suffered impairment are reviewed for possible reversal of the impairment at the end of each reporting period. (r) Income Tax Current Tax Current tax is calculated by reference to the amount of income taxes payable or recoverable in respect of the taxable profit or tax loss for the period. It is calculated using tax rates and tax laws that have been enacted or substantively enacted by reporting date. Current tax for current and prior periods is recognised as a liability (or asset) to the extent that it is unpaid (or refundable). Deferred Tax Deferred tax is accounted for using the comprehensive balance sheet liability method in respect of temporary differences arising from differences between the carrying amount of assets and liabilities in the financial statements and the corresponding tax base of those items. In principle, deferred tax liabilities are recognised for all taxable temporary differences. Deferred tax assets are recognised to the extent that it is probable that sufficient taxable amounts will be available against which deductible temporary differences or unused tax losses and tax offsets can be utilised. However, deferred tax assets and liabilities are not recognised if the temporary differences giving rise to them arise from the initial recognition of assets and liabilities (other than as a result of a business combination) which affects neither taxable income nor accounting profit. Furthermore, a deferred tax liability is not recognised in relation to taxable temporary differences arising from goodwill. Deferred tax liabilities are recognised for taxable temporary differences arising on investments in subsidiaries, branches, associates and joint ventures except where the Group is able to control the reversal of the temporary differences and it is probable that the temporary differences will not reverse in the foreseeable future. Deferred tax assets arising from deductible temporary differences associated with these investments and interests are only recognised to the extent that it is probable that there will be sufficient taxable profits against which to utilise the benefits of the temporary differences and they are expected to reverse in the foreseeable future. Deferred tax assets and liabilities are measured at the tax rates that are expected to apply to the period(s) when the asset and liability giving rise to them are realised or settled, based on tax rates (and tax laws) that have been enacted or substantively enacted by reporting date. The measurement of deferred tax liabilities and assets reflects the tax consequences that would follow from the manner in which the Group expects, at the reporting date, to recover or settle the carrying amount of its assets and liabilities. Deferred tax assets and liabilities are offset when they relate to income taxes levied by the same taxation authority and the Company/Group intends to settle its current tax assets and liabilities on a net basis. The Group has implemented the tax consolidation legislation. As a consequence, these entities are taxed as a single entity and the deferred tax assets and liabilities of these entities are set off in the consolidated financial statements. Current and deferred tax for the period Current and deferred tax is recognised as an expense or income in the statement of profit or loss and other comprehensive income except when it relates to items credited or debited directly to equity, in which case the deferred tax is also recognised directly in equity. (s) Revenue recognition Revenue is recognised to the extent that it is probable that economic benefits will flow to the Group and the revenue can be reliably measured. Revenue is measured at the fair value of the consideration to which the Group expect to be entitled to in exchange for transferring goods or services to a customer.
For
per
sona
l use
onl
y

ANNUAL REPORT 2019
NOTES TO THE CONSOLIDATED FINANCIAL STATEMENTS
36
Rent Rent revenue is recognised on a straight-line basis over the lease term. Lease incentives granted are recognised as part of the rental revenue. Contingent rental are recognised as income in the period when earned. Interest Revenue Interest revenue is recognised using the effective interest rate method. (t) Share-based Payments Equity-settled share-based payments are measured at fair value at the date of grant. Fair value is measured by use of the Black-Scholes option pricing model. The expected life used in the model has been adjusted, based on management’s best estimate, for the effects of non-transferability and exercise restrictions. The fair value determined at the grant date of the equity-settled share-based payments is expensed on a straight-line basis over the vesting period, based on the Group’s estimate of shares that will eventually vest. For cash-settled share-based payments, a liability equal to the portion of the goods or services received is recognised at the current fair value determined at each reporting date. (u) Exploration and Evaluation Expenditure Exploration and evaluation expenditure incurred is accumulated in respect of each identifiable area of interest where right of tenure is current and active and significant operations are continuing in the area of interest. Costs associated with these identifiable areas of interests are only carried forward to the extent that they are expected to be recouped through the successful development of the area or where activities in the area have not yet reached a stage that permits reasonable assessment of the existence of economically recoverable reserves. Accumulated costs in relation to an abandoned area are written off in full in the statement of profit or loss and other comprehensive income in the year in which the decision to abandon the area is made. When production commences, the accumulated costs for the relevant area of interest are amortised over the life of the area according to the rate of depletion of the economically recoverable reserves. A regular review is undertaken of each area of interest to determine the appropriateness of continuing to carry forward costs in relation to that area of interest. (v) Earnings per Share Basic earnings per share is calculated by dividing the profit attributable to equity holders of the Group, excluding any costs of servicing equity other than ordinary shares, by the weighted average number of ordinary shares outstanding during the financial year, adjusted for bonus elements in ordinary shares issued during the year. Diluted earnings per share adjusts the figures used in the determination of basic earnings per share to take into account the after income tax effect of interests and other financing costs associated with dilutive potential ordinary shares and the weighted average number of additional ordinary shares that would have been outstanding assuming the conversion of all dilutive potential ordinary shares. (w) Business Combinations The acquisition method of accounting is used to account for all business combinations. The consideration transferred in a business combination is measured at fair value, which is calculated as the sum of the acquisition date fair values of the assets transferred by the acquirer, the liabilities incurred by the acquirer to the former owners of the acquiree and the equity issued by the acquirer, and the amount of any non controlling interest in the acquiree. For each business combination, the acquirer measures the non-controlling interest in the acquiree either at fair value or at the proportionate share of the acquiree’s identifiable net assets. Costs directly attributable to the acquisition are expensed.
For
per
sona
l use
onl
y

ANNUAL REPORT 2019
NOTES TO THE CONSOLIDATED FINANCIAL STATEMENTS
37
If the business combination is achieved in stages, the acquisition date fair value of the acquirer’s previously held equity interest in the acquiree is remeasured at fair value as at the acquisition date through profit or loss.
Identifiable assets acquired and liabilities and contingent liabilities assumed in a business combination are measured initially at their fair values at the acquisition date, irrespective of the extent of any non controlling shareholders’ interest. The excess of the cost of acquisition over the fair value of the Group’s share of the identifiable net assets acquired is recorded as goodwill. If the cost of acquisition is less than the Group's share of the fair value of the identifiable net assets acquired, the difference is recognised directly in the statement of profit or loss and other comprehensive income, but only after a reassessment of the identification and measurement of the net assets acquired. Any contingent consideration to be transferred by the acquiree is recognised at fair value at the acquisition date. Subsequent changes to the fair value of the contingent consideration which is deemed to be an asset or liability will be recognised in accordance with AASB 139 either in profit or loss or in other comprehensive income. If the contingent consideration is classified as equity, it shall not be remeasured. (x) Leases
Leases in which a significant portion of the risks and rewards of ownership are not transferred to the Group as lessee are classified as operating leases. Payments made under operating leases (net of any incentives received from the lessor) are charged to the statement of profit or loss and other comprehensive income on a straight line basis over the period of the lease. (y) Contributed equity
Ordinary shares are classified as equity. Incremental costs directly attributable to the issue of new shares or options are shown in equity as a deduction, net of tax, from the proceeds. (z) Parent entity financial information The financial information for the parent entity, Cape Lambert Resources Limited, disclosed in note 31 has been prepared on the same basis as the consolidated financial statements, except as set out below: Investments in subsidiaries and associates Investments in subsidiaries and associates are accounted for at cost in the financial statements of Cape Lambert Resources Limited. Dividends received from associates are recognised in the parent entity’s statement of profit or loss and other comprehensive income, rather than being deducted from the carrying amount of these investments.
Tax consolidation legislation Cape Lambert Resources Limited and the controlled entities in the tax consolidated group account for their own current and deferred tax amounts. These tax amounts are measured as if each entity in the tax consolidated group continues to be a stand-alone taxpayer in its own right.
In addition to its own current and deferred tax amounts, Cape Lambert Resources Limited also recognises the current tax liabilities (or assets) and the deferred tax assets arising from unused tax losses and unused tax credits assumed from controlled entities in the tax consolidated group.
The entities have entered into a tax funding agreement under which the wholly-owned entities fully compensate Cape Lambert Resources Limited for any current tax payables assumed and are compensated by Cape Lambert Resources Limited for any current tax receivable and deferred tax assets relating to unused tax losses or unused tax credits that are transferred to Cape Lambert Resources Limited under the tax consolidation legislation. The funding amounts are determined by reference to the amounts recognised in the wholly-owned entities’ financial statements.
The amounts receivable/payable under the tax funding agreement are due upon receipt of the funding advice from the head entity, which is issued as soon as practicable after the end of each financial year. The head entity may also require payment of interim funding amounts to assist with its obligation to pay tax instalments.
For
per
sona
l use
onl
y

ANNUAL REPORT 2019
NOTES TO THE CONSOLIDATED FINANCIAL STATEMENTS
38
Assets or liabilities arising under tax funding agreements with the tax consolidated entities are recognised as current amounts receivable from or payable to other entities in the group.
Any difference between the amounts assumed and amounts receivable or payable under the tax funding agreement are recognised as a contribution to (or distribution from) wholly-owned tax consolidated entities. (z) Dividends Provision is made for the amount of any dividend declared, being appropriately authorised and no longer at the discretion of the entity, on or before the end of the financial year but not distributed as reporting date.
(ab) Critical Judgements in Applying the Group’s Accounting Policies The Group makes estimates and assumptions concerning the future. The resulting accounting estimates will, by definition, seldom equal the related actual results. The estimates and assumptions that have a significant risk of causing a material adjustment to the carrying amounts of assets and liabilities within the next financial year are discussed below. Exploration and Evaluation The Group’s accounting policy for exploration and evaluation is set out at note 2(u). The application of this policy necessarily requires management to make certain estimates and assumptions as to future events and circumstances, in particular, the assessment of whether economic quantities of reserves may be determined. Any such estimates and assumptions may change as new information becomes available. If, after having capitalised expenditure, it is determined that recovery of the expenditure by future exploitation or sale is unlikely, then the relevant capitalised amount is written off in the statement of profit or loss and other comprehensive income. Income taxes The Group is subject to income taxes in Australia and jurisdictions where it has foreign operations. Significant judgement is required in determining the worldwide provision for income taxes. There are many transactions and calculations undertaken during the ordinary course of business for which the ultimate tax determination is uncertain. The Group estimates its tax liabilities based on the Group’s understanding of the tax laws in the relevant jurisdictions. Where the final tax outcome of these matters is different from the amounts that were initially recorded, such differences will impact the current and deferred income tax assets and liabilities in the period in which such determination is made. The Group recognises deferred tax assets relating to carried forward tax losses to the extent there are sufficient taxable temporary differences (deferred tax liabilities) relating to the same taxation authority against which the unused tax losses can be utilised. However, utilisation of the tax losses also depends on the ability of the entity to satisfy certain tests at the time the losses are recouped.
Impairment The Group assesses impairment at each reporting date by evaluating conditions specific to the Group that may lead to impairment of assets. Where an impairment trigger exists, the recoverable amounts of the assets are determined. As at 30 June 2019, management have recognised impairment losses in respect of those assets which had a carrying value which exceeded their recoverable amounts. Accounting for Investments The Group makes judgements as to its level of influence over its investments, which impacts how it accounts for these investments. The Group may determine that control of an investment exists, despite its interest in it being less than 50%. The criteria for this assessment includes: power over the investee; the right to variable returns from its involvement with the investee; and the ability to use power over investee to affect investment returns. If, on the balance of these criteria, control is deemed to exist, the Group accounts for its investment using the consolidation method. The Group may also determine that significant influence of an investment exists, despite its interest in it being less than 20%. The criteria for this assessment includes: representation on the investee’s board of directors, participation in policy
For
per
sona
l use
onl
y

ANNUAL REPORT 2019
NOTES TO THE CONSOLIDATED FINANCIAL STATEMENTS
39
making processes; material transactions between investor and investee; interchange of managerial personnel; and the provision of essential technical information. If, on the balance of these criteria, significant influence is deemed to exist, the Group accounts for its investment using the equity method. 3. PROFIT/(LOSS) FROM OPERATIONS
2019 2018 $ $
(a) Revenue Interest income 2,978 8,998 Rental revenue 275,768 359,378
278,746 368,377
(b) Other income Unrealised foreign currency exchange gain/(loss) 1,861 (1,644) Foreign currency exchange gain/(loss) (2,286) (7,185) Gain on sale of fixed assets - 1,091 Sale of Mayoko royalty 25 - 500,000 Other income 79,741 207,807
79,316 700,069
(c) Depreciation and amortisation expense Depreciation of plant and equipment (29,430) (26,890) Amortisation of leasehold improvements - (1,361)
10 (29,430) (28,251)
(d) Occupancy expenses Rental expense relating to operating leases - minimum lease payments (459,426) (492,432) Other occupancy expenses (205,229) (227,046) Provision for end of lease obligations 24,694 47,187
(639,961) (672,291)
(e) Other expenses Administration expenses (342,977) (415,082) Exploration expenditure expensed/(reversed) (15,899) (599,473) Other expenses (293) (2,882)
(359,169) (1,017,437)
(f) Gain / (loss) on fair value of financial assets through profit and loss Gain / (loss) on fair value of financial assets (shares in listed entities) through profit and loss 8(a) (721,956) (1,001,618)
(721,956) (1,001,618)
4. INCOME TAXES
2019 2018 $ $
Major components of income tax expense for the year are: Income statement Current income
Current income tax charge / (benefit) - (24,297)
Income tax (benefit) / expense reported in income statement - (24,297)
Statement of changes in equity
Income tax expense reported in equity - -
For
per
sona
l use
onl
y

ANNUAL REPORT 2019
NOTES TO THE CONSOLIDATED FINANCIAL STATEMENTS
40
Reconciliation A reconciliation of income tax expense / (benefit) applicable to accounting profit / (loss) before income tax at the statutory income tax rate to income tax expense / (benefit) at the Company’s effective income tax rate for the year is as follows:
2019 2018 $ $
Accounting (loss) before income tax (6,459,163) (852,593) Income tax benefit at the statutory income tax rate of 30% (2018: 30%) (1,937,749) (255,778) Adjusted for:
Non-deductible expenses (373) 22,562 Share based payments 901 48,667 Deferred tax assets and tax losses not recognised 1,375,977 9,437,686 Share of losses of associates 382,118 (3,661,885) Impairment/de-recognition of exploration assets 25,351 184,007 Impairment loss on associates 153,775 2,055,687 Forgiveness of intercompany loans - (4,249,559) Transfer investment in associate to investment in listed entity at fair value - (3,581,389) Commissioner’s Settlement Offer - (24,297)
Income tax expense / (benefit) reported in income statement - (24,297)
Recognised deferred tax assets and liabilities The deferred tax liability balance comprises temporary differences attributable to:
2019 2018 $ $
The deferred tax liability balance comprises temporary differences attributable to: Accrued income 516,101 854,528 Capitalised expenditure (314,108) 801,480 Unrealised foreign exchange gains / losses (676,406) (676,406) Financial assets 3,264,591 3,074,235 Bad debts (19,730) 5,128 Costs deductible over five years 101,689 143,030
Deferred tax liability 2,872,137 4,201,995
The deferred tax asset balance comprises temporary differences attributable to: Accrued expenses and provisions (2,872,137) (4,201,995)
Deferred tax asset (2,872,137) (4,201,995)
Net deferred tax asset /(liability) - -
Movement in temporary differences during the current year
Balance
1 July 2018 Recognised in
Income Balance
30 June 2019 Consolidated $ $ $
Accrued expenses and provisions 854,528 (338,427) 516,101 Financial assets 3,074,235 190,356 3,264,591 Capitalised exploration expenditure 801,480 (1,115,588) (314,108) Unrealised foreign exchange gains / losses (676,406) - (676,406) Other 148,158 (66,199) 81,959
Net deferred tax asset / (liability) 4,201,995 (1,329,859) 2,872,137
For
per
sona
l use
onl
y
ANNUAL REPORT 2019
NOTES TO THE CONSOLIDATED FINANCIAL STATEMENTS
41
Movement in temporary differences during the prior year
Balance
1 July 2017 Recognised in
Income Balance
30 June 2018 Consolidated $ $ $
Accrued expenses and provisions 746,235 108,294 854,528 Financial assets (807,637) 3,881,872 3,074,235 Capitalised exploration expenditure 458,407 343,074 801,480 Unrealised foreign exchange gains / losses (681,483) 5,077 (676,406) Other 102,746 45,413 148,158
Net deferred tax asset / (liability) (181,732) 4,383,730 4,201,995
2019 2018 $ $
Unrecognised deferred tax assets Deferred tax assets have not been recognised in respect of the following items: Tax losses 217,951,607 214,884,916
@ 30% 65,385,482 64,465,475
The tax losses do not expire under current legislation. Deferred tax assets have not been recognised in respect of these
items because it is not probable that future taxable profit will be available against which the Group can utilise the
benefits.
5. SHARE-BASED PAYMENT ARRANGEMENTS (a) Shares Share-based payments granted during the current year There were no shares issued as share based payments made during the year. Share-based payments granted during the prior year There were no shares issued as share based payments made during the year. (b) Options Options granted as share based payments during the current year The following options were granted as share based payment arrangements during the year ended 30 June 2019: On 13 December 2018, the Company issued 10,000,000 unlisted options to Director Stefan Muller as approved at the Company’s 2018 AGM. The options are exercisable at $0.075 each on or before 30 June 2019 and were issued to provide a performance linked incentive component in the remuneration package of Mr Muller in order to motivate and reward the performance of Mr Muller in a manner that aligns with shareholders’ interests. On 13 December 2018, the Company issued 5,000,000 unlisted options to Steubing as approved at the Company’s 2018 AGM. The options are exercisable at $0.05 each on or before 13 December 2020 and were issued for services provided in relation to a placement. The fair value of services provided could not be reliably estimated and as such the value has been based on the fair value of options issued. On 13 December 2018, the Company issued 15,000,000 unlisted options to Gulf Energy International Limited as approved at the Company’s 2018 AGM. The options are exercisable at $0.03 each on or before 30 June 2021 and were issued for services provided in relation to a placement. The fair value of services provided could not be reliably estimated and as such the value has been based on the fair value of options issued. The fair value of the equity-settled share options granted is estimated as at the date of grant using the Black Scholes model taking into account the terms and conditions upon which the options were granted.
For
per
sona
l use
onl
y

ANNUAL REPORT 2019
NOTES TO THE CONSOLIDATED FINANCIAL STATEMENTS
42
Assumption
Number options issued 10,000,000 5,000,000 15,000,000 Dividend yield 0.00% 0.00% 0.00% Expected volatility 98% 98% 98% Risk-free interest rate 2.04% 2.04% 2.04% Expected life of options 0.58 years 2.04 years 2.59 years Exercise price $0.075 $0.05 $0.03 Grant date share price $0.018 $0.018 $0.018 Fair value per option $0.0003 $0.0052 $0.0085
The expected life of the options is based on historical data and is not necessarily indicative of exercise patterns that may occur. The expected volatility reflects the assumption that the historical volatility is indicative of future trends, which may also not necessarily be the actual outcome. No other features of options granted were incorporated into the measurement of fair value. Options outstanding at reporting date for share based payments The following options were outstanding at 30 June 2019:
Grant Date Exercise Price Number of Options Expiry Date Listed/Unlisted
19 March 2018 $0.07 5,000,000 19 March 2020 Unlisted 31 March 2018 $0.04 5,250,000 31 March 2020 Unlisted 29 November 2018 $0.03 15,000,000 30 June 2021 Unlisted 29 November 2018 $0.05 5,000,000 13 December 2020 Unlisted
30,250,000
Reconciliation of options on issue The following reconciles the outstanding share options granted, exercised and lapsed during the financial year:
2019 2018 Number of
Options Weighted Average
Exercise Price $
Number of Options
Weighted Average Exercise Price
$
Balance at beginning of the financial year 10,250,000 0.05 - - Granted during the financial year 30,000,000 0.048 10,250,000 0.05 Exercised during the financial year - - - - Lapsed during the financial year (i) (10,000,000) 0.075 - - Forfeited during the financial year (ii) - - - - -
Balance at end of the financial year 30,250,000 0.04 10,250,000 0.05
Exercisable at end of the financial year 30,250,000 0.04 10,250,000 0.05
(i) During the current year 10,000,000 (30 June 2018: nil) share options lapsed. (ii) During the current and previous year, there were no share options forfeited.
Rights attaching to options The Employee Incentive Scheme, approved by the shareholders in December 2000, entitles each option holder to one share exercisable any time up to or on the expiry date at the stated exercise price; does not confer the right to a change in exercise price; subject to the Corporations Act 2001, the ASX Listing Rules and the Company’s Constitution are freely transferable; the shares, upon exercise of the options, will rank pari passu with the Company’s then issued shares; will be applied for quotation; the Option Holder can participate in a pro rata issue to the holders of the underlying securities in the Company if the Options are exercised before the record date of an entitlement; in the event of any reconstruction of the issued capital of the Company, all rights of the option holder will be changed to the extent necessary to comply with the Listing Rules applying to the reconstruction of capital, at the time of the reconstruction.
For
per
sona
l use
onl
y
ANNUAL REPORT 2019
NOTES TO THE CONSOLIDATED FINANCIAL STATEMENTS
43
(c) Expenses arising from share-based payments Total costs arising from share-based payment transactions recognised as expenses during the year are as follows:
2019 2018 $ $
Options issued to employees and consultants - 162,224 Options issued to directors 3,005 -
Total expense recognised in profit or loss 3,005 162,224
Options issued for capital raising costs 152,971 -
Total expense recognised in equity 152,971 -
Shares issued to settle liabilities 113,967 -
Total expense recognised against liabilities 113,967 -
Total share-based payments expense 269,943 162,224
The 2019 and 2018 expense relates to the issue of the options detailed in note 5(b) above. 6. REMUNERATION OF AUDITORS The auditor of Cape Lambert Resources Limited is BDO (WA) Pty Ltd.
2019 2018 $ $
Amounts received or due and receivable by BDO (WA) Pty Ltd for: An audit or review of the financial report of the entity and any other entity in the consolidated group 58,709 59,970 Tax - - Other - -
58,709 59,970
Amounts received or due and receivable by non-BDO (WA) Pty Ltd audit firms for: An audit or review of the financial report of the entity and any other entity in the Group - 20,828
- 20,828
7. TRADE AND OTHER RECEIVABLES
Note 2019 2018 $ $
Trade and other receivables – current Trade debtors 3,756,348 3,737,577 GST recoverable and other debtors 53,527 100,035 Prepayments 11,706 36,700 Interest receivable - 70 Deferred consideration receivable (a) 2,500,000 2,500,000 Loans receivable (b) - - Allowance for expected credit loss (c) (6,096,969) (6,054,027)
224,612 320,355
For
per
sona
l use
onl
y
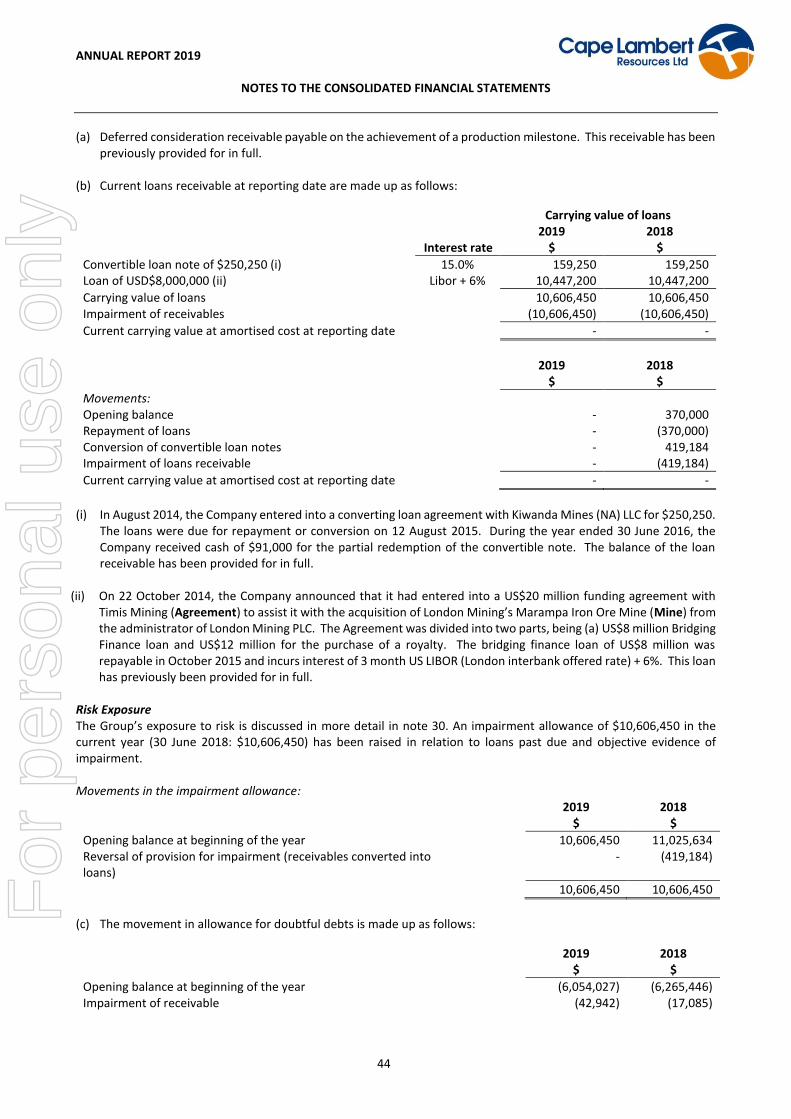
ANNUAL REPORT 2019
NOTES TO THE CONSOLIDATED FINANCIAL STATEMENTS
44
(a) Deferred consideration receivable payable on the achievement of a production milestone. This receivable has been previously provided for in full.
(b) Current loans receivable at reporting date are made up as follows:
Carrying value of loans 2019 2018 Interest rate $ $
Convertible loan note of $250,250 (i) 15.0% 159,250 159,250 Loan of USD$8,000,000 (ii) Libor + 6% 10,447,200 10,447,200
Carrying value of loans 10,606,450 10,606,450 Impairment of receivables (10,606,450) (10,606,450)
Current carrying value at amortised cost at reporting date - -
2019 2018 $ $
Movements: Opening balance - 370,000 Repayment of loans - (370,000) Conversion of convertible loan notes - 419,184 Impairment of loans receivable - (419,184)
Current carrying value at amortised cost at reporting date - -
(i) In August 2014, the Company entered into a converting loan agreement with Kiwanda Mines (NA) LLC for $250,250.
The loans were due for repayment or conversion on 12 August 2015. During the year ended 30 June 2016, the Company received cash of $91,000 for the partial redemption of the convertible note. The balance of the loan receivable has been provided for in full.
(ii) On 22 October 2014, the Company announced that it had entered into a US$20 million funding agreement with
Timis Mining (Agreement) to assist it with the acquisition of London Mining’s Marampa Iron Ore Mine (Mine) from the administrator of London Mining PLC. The Agreement was divided into two parts, being (a) US$8 million Bridging Finance loan and US$12 million for the purchase of a royalty. The bridging finance loan of US$8 million was repayable in October 2015 and incurs interest of 3 month US LIBOR (London interbank offered rate) + 6%. This loan has previously been provided for in full.
Risk Exposure The Group’s exposure to risk is discussed in more detail in note 30. An impairment allowance of $10,606,450 in the current year (30 June 2018: $10,606,450) has been raised in relation to loans past due and objective evidence of impairment. Movements in the impairment allowance:
2019 2018 $ $
Opening balance at beginning of the year 10,606,450 11,025,634 Reversal of provision for impairment (receivables converted into loans)
- (419,184)
10,606,450 10,606,450
(c) The movement in allowance for doubtful debts is made up as follows:
2019 2018 $ $
Opening balance at beginning of the year (6,054,027) (6,265,446) Impairment of receivable (42,942) (17,085)
For
per
sona
l use
onl
y

ANNUAL REPORT 2019
NOTES TO THE CONSOLIDATED FINANCIAL STATEMENTS
45
Reversal of impairment (receivable converted into shares) - 160,492 Reversal of impairment (repayment of debt) - 68,012
(6,096,969) (6,054,027)
8. OTHER FINANCIAL ASSETS
Note 2019 2018 $ $
Financial Assets at Fair value through Profit or Loss Shares in listed entities (a) 979,620 2,497,722 Shares in unlisted entities – at cost (b) 17,435 70,000
Total Financial Assets 997,055 2,567,722
(a) Movements in the carrying amount of the shares in listed entities
Note 2019 2018 $ $
Carrying value at beginning of the year 2,497,722 1,138,188 Fair value of investments at reclassification from associate to fair value profit & loss
11(b) - 2,361,152
Purchase of equity investments 3,854 - Reclassification of financial asset at fair value through profit or loss to associate
11(b) 199,052 540,283
Disposal of equity investments (999,052) (540,283) Gain/(Loss) on fair value of financial assets through profit or loss 3(f) (721,956) (1,001,618)
979,620 2,497,722
(b) Movements in the carrying amount of the shares in unlisted entities
2019 2018 $ $
Movements: Carrying value at beginning of year (cost less impairment) 70,000 70,000 Impairment of investment (52,565) -
17,435 70,000
9. RESTRICTED CASH
2019 2018 $ $
Current
Term deposits (a) 12,500 44,546
12,500 44,546
Movements:
Opening balance at beginning of the year 44,546 104,617
Application funds refunded by Fe Limited - (60,071)
Security against loan (32,046) -
12,500 44,546
Non current
Term deposits (a) 81,833 81,833
(a) Restricted cash relates to term deposits, which are not readily accessible to the Group, held with financial
institutions as security for bank guarantees issued to:
For
per
sona
l use
onl
y

ANNUAL REPORT 2019
NOTES TO THE CONSOLIDATED FINANCIAL STATEMENTS
46
- Various environmental regulatory departments in respect of the potential rehabilitation of exploration areas; and
- Landlords of leased properties.
10. PROPERTY, PLANT AND EQUIPMENT
(a) The residual values, useful lives and methods of depreciation of property, plant and equipment are reviewed at
each financial year end and adjusted prospectively, if appropriate. (b) The impairment loss represents the write down of certain plant and equipment to the recoverable amount. An
item of property, plant and equipment initially recognised is derecognised when no future economic benefits are expected from use or its disposal.
Plant &
Equipment
Buildings
Motor
Vehicles
Furniture & Fittings
Leasehold Improvements
Total
$ $ $ $ $ $
Gross carrying amount – at cost At 1 July 2017 180,343 65,389 9,810 59,673 1,464,351 1,779,657 Additions 4,442 - - - - 4,442 Write down (a) (b) (55,507) - - - - (55,507) Exchange differences 135 2,433 365 2,120 - 5,052 At 30 June 2018 129,413 67,822 10,175 61,793 1,464,351 1,733,644 Additions 10,721 - - - - 10,721 Exchange differences 204 3,689 553 3,214 - 7,660
At 30 June 2019 140,338 71,511 10,728 65,007 1,464,351 1,752,025
Accumulated depreciation At 1 July 2017 (125,645) - (2,984) (56,914) (1,462,989) (1,648,624) Depreciation expense (22,061) - (3,234) (1,595) (1,362) (28,251) Disposal of assets 2,764 - - - - 2,764 Write down (a) (b) 52,538 - - - - 52,538 Exchange differences (130) - (260) (2,108) - (2,498) At 30 June 2018 (92,534) - (6,478) (60,617) (1,464,351) (1,624,071) Depreciation expense (25,013) - (3,505) (912) - (29,430) Disposal of assets - - - - - - Exchange differences (194) - (414) (3,191) - (3,799)
At 30 June 2019 (117,741) - (10,397) (64,720) (1,464,351) (1,657,300)
Net Book Value At 1 July 2017 54,697 65,389 6,826 2,759 1,362 131,033 Additions 7,206 - - - - 7,206 Write down (a) (b) (2,969) - - - - (2,969) Depreciation expense (22,061) - (3,234) (1,595) (1,362) (28,251) Exchange differences 5 2,433 105 12 - 2,554
At 30 June 2018 36,878 67,822 3,697 1,176 - 109,573
Additions 10,721 - - - - 10,721 Depreciation expense (25,013) - (3,505) (912) - (29,430) Exchange differences 10 3,689 139 23 - 3,861
At 30 June 2019 22,596 71,511 331 287 0 94,725
For
per
sona
l use
onl
y

ANNUAL REPORT 2019
NOTES TO THE CONSOLIDATED FINANCIAL STATEMENTS
47
11. INVESTMENTS IN ASSOCIATED ENTITIES 2019 2018 $ $
Investments in associates accounted for using the equity method 6,030,739 7,115,698
(a) Investment details
Percentage held at reporting date Year ended Year ended 2019 2018 2019 2018 % % $ $
European Lithium Limited1 10.96 12.01 3,551,311 3,615,329
Fe Limited2 31.91 39.33 2,479,428 3,500,367
6,030,739 7,115,698
1 Although the Company holds less than a 20% interest in European Lithium Ltd (Euro), this investment is equity accounted given the significant influence the Company has on Euro through Mr Sage’s role on the board and the interchange of management personnel. 2 Prior to 2018, the Company controlled Fe Limited (Fe) through its direct shareholding and indirect shareholding through Cauldron Energy Limited (Cauldron), and as such, the Company consolidated Fe into its group for reporting purposes. Given that the Company lost its significant influence over Cauldron during the year, control has ceased to exist over Fe. The Company now accounts for its investment in Fe using the equity method. (b) Movements in the carrying amount of the investment in associates
2019 2018 $ $
Balance at beginning of period 7,115,698 3,417,907 Purchase of shares - 18,750 Sale of shares (199,051) (417,832) Interest in listed shares transferred to interest in associate (note 32) - 10,601,325 Conversion of debt into shares - 83,820 Share of profits/(losses) of associates recognised during the year (919,462) 148,108 Share of reserves of associates recognised during the year 187,007 186,871 Gain on transfer from associate accounting to fair value through Profit & Loss (i)
- 1,408,338
Reclassification to Financial Assets at fair value through Profit & Loss (note 8(a))
- (2,361,152)
Gain on dilution of interest in associate 565,270 881,851 Impairment reversal - 66,180 Impairment (loss) (e) (718,273) (6,918,469)
6,030,739 7,115,698
(i) Gain on transfer of investment in Cauldron Energy Limited (ASX: CXU) from associate to financial asset of $1,408,338 is the difference between the fair value of the investment at the date of transfer of $2,361,152, less the carrying value of the investment per equity method of $952,814.
(c) Fair value of investments in listed associates The fair value of listed associates has been determined by reference to published price quotations in an active market (level 1 in the fair value hierarchy).
2019 2018 $ $
European Lithium Limited 5,375,968 13,767,723 Fe Limited 2,479,427 3,500,367
For
per
sona
l use
onl
y
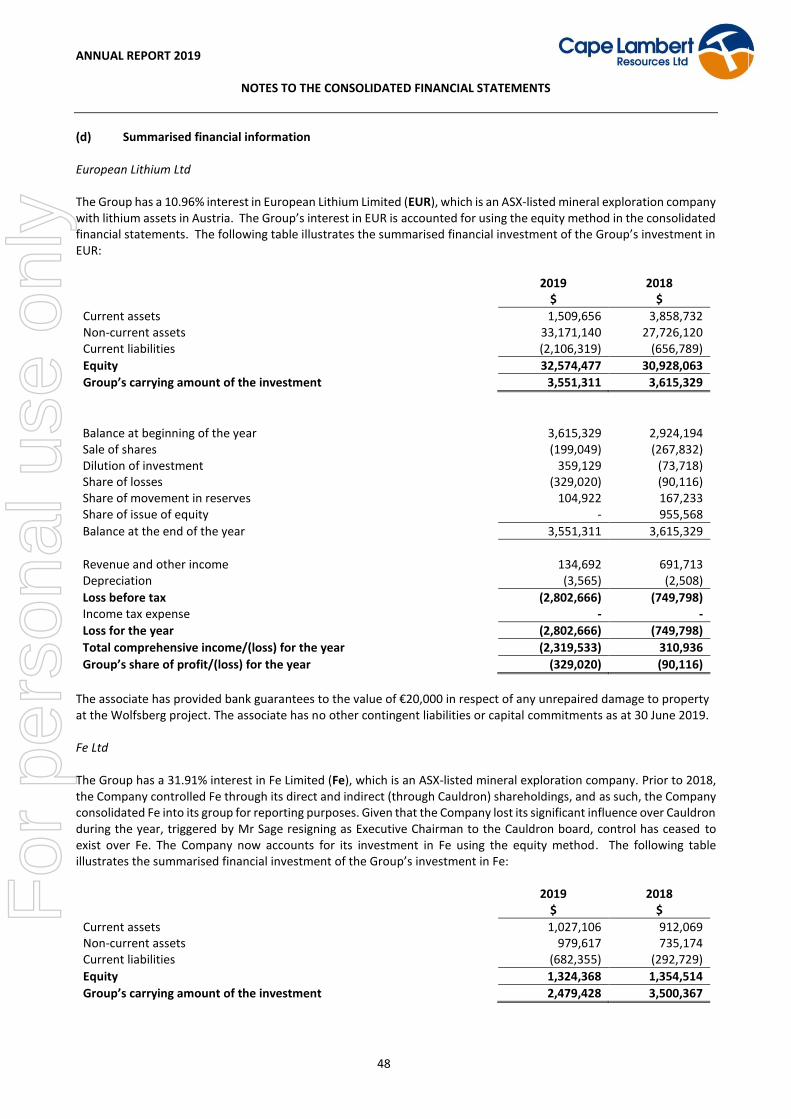
ANNUAL REPORT 2019
NOTES TO THE CONSOLIDATED FINANCIAL STATEMENTS
48
(d) Summarised financial information European Lithium Ltd The Group has a 10.96% interest in European Lithium Limited (EUR), which is an ASX-listed mineral exploration company with lithium assets in Austria. The Group’s interest in EUR is accounted for using the equity method in the consolidated financial statements. The following table illustrates the summarised financial investment of the Group’s investment in EUR:
2019 2018 $ $
Current assets 1,509,656 3,858,732 Non-current assets 33,171,140 27,726,120 Current liabilities (2,106,319) (656,789)
Equity 32,574,477 30,928,063
Group’s carrying amount of the investment 3,551,311 3,615,329
Balance at beginning of the year 3,615,329 2,924,194 Sale of shares (199,049) (267,832) Dilution of investment 359,129 (73,718) Share of losses (329,020) (90,116) Share of movement in reserves 104,922 167,233 Share of issue of equity - 955,568
Balance at the end of the year 3,551,311 3,615,329
Revenue and other income 134,692 691,713 Depreciation (3,565) (2,508)
Loss before tax (2,802,666) (749,798) Income tax expense - -
Loss for the year (2,802,666) (749,798)
Total comprehensive income/(loss) for the year (2,319,533) 310,936
Group’s share of profit/(loss) for the year (329,020) (90,116)
The associate has provided bank guarantees to the value of €20,000 in respect of any unrepaired damage to property at the Wolfsberg project. The associate has no other contingent liabilities or capital commitments as at 30 June 2019. Fe Ltd The Group has a 31.91% interest in Fe Limited (Fe), which is an ASX-listed mineral exploration company. Prior to 2018, the Company controlled Fe through its direct and indirect (through Cauldron) shareholdings, and as such, the Company consolidated Fe into its group for reporting purposes. Given that the Company lost its significant influence over Cauldron during the year, triggered by Mr Sage resigning as Executive Chairman to the Cauldron board, control has ceased to exist over Fe. The Company now accounts for its investment in Fe using the equity method. The following table illustrates the summarised financial investment of the Group’s investment in Fe:
2019 2018 $ $
Current assets 1,027,106 912,069 Non-current assets 979,617 735,174 Current liabilities (682,355) (292,729)
Equity 1,324,368 1,354,514
Group’s carrying amount of the investment 2,479,428 3,500,367
For
per
sona
l use
onl
y

ANNUAL REPORT 2019
NOTES TO THE CONSOLIDATED FINANCIAL STATEMENTS
49
2019 2018 $ $
Balance at beginning of the year 3,500,367 - Carrying value of FEL at date of reclassification to associate (refer note 32) - 10,601,325 Purchase of shares - 18,750 Share of losses (590,442) (224,376) Dilution of investment 206,141 Share of movement in reserves 82,085 23,137 Impairment (based on market value of shares) (718,723) (6,918,469)
Balance at the end of the year 2,479,428 3,500,367
2019 2018 $ $
Revenue and other income 2,979 425,338 Depreciation 70 -
Loss before tax (1,668,158) (1,082,275) Income tax expense - -
Loss for the year (1,668,158) (1,082,275)
Total comprehensive income/(loss) for the year (1,668,158) (1,082,275)
Group’s share of profit/(loss) for the year (590,442) (224,376)
The associate has no contingent liabilities or capital commitments as at 30 June 2019. (e) Impairment assessment The carrying amounts of the investments in associates were assessed for impairment at 30 June 2019. The market value prices of some investments were below their carrying value. As a result, the recoverable amount has been measured at fair value less cost to sell. Impairment losses of $718,723 (2018: $6,852,289) have been recognised. 12. INVESTMENT IN JOINT VENTURE
2019 2018 $ $
Investment in joint venture accounted for using the equity method - 2,882,726
(a) Movements in the carrying amount of the investment in joint venture
2019 2018 $ $
Balance at beginning of period 2,882,726 - Reclassification from deferred expenses (a) - 2,715,801 Cash investments 487,136 325,353 Invoices paid by the Company on behalf of the joint venture 1,019,757 - Share of losses of joint venture recognised during the year (1,006,302) (157,895) Other - (533) Impairment of investment in joint venture (b) (3,383,317) -
- 2,882,726
(a) As at 30 June 2017, the Company recognised deferred expenses of $2,715,801 on its Statement of financial position
to account for part of the consideration settled prior to the year end and prior to the incorporation of the joint venture company, Soludo-Lambert Mining SAS (Soludo-Lambert). Subsequently, operations commenced and Soludo-Lambert was incorporated in February 2018. As such, the Company now accounts for its investment in the Soludo-Lambert joint venture using the equity method, per AASB 128.
For
per
sona
l use
onl
y

ANNUAL REPORT 2019
NOTES TO THE CONSOLIDATED FINANCIAL STATEMENTS
50
(b) Impairment The carrying amounts of the investment in joint venture was assessed for impairment at 30 June 2019. The Company was responsible for funding the working capital and capital costs of Soludo-Lambert. Given the uncertainty regarding funding at 30 June 2019, the Company elected to impair its investment in the joint venture. Impairment losses of $3,383,317 (2018: $Nil) have been recognised. (b) Soludo-Lambert financial information
2019 2018 $ $
Current assets 10,328 25,872 Non-current assets 358,371 153,730 Current liabilities (647,010) -
Equity (278,311) 179,602
Group’s carrying amount of the investment - 2,882,726
2019 2018 $ $
Revenue and other income - - Depreciation (29,065) (5,582)
Loss before tax (2,012,604) (315,790) Income tax expense - -
Loss for the year (2,012,604) (315,790)
Total comprehensive income/(loss) for the year - -
Group’s share of profit/(loss) for the year (1,006,302) (157,895)
The joint venture has no contingent liabilities or capital commitments as at 30 June 2019. 13. EXPLORATION AND EVALUATION EXPENDITURE
2019 2018 $ $
Exploration and evaluation phases - 1,107,642
Movements: Carrying value at beginning of the year 1,107,642 33,551 Exploration and evaluation expenditure capitalised during the year 532,657 3,183,383 Provision/(reversal) for expenses (a) (4,154,206) - Exploration expenditure de-recognised during the year 2,647,350 (2,109,292) Foreign currency exchange gain/(loss) (133,443) -
Total exploration and evaluation phases - 1,107,642
(a) During the period, the Company received a letter from the Sierra Leone Ministry of Mines (MoM) informing
Marampa Iron Ore (SL) Limited (Marampa SL) of the cancellation of the Marampa mining license ML05/2014 due to non-payment of fees. In September 2014, Marampa SL submitted to the MoM an application letter entitled “Force Majeure to all Cape Lambert Operations in Sierra Leone” which was acknowledged by the MoM. The Company understood that the agreement with the MoM was that force majeure events were acknowledged and authorised and as such no fees would accrue or be payable until a processing facility was operating and Marampa SL is producing iron ore from Marampa. The Company understands that the notice of cancellation of license letter has incorrectly been issued by the new Sierra Leone government who are not aware of the agreement. In order to protect its position, Marampa SL has engaged Sierra Leone based lawyers BMT Law Chambers who has commenced legal action in the High Court of Sierra Leone regarding the status of the licence. The Company is of the view that any license fee obligations arising from the mining license agreement under a force majeure are suspended from that point in time and therefore pending legal action, the Company reversed all accrued license fees for its Sierra Leone operation during the period.
For
per
sona
l use
onl
y

ANNUAL REPORT 2019
NOTES TO THE CONSOLIDATED FINANCIAL STATEMENTS
51
The value of the exploration expenditure is dependent upon: ▪ the continuance of the rights to tenure of the areas of interest; ▪ the results of future exploration; and ▪ the recoupment of costs through successful development and exploitation of the areas of interest, or
alternatively, by their sale. Certain of Cape Lambert’s exploration properties may be subjected to claim(s) under native title, or contain sacred sites, or sites of significance to Indigenous people. As a result, exploration properties or areas within the tenements may be subject to exploration restrictions, mining restrictions and/or claims for compensation. At this time, it is not possible to quantify whether such claims exist, or the quantum of such claims. 14. TRADE AND OTHER PAYABLES
Current 2019 2018
$ $
Unsecured Trade payables 1,788,559 1,321,190 Other creditors and accruals (i) 307,487 4,391,730 Withholding tax 2,530,776 2,538,875
4,626,822 8,251,795
Risk Exposure The Group’s exposure to risk is discussed in note 30. Terms and Conditions Terms and conditions relating to the above financial instruments:
(i) Trade creditors are non-interest bearing and are normally settled on 30 day terms. (ii) Sundry creditors and accruals are non-interest bearing and have an average term of 30 days.
(i) During the year the Company reversed the provision for certain exploration and evaluation expenditure, refer
to note 13(a).
15. PROVISIONS
2019 2018 $ $
Current provisions Employee entitlements 318 719 Provision for dilapidation charges 53,924 78,617 Provision for acquisition of Zambia project (i) - 877,078 Other 152,015 98,848
206,257 1,055,262
(i) On 22 May 2017, the Company announced that it had entered into a binding terms sheet with Australian
Mining Company Zambia Limited (AMCZ Ltd) to acquire a 70% interest in the Kitwe cobalt-copper tailings project. Under the terms of the agreement, the consideration payable is as follows:
- US$150,000 cash upon execution of share purchase agreement; and - US$650,000 upon execution of an agreement between AMCZ Ltd and Auszam Lining Ltd to allow the
storage of processed tailings from the project on a portion of its license area (Milestone Condition). The provision balance at 30 June 2018 relates to the US$650,000 consideration payable upon satisfaction of the Milestone Condition. During the year ended 30 June 2019, the Company elected not to pay the milestone payments due and withdrew from the Kitwe Tailings Project
For
per
sona
l use
onl
y

ANNUAL REPORT 2019
NOTES TO THE CONSOLIDATED FINANCIAL STATEMENTS
52
16. CONVERTIBLE NOTE AT FAIR VALUE THROUGH PROFIT OR LOSS
2019
$ 2018
$
Balance at beginning of period - - Funds borrowed under convertible loan agreement 750,000 - Finance charges (70,709) - Amount repaid through cash 282,658 - Amounts repaid through issue of shares 78,314 -
Balance at end of period 459,737 -
On 17 December 2018, the Company entered into a Convertible Note Agreement with MEF I, L.P. (Magna) through the issue of 548,310 convertible notes. As at 31 December 2018, the Company has drawn down A$750,000 (Tranche A) from the A$7.5 million facility and a further A$6.75 million is available in 4 tranches upon the Company meeting key milestones relating to the development of the Kipushi Cobalt-Copper tailings project in the DRC. Magna will receive a commitment fee of 4% of the investment amount at the funding of each tranche payable in shares. The face value of each convertible note is US$1.10 and are non-interest bearing. The notes are convertible to a variable number of ordinary shares at the option of the holder of the notes any time after issue. If not converted the notes mature and are repayable twelve (12) months after the issue date. The conversion price for each convertible note is the lower of $0.045 or a 15% discount from the lowest VWAP over ten (10) days prior to the conversion date, provided that the conversion price shall not in any case be lower than $0.012 (floor price). At 30 June 2019, the pro-rated difference between the fair value of the convertible notes being $882,353 and the proceeds received of A$750,000 was recorded as a finance cost in the statement of comprehensive income over the life of the convertible notes. As at 30 June 2019, Magna had 333,817 convertible notes remaining. 17. LOAN PAYABLE AT FAIR VALUE THROUGH PROFIT OR LOSS
2019 2018 $ $
Current 733,001 -
Non-Current 689,734 -
(a) Movements in the carrying amount of loan payable
2019 2018 $ $
Balance at beginning of period - - Proceeds from borrowings 1,395,184 - Foreign exchange 27,552 -
1,422,735 -
On 19 November 2019, the Company entered into a loan of USD$500,000 from First Investments Holding Ltd secured by the Company’s shareholding in European Lithium Ltd to three times the value of the loan, interest rate of 5% per annum and to be repaid 18 months from the date of advancement. On 12 March 2019, the Company entered into a second loan of USD$500,000 from First Investments Holding Ltd secured by the Company’s shareholding in European Lithium Ltd to three times the value of the loan, interest rate of 5% per annum and to be repaid 18 months from the date of advancement.
For
per
sona
l use
onl
y

ANNUAL REPORT 2019
NOTES TO THE CONSOLIDATED FINANCIAL STATEMENTS
53
18. TAX LIABILITY
2019 2018 $ $
Current 1,041,679 5,203,442 Non-current 2,861,893 -
3,903,572 5,203,442
2019
$ 2018
$
Balance at beginning of period 5,203,442 5,227,739 Income tax expense - (24,297) Repayments of income tax (1,299,870) -
Balance at end of period 3,903,572 5,203,442
The Company has been the subject of an audit by the Australian Taxation Office (ATO) regarding various taxation matters, covering the 2011 - 2015 income years. The key issue in dispute is the tax treatment of the disposal of certain assets.
On 31 July 2018, the Company reached an out of court settlement with the ATO. Under the terms of the settlement,
the Company has, on a without admission of liability basis, agreed to make final settlement payments to the ATO
totalling $5,203,442 following the issue of amended assessments for each of the respective income tax years in dispute.
Included in the settlement is a shortfall interest component of $790,000. The settlement is payable over 5 years until
March 2023. Under the terms of the settlement, the Company retains all carry forward losses.
The Company’s wholly owned subsidiary, Dempsey Resources Pty Ltd (Dempsey), has agreed to provide the ATO with
security over its shareholdings in Fe Limited and Cauldron Energy Ltd as collateral.
The agreed settlement figure of $5,203,442 represents full and final settlement and removes the potential for any further payments to the ATO under the amended assessments.
19. ISSUED CAPITAL
2019 2018 $ $
1,019,927,757 fully paid ordinary shares (2018: 937,710,216) 203,295,135 200,730,049
Ordinary shares participate in dividends and the proceeds on winding up of the Company in proportion to the number of shares held and in proportion to the amount paid up on the shares held. At shareholders meetings, each ordinary share is entitled to one vote in proportion to the paid-up amount of the share when a poll is called, otherwise each shareholder has one vote on a show of hands.
For
per
sona
l use
onl
y

ANNUAL REPORT 2019
NOTES TO THE CONSOLIDATED FINANCIAL STATEMENTS
54
Movement in ordinary shares on issue
Ordinary fully paid shares Number $
2019 Shares on issue at 1 July 2018 937,710,216 200,730,051 Placements (i) 47,824,698 1,434,741 Exercise of options 23,500,000 1,175,000 Shares issued in settlement of liabilities (iii) 10,892,843 189,314 Costs associated with capital issues - (233,971)
Shares on issue at 30 June 2019 1,019,927,757 203,295,135
2018 Shares on issue at 1 July 2017 833,019,919 196,771,578 Placements (ii) 95,124,846 3,806,450 Issue of shares for cobalt acquisition (iv) 2,166,667 65,000 Shares issued in settlement of liabilities (iv) 7,398,784 251,018 Costs associated with capital issues - (163,995)
Shares on issue at 30 June 2018 937,710,216 200,730,051
(i) The following shares were issued via share placements during the year ended 30 June 2019:
- On 3 July 2018 the Company issued 1,000,000 shares to raise funds of $30,000; - On 13 July 2018 the Company issued 10,000,000 shares to raise funds of $300,000; - On 23 July 2018 the Company issued 36,824,698 shares to raise funds of $1,104,741
(ii) The following shares were issued via share placements during the year ended 30 June 2018:
- On 30 October 2017 the Company issued 35,333,333 shares to raise funds of $1,060,000; - On 6 November 2017 the Company issued 200,000 shares to raise funds of $6,000; - On 12 March 2018 the Company announced it would undertake a placement of up to 37,036,361 fully
paid ordinary shares at an issue price of $0.055 per share to raise proceeds of up to $2 million, before costs (Placement). As part of the Placement, the Company also issued one free attaching unquoted option for every two shares applied for under the Placement, as well as issuing 5 million options to facilitators of the Placement, which are exercisable at $0.07, expiring 2 years from the date of issue. On the same day the Company issued 30,672,725 Placement shares and 15,336,363 free attaching options (refer note 21 for details) and on 19 March 2018 the Company issued another 5,335,455 Placement shares and 2,667,727 free attaching options (refer note 23 for details);
- On 27 June 2018 the Company issued 5,250,000 shares to raise funds of $210,000; and - On 29 June 2018 the Company issued 18,333,333 shares to raise funds of $550,000.
(iii) The following shares were issued in settlement of liabilities during the year ended 30 June 2019:
- On 13 July 2018 the Company issued 600,000 shares to settle a liability of $18,000 at a deemed issue price of $0.03 per share, due to certain trade creditors.
- On 23 July 2018 the Company issued 2,100,000 shares to settle a liability of $63,000 at a deemed issue price of $0.03 per shares, due to certain trade creditors
- On 21 December 2018 the Company issued 1,666,667 shares to settle a liability of $30,000 at a deemed issue price of $0.018 to Magna as Tranche A commitment shares (note 16)
- On 13 May 2019 the Company issued 6,526,176 shares to settle a liability of $78,314 at a deemed issue price of $0.012 per share to Magna as partial conversion of debt (note 16)
(iv) The following shares were issued in settlement of liabilities during the year ended 30 June 2018:
- On 30 October 2017 the Company issued 2,166,667 shares to settle a liability of US$50,000 ($65,000) at a deemed issue price of $0.03 per share, as part of the DRC acquisition.
- On 18 December 2017 the Company issued 2,905,450 shares to settle a liability of $116,218 at a deemed issue price of $0.04 per share, due to a trade creditor.
- On 29 June 2018 the Company issued 4,493,334 shares to settle a liability of $134,800 at a deemed issue price of $0.03 per share, due to certain trade creditors.
For
per
sona
l use
onl
y

ANNUAL REPORT 2019
NOTES TO THE CONSOLIDATED FINANCIAL STATEMENTS
55
Capital Risk Management The Group’s objective when managing capital is to safeguard its ability to continue as a going concern, so that it can continue to provide returns for shareholders and benefits for other stakeholders and to maintain an optimal capital structure to reduce the cost of capital. Consistent with others in the industry, the Group monitors capital on the basis of the gearing ratio. This ratio is calculated as net debt divided by total capital. Net debt is calculated as total borrowings (including “borrowings” and “trade and other payables” as shown in the statement of financial position) less cash and cash equivalents. Total capital is calculated as “equity” as shown in the statement of financial position plus net debt.
2019 2018 $ $
Total Trade and other payables 4,626,822 8,251,795 Convertible note 459,737 - Long term loan payable 1,422,735 - less: Cash and cash equivalents (210,106) (1,015,522)
Net (cash)/debt 6,299,188 7,236,273 Total equity/(deficiency) (2,967,553) 735,121
Total capital 3,331,635 7,971,394
Gearing ratio 189% 91%
20. RESERVES
2019 2018 $ $
Foreign currency translation reserve 22,208,957 22,302,495 Share based payments reserve 2,677,884 2,392,942 Equity reserve (1,090,501) (1,090,501)
23,796,340 23,604,936
Foreign currency translation reserve Balance at beginning of financial year 22,302,495 22,332,366 Share of movement of associate’s foreign currency translation reserve 58,041 124,057 Foreign currency exchange differences arising on translation of foreign operation (151,579) (153,928)
Balance at end of financial year 22,208,957 22,302,495
Share based payments reserve Balance at beginning of financial year 2,392,942 2,167,905 Share of movement of associate’s share based payments reserve 128,966 62,813 Share based payments 155,976 162,224
Balance at end of financial year 2,677,884 2,392,942
Equity reserve Balance at beginning of financial year (1,090,501) (1,179,630) Increase in non-controlling interest - 89,129
Balance at end of financial year (1,090,501) (1,090,501)
Nature and Purpose of Reserves Foreign currency translation reserve The foreign currency translation reserve is used to record exchange differences arising from the translation of financial statements of foreign subsidiaries.
For
per
sona
l use
onl
y

ANNUAL REPORT 2019
NOTES TO THE CONSOLIDATED FINANCIAL STATEMENTS
56
Share based payments reserve The share based payments reserve records items recognised as expenses on valuation of employee share options, and options issued to directors and consultants. Equity reserve The equity reserve is used to record the differences which may arise as a result of transactions with non-controlling interests that do not result in a loss of control. 21. ACCUMULATED LOSSES
2019 2018 $ $
Balance at beginning of financial year (223,599,865) (222,948,696) Loss for the year (6,459,163) (651,170)
Balance at end of financial year (230,059,028) (223,599,865)
22. LOSS PER SHARE
2019
Cents per Share 2018
Cents per Share
Basic and diluted loss per share (a) (0.64) (0.07) (a) Basic and Diluted Loss per Share The loss and weighted average number of ordinary shares used in the calculation of basic earnings per share are as follows:
2019
$ 2018
$
Loss for the year (6,459,163) (828,296)
2019
Number 2018
Number
Weighted average number of ordinary shares for the purposes of basic earnings per share
1,009,371,186
870,801,223
There are 48,254,090 share options (30 June 2018: 28,254,090) excluded from the calculation of diluted earnings per share that could potentially dilute basic earnings per share in the future because they are anti-dilutive for the current period presented. Since 30 June 2019 and prior to the date of release of these financial statements, nil (30 June 2018: nil) share options have been forfeited and nil (30 June 2018: nil) share options have been exercised. 23. OTHER UNLISTED OPTIONS The following refers to unlisted options issued by the Company which do not constitute a share based payment. (a) Options granted during the current year No options issued year during the year did not constitute a share based payment. (a) Options granted during the prior year On 12 March 2018 15,336,363 unlisted options with an exercise price of $0.07, expiring on 12 March 2020 were issued to investors pursuant to the Placement. On 19 March 2018 2,667,727 unlisted options with an exercise price of $0.07, expiring on 19 March 2020 were issued to investors pursuant to the Placement.
For
per
sona
l use
onl
y

ANNUAL REPORT 2019
NOTES TO THE CONSOLIDATED FINANCIAL STATEMENTS
57
(c) Options on issue at 30 June 2019 The outstanding balance of options at 30 June 2019 (other than those granted as share based payments) is as follows:
Grant Date Class of Shares Exercise Price Number of Options Expiry Date Listed/Unlisted
12 March 2018 Ordinary $0.07 15,336,363 12 March 2020 Unlisted 19 March 2018 Ordinary $0.07 2,667,727 19 March 2020 Unlisted
18,004,090
24. COMMITMENTS
2019 2018 $ $
Operating lease commitments Minimum lease payments not provided for in the financial report and payable:
not later than one year 406,331 572,289 later than one year but not later than five years - 406,331 later than five years - -
Aggregate expenditure contracted for at balance date but not provided for 406,331 978,621
On 1 April 2012 the Company entered into an office premises lease agreement (as varied by a deed of variation dated 22 June 2015) terminating on 31 March 2020. The Company has entered into a series of sub-lease agreements with terms to 31 March 2020 whereby the Company is entitled to receive a total of $304,826 in rental income. In addition, rental income is received from various other companies under sub-lease arrangements with no fixed terms. The above minimum lease payments have not been adjusted for any sub-lease rental income payments. 25. CONTINGENT ASSETS AND LIABILITIES Contingent asset for future royalties payable from the Mayoko Iron Ore Project
In March 2012, Johannesburg Stock Exchange listed Exxaro Resources Limited (Exxaro) completed a takeover offer for all of the shares and listed options in African Iron Limited, a company in which the Company held 126,700,000 shares, delivering $72.2 million in cash to the Company. African Iron Limited owns the Mayoko Iron Ore Project which is located in the Republic of Congo (Mayoko Project). As part of the takeover transaction, the Company retains a production royalty of AUD$1.00 (indexed annually to the CPI) per tonne of iron ore shipped from the Mayoko Project (Mayoko Royalty). On 6 February 2014, the Company released an announcement advising shareholders that Exxaro has been granted a Mining Convention for the Mayoko Project. In September 2016 Exxaro announcement the completion of the sale of the Mayoko Project to Sapro SA. On 13 February 2017, the Company released an announcement that it had sold the Mayoko Royalty for A$1,000,000 subject to the formality of the new owners signing off on the transaction. As at 30 June 2018, the Company had received A$500,000 in cash with the remaining A$500,000 to be received as deferred consideration. Contingent issue of shares on Magna Facility On 17 December 2018, the Company entered into a Convertible Note Agreement with MEF I, L.P. (Magna) through the issue of 548,310 convertible notes. As at 31 December 2018, the Company has drawn down A$750,000 (Tranche A) from the A$7.5 million facility and a further A$6.75 million is available in 4 tranches upon the Company meeting key milestones relating to the development of the Kipushi Cobalt-Copper tailings project in the DRC. The Company is under no obligation to drawdown subsequent tranches of the facility however a termination fee of 2% of the undrawn investment amount is payable (in shares, at the Company’s election) if amounts are not drawn down when available. Under the facility, Magna will also receive a commitment fee of 4% of the investment amount at the funding of each tranche payable in shares. Refer to Note 16 for further details on the Magna facility. Contingent license fees for Sierra Leone projects As disclosed in note 13, the company is of the view that there is no present obligation with respect to accrued exploration license fees since 2015 for its Sierra Leone projects due to the Company declaring force majeure and therefore the liability has been reversed in the financial statements. The company is pursuing legal proceedings and
For
per
sona
l use
onl
y

ANNUAL REPORT 2019
NOTES TO THE CONSOLIDATED FINANCIAL STATEMENTS
58
whilst it is confident it will be successful in its claim, any possible obligation remaining will be confirmed following the outcome of this legal proceeding. 26. SUBSIDIARIES
Ownership Interest Name of Entity Country of
Incorporation 2019
% 2018
%
Parent entity Cape Lambert Resources Limited Australia - - Subsidiaries African Minerals Exploration Pty Ltd Australia 100% 100% Cape Lambert Minsec Pty Ltd Australia 100% 100% Danae Resources Pty Ltd Australia 100% 100% Dempsey Resources Bermuda Limited2 Bermuda 100% 100% Dempsey Resources Pty Ltd Australia 100% 100% Marampa Iron Ore (Bermuda) Limited Bermuda 100% 100% Marampa Iron Ore (SL) Limited Sierra Leone 100% 100% Metals Exploration (Australia) Pty Ltd Australia 100% 100% Metals Exploration (Cote D’Ivoire) SA Cote d’Ivoire - 100% Metal Exploration (Mauritius) Limited Mauritius - 100% Metal Exploration (SL) Limited Sierra Leone 100% 100% Mineral Resources (Bermuda) Limited2 Bermuda 100% 100% Mineral Securities Investments (Australia) Pty Ltd Australia 100% 100% Mineral Securities Operations Pty Ltd Australia 100% 100% Mineral Securities (UK) Ltd2 UK 100% 100% Mining International Pty Ltd Australia 100% 100% Multiplex Resources (Kazakhstan) Limited2 United Kingdom 100% 100% Pinnacle Group Assets (SL) Limited Sierra Leone 100% 100% Soludo-Lambert Mining SAS (note 12) DRC 50% 50%
2 In the process of being liquidated. 27. SEGMENT INFORMATION AASB 8 Operating Segments requires operating segments to be identified on the basis of internal reports that are regularly reviewed by the Chief Operating Decision Maker (CODM) to make decisions about resources to be allocated to the segment and assess its performance, and for which discrete financial information is available. In the case of the Group the CODM are the executive management team and all information reported to the CODM is based on the consolidated results of the Group as one operating segment, as the Group’s activities relate to mineral exploration. Accordingly, the Group has only one reportable segment and the results are the same as the Group results. Information by geographical region
The analysis of the location of non-current assets other than financial instruments and deferred tax assets is as follows:
2019 2018 $ $
Australia 6,053,566 7,153,142 West Africa 71,898 4,062,500
6,125,464 11,215,642
For
per
sona
l use
onl
y

ANNUAL REPORT 2019
NOTES TO THE CONSOLIDATED FINANCIAL STATEMENTS
59
Revenue by geographical region 2019 2018 $ $
Australia 278,746 368,377 West Africa - -
278,746 368,377
28. RELATED PARTY DISCLOSURES Subsidiaries The consolidated financial statements include the financial statements of Cape Lambert Resources Limited and the subsidiaries listed in note 26. Ultimate parent The ultimate Australian parent entity is Cape Lambert Resources Limited. Transactions with related parties Transactions between related parties are on commercial terms and conditions no more favourable than those available to other parties unless otherwise stated. Agreements entered into with related parties Office lease agreement with Okewood Pty Ltd On 1 April 2012 the Company entered into a lease agreement with Okewood Pty Ltd, a company owned by Tony Sage, for the lease of 32 Harrogate Street, West Leederville WA 6007, as varied by a deed of variation dated 22 June 2015 (Lease Agreement). The term of the Lease Agreement is 1 April 2012 to 31 March 2020 with an option to extend. The lease is based on an area of 1,148m² at a rent of $459,200 (excluding GST) per annum, subject to an annual CPI increase, with variable outgoings and parking charged separately at market rates. The Company has entered into a series of sub-lease agreements, both with related parties as outlined below and unrelated parties, whereby the Company is entitled to receive rental income. The above minimum lease payments have not been adjusted for any sub-lease rental income payments. Sub-lease agreements for office space The Company has fixed term sub-lease agreements with the following related entities:
• Fe Limited (lease term expiring 31 March 2020)
• European Lithium Limited (lease term expiring 30 September 2019) The lease covers the rental, outgoings and parking charges under agreements made on commercial terms and conditions at market rates. Refer to the table below which summarises the recharges. The following table provides the total amount of transactions that have been entered into with related parties for the relevant financial year.
For
per
sona
l use
onl
y

ANNUAL REPORT 2019
NOTES TO THE CONSOLIDATED FINANCIAL STATEMENTS
60
Sales to related parties
Purchases from related parties
Consulting fees paid
Amounts owed by related parties
Amounts owed to related parties
Related entities with common directors: Cauldron Energy Limited 2019 67,463 - - 38,455 - Cauldron Energy Limited 2018 188,179 4,058 - 14,006 - Karratha Metals Group Ltd 2019 5,567 - - - - Karratha Metals Group Ltd 2018 7,149 - - - -
Associate entities: European Lithium Limited 2019 66,085 33,366 - - 21,015 European Lithium Limited 2018 201,824 635 - 29,768 635 Fe Limited 2019 139,439 - - 49,130 - Fe Limited 2018 154,659 - - 83,837 -
Director related entities:
DGWA GmbH 2019 - 114,647 - - 38,356 DGWA GmbH 2018 - 58,199 - - 11,162 Fashion Council WA 2019 - 2,955 - - - Fashion Council WA 2018 - 4,855 - - - Perth Glory Football Club 2019 - - - - - Perth Glory Football Club 2018 - 65,641 - - - Okewood Pty Ltd 2019 - 568,020 700,000 - - Okewood Pty Ltd 2018 - 569,694 700,000 - -
Tony Sage resigned as a Director of Cauldron Energy Limited (Cauldron) on 22 November 2018, the above transactions reflect transactions with Cauldron up until the date of resignation. Perth Fashion Festival Pty Ltd, Okewood Pty Ltd and Okewood Pty Ltd trading as Perth Glory Football Club are entities controlled by Tony Sage. DGWA GmbH is an entity controlled by Stefan Müller. Key management personnel The following table discloses the remuneration of the directors and key management personnel of the Company:
2019 2018 $ $
Short-term employee benefits 784,000 1,081,950 Post-employment benefits - 7,758 Share based payments 3,005 - Long term employee benefits - -
787,005 1,089,708
Detailed remuneration disclosures are provided in the remuneration report.
For
per
sona
l use
onl
y

ANNUAL REPORT 2019
NOTES TO THE CONSOLIDATED FINANCIAL STATEMENTS
61
29. NOTES TO THE CASH FLOW STATEMENT (a) Reconciliation of Cash and Cash Equivalents For the purposes of the cash flow statement, cash and cash equivalents includes cash on hand and in banks. Cash and cash equivalents at the end of the financial year as shown in the cash flow statement is reconciled to the related items in the Statement of financial position as follows:
2019 2018 $ $
Cash and cash equivalents Cash in banks and on hand 210,106 1,015,522 Deposits at call - -
Cash and cash equivalents per consolidated statement of cash flows 210,106 1,015,522
Cash and cash equivalents per consolidated statement of financial position 210,106 1,015,522
(b) Reconciliation of Net Profit/ (loss) to Net Cash Flows from Operating Activities
2019 2018 $ $
Loss from ordinary activities after tax (6,459,163) (828,296) Adjusted for non-cash items: Loss/(gain) on fair value of financial assets through profit & loss 721,956 1,001,618 Depreciation and amortisation of non-current assets 29,430 28,251 Share of losses of associates 919,462 (148,108) Share of losses of joint venture 1,006,302 157,895 Gain on dilution of interest in associate (565,270) (881,851) Gain on transfer from associate accounting to fair value through profit & loss - (1,408,338) Gain on sale of fixed assets - (525,000) Finance expense 100,709 - Impairment of investment in associate 718,723 6,852,289 Provision for payroll tax - (421,617) Convertible note fee 37,350 - Gain on sale of royalty (investing activity) (500,000) Interest on loan (investing activity) 241 Share based payments 3,005 162,224 Exploration expenditure de-recognised during the year (2,647,350) 2,109,292 Provision for impairment of investments 52,565 - Provision for impairment of joint venture 3,383,317 - Unrealised foreign currency exchange gains (1,861) 1,644 (Reversal of impairment)/Impairment of receivable 42,942 (211,419) Profit after income tax expense from deconsolidated entity - (9,925,882) Income tax (benefit)/expense - (24,297) Changes in net assets and liabilities (Increase)/decrease in trade and other receivables 84,847 229,211 (Increase)/decrease in provisions - (877,080) (Increase)/decrease in tax provisions (1,299,870) - Increase / (decrease) in trade and other payables (905,563) 1,769,603
Net cash used in operating activities (4,778,469) (3,439,620)
30. FINANCIAL RISK MANAGEMENT The Group is exposed to a variety of financial risks including market risk (currency risk and interest rate risk), credit risk and liquidity risk. The Group’s overall risk management program focuses on the unpredictability of financial markets
For
per
sona
l use
onl
y

ANNUAL REPORT 2019
NOTES TO THE CONSOLIDATED FINANCIAL STATEMENTS
62
and seeks to meet its financial targets whilst minimising potential adverse effects on financial performance. The Group uses different methods to measure different types of risk to which it is exposed. These methods include sensitivity analysis in the case of interest rate, foreign exchange and other price risks and aging analysis for credit risk. Risk management is carried out by the Board. The Group holds the following financial instruments at 30 June 2019:
Fair value
At amortised cost Through profit and loss
Through other comprehensive
income $ $ $
Financial assets Trade and other receivables 224,612 - -
Total current 224,612 - - Other financial assets - 997,055 -
Total non-current - 997,055 -
Total assets 224,612 997,055 -
Financial liabilities Trade and other payables 4,626,822 - - Convertible note - 459,737 -
Total current 4,626,822 459,737 - Long term loan payable - 1,422,735 -
Total non-current - 1,422,735 -
Total liabilities 4,626,822 1,882,472 -
The Group holds the following financial instruments at 30 June 2018:
Fair value
At amortised cost Through profit and loss
Through other comprehensive
income $ $ $
Financial assets Trade and other receivables 320,355 - -
Total current 320,355 - - Other financial assets - 2,567,722 -
Total non-current - 2,567,722 -
Total assets 320,355 2,567,722 -
Financial liabilities Trade and other payables 8,251,795 - - Convertible note - - -
Total current 8,251,795 - - Long term loan payable - - -
Total non-current - - -
Total liabilities 8,251,795 - -
For
per
sona
l use
onl
y

ANNUAL REPORT 2019
NOTES TO THE CONSOLIDATED FINANCIAL STATEMENTS
63
(a) Market Risk (i) Foreign Currency Risk The Group operates internationally and is exposed to foreign exchange risk arising from commercial transactions. The Group converted assets and liabilities into the functional currency where balances were denominated in a currency other than the Australian dollars. The Group also has transactional currency exposures. Such exposure arises from sales or purchases by an operating entity in currencies other than the functional currency. At the reporting date, the Group did not have any material balances of cash held in a foreign currency and therefore a movement of 10% in the foreign currency exchange rates as at 30 June 2019 would not have a material impact on the consolidated loss or equity. Managements have set up a policy to monitor and measure this risk using sensitivity analysis and cash flow forecasting. (ii) Cash Flow Interest Rate Risk The Group’s exposure to market interest rates relates primarily to the Group’s cash and cash equivalents. The Group is exposed to movements in market interest rates on short term deposits. At the reporting date, the Group had the following variable rate cash and cash equivalents and restricted cash:
2019 2018 $ $
Financial assets: Cash and cash equivalents 210,106 1,015,522 Restricted cash 94,333 126,379
304,439 1,141,901
Weighted average interest rate 0.70% 0.95% Movement of 50 basis points on the interest rate (considered a reasonably possible change) would not have a material impact on the consolidated loss or equity. (iii) Price Risk The Group is exposed to equity securities price risk. This arises from investments held and classified on the statement of financial position as at fair value through profit or loss. The Group is not exposed to commodity price risk. To manage its price risk arising from investments in equity securities, the Group diversifies its portfolio which is done in accordance with the limits set by the Board of Directors. The majority of the Group’s equity investments are publicly traded on the Australian Stock Exchange (ASX) and are recognised as financial assets carried at fair value through profit or loss. (b) Credit Risk Credit risk is managed on a consolidated basis. Exposure to credit risk relating to financial assets arises from the potential non-performance by counterparties of contract obligations that could lead to a financial loss to the Group. The Group has adopted the policy of only dealing with credit worthy counterparties and obtaining sufficient collateral or other security where appropriate, as a means of mitigating the risk of financial loss from defaults. The maximum credit risk on financial assets, excluding investments, of the Group, which have been recognised on the statement of financial position, is the carrying amount, net of any provision for doubtful debts.
For
per
sona
l use
onl
y

ANNUAL REPORT 2019
NOTES TO THE CONSOLIDATED FINANCIAL STATEMENTS
64
The Group is exposed to credit risk as a result of subscribing to loan notes and convertible loan notes issued by listed
and unlisted entities. This credit risk is managed by obtaining adequate security over the loans, generally in the form of
a fixed and floating charge over the assets of the borrower. Details of the loan notes and convertible loan notes to which
the Group had subscribed during the year are listed in notes 16 and 17. Credit risk arises from trade receivables. The
Group has adopted the policy of only dealing with credit worthy counterparties and obtaining sufficient collateral or
other security where appropriate, as a means of mitigating the risk of financial loss from defaults. The credit quality of
financial assets that are neither past due nor impaired can be assessed by reference to external credit ratings. The Company holds 88% (2018: 99%) of its cash and cash equivalents with banks with a Moody’s credit rating on Aa3.
2019 2018 Financial assets: $ $
Cash and cash equivalents and restricted cash 304,439 1,141,901 Loans and receivables 224,612 320,355 Other financial assets 997,055 2,567,722
1,526,106 4,029,979
(c) Liquidity Risk The Group manages liquidity risk by maintaining adequate reserves, banking facilities and reserve borrowing facilities by continuously monitoring forecast and actual cash flows in relation to its operational, investing and financing activities. At the reporting date, the Group has financing arrangements in place as disclosed under notes 16 and 17. (d) Fair Value Estimation The fair value of financial assets and liabilities must be estimated for recognition and measurement or for disclosure purposes. The Directors consider that the carrying amounts of financial assets and financial liabilities recorded in the financial statements approximate their fair values. The carrying values of trade and other receivables net of impairment and the carrying value of payables approximate fair values due to their short-term nature. AASB 7 Financial Instruments: Disclosures requires disclosure of fair value measurements by level of the following fair value measurement hierarchy:
(a) quoted prices (unadjusted) in active markets for identical assets or liabilities (level 1) (b) inputs other than quoted prices included within level 1 that are observable for the asset or liability, either
directly (as prices) or indirectly (derived from prices) (level 2), and (c) inputs for the asset or liability that are not based on observable market data (unobservable inputs) (level 3).
For
per
sona
l use
onl
y

ANNUAL REPORT 2019
NOTES TO THE CONSOLIDATED FINANCIAL STATEMENTS
65
Set out below is a comparison of the carrying amount and fair values of financial instruments as at 30 June 2019:
Carrying amount Fair value $ $
Financial assets Trade and other receivables 224,612 224,612
Total current 224,612 224,612 Other financial assets 997,055 997,055
Total non-current 997,055 997,055
Total assets 1,221,667 1,221,667
Financial liabilities Trade and other payables 4,626,822 4,626,822 Convertible note 459,737 459,737
Total current 5,086,559 5,086,559 Long term loan payable 1,422,735 1,422,735
Total non-current 1,422,735 1,422,735
Total liabilities 6,509,294 6,509,294
Set out below is a comparison of the carrying amount and fair values of financial instruments as at 30 June 2018:
Carrying amount Fair value $ $
Financial assets Trade and other receivables 320,355 320,355
Total current 320,355 320,355 Other financial assets 2,567,722 2,567,722
Total non-current 2,567,722 2,567,722
Total assets 2,888,077 2,888,077
Financial liabilities Trade and other payables 8,251,795 8,251,795 Convertible note - -
Total current 8,251,795 8,251,795
Total liabilities 10,134,267 10,134,267
31. PARENT ENTITY FINANCIAL INFORMATION (a) Summary financial information The individual financial statements of the parent entity show the following aggregate amounts:
For
per
sona
l use
onl
y

ANNUAL REPORT 2019
NOTES TO THE CONSOLIDATED FINANCIAL STATEMENTS
66
2019 2018 $ $
Statement of financial position Current assets 174,358 1,077,673 Total assets 1,460,523 5,415,092 Current liabilities (11,731,097) (11,506,091) Total liabilities (14,357,096) (49,730,310) Shareholders’ equity Issued capital 203,295,135 200,730,049 Reserves 1,682,287 1,526,311 Retained earnings (217,873,993) (246,571,578)
Total equity /(deficit) (12,896,571) (44,315,218)
Net profit / (loss) for the year 28,697,585 5,045,118 Total comprehensive income / (loss) 28,697,585 5,045,118
(b) Guarantees entered into by the parent entity The parent entity has provided financial guarantees in respect of environmental performance bonds for subsidiaries during the current year amounting to nil (2018: nil). (c) Tax Consolidation
The Company and its 100% owned controlled entities have formed a tax consolidated group. Members of the Group have entered into a tax sharing arrangement in order to allocate income tax expense to the wholly owned controlled entities on a pro-rata basis. The agreement provides for the allocation of income tax liabilities between the entities should the head entity default on its tax payment obligations. At reporting date, the possibility of default is remote. The head entity of the tax consolidated group is Cape Lambert Resources Limited. Tax Effect Accounting by Members of the Tax Consolidated Group Members of the tax consolidated group have entered into a tax funding agreement. The tax funding agreement provides for the allocation of current taxes to members of the tax consolidated group. Deferred taxes are allocated to members of the tax consolidated group in accordance with a group allocation approach which is consistent with the principles of AASB 112 Income Taxes. The allocation of tax under the tax funding agreement is recognised as an increase/decrease in the controlled entities’ intercompany accounts with the tax consolidated group head Company, Cape Lambert Resources Limited. In this regard, the Company has assumed the benefit of tax losses from controlled entities of $105,572 (2018: $4,392,828) as of the reporting date. The Company has received a payment from the controlled entities of nil (2018: nil) as of the reporting date in respect of the current year tax liability for the tax consolidated group. The nature of the tax funding agreement is such that no tax consolidation contributions by or distributions to equity participants are required. 32. DECONSOLIDATION OF FE LIMITED On 1 January 2018, the Company has no power to govern the financial and operating policies of FE Limited (FEL) due to loss of majority control. Accordingly, the Company was deemed to have lost control of FEL on 1 January 2018, and the Company’s investment was reclassified to an investment accounted for using the equity method on that date. The Company did not receive any consideration in the deconsolidation of FEL.
For
per
sona
l use
onl
y

ANNUAL REPORT 2019
NOTES TO THE CONSOLIDATED FINANCIAL STATEMENTS
67
Details of net assets deconsolidated on loss of control 1 January 2018 $
Fair value of FEL’s net assets/(liabilities) Cash and cash equivalents 40,844 Trade and other receivables 766,311 Plant and equipment 211 Exploration assets 735,000 Trade and other payables (926,621)
FEL’s net assets/(liabilities) 615,745 Reclassification of FEL transactions to be consistent with CFE policies 195,035
FEL’s net assets/(liabilities) 810,780
Gain on deconsolidation of subsidiary
1 January 2018 $
Fair value of equity held in FEL at 1 January 2018 (10,601,325) Less net assets deconsolidated 810,780 Non-controlling interest (452,010)
Gain recognised on deconsolidation of subsidiary to owners of the parent entity (10,242,555)
Cashflow impact of deconsolidation FEL has a cash balance of $422,649 as at 30 June 2017 and a cash balance of $40,844 at 1 January 2018. As a result of the deconsolidation of FEL, the Company derecognized $381,805 in cash and cash equivalents in its Statement of financial position which represents the movement during this 6 month period. This impact is shown as an outflow of cash in Cash Flow Statement under the category Cash Flows from Investing Activities. Reclassification of investment The Company’s 44.25% equity interest in FEL was reclassified to an Investment accounted for using the equity method on 1 January 2018. Refer to Note 11. The share of net losses of FEL included in the current years consolidated statement of comprehensive income is $224,376. 33. EVENTS SUBSEQUENT TO REPORTING DATE On 12 July 2019, the Company announced that African banks AFC and Afreximbank had conducted a site visit in respect to providing funding to the Kipushi project. The Company also announced that it was in discussions with China Everbright Bank regarding a US$40m LC facility by way of offtake sales. On 28 July 2019, Magna consented to the Company entering into the Winance facility. In return, the parties agreed that prior to shareholder approval the maximum number of shares that the outstanding Magna notes could convert to was 39,150,137 shares, to reduce the floor price of $0.005, that the Company would redeem Magna notes with a face value of US$69,361.22 and that the Company would not make any cash payments to Winance whilst Manga notes were outstanding. On 31 July 2019, the Company announced that it had executed binding documentation with Winance Investment LLC (Winance) in respect to the A$15m finance facility. The finance facility is by way of the issue of convertible securities in the Company. An initial amount of A$1.2m (before expenses) has been drawn down and further drawdowns of A$500,000 each are available upon full conversion of the notes from the previous drawdown, subject to cooling off periods. On 9 August 2019, the Company issued 10,082,093 fully paid ordinary shares to Magna upon the conversion of 54,831 notes and issued 1,200 convertible notes to Winance.
For
per
sona
l use
onl
y

ANNUAL REPORT 2019
NOTES TO THE CONSOLIDATED FINANCIAL STATEMENTS
68
On 14 August 2019, the Company announced that it had been unable to source project funding for the development of the Kipushi Project (Kipushi Project) in the DRC and as such had withdrawn from the Kipushi Project and from being a 50% partner in the incorporate joint venture company Soludo-Lambert SAS (Soludo-Lambert). The Company has received liquidation claims from its previous joint venture partner in respect to the liquidation of Soludo-Lambert. The Company is disputing these claims and at this stage are unable to quantify the potential liability. On 14 August 2019, the Company announced that its renewed focus is on the Marampa Iron Ore Project in Sierra Leone. On 29 August 2019, following the Company’s failure to redeem a total of 164,493 notes, Magna issued a default notice. Magna subsequently agreed to withdraw the default notice, subject to the Company paying Magna, US$200,000 over four payments between 31 August 2019 and 20 November 2019. These payments are in addition to the redemption value of the notes which are to be repaid form a capital raising that the Company proposes to undertake by 20 December 2019. On 11 September 2019, the Company lodged a cleansing prospectus for the offer of up to 20,000 shares at an issue price of $0.007 per share to raise up to $140 (before expenses). On 11 September 2019 the Company issued 6,000,000 fully paid ordinary shares to Winance upon the conversion of 30 notes and issued 22,464,026 fully paid ordinary shares to Magna upon the conversion of 71,000 notes. On 19 September 2019 the Company issued 4,000,000 fully paid ordinary shares to Winance upon the conversion of 20 notes. On 23 September 2019, the Company entered into various Deed of Discharge and Conversion of Debt Agreements to settle debts of $458,766.64 (including debts owing to Directors and Director related entities of $359,307.90) through the issue of up to 45,876,664 fully paid ordinary shares. Approval for the settlement of these debts will sought at the Company’s 2019 Annual General Meeting. I On 24 September 2019 the Company issued 4,000,000 fully paid ordinary shares to Winance upon the conversion of 20 notes. There have been no other events subsequent to 30 June 2019 up to the date of this report that would materially affect the operations of the Group or its state of affairs which have not otherwise been disclosed in this financial report.
For
per
sona
l use
onl
y

ANNUAL REPORT 2019
DIRECTORS’ DECLARATION
69
In accordance with a resolution of the directors of Cape Lambert Resources Limited, I state that: 1. In the opinion of the directors:
(a) the financial statements and notes of Cape Lambert Resources Limited for the financial year ended 30 June 2019 are in accordance with the Corporations Act 2001, including:
(i) giving a true and fair view of the financial position of the Group as at 30 June 2019 and of its performance,
for the period ended on that date; and
(ii) complying with Australian Accounting Standards (including the Australian Accounting Interpretations), the Corporations Regulations 2001, professional reporting requirements and other mandatory requirements; and
(iii) complying with International Financial Reporting Standards as disclosed in note 2(c).
(b) Subject to the matters set out in note 2(b) there are reasonable grounds to believe that the Company will
be able to pay its debts as and when they become due and payable. 2. This declaration has been made after receiving the declarations required to be made to the Directors in
accordance with section 295A of the Corporations Act 2001 for the year ended 30 June 2019. Signed in accordance with a resolution of the Directors: ____________________ Tony Sage Director Perth, 27 September 2019
For
per
sona
l use
onl
y

BDO Audit (WA) Pty Ltd ABN 79 112 284 787 is a member of a national association of independent entities which are all members of BDO Australia Ltd ABN 77 050 110 275,an Australian company limited by guarantee. BDO Audit (WA) Pty Ltd and BDO Australia Ltd are members of BDO International Ltd, a UK company limited by guarantee, andform part of the international BDO network of independent member firms. Liability limited by a scheme approved under Professional Standards Legislation.
Tel: +61 8 6382 4600Fax: +61 8 6382 4601www.bdo.com.au
38 Station StreetSubiaco, WA 6008PO Box 700 West Perth WA 6872Australia
INDEPENDENT AUDITOR'S REPORT
To the members of Cape Lambert Resources Limited
Report on the Audit of the Financial Report
Opinion
We have audited the financial report of Cape Lambert Resources Limited (the Company) and itssubsidiaries (the Group), which comprises the consolidated statement of financial position as at 30June 2019, the consolidated statement of profit or loss and other comprehensive income, theconsolidated statement of changes in equity and the consolidated statement of cash flows for the yearthen ended, and notes to the financial report, including a summary of significant accounting policiesand the directors’ declaration.
In our opinion the accompanying financial report of the Group, is in accordance with the CorporationsAct 2001, including:
(i) Giving a true and fair view of the Group’s financial position as at 30 June 2019 and of itsfinancial performance for the year ended on that date; and
(ii) Complying with Australian Accounting Standards and the Corporations Regulations 2001.
Basis for opinion
We conducted our audit in accordance with Australian Auditing Standards. Our responsibilities underthose standards are further described in the Auditor’s responsibilities for the audit of the FinancialReport section of our report. We are independent of the Group in accordance with the CorporationsAct 2001 and the ethical requirements of the Accounting Professional and Ethical Standards Board’sAPES 110 Code of Ethics for Professional Accountants (the Code) that are relevant to our audit of thefinancial report in Australia. We have also fulfilled our other ethical responsibilities in accordancewith the Code.
We confirm that the independence declaration required by the Corporations Act 2001, which has beengiven to the directors of the Company, would be in the same terms if given to the directors as at thetime of this auditor’s report.
We believe that the audit evidence we have obtained is sufficient and appropriate to provide a basisfor our opinion.
Material uncertainty related to going concern
We draw attention to Note 2(b) in the financial report which describes the events and/or conditionswhich give rise to the existence of a material uncertainty that may cast significant doubt about thegroup’s ability to continue as a going concern and therefore the group may be unable to realise itsassets and discharge its liabilities in the normal course of business. Our opinion is not modified inrespect of this matter.
For
per
sona
l use
onl
y

Key audit matters
Key audit matters are those matters that, in our professional judgement, were of most significance inour audit of the financial report of the current period. These matters were addressed in the context ofour audit of the financial report as a whole, and in forming our opinion thereon, and we do not providea separate opinion on these matters. In addition to the matter described in the Material uncertaintyrelated to going concern section, we have determined the matters described below to be the key auditmatters to be communicated in our report.
Investments accounted for under the equity method
Key audit matter How the matter was addressed in our audit
The Group’s investments in associates areaccounted for using the equity method as disclosedin Note 11 to the financial report.
The classification of the asset as an investment inassociates and measurement thereof is a key auditmatter due to the significance of the asset to theGroup, and the judgement exercised bymanagement in assessing the classification of theinvestment and determining whether there are anyindicators to suggest that the investment inassociates may be impaired.
Our procedures included, but were not limited tothe following;
· Evaluating management’s determination ofwhether the Group maintained significantinfluence over the investments;
· Considering management’s assessment ofindicators that the investment inassociates may be impaired;
· Agreeing the Group’s share of associatelosses, changes as a result of share issues,dilution and reserve movements to theaudited financial reports of the associates;
· Reviewing the financial information of theassociates including assessing if theaccounting policies of the associate wereconsistent with the Group, and;
· Reviewing the adequacy of the disclosuresin note 11 of the financial report.
For
per
sona
l use
onl
y

Valuation and classification of convertible notes
Key audit matter How the matter was addressed in our audit
During the year, Cape Lambert Resources Limitedissued convertible notes to fund the Group’soperations. The classification of the convertible notesat fair value through the profit or loss and thesubsequent fair value applied to the convertible notesis considered to be a key audit matter due to thefollowing:
· Judgements required by management in thedetermination of the suitable accountingtreatment;
· Judgements required by management in theselection of a suitable valuation methodology;
· The inputs used and the valuation methodapplied; and
· The complexity of the accounting policyadopted by management.
Refer to Note 2(p) of the financial report for adescription of the accounting policy and significantestimates and judgements applied to thesetransactions.
Our work included but was not limited to thefollowing procedures:
• Reviewing the relevant convertible noteagreements;
• Enquiring with management to understand theconvertible note transactions;
• Assessing whether management’s assessment ofthe classification of the instrument was inaccordance with the accounting standards;
• Reviewing management’s calculation carried outin respect of the valuation of the debtinstrument; and
• Assessing the appropriateness of the disclosuresincluded in Note 2 and Note 16 to the financialstatements.
For
per
sona
l use
onl
y

Impairment of investments in joint venture
Key audit matter How the matter was addressed in our audit
As disclosed in note 12 of the financial report, thecarrying value of the investment in joint venturepreviously represented a significant asset of the Group.
The Group’s policy for accounting for the joint ventureand the significant judgements applied in thedetermination of the assets carrying value andimpairment are disclosed in Note 2(f) and Note 2(ab) ofthe financial report.
Given the underlying assets held by the investment injoint venture relate to exploration and evaluationassets, management undertook a review of theimpairment indicators in accordance with AASB 6Exploration for and Evaluation of Mineral Resources(AASB 6) to determine whether there are any indicatorsto suggest that the investment in joint venture shouldbe impaired.
Due to the quantum of this asset and the subjectivityinvolved in determining whether its carrying value willbe recovered through successful development or saleof its exploration and evaluation assets, we havedetermined this to be a key audit matter.
Our procedures included, but were not limited to:
· Considering whether the facts andcircumstances that existed to suggestimpairment testing was required;
· Holding discussions with management toobtain an understanding of the decisionsundertaken by management regardingmanagement of the Joint Venture includingmanagements’ decision to elect to impair itsinvestment in the Joint Venture; and
· Assessing the adequacy of the relateddisclosures in Note 2 and Note 12 to theFinancial Report.
Other information
The directors are responsible for the other information. The other information comprises theinformation in the Group’s annual report for the year ended 30 June 2019, but does not include thefinancial report and the auditor’s report thereon.
Our opinion on the financial report does not cover the other information and we do not express anyform of assurance conclusion thereon.
In connection with our audit of the financial report, our responsibility is to read the other informationand, in doing so, consider whether the other information is materially inconsistent with the financialreport or our knowledge obtained in the audit or otherwise appears to be materially misstated.
If, based on the work we have performed, we conclude that there is a material misstatement of thisother information, we are required to report that fact. We have nothing to report in this regard.F
or p
erso
nal u
se o
nly

Responsibilities of the directors for the Financial Report
The directors of the Company are responsible for the preparation of the financial report that gives atrue and fair view in accordance with Australian Accounting Standards and the Corporations Act 2001and for such internal control as the directors determine is necessary to enable the preparation of thefinancial report that gives a true and fair view and is free from material misstatement, whether due tofraud or error.
In preparing the financial report, the directors are responsible for assessing the ability of the group tocontinue as a going concern, disclosing, as applicable, matters related to going concern and using thegoing concern basis of accounting unless the directors either intend to liquidate the Group or to ceaseoperations, or has no realistic alternative but to do so.
Auditor’s responsibilities for the audit of the Financial Report
Our objectives are to obtain reasonable assurance about whether the financial report as a whole is freefrom material misstatement, whether due to fraud or error, and to issue an auditor’s report thatincludes our opinion. Reasonable assurance is a high level of assurance, but is not a guarantee that anaudit conducted in accordance with the Australian Auditing Standards will always detect a materialmisstatement when it exists. Misstatements can arise from fraud or error and are considered materialif, individually or in the aggregate, they could reasonably be expected to influence the economicdecisions of users taken on the basis of this financial report.
A further description of our responsibilities for the audit of the financial report is located at theAuditing and Assurance Standards Board website at:
http://www.auasb.gov.au/auditors_responsibilities/ar1.pdf
This description forms part of our auditor’s report.
Report on the Remuneration ReportOpinion on the Remuneration Report
We have audited the Remuneration Report included in pages 13 to 16 of the directors’ report for theyear ended 30 June 2019.
In our opinion, the Remuneration Report of Cape Lambert Resources Limited, for the year ended 30June 2019, complies with section 300A of the Corporations Act 2001.
Responsibilities
The directors of the Company are responsible for the preparation and presentation of theRemuneration Report in accordance with section 300A of the Corporations Act 2001. Our responsibilityis to express an opinion on the Remuneration Report, based on our audit conducted in accordance withAustralian Auditing Standards.
BDO Audit (WA) Pty Ltd
Phillip Murdoch
Director
Perth, 27 September 2019
For
per
sona
l use
onl
y

ANNUAL REPORT 2019
ADDITIONAL STOCK EXCHANGE INFORMATION
75
Cape Lambert Resources Limited is a listed public company, incorporated in Australia. The Company’s registered and principal place of business is 32 Harrogate Street, West Leederville, Western Australia 6007 Australia. This information is current as at 31 August 2019. (a) Distribution of equity securities The distribution of members and their holdings of equity securities in the Company as at 31 August 2019 are as follows:
Equity Securities As at 31 August 2019, there were 3,996 shareholders, holding 1,030,009,850 fully paid ordinary shares. All issued ordinary shares carry one vote per share and are entitled to dividends. The number of shareholders holding less than a marketable parcel of shares is 104.
(b) Twenty Largest Shareholders The names of the twenty largest fully paid ordinary shareholders as at 31 August 2019 are as follows:
Name
Number of Fully Paid Ordinary
Shares Held % held of
Issued Capital
1 J P MORGAN NOMINEES AUSTRALIA LIMITED 273,091,992 26.51 2 GULF ENERGY INTERNATIONAL LIMITED 117,500,000 11.41 3 OKEWOOD PTY LTD 77,516,681 7.53 4 HSBC CUSTODY NOMINEES (AUSTRALIA) LIMITED 60,326,794 5.86 5 CITICORP NOMINEES PTY LIMITED 21,331,120 2.07 6 BNP PARIBAS NOMINEES PTY LTD <IB AU NOMS RETAILCLIENT DRP> 17,730,756 1.72 7 WHITEY TIGER PTY LTD <THE WTL A/C> 17,416,599 1.69 8 KEONG LIM PTY LIMITED <SK LIM FAMILY A/C> 14,804,487 1.44 9 ADKSK SUPERFUND PTY LTD <ADKSK SUPERFUND A/C> 13,616,667 1.32 10 BATTLE MOUNTAIN PTY LTD 12,033,333 1.17 11 CAULDRON ENERGY LIMITED 10,416,667 1.01 12 PER WIMMER 6,993,334 0.68 13 MR JON FAZZALORI 6,785,888 0.66 14 DALE ESTATES NO 1 PTY LTD 6,500,000 0.63 15 FRED PARRISH INVESTMENTS PTY LTD <PARRISH FAMILY A/C> 5,303,535 0.51 16 GANBARU PTY LTD <THE PARRISH SUPER FUND A/C> 5,269,465 0.51 17 MR RICHARD ARTHUR LOCKWOOD 5,000,000 0.49 18 MR BENEDICT MCPHERSON 5,000,000 0.49 19 SUBURBAN HOLDINGS PTY LTD <THE SUBURBAN SUPER FUND A/C> 4,531,934 0.44 20 MR JING SHA + MRS ZIN ZHANG 4,227,029 0.41
685,396,281 66.54
Category (size of holding) Total Holders Number of Units
1- 1,000 204 83,986 1,001- 5,000 949 2,937,603 5,001- 10,000 728 6,162,479 10,001- 100,000 1,546 59,527,772 100,001 – 999,999,999 569 961,298,010
Total 3,996 1,030,009,850
For
per
sona
l use
onl
y
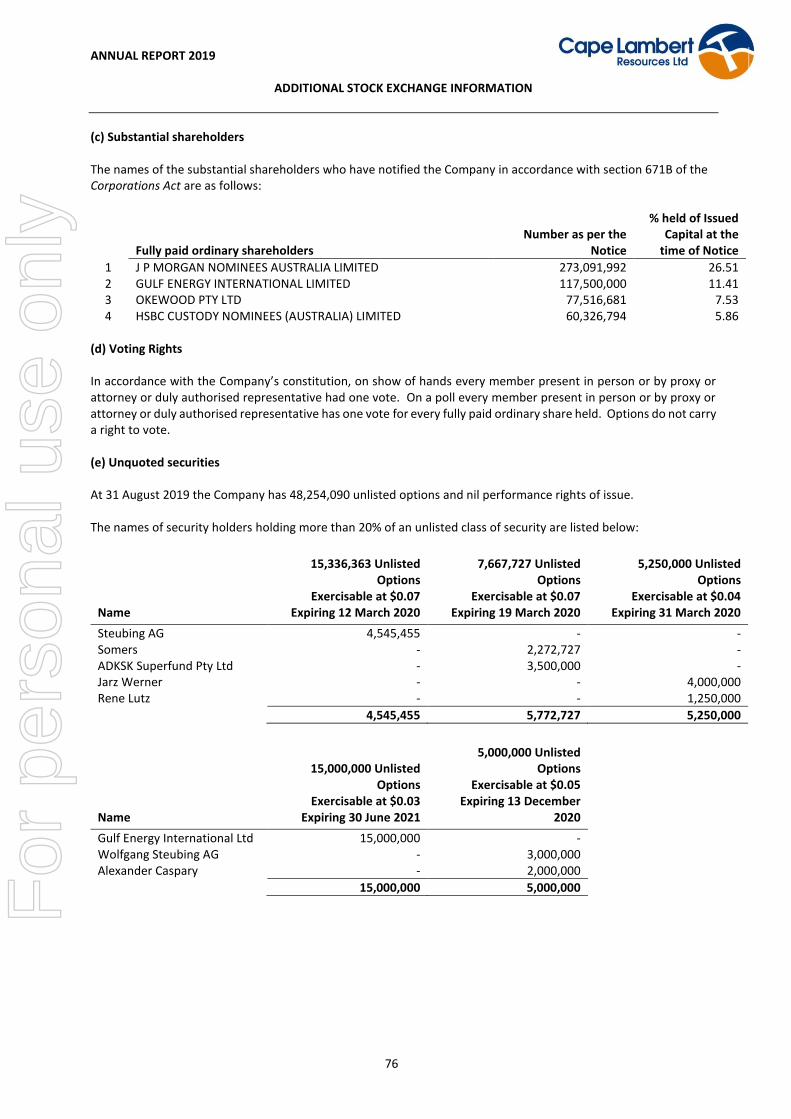
ANNUAL REPORT 2019
ADDITIONAL STOCK EXCHANGE INFORMATION
76
(c) Substantial shareholders The names of the substantial shareholders who have notified the Company in accordance with section 671B of the Corporations Act are as follows:
Fully paid ordinary shareholders Number as per the
Notice
% held of Issued Capital at the
time of Notice
1 J P MORGAN NOMINEES AUSTRALIA LIMITED 273,091,992 26.51 2 GULF ENERGY INTERNATIONAL LIMITED 117,500,000 11.41 3 OKEWOOD PTY LTD 77,516,681 7.53 4 HSBC CUSTODY NOMINEES (AUSTRALIA) LIMITED 60,326,794 5.86
(d) Voting Rights In accordance with the Company’s constitution, on show of hands every member present in person or by proxy or attorney or duly authorised representative had one vote. On a poll every member present in person or by proxy or attorney or duly authorised representative has one vote for every fully paid ordinary share held. Options do not carry a right to vote. (e) Unquoted securities At 31 August 2019 the Company has 48,254,090 unlisted options and nil performance rights of issue. The names of security holders holding more than 20% of an unlisted class of security are listed below:
Name
15,336,363 Unlisted Options
Exercisable at $0.07 Expiring 12 March 2020
7,667,727 Unlisted Options
Exercisable at $0.07 Expiring 19 March 2020
5,250,000 Unlisted Options
Exercisable at $0.04 Expiring 31 March 2020
Steubing AG 4,545,455 - - Somers - 2,272,727 - ADKSK Superfund Pty Ltd - 3,500,000 - Jarz Werner - - 4,000,000 Rene Lutz - - 1,250,000
4,545,455 5,772,727 5,250,000
Name
15,000,000 Unlisted Options
Exercisable at $0.03 Expiring 30 June 2021
5,000,000 Unlisted Options
Exercisable at $0.05 Expiring 13 December
2020
Gulf Energy International Ltd 15,000,000 - Wolfgang Steubing AG - 3,000,000 Alexander Caspary - 2,000,000
15,000,000 5,000,000
For
per
sona
l use
onl
y

ANNUAL REPORT 2019
ADDITIONAL STOCK EXCHANGE INFORMATION
77
Schedule of Mineral Tenements Held at 30 June 2019
Tenement Project & Location Interest
Marampa Project - EL 46A/2011 Lunsar - Sierra Leone 100%4
Marampa Project – ML 05/2014 Lunsar - Sierra Leone 100%4
Kukuna Project - EL 22/2012 Kukuna – Sierra Leone 100%
ML 90098 ¹ Wee MacGregor - Queensland 100%
ML 2504 ¹ Wee MacGregor - Queensland 100%
ML 2771 ² Wee MacGregor - Queensland 100%
ML 2773 ¹ Wee MacGregor - Queensland 100%
Marampa Project - EL 46A/2011 Lunsar - Sierra Leone 100%4
¹ Subject to the Cohiba (Cobalt X) Farm-in agreement, refer to ASX March 2017 Quarterly Report for details.
² Subject to the Firebird Farm-in agreement, refer to ASX March 2016 Quarterly Report for details. ³ Refer to commentary above 4 During the September 2018 quarter, the Company received a letter from the Sierra Leone Ministry of Mines (MoM) informing Marampa Iron Ore (SL) Limited (Marampa SL) of the cancellation of the Marampa mining license ML05/2014 due to non payment of fees. In September 2014, Marampa SL submitted to the MoM an application letter entitled “Force Majeure to all Cape Lambert Operations in Sierra Leone” which was acknowledged by the MoM. The Company understood that the agreement with the MoM was that force majeure events were aknowledged and authorised and as such no fees would accrue or be payable until a processing facility was operating and Marampa SL is producing iron ore from Marampa. The Company understands that the notice of cancellation of license letter has incorrectly been issued by the new Sierra Leone government who are not aware of the agreement. In order to protect it’s position, Marampa SL has engaged Sierra Leone based lawyers BMT Law Chambers who has commenced legal action in the High Court of Sierra Leone against the cancellation of the licence.
For
per
sona
l use
onl
y


