Capcom USA, Inc. 401(k) Plan Capcom 401(k) Strategies for Retirement David Morehead CRPS ©, AIF ©,...
43
Capcom USA, Inc. 401(k) Plan Capcom 401(k) Strategies for Retirement David Morehead CRPS © , AIF © , PPC Vice President, Advisory Services [email protected] (858) 551-4015 Securities offered through LPL Financial, member FINRA/SIPC. Investment advice offered through Independent Financial Partners (IFP) dba RBG Advisors, Inc., a registered investment advisor and separate entity from LPL Financial. Retirement Benefits Group is a Registered Trademark of Retirement Benefits Group, LLC, all rights reserved.
-
Upload
sophie-hill -
Category
Documents
-
view
217 -
download
3
Transcript of Capcom USA, Inc. 401(k) Plan Capcom 401(k) Strategies for Retirement David Morehead CRPS ©, AIF ©,...

Capcom USA, Inc. 401(k) Plan
Capcom 401(k) Strategies for Retirement
David Morehead CRPS©, AIF©, PPCVice President, Advisory Services
[email protected](858) 551-4015
Securities offered through LPL Financial, member FINRA/SIPC. Investment advice offered through Independent Financial Partners (IFP) dba RBG Advisors, Inc., a registered investment advisor and separate entity from LPL Financial. Retirement Benefits Group is a Registered Trademark of Retirement Benefits Group, LLC, all rights reserved.
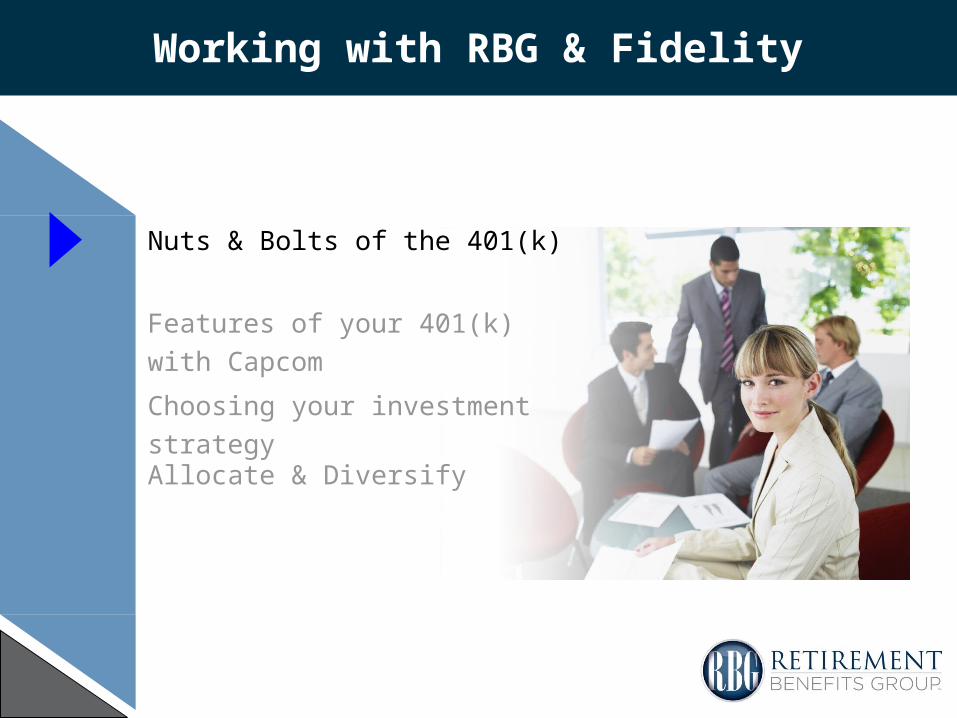
Working with RBG & Fidelity
Nuts & Bolts of the 401(k)
Features of your 401(k) with Capcom
Choosing your investment strategy
Allocate & Diversify

Working with RBG & Fidelity
Nuts & Bolts of the 401(k)
Features of your 401(k) with Capcom
Choosing your investments strategy
Allocate & Diversify

Working with RBG & Fidelity
Nuts & Bolts of the 401(k)
Features of your 401(k) with Capcom
Choosing your investment strategy
Allocate & Diversify

Working with RBG & Fidelity
Nuts & Bolts of the 401(k)
Features of your 401(k) with Capcom
Choosing your investment strategy
Allocate & Diversify

Nuts &Bolts of your 401(k)

Nuts & Bolts
• IRC Section 401(k) – Tax Advantaged Savings Designed for Retirement Income
• Payroll Deduction
• Trust Account with Fidelity
• Fully Transferrable

34 39 45 71113 138 169 190 208
0
100
200
300
400
500
600
700
2002 2003 2004 2005 2006 2007 2008 2009 2010
Firms with frozen plans
Firms with active plans
Nuts & Bolts
Defined Benefit Plans – Funded Status: S&P 500 CompaniesDefined Benefit Plan Freezes among the Fortune 1000
firm
s
Defined Contribution Only
Both DB & DC
Defined Benefit Only
67%
27%
7%
Participation by Plan TypeDistribution of private-sector, active-worker participants, 1979-2009
Source (Top left chart): Reprinted with permission from Insider © 2010 Watson Wyatt Worldwide. For more information, visit www.watsonwyatt.com. Source (Top right chart): J.P. Morgan Asset Management. Pension funded status data based on all available and reported data from S&P 500 Index companies. Data as of December 31, 2009.Source (Bottom chart): U.S. Department of Labor, Form 5500 Summary Report (summer 2004); EBRI estimates 1999-2009.
1999 2009
Overfunded Underfunded
More employers are shifting retirement plans to employee-driven options
22%
78%
7%
93%
0%10%20%30%40%50%60%70%80%
1978 1980 1982 1984 1986 1988 1990 1992 1994 1996 1998 2000 2002 2004 2006 2008

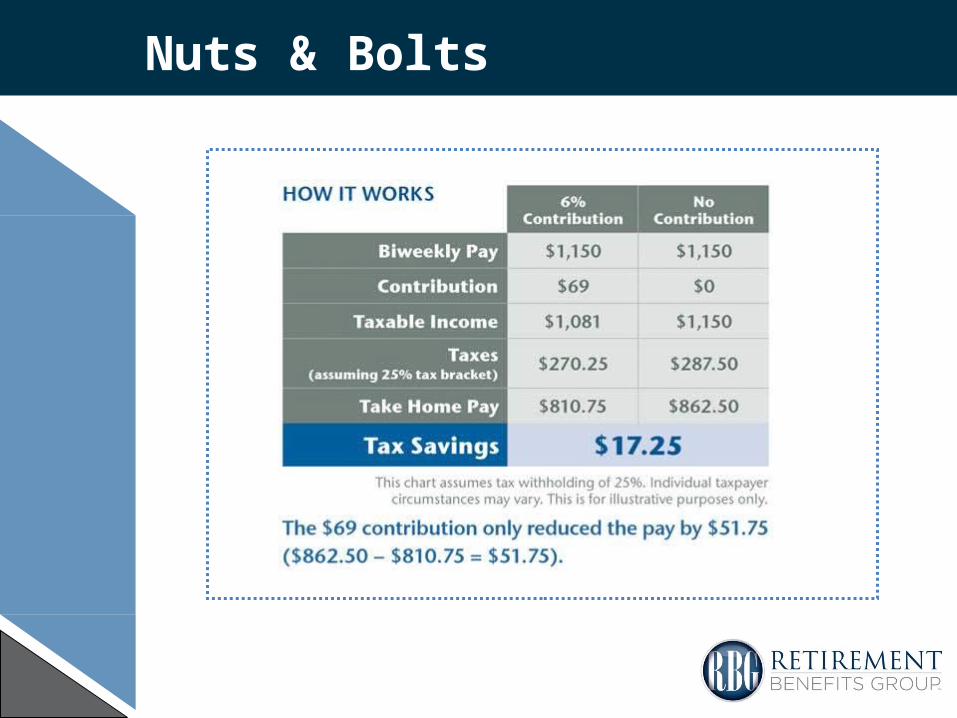
Once you’re enrolled in the plan, you can change the contributionrate or discontinue participation every calendar quarter.
Who is eligible?All employees at least age 21 years of age may participate. Enter the plan every calendar quarter.
How do you enroll?Online – www.401k.comPhone – 800-FIDELITY
Nuts & Bolts

Ordinary contributions Up to 60% of eligible pay on a Pre-tax basis, subject to the IRS limit.
($17,000 in 2012)
Catch-up contributions Up to $5,500 in additional pretax contributions (2012 IRS limit) if you turn age 50 or older during the year
How much can you contribute?
Nuts & Bolts

Match100% of first 3% and then 50% of the next 2%.
(You contribute 5% and then Capcom matches 4%)
Vesting5 year graded schedule (20% per year.
Employer contributions?
Nuts & Bolts

Nuts & Bolts
Access & Portability
- 401k Loans
- Rollovers
Nuts & Bolts

$0
$50,000
$100,000
$150,000
$200,000
$250,000
$300,000
$350,000
25 30 35 40 45 50 55 60
Benefit of Saving Early
Compounding can greatly impact the amount of savings over the long term
• Susan invests $2,000 annually between the ages of 25 and 35.
• In total, she invests $20,000.
• Bill invests $2,000 annually between the ages of 35 and 65.
• In total, he invests $60,000.
Susan stops contributing
Bill starts investing
$314,870
$244,692
The above example is for illustrative purposes only and not indicative of any investment. Account value in this example assumes an 8% annual return. Source: J.P. Morgan Asset Management.
Compounding refers to the process of earning return on principal plus the return that was earned earlier.
Growth of Savings Accounts
Age
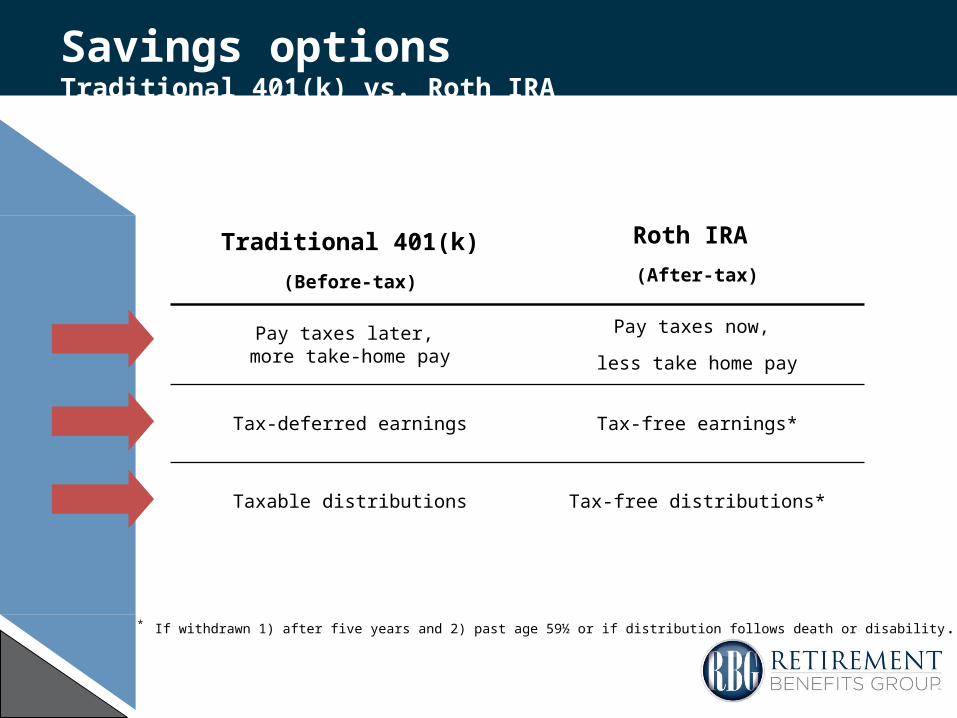
Savings optionsTraditional 401(k) vs. Roth IRA
* If withdrawn 1) after five years and 2) past age 59½ or if distribution follows death or disability.
Traditional 401(k)
(Before-tax)
Roth IRA
(After-tax)
Pay taxes later, more take-home pay
Pay taxes now,
less take home pay
Tax-deferred earnings Tax-free earnings*
Taxable distributions Tax-free distributions*

Choosing your investments
8%8%
8%
22%
9%13%
4%
26%
Equity Mkt. Neutral
Commodities
REIT
S&P 500
Russell 2000
MSCI EAFE
MSCI EM
Barclays Agg.
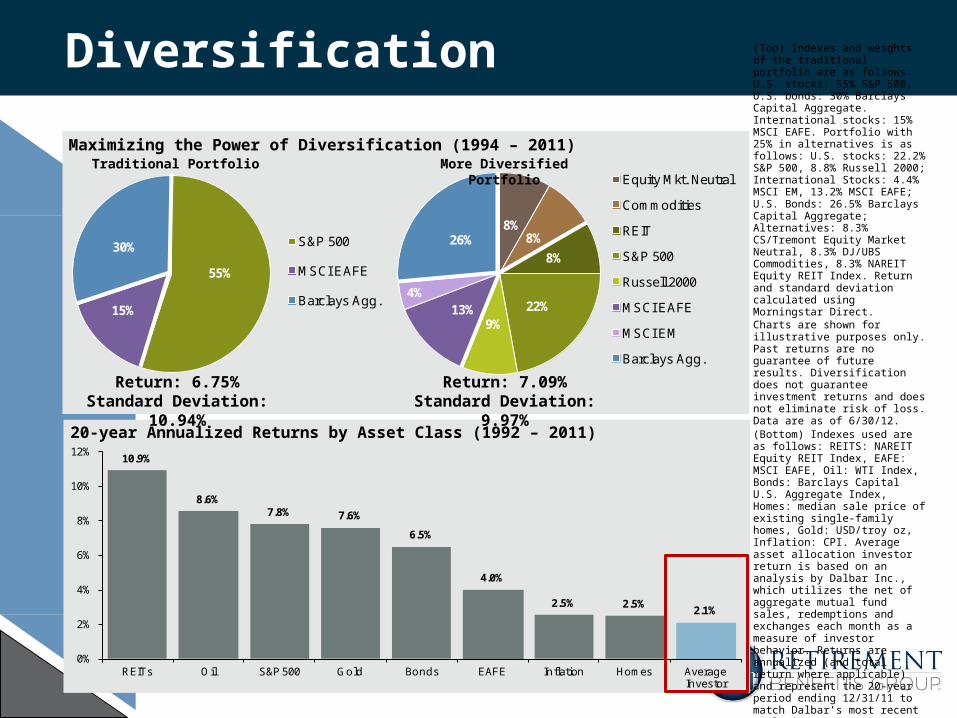
Diversification
20-year Annualized Returns by Asset Class (1992 – 2011)
(Top) Indexes and weights of the traditional portfolio are as follows: U.S. stocks: 55% S&P 500, U.S. bonds: 30% Barclays Capital Aggregate. International stocks: 15% MSCI EAFE. Portfolio with 25% in alternatives is as follows: U.S. stocks: 22.2% S&P 500, 8.8% Russell 2000; International Stocks: 4.4% MSCI EM, 13.2% MSCI EAFE; U.S. Bonds: 26.5% Barclays Capital Aggregate; Alternatives: 8.3% CS/Tremont Equity Market Neutral, 8.3% DJ/UBS Commodities, 8.3% NAREIT Equity REIT Index. Return and standard deviation calculated using Morningstar Direct.Charts are shown for illustrative purposes only. Past returns are no guarantee of future results. Diversification does not guarantee investment returns and does not eliminate risk of loss. Data are as of 6/30/12. (Bottom) Indexes used are as follows: REITS: NAREIT Equity REIT Index, EAFE: MSCI EAFE, Oil: WTI Index, Bonds: Barclays Capital U.S. Aggregate Index, Homes: median sale price of existing single-family homes, Gold: USD/troy oz, Inflation: CPI. Average asset allocation investor return is based on an analysis by Dalbar Inc., which utilizes the net of aggregate mutual fund sales, redemptions and exchanges each month as a measure of investor behavior. Returns are annualized (and total return where applicable) and represent the 20-year period ending 12/31/11 to match Dalbar’s most recent analysis.
Traditional Portfolio More Diversified Portfolio
Return: 6.75%Standard Deviation: 10.94%
Return: 7.09%Standard Deviation: 9.97%
Maximizing the Power of Diversification (1994 – 2011)
55%
15%
30% S&P 500
MSCI EAFE
Barclays Agg.
10.9%
8.6%7.8% 7.6%
6.5%
4.0%
2.5% 2.5%2.1%
0%
2%
4%
6%
8%
10%
12%
REITs Oil S&P 500 Gold Bonds EAFE Inflation Homes Average Investor
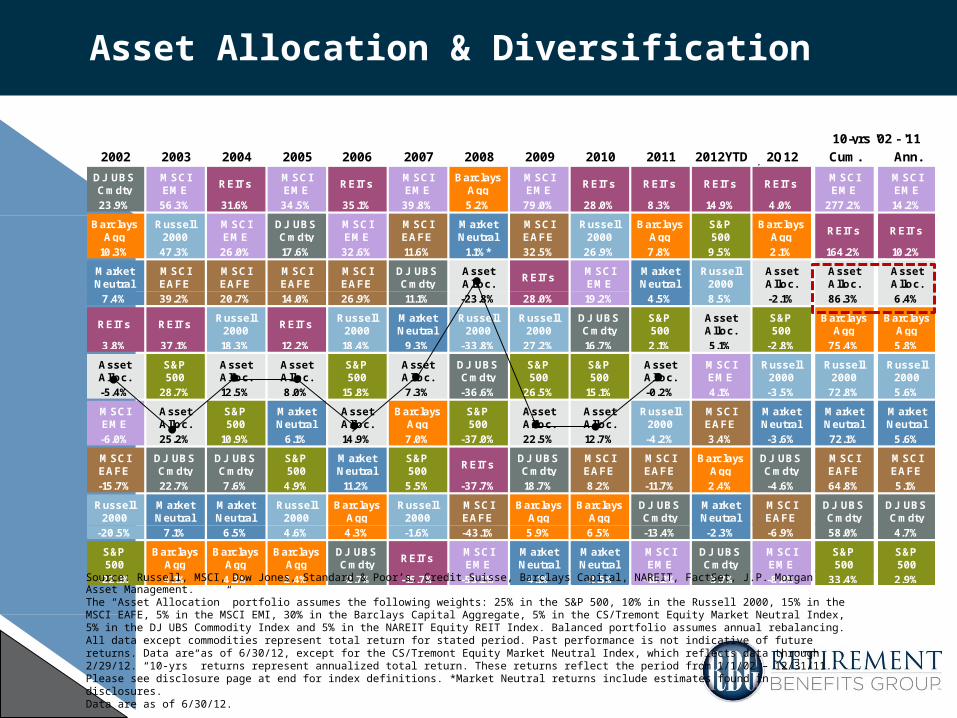
2002 2003 2004 2005 2006 2007 2008 2009 2010 2011 2012YTD 2Q12 Cum. Ann..
DJ UBSCmdty
MSCIEME
REITsMSCIEME
REITsMSCIEME
Barclays Agg
MSCIEME
REITs REITs REITs REITsMSCIEME
MSCIEME
23.9% 56.3% 31.6% 34.5% 35.1% 39.8% 5.2% 79.0% 28.0% 8.3% 14.9% 4.0% 277.2% 14.2%
Barclays Agg
Russell 2000
MSCIEME
DJ UBSCmdty
MSCIEME
MSCI EAFE
Market Neutral
MSCI EAFE
Russell 2000
Barclays Agg
S&P500
Barclays Agg
REITs REITs
10.3% 47.3% 26.0% 17.6% 32.6% 11.6% 1.1%* 32.5% 26.9% 7.8% 9.5% 2.1% 164.2% 10.2%. .
Market Neutral
MSCI EAFE
MSCI EAFE
MSCI EAFE
MSCI EAFE
DJ UBSCmdty
Asset Alloc.
REITsMSCIEME
Market Neutral
Russell 2000
Asset Alloc.
Asset Alloc.
Asset Alloc.
7.4% 39.2% 20.7% 14.0% 26.9% 11.1% -23.8% 28.0% 19.2% 4.5% 8.5% -2.1% 86.3% 6.4%
REITs REITsRussell
2000REITs
Russell 2000
Market Neutral
Russell 2000
Russell 2000
DJ UBSCmdty
S&P500
Asset Alloc.
S&P500
Barclays Agg
Barclays Agg
3.8% 37.1% 18.3% 12.2% 18.4% 9.3% -33.8% 27.2% 16.7% 2.1% 5.1% -2.8% 75.4% 5.8%
Asset Alloc.
S&P500
Asset Alloc.
Asset Alloc.
S&P500
Asset Alloc.
DJ UBSCmdty
S&P500
S&P500
Asset Alloc.
MSCIEME
Russell 2000
Russell 2000
Russell 2000
-5.4% 28.7% 12.5% 8.0% 15.8% 7.3% -36.6% 26.5% 15.1% -0.2% 4.1% -3.5% 72.8% 5.6%
MSCIEME
Asset Alloc.
S&P500
Market Neutral
Asset Alloc.
Barclays Agg
S&P500
Asset Alloc.
Asset Alloc.
Russell 2000
MSCI EAFE
Market Neutral
Market Neutral
Market Neutral
-6.0% 25.2% 10.9% 6.1% 14.9% 7.0% -37.0% 22.5% 12.7% -4.2% 3.4% -3.6% 72.1% 5.6%
MSCI EAFE
DJ UBSCmdty
DJ UBSCmdty
S&P500
Market Neutral
S&P500
REITsDJ UBSCmdty
MSCI EAFE
MSCI EAFE
Barclays Agg
DJ UBSCmdty
MSCI EAFE
MSCI EAFE
-15.7% 22.7% 7.6% 4.9% 11.2% 5.5% -37.7% 18.7% 8.2% -11.7% 2.4% -4.6% 64.8% 5.1%
Russell 2000
Market Neutral
Market Neutral
Russell 2000
Barclays Agg
Russell 2000
MSCI EAFE
Barclays Agg
Barclays Agg
DJ UBSCmdty
Market Neutral
MSCI EAFE
DJ UBSCmdty
DJ UBSCmdty
-20.5% 7.1% 6.5% 4.6% 4.3% -1.6% -43.1% 5.9% 6.5% -13.4% -2.3% -6.9% 58.0% 4.7%
S&P500
Barclays Agg
Barclays Agg
Barclays Agg
DJ UBSCmdty
REITsMSCIEME
Market Neutral
Market Neutral
MSCIEME
DJ UBSCmdty
MSCIEME
S&P500
S&P500
-22.1% 4.1% 4.3% 2.4% -2.7% -15.7% -53.2% 4.1% -2.5% -18.2% -3.7% -8.8% 33.4% 2.9%
10-yrs '02 - '11
Asset Allocation & Diversification
Source: Russell, MSCI, Dow Jones, Standard & Poor’s, Credit Suisse, Barclays Capital, NAREIT, FactSet, J.P. Morgan Asset Management. The “Asset Allocation” portfolio assumes the following weights: 25% in the S&P 500, 10% in the Russell 2000, 15% in the MSCI EAFE, 5% in the MSCI EMI, 30% in the Barclays Capital Aggregate, 5% in the CS/Tremont Equity Market Neutral Index, 5% in the DJ UBS Commodity Index and 5% in the NAREIT Equity REIT Index. Balanced portfolio assumes annual rebalancing. All data except commodities represent total return for stated period. Past performance is not indicative of future returns. Data are as of 6/30/12, except for the CS/Tremont Equity Market Neutral Index, which reflects data through2/29/12. “10-yrs” returns represent annualized total return. These returns reflect the period from 1/1/02 – 12/31/11. Please see disclosure page at end for index definitions. *Market Neutral returns include estimates found in disclosures.Data are as of 6/30/12.
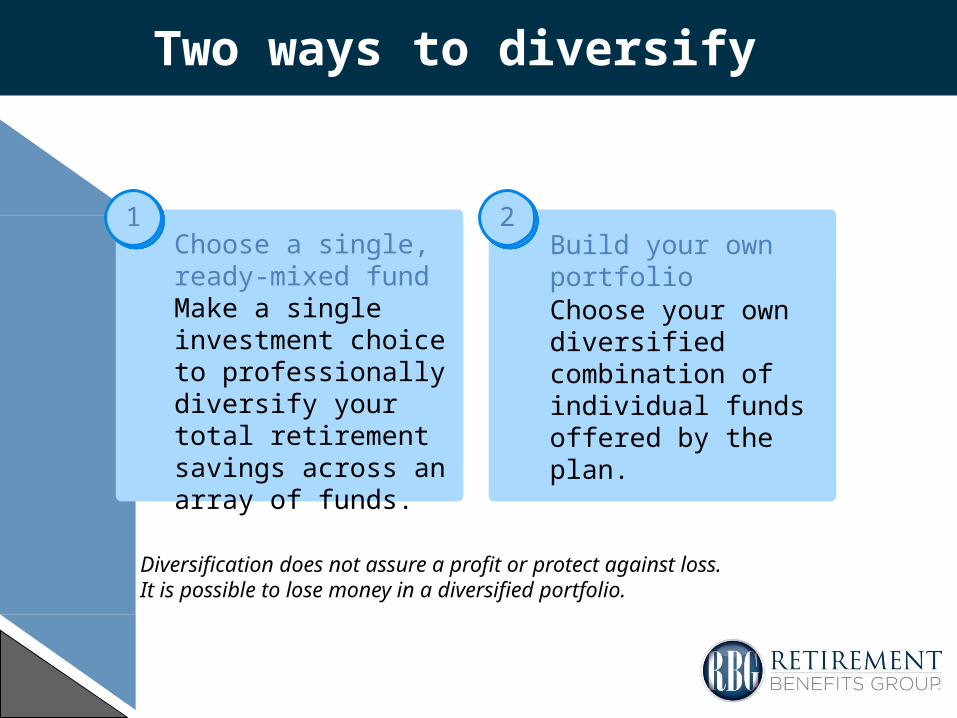
Two ways to diversify
Diversification does not assure a profit or protect against loss. It is possible to lose money in a diversified portfolio.
Choose a single, ready-mixed fundMake a single investment choice to professionally diversify your total retirement savings across an array of funds.
Build your ownportfolioChoose your own diversified combination of individual funds offered by the plan.
11 22
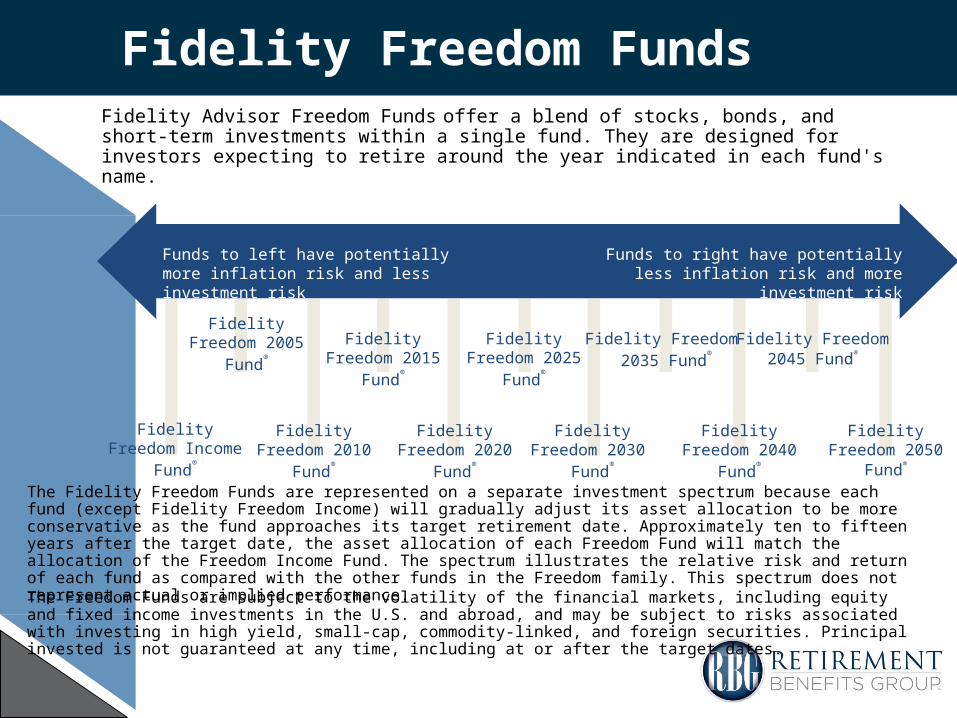
Fidelity Advisor Freedom Funds offer a blend of stocks, bonds, and short-term investments within a single fund. They are designed for investors expecting to retire around the year indicated in each fund's name.
The Fidelity Freedom Funds are represented on a separate investment spectrum because each fund (except Fidelity Freedom Income) will gradually adjust its asset allocation to be more conservative as the fund approaches its target retirement date. Approximately ten to fifteen years after the target date, the asset allocation of each Freedom Fund will match the allocation of the Freedom Income Fund. The spectrum illustrates the relative risk and return of each fund as compared with the other funds in the Freedom family. This spectrum does not represent actual or implied performance.The Freedom Funds are subject to the volatility of the financial markets, including equity and fixed income investments in the U.S. and abroad, and may be subject to risks associated with investing in high yield, small-cap, commodity-linked, and foreign securities. Principal invested is not guaranteed at any time, including at or after the target dates.
Funds to left have potentially more inflation risk and less investment risk
Funds to right have potentially less inflation risk and more investment risk
FidelityFreedom Income
Fund®
Fidelity Freedom 2015 Fund
®Fidelity Freedom
2025 Fund®
Fidelity Freedom 2035 Fund
®
Fidelity Freedom 2010 Fund
®Fidelity Freedom
2020 Fund®
Fidelity Freedom 2030 Fund
®
Fidelity Freedom 2040 Fund
®
Fidelity Freedom 2005 Fund
® Fidelity Freedom2045 Fund®
Fidelity Freedom 2050 Fund®
Fidelity Freedom Funds

Building your own portfolio
You can select individual funds from the plan’s lineup.This requires you to:
Take the time to learn about individual investment styles and fund options
Choose your own diversified combination of investments
Personally make adjustments to your portfolio’s risk level on an ongoing basis

Building your own portfolio
You can select individual funds from the plan’s lineup.This requires you to :
Take the time to learn about individual investment styles and fund options
Choose your own diversified combination of investments
Personally make adjustments to your portfolio’s risk level on an ongoing basis
RBG can assist you with asset allocation and diversification.

Building your own portfolio
You can select individual funds from the plan’s lineup.This requires you to :
Take the time to learn about individual investment styles and fund options
Choose your own diversified combination of investments
Personally make adjustments to your portfolio’s risk level on an ongoing basis
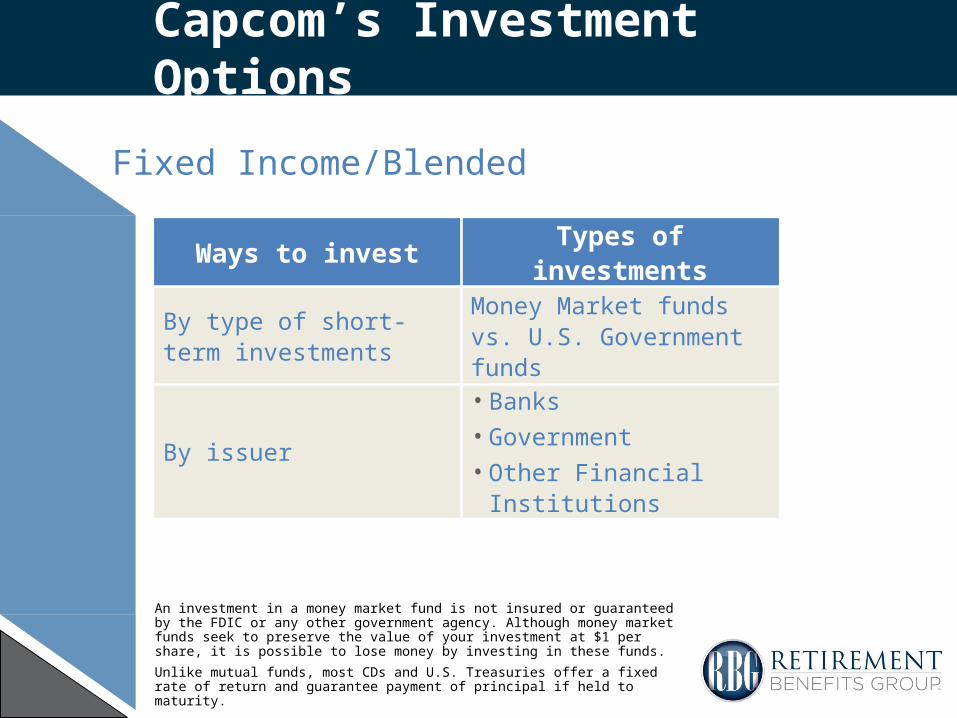
An investment in a money market fund is not insured or guaranteed by the FDIC or any other government agency. Although money market funds seek to preserve the value of your investment at $1 per share, it is possible to lose money by investing in these funds.
Unlike mutual funds, most CDs and U.S. Treasuries offer a fixed rate of return and guarantee payment of principal if held to maturity.
Capcom’s Investment Options
Ways to invest Types of investments
By type of short-term investments
Money Market funds vs. U.S. Government funds
By issuer• Banks• Government • Other Financial Institutions
Fixed Income/Blended
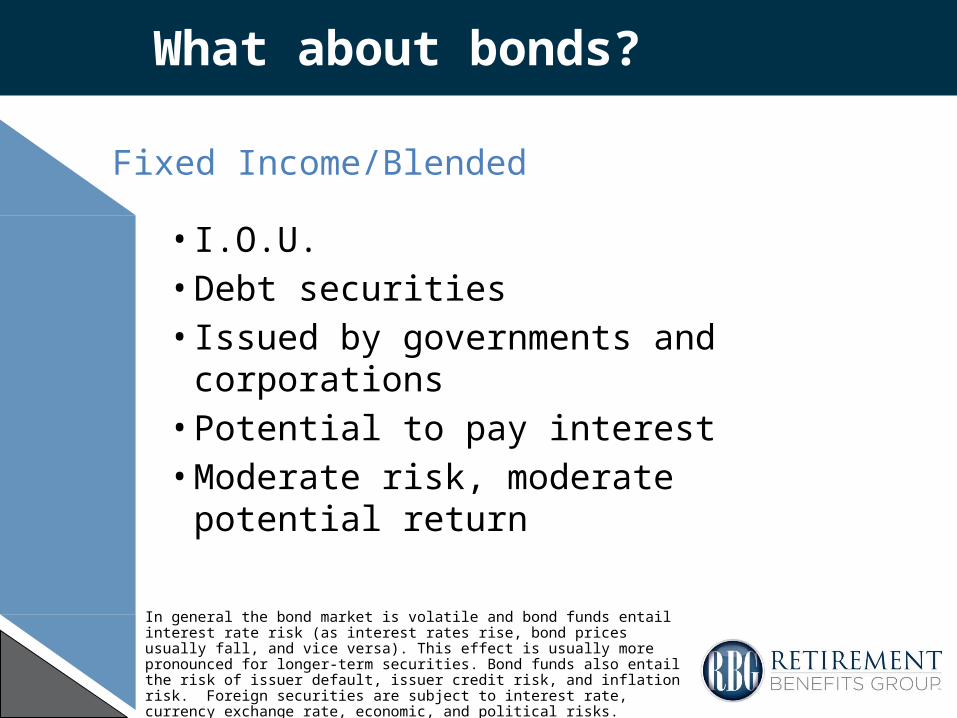
What about bonds?
• I.O.U.• Debt securities• Issued by governments and corporations• Potential to pay interest• Moderate risk, moderate potential return
In general the bond market is volatile and bond funds entail interest rate risk (as interest rates rise, bond prices usually fall, and vice versa). This effect is usually more pronounced for longer-term securities. Bond funds also entail the risk of issuer default, issuer credit risk, and inflation risk. Foreign securities are subject to interest rate, currency exchange rate, economic, and political risks. Increases in real interest rates can cause the price of inflation-protected debt securities to decrease. Leverage can increase market exposure and magnify investment risk.
Fixed Income/Blended
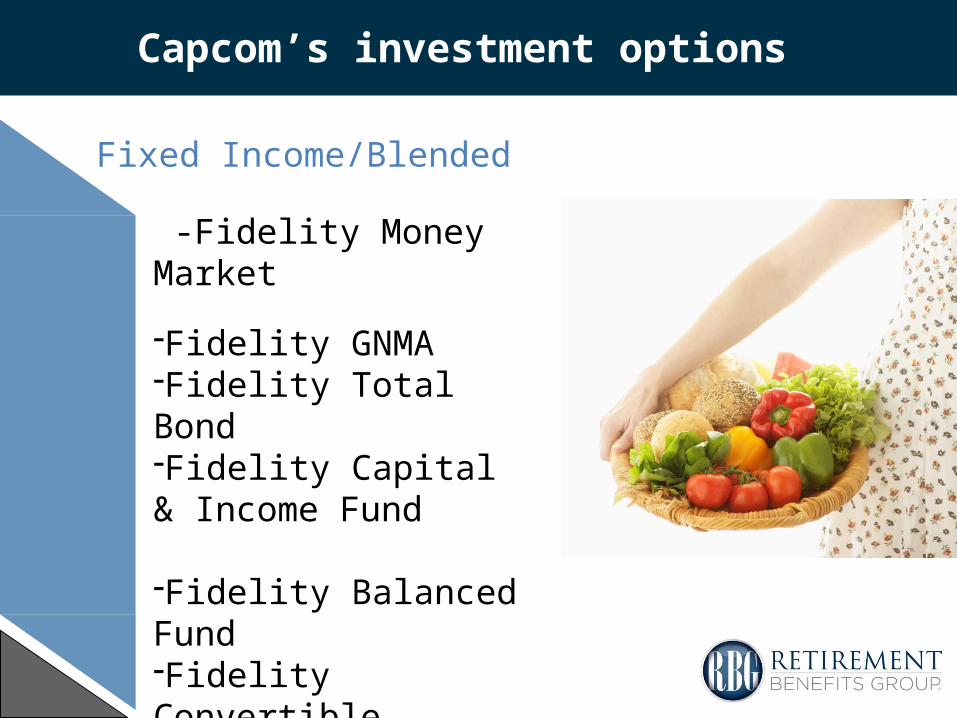
Capcom’s investment options
-Fidelity Money Market
-Fidelity GNMA-Fidelity Total Bond-Fidelity Capital & Income Fund
-Fidelity Balanced Fund-Fidelity Convertible Securities Fund
Fixed Income/Blended

Large Cap $10 billion and above
Mid Cap $2 to $10 billion
Small Cap Less than $2 billion
Stock markets, especially foreign markets, are volatile and can decline significantly in response to adverse issuer, political, regulatory, market, or economic developments.The securities of smaller, less well-known companies can be more volatile than those of larger companies.Foreign securities are subject to interest rate, currency exchange rate, economic, and political risks.
Stocks: Size of a Company
Capcom’s investment options
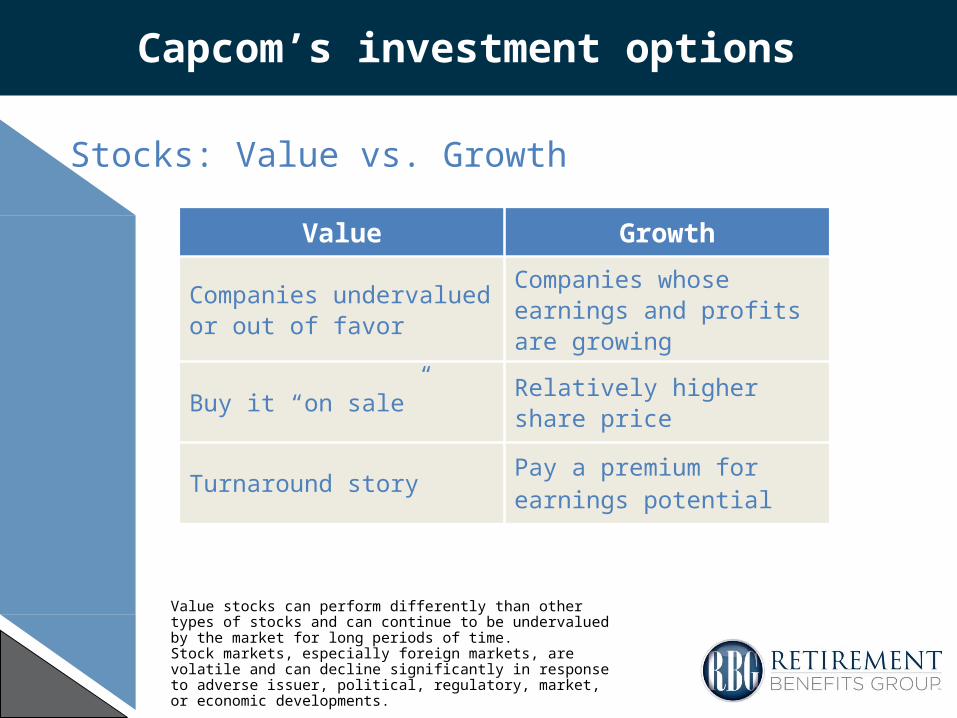
Value Growth
Companies undervalued or out of favor
Companies whose earnings and profits are growing
Buy it “on sale” Relatively higher share price
Turnaround story Pay a premium for earnings potential
Value stocks can perform differently than other types of stocks and can continue to be undervalued by the market for long periods of time. Stock markets, especially foreign markets, are volatile and can decline significantly in response to adverse issuer, political, regulatory, market, or economic developments.
Stocks: Value vs. Growth
Capcom’s investment options

Stocks: Domestic
Capcom’s investment options
-T Rowe Price Equity Income-Fidelity Equity Income-MFS Massachusetts Investors Trust-Spartan 500 Index-Fidelity Export & Multinational-Fidelity Magellan-Fidelity Contrafund
-Fidelity Value-Fidelity Leveraged Company Stock-Fidelity Low Priced Stock-Morgan Stanley Midcap Growth
-Fidelity Small Cap Value-TCW Smallcap Growth

Ways to invest Types of investments
By whether they includethe U.S.
• Global: includes U.S. • International: outside U.S
By where they invest• Regional, e.g., Europe• Country, e.g., Japan
By segment of the market• International small cap• International bond
Stock markets, especially foreign markets, are volatile and can decline significantly in response to adverse issuer, political, regulatory, market, or economic developments.Foreign securities are subject to interest rate, currency exchange rate, economic, and political risks, all of which are magnified in emerging markets.
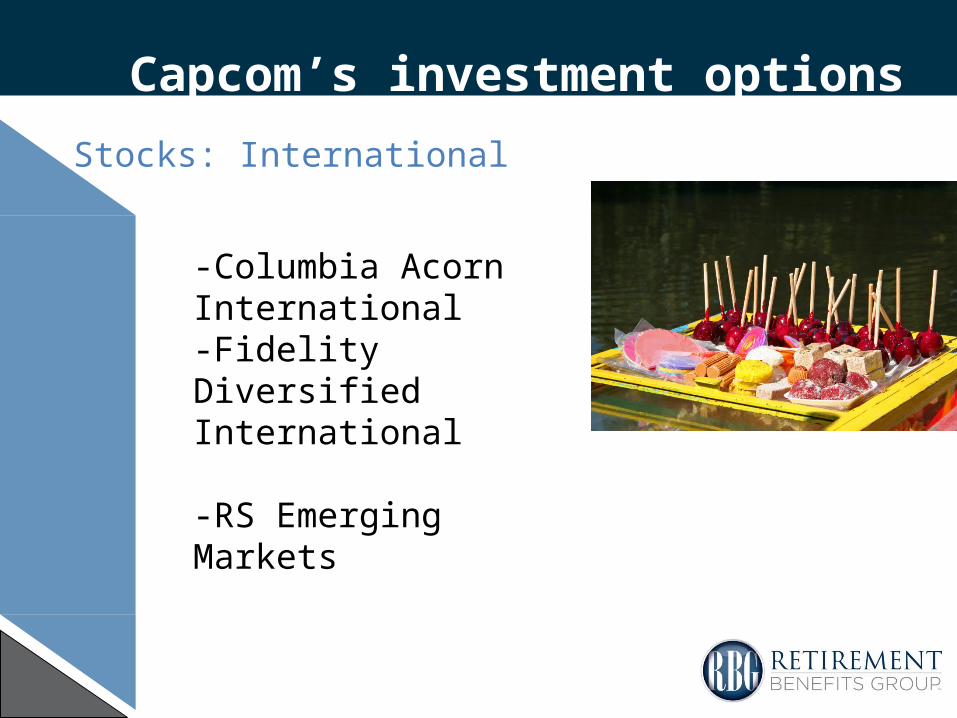
Stocks: International
Capcom’s investment options
Capcom’s investment options
Stocks: International
-Columbia Acorn International-Fidelity Diversified International
-RS Emerging Markets

2002 2003 2004 2005 2006 2007 2008 2009 2010 2011 2012YTD 2Q12 Cum. Ann..
DJ UBSCmdty
MSCIEME
REITsMSCIEME
REITsMSCIEME
Barclays Agg
MSCIEME
REITs REITs REITs REITsMSCIEME
MSCIEME
23.9% 56.3% 31.6% 34.5% 35.1% 39.8% 5.2% 79.0% 28.0% 8.3% 14.9% 4.0% 277.2% 14.2%
Barclays Agg
Russell 2000
MSCIEME
DJ UBSCmdty
MSCIEME
MSCI EAFE
Market Neutral
MSCI EAFE
Russell 2000
Barclays Agg
S&P500
Barclays Agg
REITs REITs
10.3% 47.3% 26.0% 17.6% 32.6% 11.6% 1.1%* 32.5% 26.9% 7.8% 9.5% 2.1% 164.2% 10.2%. .
Market Neutral
MSCI EAFE
MSCI EAFE
MSCI EAFE
MSCI EAFE
DJ UBSCmdty
Asset Alloc.
REITsMSCIEME
Market Neutral
Russell 2000
Asset Alloc.
Asset Alloc.
Asset Alloc.
7.4% 39.2% 20.7% 14.0% 26.9% 11.1% -23.8% 28.0% 19.2% 4.5% 8.5% -2.1% 86.3% 6.4%
REITs REITsRussell
2000REITs
Russell 2000
Market Neutral
Russell 2000
Russell 2000
DJ UBSCmdty
S&P500
Asset Alloc.
S&P500
Barclays Agg
Barclays Agg
3.8% 37.1% 18.3% 12.2% 18.4% 9.3% -33.8% 27.2% 16.7% 2.1% 5.1% -2.8% 75.4% 5.8%
Asset Alloc.
S&P500
Asset Alloc.
Asset Alloc.
S&P500
Asset Alloc.
DJ UBSCmdty
S&P500
S&P500
Asset Alloc.
MSCIEME
Russell 2000
Russell 2000
Russell 2000
-5.4% 28.7% 12.5% 8.0% 15.8% 7.3% -36.6% 26.5% 15.1% -0.2% 4.1% -3.5% 72.8% 5.6%
MSCIEME
Asset Alloc.
S&P500
Market Neutral
Asset Alloc.
Barclays Agg
S&P500
Asset Alloc.
Asset Alloc.
Russell 2000
MSCI EAFE
Market Neutral
Market Neutral
Market Neutral
-6.0% 25.2% 10.9% 6.1% 14.9% 7.0% -37.0% 22.5% 12.7% -4.2% 3.4% -3.6% 72.1% 5.6%
MSCI EAFE
DJ UBSCmdty
DJ UBSCmdty
S&P500
Market Neutral
S&P500
REITsDJ UBSCmdty
MSCI EAFE
MSCI EAFE
Barclays Agg
DJ UBSCmdty
MSCI EAFE
MSCI EAFE
-15.7% 22.7% 7.6% 4.9% 11.2% 5.5% -37.7% 18.7% 8.2% -11.7% 2.4% -4.6% 64.8% 5.1%
Russell 2000
Market Neutral
Market Neutral
Russell 2000
Barclays Agg
Russell 2000
MSCI EAFE
Barclays Agg
Barclays Agg
DJ UBSCmdty
Market Neutral
MSCI EAFE
DJ UBSCmdty
DJ UBSCmdty
-20.5% 7.1% 6.5% 4.6% 4.3% -1.6% -43.1% 5.9% 6.5% -13.4% -2.3% -6.9% 58.0% 4.7%
S&P500
Barclays Agg
Barclays Agg
Barclays Agg
DJ UBSCmdty
REITsMSCIEME
Market Neutral
Market Neutral
MSCIEME
DJ UBSCmdty
MSCIEME
S&P500
S&P500
-22.1% 4.1% 4.3% 2.4% -2.7% -15.7% -53.2% 4.1% -2.5% -18.2% -3.7% -8.8% 33.4% 2.9%
10-yrs '02 - '11
Asset Allocation & Diversification
Source: Russell, MSCI, Dow Jones, Standard & Poor’s, Credit Suisse, Barclays Capital, NAREIT, FactSet, J.P. Morgan Asset Management. The “Asset Allocation” portfolio assumes the following weights: 25% in the S&P 500, 10% in the Russell 2000, 15% in the MSCI EAFE, 5% in the MSCI EMI, 30% in the Barclays Capital Aggregate, 5% in the CS/Tremont Equity Market Neutral Index, 5% in the DJ UBS Commodity Index and 5% in the NAREIT Equity REIT Index. Balanced portfolio assumes annual rebalancing. All data except commodities represent total return for stated period. Past performance is not indicative of future returns. Data are as of 6/30/12, except for the CS/Tremont Equity Market Neutral Index, which reflects data through2/29/12. “10-yrs” returns represent annualized total return. These returns reflect the period from 1/1/02 – 12/31/11. Please see disclosure page at end for index definitions. *Market Neutral returns include estimates found in disclosures.Data are as of 6/30/12.

33
Managing your account

Account access
Is it easy to access your account?It couldn’t be easier.
1-858-551-4015Any business day
www.401k.com24 hours a day, 7 days a week
1-800-FIDELITY24 hours a day, 7 days a week
ONLINE

Account access
1-888-551-4015Any business day
WWW.401K.COM24 hours a day, 7 days a week
1-888-FIDELITY24 hours a day, 7 days a week
PHONE
Is it easy to access your account?It couldn’t be easier.

Account access
1-888-551-4015Any business day
WWW.401K.COM24 hours a day, 7 days a week
1-888-FIDELITY24 hours a day, 7 days a week
RBG ADVISOR
Is it easy to access your account?It couldn’t be easier.

Account changes
What account services are available?Just about every service you need is available online or by phone.
Change where your future contributions are invested
Change the amount you contribute from each paycheck
Change where your existing balance is invested
Account changes
Investment changes made after 4:00 p.m. Eastern Time, any business day,will be processed on the next business day.
A short-term trading fee may apply to certain exchanges. See fund prospectuses for details. Rebalancing does not guarantee a profit or prevent loss indeclining markets.
Change where your future contributions are invested
Change the amount you contribute from each paycheck
Change where your existing balance is invested
What account services are available?Just about every service you need is available online or by phone.

Account changes
Change where your future contributions are invested
Change the amount you contribute from each paycheck
Change where your existing balance is invested
Investment changes made after 4:00 p.m. Eastern Time, any business day,will be processed on the next business day.
A short-term trading fee may apply to certain exchanges. See fund prospectuses for details. Rebalancing does not guarantee a profit or prevent loss indeclining markets.
What account services are available?Just about every service you need is available online or by phone.

The next step
Next step
If you are already enrolled:
• Are you saving enough?
• Are you diversified?
• Monitor your strategy.
If you are not enrolled yet:
• Consider your goals
• Decide how much to contribute
• Choose your investments

Account Support
Online: www.401k.com24 hours a day, 7 days a week
Fidelity phone line: 1-800-FIDELITY
24 hours a day, 7 days a week
RBG advisor representatives: 1-858-551-4015Shawna Christiansen, Darren Burke, David Morehead or Larry Deatherage

Investors should carefully consider the investment objectives, risks, charges, and expenses of a fund before investing. For a prospectus, or a summary prospectus if available, containing this and other information about any fund, please call 1-888-FIDELITY. Please read the prospectus carefully before investing.
Securities offered through LPL Financial, member FINRA/SIPC. Investment advice offered through Independent Financial Partners (IFP) dba RBG Advisors, Inc., a registered investment advisor and separate entity from LPL Financial. Retirement Benefits Group is a Registered Trademark of Retirement Benefits Group, LLC, all rights reserved.