Capacity Needs Assessment of Partners on Practices of ...
84
Capacity Needs Assessment of Partners on Practices of Results Based Management and Monitoring & Evaluation in Sudan Final Report Khartoum, 27 July 2016
Transcript of Capacity Needs Assessment of Partners on Practices of ...

UNICEF-WFP Final Report of Capacity Needs Assessment Analysis of Partner’s Practices of RBM and M&E in Sudan 2015-2016
1
Capacity Needs Assessment of Partners
on Practices of Results Based
Management and Monitoring &
Evaluation in Sudan
Final Report
Khartoum, 27 July 2016

UNICEF-WFP Final Report of Capacity Needs Assessment Analysis of Partner’s Practices of RBM and M&E in Sudan 2015-2016
2
FOREWORD
The Government of Sudan, represented by the Ministry of International Cooperation (MOIC) and UNICEF Representative in Sudan, are pleased to endorse the final report of the Capacity Needs Assessment on Planning, Monitoring and Evaluation and Results-Based Management for all UNICEF/WFP Implementing Partners.
The assessment provides the Government, Local Authorities, Communities, UNICEF/WFP and Partners with sound and credible evidence for the development of adequate policies, strategies and appropriate programmes and partnerships that will ensure greater impact on RBM/M&E in Sudan. The main objective is to achieve the Sustainable Development Goals 2030 and National Development Agenda for Peace and Development.
Under the leadership of the Ministry of International Cooperation (MOIC) and UNICEF/WFP, a technical task force for the assessment was established and two consultants were recruited (one National Lead Consultant and one National Assistant Consultant). Their responsibilities included performing the design of the assessment methodology, the questionnaire, the field assessment and the reporting, benefiting from the timely technical guidance and logistical support of UNICEF and the Ministry at federal and state levels. We appreciate the technical support provided by the Central Bureau of Statistics regarding the field data collection, data entry and data processing. We are also grateful for the technical assistance provided by UNICEF Regional Office in Amman, regarding the quality assurance of the final report.
We would like to highlight the role played by All Sector Line Ministries, States, Local Authorities and a wide range of partnerships during the implementation of this assessment that took place from October 2015 through March 2016.
In light of the above, we encourage all policy makers, and development partners, academic institutions, and indeed the people of Sudan, to make effective use of this report to plan, monitor and evaluate relevant goals and objectives addressing the development and prosperity of all UNICEF/WFP projects in the country.
Signed on December 2016, by:
For the Government of Sudan
Mr.
Ministry of International Cooperation
For UNICEF
Mr. Abdullah Fadil
Representative of UNICEF

UNICEF-WFP Final Report of Capacity Needs Assessment Analysis of Partner’s Practices of RBM and M&E in Sudan 2015-2016
3
This Report is elaborated by;
Dr. Mervat Fuad Abdo
MD, Master of Community Health
National Consultant of the Capacity Need Assessment
Assisted by
Dr. Reem Abbas Ali
Pharmacist, Master in Health Economic
National Consultant for support in Data Collection and Data Analysis
Guidance for Design, Data Processing, Quality Assurance and Finalization of the
Report has been overseen by the Monitoring & Evaluation team of UNICEF, WFP and
CBS experts.

UNICEF-WFP Final Report of Capacity Needs Assessment Analysis of Partner’s Practices of RBM and M&E in Sudan 2015-2016
4
ACKNOWLEDGEMENT
I would like to acknowledge the great help and extreme flexibility of the UNICEF staff in general and the Chief of Planning, Monitoring and Evaluation, Mr. Robert Ndamobissi in particular. I would also like to give recognition to the patience and proactive role played by all the UNICEF heads of sections and their focal points as well as Mrs. Silindiwe Munhenga and Ms. Olga Basurmanova, who helped me in producing the comprehensive list of implementing partners. The assistance and support I received from the PME unit, namely Dr. Aala Mahmoud, Monitoring & Evaluation Specialist, through her technical inputs in the finalization of the report, should also be highlighted. I would like to extend a word of thanks to Mr. Elsiddig Abbaker and Mr. Habeeb Abdulmageed, for the operational support provided for the assignment. I am grateful for the valuable role played by the Ministry of International Cooperation (MoIC), the Ministry of Finance and Economic Development (MoFED) and the expert role and contribution of the Central Bureau of Statistics (CBS) in Sudan. Namely, Dr. Yassin Elhaj, Mr. Kamaleldin Ismail, Mr. Amin Daoud, Ms. Hala Issa, Mr. Hassan Murkaz and his data entry team and Ms. Habab Mustafa. They provided us with the data collection staff and followed up on all data collection, data entry and data processing. I am also very grateful to UNICEF partners who took part in the filling in of the questionnaire, although it was extremely extensive and time consuming. Their effort contributed to the improvement of the common understanding of strengths, weaknesses and gaps in capacities on strategic planning and managing of results for raising the standard of children’s well-being in Sudan. Special appreciation goes to the assistant consultant Dr. Reem Abbas Ali, who helped me extensively with the assignment.

UNICEF-WFP Final Report of Capacity Needs Assessment Analysis of Partner’s Practices of RBM and M&E in Sudan 2015-2016
5
TABLE OF CONTENTS
Pages
FOREWORD ........................................................................................................................................... 2
ACKNOWLEDGEMENT ........................................................................................................................... 4
Table of Contents .................................................................................................................................. 5
EXECUTIVE SUMMARY ........................................................................................................................ 10
INTRODUCTION ................................................................................................................................... 20
BACKGROUND ..................................................................................................................................... 20
1.1. PURPOSE AND OBJECTIVES .......................................................................................................... 22
1.1.1 Purpose ...................................................................................................................................... 22
1.1.2 Objectives................................................................................................................................... 22
1.2. METHODOLOGY ........................................................................................................................... 23
1. 2.1 Assessment Approach ............................................................................................................... 23
1.2.2. Desk Review .............................................................................................................................. 24
1.2.3. Quantitative methods ............................................................................................................... 24
CHAPTER 2: FINDINGS OF THE ASSESSMENT ...................................................................................... 26
2.1 General information on Implementing Partners ........................................................................... 26
2.1.1 Thematic and Geographical Coverage of Implementing Partners ............................................ 26
2.1.2 Infrastructure in monitoring and Evaluation ............................................................................. 28
2.2 Pillar 1- Leadership on Planning, RBM and M&E .......................................................................... 35
2.2.1 Existence of Planning document describing logical result chain ............................................... 35
2.2.2 Decision makers' level of commitment ..................................................................................... 38
2.2.3 RBM affecting management practices....................................................................................... 39
2.2.4 Level of IP’s collaboration with other actors ............................................................................. 41
Level of IP’s collaboration by state is illustrated by the table below: ................................................ 42
2.3. Pillar 2 - Monitoring & Evaluation ............................................................................................... 42
2.3.1 Policies, programmes and projects are subjected monitoring and evaluation ......................... 42
2.3.2 Utilization of Factual information to improve better development ......................................... 44
2.4. Pillar 3: Accountability, Reporting and Partners .......................................................................... 46
2.4.1 Good practices of alignment on national priorities ................................................................... 46
2.5 Pillar 4: Planning and Budgeting ................................................................................................... 48
2.6. Pillar 5: Measuring Results and Statistics .................................................................................... 59

UNICEF-WFP Final Report of Capacity Needs Assessment Analysis of Partner’s Practices of RBM and M&E in Sudan 2015-2016
6
2.7. Pillar 6: Update on recent key capacity development ................................................................. 63
2.8. Pillar 7: Reported weaknesses on RBM and M&E and priority solutions identified by the
partners ............................................................................................................................................... 66
2.8.1 Documented system to manage implementation of plans, and strategies .............................. 66
2.8.2 Achieving .................................................................................................................................... 67
2.8.3 M&E results for planning and decision-making ......................................................................... 68
2.8.4 Adequate human resources ....................................................................................................... 68
2.9. Pillar 8: Hunger Governance: ...................................................................................................... 69
2.9.1 Anti-hunger programmes and mandates .................................................................................. 69
CHAPTER 3: CONCLUSIONS AND RECOMMENDATIONS ..................................................................... 80
3.1: Lesson learned ............................................................................................................................. 80
3.2. RECOMMENDATIONS TO GOVERNMENT .................................................................................... 80
3.3 RECOMMENDATIONS TO PARTNERS ............................................................................................ 81
3.4 RECOMMENDATIONS TO UN AGENCIES ....................................................................................... 83
Annexes ............................................................................................................................................... 84
Annex I- TORs ...................................................................................................................................... 84
Annex II- Questionnaires ..................................................................................................................... 84
Annex III- List of implementing partners ............................................................................................. 84
Annex IV-Computation Tables............................................................................................................. 84

UNICEF-WFP Final Report of Capacity Needs Assessment Analysis of Partner’s Practices of RBM and M&E in Sudan 2015-2016
7
LIST OF ABBREVIATIONS
AAR Japan Association for Aid and Relief, Japan ACT/NCA Norwegian Church Aid ACT/UMCOR United Methodist Committee on Relief ADRA Adventist Development and Relief Agency AHFAD Ahfad University for Women Alag Alag Media Centre AOCD Al Amal Organization for Community Development AORD Alsalam Organization for Rehabilitation and Development APDHWO Anhar for Peace, Development and Humanitarian Work Organization ARC American Refugee Committee BCO Blady Charitable Organization CAFOD Catholic Agency for Overseas Development CBO Civil Society Organization CBS Central Bureau of Statistics CDF Community Development Fund CDO Cooperation for Development Organization CFCI Child Friendly Community Initiative CIS Care international Switzerland COOPI Cooperazione Internazionale CRS Catholic Relief Services CSO Civil Society Organization CW Concern worldwide International DDA Darussalam Development Association DDR Disarmament, Demobilization and Reintegration DG PHC Director General Primary Health Care DG Director General DRC Danish Relief Council DWSU Drinking Water & Sanitation Unit ECHO European Commission for Humanitarian Aid Office EHA Emergency Humanitarian Action EHI Emergency Humanitarian Interventions EiE Education in Emergencies EPI Expanded Programme on Immunization EMOP Emergency Operation ENVI Environmental Initiative Organization for Sustainable Development ESHP Environmental Sanitation & Hygiene Project FAO Food and Agriculture Organization FCDU Family and Child Development Unit FCPU Family and Child Protection Unit HPD Federal Health Promotion department FMOG Federal Ministry of Guidance FMoH/EHA Federal Ministry of Health-Directorate of Emergency and Humanitarian Action FMOH Federal Ministry of Health FMOI Federal Ministry of Information

UNICEF-WFP Final Report of Capacity Needs Assessment Analysis of Partner’s Practices of RBM and M&E in Sudan 2015-2016
8
FMOYS Federal Ministry of Youth & Sports FPDO Friends of Peace and Development Organization FRDN El- Fasher Rural Development Network GAH Global Aid Hand GRACE Gender and reproductive Health and Rights Resource Centre GOV Government HAD Humanitarian Aid Development Organization HAC Humanitarian Aid Commissioner HAI Help Age international HAI Human Appeal International HAO Hope Africa Organization HPP &CD Health Promotion and Protection Community Development IAS International Aid Services ICRC International Committee of the Red Cross IMC International Medical Corps IMCI Integrated Management of Childhood Illnesses INGO International Non-Governmental Organization IOM International Organization for Migration IRD International Relief and Development IRW Islamic Relief Worldwide IPs Implementing Partners JASMAR JASMAR human security organization JMCO Jabal Marra Charity Organization JICA Japan International Cooperation Agency JIV Japan International Volunteer Center KCCW Khartoum State Council for Child Welfare KPHF Kuwaiti Patients Helping Fund KSCS Kabkabiya Small Holders Charitable Society KYCCB Kalma Youth Committee for Capacity Building MCS Mercy Corps Scotland MDGs Millennium Development Goals MICS Multiple Indicators Cluster Survey M&E Monitoring and Evaluation MfDR Managing for Development Results MOE Ministry of Education MOSW Ministry Of Social Welfare NCA Norwegian Church Aid NGO Non-Governmental Organization NNGO National Non-Governmental Organization NIDO National Initiative Development Organization NMoH National Ministry of Health RBM Results Based Management SC State Council SDGs Sustainable Development Goals SMoE State Ministry of Education SRC Sudanese Red Crescent SSO Social security organization

UNICEF-WFP Final Report of Capacity Needs Assessment Analysis of Partner’s Practices of RBM and M&E in Sudan 2015-2016
9
TFPs Technical & Financial partners TORs Terms of Reference PME Planning, Monitoring and Evaluation PRRO Protracted Relief and Recovery Operation PWC Public Water Corporation UMCOR United Methodist Committee on Relief UN United Nations UNICEF United Nations International Children's Emergency Fund WASH Water, Sanitation and Hygiene WES Water Environment and Sanitation WVI World Vision International ZDPO Zulfa Development and Peace Organization

UNICEF-WFP Final Report of Capacity Needs Assessment Analysis of Partner’s Practices of RBM and M&E in Sudan 2015-2016
10
EXECUTIVE SUMMARY
This report presents main findings and recommendations from the Capacity Needs Assessment study of partners, focusing on Results-Based Management (RBM) and Monitoring and Evaluation (M&E) practices. The Assessment was undertaken between October 2015 and March 2016, as a collaboration between UNICEF, the Ministry of International Cooperation (MoIC) and the Central Bureau of Statistics (CBS) with support from WFP.
The purpose of the assessment is to have partners critically reflect upon their use and practices of RBM and M&E to enable planning and prioritization of interventions that address reported strengths and weaknesses of the RBM/M&E. A partners’ validation workshop was held on 3 August 2016, to review the assessment findings and recommendations and to develop an action plan that follows up on the same. Once RBM and M&E strengths and weaknesses are identified and validated through a participatory workshop, a capacity building plan will be developed and operationalized through alliances and partnerships, and outsourcing of credible institutions. Two approaches have been used for the data collection: i) a key informant interview questionnaire
“PART I” filled by the Program manager of the INGOs “International Non-Government Organization”
and NNGOs “National Non-Government Organization” and ii) a comprehensive questionnaire “PART
II” filled by the Directorate General of Planning, Monitoring at the Evaluation department in the
Government line ministries. These were conducted by the national consultant in order to record their
vision and expectations centered on RBM and M&E in Sudan.
In total, 346 UNICEF/WFP implementing partners (IPs) across Sudan’s 18 states have taken part in
filling in the questionnaire. Field data collection was conducted by 23 qualified
enumerators/statisticians of Sudan’s Central Bureau of Statistics (CBS) recruited in each state and
trained in Khartoum. Data entry, data processing and results have been generated by the Central
Bureau of Statistics.
This report is primarily organized into six pillars which mainly represent critical areas to explore and assess the partner’s practices in Planning, Managing and Accounting for results in humanitarian and development sectors. Two additional pillars were added to include VII (see below). Also included are the reported weaknesses on RBM and M&E and priority solutions identified by the partners and questions Related to Hunger Governance
I. Leadership/Commitment on Planning, RBM and M&E II. Monitoring & Evaluation
III. Accountability, Reporting and Partnership IV. Planning & Budgeting V. Measuring Results and Statistics
VI. Reported Recent Partner training activities in RBM and M&E VII. Reported weaknesses on RBM and M&E and priority solutions identified by the
partners VIII. Questions Related to Hunger Governance

UNICEF-WFP Final Report of Capacity Needs Assessment Analysis of Partner’s Practices of RBM and M&E in Sudan 2015-2016
11
The assessment considered of four categories defining different capacities of the implementing partners:
1. Awareness/Latent capacity 2. Exploration/Emergent capacity 3. Transition/Moderate capacity 4. Full implementation/Strong capacity
For the purpose of analysis and better identification of the need for capacity building, the two first categories have been compiled into one.
1. Awareness/Latent capacity/Exploration/Emergent capacity 2. Transition/Moderate capacity 3. Full implementation/Strong capacity
Definition: RBM is a management approach by which all actors, contribute directly or indirectly through their processes, products and services, to the achievement of desired results (outputs, outcomes and higher level goals or impact). The actors in turn use information and evidence on actual results to inform decision-making on the design, resourcing and delivery of programmes and activities as well as for accountability and reporting. Key findings of this assessment reveal the strengths and weaknesses in each of the pillars below:
Pillar 1: Leadership/Commitment on Planning, RBM and M&E: This pillar focuses on assessments of organizational leadership and management commitment to
results, including the implementation and the reinforcement of values of management for results
and management accountability.
In response to the question, “In your institution, what is the decision makers' level of commitment to
a management for the development of a results-based approach?” only 24 percent of respondents
reported that they have a strong commitment to results-focused development, 36 percent reported
that they are at a transitional level and 40 percent report they are at a Latent/emergent level.
Gezira, South Kordofan and West Kordofan states are still at the Latent/emergent level of Leadership
and commitment on RBM.
Pillar 2: Monitoring & Evaluation: Under this pillar, partners (Government, NGOs and INGOs) report on the extent to which they
monitor and evaluate policies, programmes and projects for accountability of development results,
generate lessons learnt, and implement evidence-based programming and policy advocacy.
In response to the following question: “Are policies, programmes and projects within your institution
subject to a regular and sustained monitoring and evaluation process that permits adjustments in
performance objectives?”, 33.8 percent of partners rate their practices as latent and emerging, 35
percent report their practices as being moderate and only 30.9 percent of partners report their
practices as strong. The majority of partners who classify their practices as Latent/emergent are

UNICEF-WFP Final Report of Capacity Needs Assessment Analysis of Partner’s Practices of RBM and M&E in Sudan 2015-2016
12
mostly observed in Gadarif state (75 percent). Regular monitoring and evaluation of policies,
programmes and projects is better established among international and national NGOs (average 39
percent) in comparison to the national institution (22.8 percent).
Pillar 3: Accountability, reporting and Partners: This pillar reports partners’ assessment of the extent to which they use independent auditors and
judicial institutions to control the use of resources and the transparency of reports shared with key
stakeholders.
Key summary findings are as follows:
The majority (60 percent) of partners have reported the full implementation and deployment
of independent Audit control of resources.
The full practice of free dissemination of report to public is respected by 46 percent of
partners, mostly by local INGO (51 percent) and Government Institutions (46 percent) than by
national NGO (41 percent).
Pillar 4: Planning and Budgeting: Under this pillar, partners rated the extent to which they apply results-based budgeting by checking
the level of budget allocation in comparison to the expected results of each department.
The findings revealed that only 36.8 percent of partners report having strong results-based budget
planning practices, 27.6 percent classify themselves as being in transition and 35.6 percent report
their practices as latent to emergent. A relatively high proportion of International NGOs report their
results-based budgeting practices (58.7 percent) as strong, compared with national NGOs (40.5
percent) and Government institutions (27.5 percent).
The majority of partners do not have a results-oriented framework in place: only 33.5 percent of all
surveyed partners reported having strong results-oriented frameworks in place, which includes 24.7
percent for Government institutions, 37.3 percent for national NGOs and 53.2 percent for
international NGOs.
The allocation of budget for monitoring and evaluation activity is very limited among UNICEF/WFP
partners; only 16 percent of full implementation. Investing on M&E activities is relatively higher
among international NGOs (28.3 percent) in comparison to national NGOs (19.2 percent) and
Government institutions (11 percent).
Pillar 5: Measuring Results and Statistics: The availability of statistics that enable adequate accountability in measuring achieved results
against institutions’ priorities represents a challenge: only 20 percent of surveyed partners report

UNICEF-WFP Final Report of Capacity Needs Assessment Analysis of Partner’s Practices of RBM and M&E in Sudan 2015-2016
13
they are fully capable of generating performance data on progress; 19 percent for Government
institution, 17 percent for national NGOs and 32 percent for international NGOs.
Performance monitoring and use of evidence for decision-making is still moderate among partners:
only 30.5 percent of partners adopt strong practices which includes 29.2 percent for Government
institutions, 30.4 percent for national NGOs and 36.2 percent for international NGOs.
Pillar 6: Reported recent partner training activities in RBM and M&E: The assessment offers an opportunity to measure trainings that staff from Government institutions
and NGOs recently benefitted from in relation to RBM and M&E:
The majority (68 percent) of surveyed partners reported that they never received training on
RBM, however, an important proportion of institutions have been trained on Monitoring and
Evaluation (63 percent) and the use of data and management (63 percent).
Pillar 7: Reported weaknesses on RBM and M&E and priority solutions identified by the partners: During the face-to-face completion of the questionnaire, partners were requested to summarize their top weaknesses related to RBM and M&E, and identify priorities to address these weaknesses. The summary findings are as follows:
Major weaknesses reported by IPs are in order of ranking: 1) 24% responded that their reporting is weak and mainly focused on activities not on impact 2) 22% indicated they have no trained staff to manage M&E/RBM 3) 20% indicated having no available costed M&E/RBM plan in their project documents 4) 15% indicated no available M&E/RBM unit in their institution 5) 11% said Other (capacities in doing analysis data , data collection, analysis and knowledge sharing) 6) 8% disclosed that all of the above weaknesses are applicable
Priorities capacity development actions reported by interviewed partners in order of ranking: 1) 19% needed training on RBM Analytical Reporting. 2) 18% needed training on Result-Based Planning and Budgeting. 3) 17% needed training on planning and programme development 4) 17% needed training on streamlining RBM/M&E with national strategic plan 5) 15% needed training on information dissemination/sharing 6) 15% needed training on development of field visits tools/checklists

UNICEF-WFP Final Report of Capacity Needs Assessment Analysis of Partner’s Practices of RBM and M&E in Sudan 2015-2016
14
Pillar 8: Hunger Governance: The findings of the self-reported assessment for all 346 partners (Government Counterparts and NGOs) using the specific questionnaire developed by WFP are as follows: The majority of IPs report they have an anti-hunger mandate and anti-hunger programmes
Most IPs indicated weak knowledge and exposure to social protection policies to improve the
health, nutrition, education, safety nets, etc., and accordingly need training on how to include such
policies within their mandate
The majority of IPs reported and drew upon good national/international practices such as
taking a lessons learned approach into account when designing their programmes
In response to the question: “if institution utilizes relevant outcomes such as changes in
hunger and poverty rates, employment and human capital outcomes”, findings reveal that the
majority of IPs are strongly utilizing relevant outcomes for programme planning
The international funding component is being followed up, reported on and liquidated
properly in reports, strongly to moderately
The extent of availability of rules governing financial management is within the moderate to
strong capacity level.
As for measuring impact, it is clear that the majority of IPs are at the moderate level
Funding stability is a major gap area since 50 percent answered they have sustainable funding
and the remaining 50 percent said they do not have sustainable funding. As a result, there is a dire
need to address the issue by training IPs on resources mobilization, sustainability functions and the
best ways to use resources rationally
Conclusion and Recommendations
Since the late 1990s, the development community – the donors and recipients of development assistance – has intensified efforts to achieve development results. A remarkable degree of consensus has been reached about the results being sought, and about how and by whom they should be defined. The factors that have contributed to this convergence include the international community’s commitment through the universal engagement of the UN General assembly (MDG 2000) and the SDG 2030. The transformative agenda of the Sustainable Development Goals (SDGs) 2030 adopted by all countries in September 2015 including Sudan, has clearly highlighted the universal commitment to enable the prosperity of all countries without leaving behind vulnerable people like children and women. The aim is to also ensure a strong culture of accountability of all Government and partners for Results through adequate participatory and effective results-focused planning, budget allocation/expenditures and measuring progress using accurate data and reporting. This Capacity Need Assessment on RBM/M&E, completed with technical and financial support from UNICEF and WFP, aims to assist Sudan in meeting the following two SDG 2030 related to capacity building:

UNICEF-WFP Final Report of Capacity Needs Assessment Analysis of Partner’s Practices of RBM and M&E in Sudan 2015-2016
15
SDG 17.9: “Enhance international support for implementing effective and targeted capacity-building in developing countries to support national plans to implement all the sustainable development goals, including through North-South, South-South and triangular cooperation”.
SDG 17.19: “By 2030, build on existing initiatives to develop measurements of progress on sustainable development that complement gross domestic product, and support statistical capacity-building in developing countries”. In conclusion, it is hoped that the findings of this partner self-assessment will provide a basis for actions that build upon identified strengths and prioritize solutions to address weaknesses in order to foster a results-based management culture. a) Key reported strengths are:
The good practice of strategic planning at a national level is exhibited through: The five year National Strategic Plan 2012-2016, Economic Policy and Sector Strategic Plans of Health and Education and Interim PRSP 2014-2015 aligned to national priorities
Good practice of decentralization exhibited at state levels in budget planning and fiscal revenue
Strong planning practices shown by the existing Departments of Planning within all Line Ministries at federal and state levels
Existing capacity for Statistics through current direction of CBS at federal and state level and the Management Information System within each line Ministry
Strong NGOs accountability practices in relation to timely results reporting
Independent audit is usually conducted to control use of resources
Organization of annual reviews of programme and projects implemented by UN agencies co-led by Government Ministries. b) Key reported weaknesses are: Policy formulation (at federal level), work planning and budgeting (at sectoral and state levels) undertaken as separate exercises, with a proliferation of different funding arrangements. Officials are also burdened with a large volume of activity-focused reporting but have little systematic information about the effectiveness of actual deliverables. The Capacity Needs Assessment of IPs points to a fragmented use of M&E with multiple government, NGOs, CBOs, and donor/s planning and/or progress reporting formats that do not generate data to effectively manage results. This speaks to the need to review existing data generation systems vis-à-vis programme, project and management objectives and monitoring requirements. The reporting formats being used by different institutions cannot generate the needed data to guide good governance and decision-making since it is reporting on activities and is not results-based, thus cannot be used for decision-making or improvement of the work, or even drawing funding from potential donors.

UNICEF-WFP Final Report of Capacity Needs Assessment Analysis of Partner’s Practices of RBM and M&E in Sudan 2015-2016
16
Key reported weaknesses are summarized as follows:
On results-based budgeting: Results-based planning and budgeting represent management practices that should be strengthened to ensure adequate public financial management. At state level, there is a need to enhance the multi-sector strategic plans based on in-depth situation analysis which could serve a coordination platform of all investments.
From reporting on activities to reporting on outcomes and impact. The lack of capacity and weak culture of high quality results-oriented reporting and accountability of the Government Assembly by each key Line Ministries or States. The partners self-assessment of their reporting practices point to the need to address the quality of reporting to increasingly focus on outcome and impact level results and less on implementation of activities and budget expenditures, as it is currently done.
Aligning data generated through monitoring with programme objectives and reporting requirements. Main causes reported by partners regarding the gap of practices of quality results-focused reporting are: i) the absence of proper results-focused reporting format, institutional performance monitoring system and tools, ii) the fact that staff did not receive adequate training on reporting or the lack of knowledge amongst the senior management about the importance of reporting and its uses in decision-making, resource mobilization, etc.
On annual performance reporting: The absence of systematic annual performance monitoring/reporting of a national commitment under the government directive and sectors commitments and utilization of evidence/data to demonstrate progress or shortfalls for decision-making among partners.The lack of ability to report effectively on the most updated data coming from surveys to inform decision makers. Additionally, a weak report means that the generated report cannot be used to recommend amendments to the work plan and thus improve future implementation taking lessons learned into consideration.
On RBM and M&E training needs.: Among IPs, 68 percent of Government counterparts and NGOs reported that they have never been trained on RBM or results-based budget planning. The staff did not receive training on RBM.
On transparency: The lack of free transparency dissemination of the progress of achieved results reports and this is also linked with unavailability of integrated Monitoring system”.
On M&E Knowledge and skills: IPs reported having limited knowledge of M&E system components and they expressed an insecurity about how to effectively work with M&E.
On M&E budgetary limitations: The limited annual budget allocation and use for M&E activities; the budget for monitoring activities (a separate budget for specific Monitoring of the activities) was not incorporated in the initial plan, and even if it was present was not adequate to meet all the needs and demands required by the M&E plan/activities.

UNICEF-WFP Final Report of Capacity Needs Assessment Analysis of Partner’s Practices of RBM and M&E in Sudan 2015-2016
17
The non-availability of routine statistical information from Sector Line Ministry MIS (management Information System) that leads to partners weakened ability to perform multivariate secondary data statistical analysis of nationwide Household surveys.
Consistent use of Evaluation: There is a need to increase foster management practices where evaluations are budgeted for, planned and implemented in relation to key national policies, strategies, programmes and projects.
On national planning for and commitment to M&E: The absence of a National Strategic Capacity Building Plan for RBM and M&R (for both Federal and state level), that can stand against the turnover of the staff and the new emerging issue, namely the RBM as a new approach. As can also be seen, there is no planning, M&E or RBM approach infrastructure. The Ministry of Finances and National Economy, MOIC and UNICEF, recognize the importance of addressing the reported weaknesses with a view to establish a results-oriented culture among partners for effective delivery of products and of services and ultimately, the improvement of the lives of vulnerable populations in Sudan. Ongoing Initiatives have included the introduction of “output-oriented budgeting”, and “results-oriented management” thus leading to the improvement of the accountability for results and value for money for UNICEF/WFP Implementing partners. However, these initiatives have often been approached from the perspective of narrow departmental responsibilities.

UNICEF-WFP Final Report of Capacity Needs Assessment Analysis of Partner’s Practices of RBM and M&E in Sudan 2015-2016
18
Recommendations
Based on the evidence generated by this Capacity Gap Assessment, the following recommendations have been formulated for discussions and actions:
Recommendation to Government 1. The Government should develop and establish a national policy, create an institutional
structure of Evaluation in Sudan. For example, the creation of General Direction of Evaluation at the
Ministry of Finances for adequate accountability for PRSP, Strategic Plans, Programme and project.
2. Develop one comprehensive integrated National Monitoring and Evaluation capacity building plan, and pool all resources in one place for an integrated implementation. 3. Consider M&E staff development as a strategic investment: The management for results is based on change which requests practitioners of RBM/M&E who will act as “Change Agents” to have unique skills, competencies and proper orientation on management and monitoring for results 4. Equip leaders /Managers with knowledge and tools to manage for results and own their results: putting in place systematic mechanisms and a more effective leadership and management training strategy is critical to ensure that managers and officers are better equipped to provide results driven leadership, own their results and help ensure long‐term performance sustainability. 5. Strengthen capacity, systems and mechanisms to report against high level of results (outcomes and impact) within sectoral line ministries accountabilities: to support the strategic investment in the culture of accountability for result is crucial for the development of good governance and achieving SDGs 2030. The RBM/M&E training provided should not be viewed as a final stage but rather as a first step toward the development of senior government and NGOs/CBOs officials and other staff responsibilities in RBM and M&E of programmes and projects. Recommendations to Partners: 6. The Government, UN agencies, NGOs and other partners in development should establish a partnership to support development and implementation of an action plan that sets out to strengthen results-based planning and reporting practices and to strengthen accountability to achieve SDG 17.9 and 17.19. 7. Government and NGOs, CBOs, etc., should establish a systematic sector planning and performance monitoring system including an adequate results reporting format for regular and annual progress reporting against results. 8. Government and other partners should establish M&E Units within their institutions which should have an adequate and specific budget for M&E. 9. A new Direction of RBM/M&E should be established within the new Ministry of International Cooperation that will coordinate effectively with the National Council of Population
UNICEF-WFP Final Report of Capacity Needs Assessment Analysis of Partner’s Practices of RBM and M&E in Sudan 2015-2016
19
and NCCW, the monitoring and reporting of SDG and the performance monitoring of UN cooperation. Recommendations to UN agencies and funding partners: 10. UN agencies should in the short term, organize comprehensive workshop trainings on results-based management to all of their Government counterparts and NGOs at federal and state levels (both humanitarian and development partners); the establishment of a systematic reporting template for results-based monitoring is required 11. UNDP and WB and partners should organize training of Government counterparts and NGOs on results-based budget planning and public financial management 12. Funding Partners and UN agencies are recommended to provide joint technical and financial support for capacity development on Monitoring and Evaluation, and the operationalization by Government of systematic sector coordination mechanisms; Joint efforts should assist the Ministry of International Cooperation to develop an adequate results-focused report format that will be implemented by all Line Ministries and States and to ensure the high quality reporting for results using sound evidence (to stop the current practices of activity-based reporting); 13. Partners in development/UN agencies should provide technical and financial support to the Central Bureau of Statistics in establishing a sector coordination platform for statistics co-lead by CBS and one Donor around the national strategy of development of Statistics in Sudan: a multiyear and annual operational plan of key national Household Surveys, Statistical activities must be developed and monthly meetings of all donors in support to Statistics are required to be organized. 14. A Joint partnership of UNFPA, UNICEF, WFP and UNDP and partners, should be established in order to ensure the funding of bursaries for the Master Diploma training of Students in Demography and Statistics for the CBS and Sector MIS in strengthening capacity for the monitoring of SDG, PRSP and sector Strategic Plan. The availability of a critical mass of experts on Demography and Statistics is important for the preparation of the forthcoming National Population Census 2018, MICS 2019, Food Vulnerability Assessment and the enhancing of availability of the annual statistical MIS report. Support for capacity building related to secondary data analysis of a national household survey, will be very useful to generate sound evidence on main issues of children and vulnerable populations. 15. A national network on sharing best practices and knowledge of M&E and the use of data for strategic planning and decision-making should be established and co-lead by one national NGO, the Ministry of International Cooperation and the CBS, that will contribute in building the culture of evaluation and accountability for results.

UNICEF-WFP Final Report of Capacity Needs Assessment Analysis of Partner’s Practices of RBM and M&E in Sudan 2015-2016
20
INTRODUCTION
BACKGROUND
UNICEF and WFP have been working closely with the Government, Local Authorities, Communities, Donors, UN agencies, NGOs, Civil Society Organizations and Academic Institutions in Sudan, for many years in order to contribute to the improvement of children’s well-being. Focus issues include child survival, learning, development and protection in the perspectives of Sustainable Development and achieving children’s rights, food security and hunger management. In November 2014, the Government of Sudan together with UNICEF, completed the Joint Mid-Term Review for the Country Programme of Cooperation 2013-2016. It was decided in consensus and based on lessons learnt of progress made and bottlenecks analysis, to make programmatic shifts to ensure business is carried out differently in a way that will focus on vulnerable children and the most deprived communities within the decentralization. It was also decided to strengthen evidence-based data generation for adequate advocacy targeting and promoting results-based planning and management for better value for money regarding children at federal, state and locality levels.
UNICEF Sudan Country Office is prioritizing capacity strengthening of governmental as well as non-governmental partners in results-oriented planning and managing for results and country-led M&E for better fulfillment and realization of the basic rights of children. This falls in line with the Paris Declaration principles on aid effectiveness and UNICEF’s principles on partnerships regarding the co-responsibility and accountability for better development results and sustainability.
The Secretary General of the United Nations, alongside Governments and Partners, have declared 2015 as the year for promoting Evaluation, aimed at stronger accountability for results and accelerating the global agenda of a world free of poverty, free of hunger/malnutrition and inequality, and so forth.
Results-Based Management (RBM) has been introduced into the United Nations since 1998. The purpose of the RBM approach is to shift managerial and administrative emphasis from a process

UNICEF-WFP Final Report of Capacity Needs Assessment Analysis of Partner’s Practices of RBM and M&E in Sudan 2015-2016
21
Involving an activity-focused approach, to the stronger results-focused method on planning, management, performance monitoring and accountability.
The growing demand of Monitoring and Evaluation is the result of its utmost importance in putting in place systems necessary for augmenting management and ensuring accountability. Monitoring and Evaluation is about the systematic tracking of progress and performance of programs/projects through regular data collection, analysis and reporting and making objective judgments of merit and lessons learnt for appropriate decision-making. There are key steps to be followed for establishing a results-based M&E system starting from conduct of readiness assessment to sustainability of the system within the organization. These steps are inter-dependent and complementary to each other.
M&E, which is an integral part of Results-Based Management, focuses on data and risk-informed planning, with effective programs’ management. M&E is also necessary for the achievement of evidence-based policy advocacy and decision-making, budget allocation and accountability, hence paving the way for good governance.
Political commitment is key to a successful M&E system because it confirms the availability of human and financial resources to implement the planned interventions. Creating demand for information use by all partners, politicians, decision makers and parliamentarians, is another important incentive for sustaining the M&E system. The bottom-line yardstick of success is the extent to which the M&E information is being used to improve government performance, and the system is valuable only if it is fully utilized.
The Government of Sudan, has developed the National Strategic Plan 2012-2016, which guides all sectors’ strategic planning and investments. Annually, the Government and Donors elaborate the Strategic Responses Plan for Humanitarian Preparedness and Responses, which includes the strengthening of Coordination and M&E.
Currently, the Government is in the process of developing the new full Poverty Reduction Strategic Paper (PRSP 2016-2021). This will act as the national development framework for leveraging national and external investment and strengthening coordination of partnerships for sustainable economic growth and reduction of poverty. The Ministry of International Cooperation and Ministry of Finances and National Economy, through the Directorate of Strategic Aid Coordination, are willing to promote and build national capacities on Monitoring and Evaluation for more accountability of results at all levels.
The findings of this assessment will inform Government, state authorities, UNICEF, WFP, UN agencies, donors, CSO and implementing partners, about the gap of capacities in results-based management and M&E, and will provide strategic and operational recommendations that will help in prioritizing the plan of action form capacity development.
The report has been structured under three chapters; the first chapter presents the purpose, objectives and methodology of the assessment, the second chapter identifies the findings and the last chapter outlines the conclusions and recommendations.

UNICEF-WFP Final Report of Capacity Needs Assessment Analysis of Partner’s Practices of RBM and M&E in Sudan 2015-2016
22
CHAPTER 1: PURPOSE, OBJECTIVES AND METHODOLOGY
1.1. PURPOSE AND OBJECTIVES
1.1.1 Purpose
The purpose of this assessment is to: I) generate evidence on the level of demand and supply for Results-Based Management (RBM) and Monitoring and Evaluation (M&E) by identifying existing capacities and gaps of capacities within different line ministries and NGOs (International and National NGOs) of Social Sectors at federal and state level and ii) determine the appropriate required strengthening skills and systems for improving the situation of children in Sudan.
The findings and recommendations of this independent assessment will be used by the Government (Ministry of International Cooperation and Investment, Ministry of Finance and National Economy and other Line Ministries), Donors, UN agencies, UNICEF/WFP and partners. The information will be utilized to develop and operationalize adequate capacity building plans for enhancing the RBM and M&E practices and the promotion of evaluation policy and strategy in Sudan. Once the final report is submitted, the Ministry of International Cooperation with assistance from the Ministry of Finance and Economic Planning, are recommended to organize a workshop for a presentation and debate on the findings and proposed recommendations. The next step should be the development of a costed Programme Plan of Action for capacity building on RBM and M&E for the UNICEF/WFP partners. The plan would then be elaborated by the Ministry of International Cooperation and the Ministry of Finance and Economic Planning, in partnership with UN agencies, while multilateral and bilateral donors will be leveraged for building synergies and complementary roles. UNICEF and WFP, in partnership will ensure immediate outsourcing for the training of partners on RBM and M&E in all 18 States and at the federal level; UNICEF and WFP in partnership, will also continue to support the strengthening of sectors’ line ministries information management system for regular availability of data; Based on lessons learnt, policy advocacy will be made towards the Government of Sudan for the appropriate institutionalization of systematic and regular accountability for results and independent evaluation of national policies, strategies and programmes as part of the PRSP and Aid Coordination Strategy; support to the development of a national policy of evaluation will be promoted.
1.1.2 Objectives
This independent assessment will: 1. Determine the existing demand for Planning, Monitoring and Evaluation (M&E) and Results-Based Management (RBM) in Sudan 2. Determine existing good practices and capacities in Planning, RBM and M&E within Sudan, to be capitalized on

UNICEF-WFP Final Report of Capacity Needs Assessment Analysis of Partner’s Practices of RBM and M&E in Sudan 2015-2016
23
3. Identify the gaps in skills and capacities and the needs for capacity building in all of the above mentioned areas including M&E 4. Identify key bottlenecks of effective Management Information Systems of Line Ministries 5. Recommend adequate strategies and priority focus areas and key capacity building actions that will serve as a basis to elaborate a national operational plan of action for strengthening Planning, RBM and M&E at federal and state levels, with the support of all humanitarian and development partners.
1.2. METHODOLOGY
1. 2.1 Assessment Approach
This report presents major findings and recommendations of the Planning, M&E and RBM Capacity Gap Assessment completed by UNICEF, during the period October 14th 2015 through March 23rd 2016.
Identifying the implementing partners: A comprehensive list of partners (available in Annex III) was developed after the list of partners from all the UNICEF sections (WASH, Health/HIV, Nutrition, Child protection, Education) and WFP, was obtained. It was realized that the WFP partners are the same as UNICEF partners with the exception of the Ministry of Agriculture. The final list of partners was endorsed in the beginning of January 2016. Identifying and Training data collectors: It was decided that since this was a national assessment covering all 18 states as well as the Federal level, to make use of the Central Bureau of Statistics (CBS) staff. A total of 23 high caliber CBS data collectors/staff were selected - one for each state and 3 for Khartoum, since Khartoum had a higher number of IPs as well as having the federal component. A two-day training workshop was held on the 9th and 10th of December 2015, to guide the CBS data collectors on how to complete the questionnaire and conduct the interview sections of the exercise. The workshop was attended by UNICEF, WFP and CBS representatives. After the training, a questionnaire testing was carried out in the field and accordingly, further editing and fine tuning was completed. The final questionnaire was then finalized and endorsed by all stakeholders on the 13th of January 2016. After final questionnaire endorsement and after each data collector received his/her quota of the questionnaire at their states together with the list of partners they are supposed to reach. Before the actual data collection started, additional over the phone training was performed for each data collector, thus ensuring they knew exactly how to answer each question and how to overcome any difficulty that might arise. The consultants were on the phone with data collection CBS staff 24/7 all through the data collection period. Actual data collection: Data was collected through face to face Interviews and the questionnaire filled by trained, Central Bureau of Statistics (CBS) staff. Out of a total of 439 Implementing partners, of which 216 were

UNICEF-WFP Final Report of Capacity Needs Assessment Analysis of Partner’s Practices of RBM and M&E in Sudan 2015-2016
24
Governmental and 184 were other categories (NGOs both International and National), UN agencies and others identified as implementing partners; 346 have actually been reached and completed the questionnaires/Interviews.
The number of partners that responded was less than the actual number in the list due to many reasons and challenges as stated below. For National NGOs, International NGOs, CSO & CBOs
IP was no longer active
IP changed its Organizational Name or address and thus was not found anymore
IP did not respond due to several issues such as not getting the superiors approval, or thinking they do not need to be part of this capacity development
IPs' locations were far out of reach in very remote locations
Governmantal IPs
The name of some ministries changed from state to another especially with regards to the Ministry of Social Development and Youth and Sports.
Identifying the IPs location or address was considered the biggest challenge for the data collectors and it led to delays in the data collection.
Some governemental bodies at state level refused to give any information unless instructed to do so by their federal level body.
1.2.2. Desk Review
The consultant interviewed the heads of sections at the UNICEF country office and reviewed IPs reporting samples.
It was unanimously agreed that the IPs reporting is very weak and not standardized. For example, in some sections there was a reporting template that was in the project document but the data collected from it was activity and budget-oriented. All sections stated that the reporting was not usually on time and it was not of very good quality.
The heads of sections stated that each NNGO was affiliated to an INGO to mentor, guide and train, however, this was not the case for the governmental IPs although they are the majority of IPs in all fields of work.
1.2.3. Quantitative methods
A two-side approach was used for this assignment based on the results of fill in questionnaires and interviews with relevant Implementing Partners/stakeholders.
Questionnaire development:
A comprehensive questionnaire has been developed based on World Bank tools for assessment of capacities of M&E and RBM. Additional consideration was taken from Canadian tools for management for results from the Canadian International Development Agency (CIDA).
The draft of the questionnaire has been sent to UNICEF Head of Planning, Monitoring and Evaluation (PME) section as well as WFP, the line ministries (Ministry of International Cooperation and Ministry of Finance and Economic Planning) and the Central Bureau of statistics for review and endorsement. It was also shared with UNICEF Regional office for technical review and clearance.

UNICEF-WFP Final Report of Capacity Needs Assessment Analysis of Partner’s Practices of RBM and M&E in Sudan 2015-2016
25
The World Food Program has introduced additional modules related to weaknesses on RBM and M&E and priority solutions identified by the partners and assessment of planning for Hunger Governance.
After endorsement, all comments were addressed and the questionnaire was properly coded for data entry and processing by the main national consultant and the CBS, on the 10th of January 2016.
The Questionnaire (Section I) targets the Planning/M&E departments thus attaining from the technical point of view what the Implementing Partners/stakeholders actually need to know and strengthen with regards to Planning, M&E & RBM.
Key informant interview
The Interview (section II) targets administrative and managerial personnel (Director General of Line Ministries or General Managers of NGOs, others) point of view, thus addressing what the Implementing Partners/stakeholders think they need to know and strengthen with regards to Planning, M&E & RBM.
Data Analysis: The analysis of the pillars focuses on measuring the practice of Government, NGOs and INGOs as they make the transition from Awareness to effective Managing for Results. This approach is a departure from the conventional capability models and will provide evidence of collaborative efforts adopted by UNICEF’s partners to improve the practices of RBM (Continuous improvement by learning). Quantitative measurement has been performed in addition to qualitative comments shared by NGOs.
Using Results to Manage
Commitment to Results
Results based
Strategic Planning
Operational/Business Planning
Measuring Results
Reporting o
n
Results
f
Data processing was performed by the CBS, while data analysis was performed by the national consultant for UNICEF Planning & Monitoring Unit. The data was analyzed for the whole of Sudan, as well as for each state separately. Categorization was done in some instances by type of IP and in some instances by state.

UNICEF-WFP Final Report of Capacity Needs Assessment Analysis of Partner’s Practices of RBM and M&E in Sudan 2015-2016
26
CHAPTER 2: FINDINGS OF THE ASSESSMENT
2.1 General information on Implementing Partners
2.1.1 Thematic and Geographical Coverage of Implementing Partners
The UNICEF and WFP Sudan partnership with Governmental bodies, National and International Organizations (NNGOs & INGOs) as well as Civil Society Organizations (CBOs), is one of the key strategies implemented by UNICEF/WFP to build national systems and capacities to deliver services to children and women. In total, 346 implementing partners have completed the assessment, out of which 174 were Government bodies, 125 National NGOs and 47 International NGOs. The numbers and geographical information related to UNICEF/WFP Sudan current Partners, who filled the questionnaire/interview is summarized in the following Charts: Since the selected IPs were derived from UNICEF sections and WFP, it was understandable that 80 percent of the IPs who responded to the questionnaire said that they are currently or were at a recent point in time in partnership with UNICEF & WFP. The geographical distribution of Implementing Partners presented below (Figure 1) reveals that most of the focus of UNICEF and WFP interventions is in conflict affected areas for humanitarian response, and in the eastern poorest part of the country to address poverty, hunger and climate change: the partnership is mostly in Darfur states (42 percent) followed by Kordofan states (21 percent), then Khartoum state (7 percent), and Kassala states (7 percent). Figure 1: Percentage of implementing Partners who completed the questionnaire of the assessment per state

UNICEF-WFP Final Report of Capacity Needs Assessment Analysis of Partner’s Practices of RBM and M&E in Sudan 2015-2016
27
Based on the information provided by the 346 respondents to the questionnaire, it appears that the
health sector has the highest number of staff at 6,344 (32 percent), followed by nutrition at 2,823
(14 percent), WASH at 2,529 (13 percent), Education at 2,505 (13 percent), food security at 2,432 (12
percent), Child protection at 2,028 (10 percent) and HIV/AIDS 947 (5 percent).
The chart below shows under which thematic area and for how many staff to tailor the National
Capacity Building Plan.
Figure 2: Percentage of IP Staff by thematic area of work
Analysis of Geographical coverage of implementation of UNICEF/WFP partners reveals that 70 percent of the Implementing Partners have a very large geographical coverage (full state), only 10 percent of IPs (small NGOs) have limited coverage to the locality level, and 20 percent of IPs have a nationwide coverage. Figure 3: Geographical Area of work (Federal, State, and/or Locality) of IP
10%
70%
20%
Federal
State
Locality

UNICEF-WFP Final Report of Capacity Needs Assessment Analysis of Partner’s Practices of RBM and M&E in Sudan 2015-2016
28
2.1.2 Infrastructure in monitoring and Evaluation
a) Existence of M&E unit
Although during the interview most of the Implementing Partners mentioned they do not have the full understanding of the concept of monitoring for results, the assessment findings on existence of M&E unit revealed that 72 percent of IPs have M&E units and dedicated staff. However, 28 percent of the partners do not have a separate section/unit for Monitoring and Evaluation and the requested technical staff for direct and exclusive responsibility to follow-up and monitor for results. This finding is supporting the approach of investment in the already existing M&E systems to raise the institutional capacities for better M&E and RBM functions.
Figure 4 a below, shows the results of the existence of a separate M&E unit and dedicated staff for Monitoring of programs and projects activities.
Figure 4 a: Existence of M&E unit
The Government bodies have the highest availability of M&E unit (76 percent) in comparison to National NGOs (71 percent) and international NGOs (62 percent). This is a promising situation since it means that key elements for development of strong M&E systems are already in place.
It appears that INGOs have less dedicated separate M&E units.
Figure 4 b: Existence of M&E unit by IP

UNICEF-WFP Final Report of Capacity Needs Assessment Analysis of Partner’s Practices of RBM and M&E in Sudan 2015-2016
29
The Largest percentages of IPs reporting not having a separate M&E unit and dedicated staff, was in East Darfur (47 percent), West Kordofan and Gezira state (44 percent).
b) Existence of dedicated M&E staff
In General, among the 346 IPs interviewed there are at least 3 dedicated staff for M&E Functions. The Government bodies have the highest average number of dedicated staff working in Monitoring and Evaluation (4.2) followed by National NGOs (2.3) and International NGOs (2.0). Figure 4c: Average Number of M&E dedicated staff by category of IP
INGOs
NNGOs
Sudan
Government Bodies
2.0
2.3
3.2
4.2
Average Number of M&E dedicated staff by category of IP

UNICEF-WFP Final Report of Capacity Needs Assessment Analysis of Partner’s Practices of RBM and M&E in Sudan 2015-2016
30
The highest average number of M&E dedicated staff is observed in Gadarif state (9.2), North Darfur
(4.8), White Nile (4).
c) Programmes/project evaluation during the past 5 years and performed humanitarian needs assessment
Implementation of evaluations and assessments is crucial because it acts as a tool for corrective measures and making sure that the program or the project is on track. In both (programmes/project evaluation and humanitarian), a significant amount of effort is still needed to make sure the requested capacity will be available for this key intervention of assessing and evaluating the programs and the projects. 45 percent of IPs have reported that they always conduct an evaluation of their programs or projects and 23 percent frequently. However, 22 percent of IPs did not undertake it frequently and 11 percent never conduct an evaluation.
Regarding the practice of need assessment for humanitarian action, 38 percent of IPs have reported that they always conduct an evaluation of their programs or projects and 27 percent reported frequently. However, 22 percent of IPs did not undertake it frequently and 13 percent never conduct an evaluation

UNICEF-WFP Final Report of Capacity Needs Assessment Analysis of Partner’s Practices of RBM and M&E in Sudan 2015-2016
31
Figure 6.1: Programmes/project evaluation during the past 5 years and performed humanitarian needs assessment:
Figure 6.1a below, shows the percentage of IPs which never conducted evaluation activities per state. In Sinnar state, 50 percent of the IPs mentioned that they never implement or are involved in any evaluation activities, followed by Gezira (33 percent) and White Nile (31 percent). However, there are some states that have good practice in evaluation of the programme and projects: River Nile (91 percent), West Darfur (89 percent) and Northern (78 percent).
Figure 6.1a below shows the percentage of IPs who never implement Evaluation activities Table 2 shows the Percentages of frequency of implementing evaluations within the last 5 years, in each state. Percentages in this table will help in understanding frequency of this implementation per state.

UNICEF-WFP Final Report of Capacity Needs Assessment Analysis of Partner’s Practices of RBM and M&E in Sudan 2015-2016
32
Table 2 Percentages of frequency of implementing Evaluations, by each state.
Total Always Frequently Not frequently Never
Total 45% 23% 22% 11%
Northern 78% 11% 0% 11%
River Nile 91% 0% 0% 9%
Red Sea 21% 29% 43% 7%
Kassala 52% 17% 30% 0%
Gadarif 27% 27% 27% 18%
Khartoum 39% 32% 19% 10%
Gezira 22% 11% 33% 33%
White Nile 54% 15% 0% 31%
Sinnar 13% 38% 0% 50%
Blue Nile 33% 33% 33% 0%
North Kordofan 43% 24% 29% 5%
South Kordofan 46% 25% 18% 11%
West Kordofan 17% 11% 50% 22%
North Darfur 34% 31% 31% 3%
West Darfur 89% 4% 7% 0%
South Darfur 55% 21% 17% 7%
Central Darfur 35% 40% 10% 15%
East Darfur 29% 21% 29% 21%
Implementation of Humanitarian need assessment is also assessed in this exercise. Of the UNICEF/WFP implementing partners, 13 percent mentioned that they never implement Humanitarian need assessment. Having looked at the table below, we realized that West Darfur and River Nile is where the highest implementation was reported. Table 3: Percentages of frequency of implementing Humanitarian need assessment, by state
Total Always Frequently Not frequently Never
Sudan 38% 27% 22% 13%
Northern 44% 44% 11% 0%
River Nile 89% 0% 0% 11%
Red Sea 21% 36% 36% 7%
Kassala 48% 30% 17% 4%
Gadarif 33% 33% 8% 25%
Khartoum 29% 19% 19% 32%
Gezira 33% 11% 11% 44%
White Nile 23% 31% 15% 31%

UNICEF-WFP Final Report of Capacity Needs Assessment Analysis of Partner’s Practices of RBM and M&E in Sudan 2015-2016
33
Total Always Frequently Not frequently Never
Sinnar 0% 25% 25% 50%
Blue Nile 48% 14% 33% 5%
North Kordofan 29% 38% 14% 19%
South Kordofan 39% 21% 29% 11%
West Kordofan 22% 22% 50% 6%
North Darfur 28% 34% 31% 6%
West Darfur 89% 4% 4% 4%
South Darfur 24% 38% 28% 10%
Central Darfur 40% 35% 20% 5%
East Darfur 36% 43% 14% 7%
c) Weaknesses reported by IPs in regard to RBM and M&E
The Graph below illustrates the critical weaknesses in the practice of RBM and M&E reported by IPs.
The majority of the IPs stated that Reporting is weak and not focused on impact but only on activities
(24 percent); followed by weakness in capacities and trained staff on RBM (22 percent), availability
of costed plan (20 percent), and availability of section to follow on the M&E/RBM (15 percent). The
11 percent (other) weaknesses vary from capacities in doing analysis, data collection to analysis and
knowledge sharing.
Figure 5: Weaknesses of M&E/RBM
The second and third highest weaknesses reported by IPs are the lack of trained staff to manage
M&E/RBM and availability of costed plan for M&E/RBM. These two main weaknesses cannot be
treated and addressed strategically unless the country has a National Capacity Building Plan, which
outlines specific country requirements for results-based monitoring. having this plan will ensure that
all the resources will be in one place and all the investment, effort and resources will be used in the
most efficient and effective manner.

UNICEF-WFP Final Report of Capacity Needs Assessment Analysis of Partner’s Practices of RBM and M&E in Sudan 2015-2016
34
Figure 6, reveals weaknesses reported by category of Implementing Partners. Government
counterparts and National NGOs reported their highest weakness as capacities in the reporting on
Impact, while the international NGOs give the highest percentage to absence of trained staff on
M&E/RBM. These findings are very important to invest more in the area of management of results,
but not only at the output level, but also at outcome and impact levels.
Figure 6: Weaknesses of M&E/RBM by type of IP:
UNICEF and WFP partners in the different states of Sudan, have identified their weaknesses, and
their priorities for capacity building. Table 4 below, shows the percentages for weaknesses and
priorities identified by IPs in each state.
Table 4 below shows percentages for weaknesses and priorities, by each state
State
No available costed
M&E/RBM plan in project
documents
No available M&E/RBM unit in our institution
No available trained staff in
our office to manage
M&E/RBM
Reporting is weak & not on impact
but only on activities
All of the
above Other
Sudan 20% 15% 22% 24% 8% 11%
Northern 0% 0% 13% 38% 0% 50%
River Nile 8% 8% 8% 8% 69% 0%
Red Sea 14% 14% 14% 33% 10% 14%
Kassala 23% 23% 14% 26% 3% 11%
Gadarif 21% 11% 21% 21% 0% 26%
Khartoum 20% 11% 31% 27% 2% 9%

UNICEF-WFP Final Report of Capacity Needs Assessment Analysis of Partner’s Practices of RBM and M&E in Sudan 2015-2016
35
State
No available costed
M&E/RBM plan in project
documents
No available M&E/RBM unit in our institution
No available trained staff in
our office to manage
M&E/RBM
Reporting is weak & not on impact
but only on activities
All of the
above Other
Gezira 15% 15% 23% 23% 23% 0%
White Nile 11% 16% 32% 26% 5% 11%
Sinnar 17% 17% 50% 17% 0% 0%
Blue Nile 30% 26% 15% 26% 0% 4%
North Kordofan 16% 13% 26% 26% 6% 13%
South Kordofan 23% 20% 17% 26% 6% 9%
West Kordofan 24% 11% 24% 27% 14% 0%
North Darfur 28% 21% 21% 26% 0% 5%
West Darfur 27% 9% 24% 18% 12% 9%
South Darfur 17% 19% 17% 14% 7% 26%
Central Darfur 23% 5% 27% 23% 9% 14%
East Darfur 13% 13% 25% 25% 19% 6%
e) Priorities for Capacity building on RBM and M&E identified by IPs
The Table below, shows the top five needs/priorities for capacity development on RBM and M&E
reported by IPs: 19 percent of the IPs said they needed training on M&E/RBM analysis and reporting,
18 percent mentioned training on M&E/RBM planning and budgeting and 17 percent require training
on planning and programme development.
Training on M&E/ RBM planning & budgeting
Training on M&E /RBM analysis & reporting
Training in information dissemination/ sharing
Training on development of field visits tools/checklists
Training on planning & programme development
18% 19% 15% 15% 17%
2.2 Pillar 1- Leadership on Planning, RBM and M&E
2.2.1 Existence of Planning document describing logical result chain
This pillar focuses on organizational leadership and management for results, the implementation capacity of an organization and the reinforcement of values of management for results, and management accountability.
In answer to the question: “if IPs planning documents, clearly describe logical result chain (impact, outcomes, and outputs)”, the Graph below shows that 33.5 percent mentioned having a strong capacity, 35 percent are at moderate /Transition level and 31.5 percent are at latent/emergent capacity.

UNICEF-WFP Final Report of Capacity Needs Assessment Analysis of Partner’s Practices of RBM and M&E in Sudan 2015-2016
36
Among UNICEF/WFP implementing partners, international NGOs reported the highest percentage (53.2 percent) in having a Planning document describing a logical result chain (impact, outcomes, and outputs), followed by National NGOs (37.3 percent) then Government counterparts (33.5 percent). Figure 7: Planning document describing logical result chain (impact, outcomes, and outputs), total and by state
This result reveals that, although there are National Documents (polices, strategies and guidelines) in place in most if not all the cases, still more than 66 percent of the IPs did not use it to develop their programs and project documents. The real risk in this practice is that targets, activities, outputs and outcomes will not match the key master National documents that include the National targets. In an ideal situation, all the IPs should have a reference for baselines and targets and based on it; they develop a logical Framework of their programs and projects. This is one of the key areas that requires more focus and attention while implementing the capacity building activities in the area of development of program and project document. All the IPs in Red Sea and Gezira states, mentioned that they are not fully implementing this capacity. This is followed by 94 percent reported by West Kordofan, 92 percent reported by Gadarif and 90 percent for Blue Nile. Table 5 shows the description of capacity of having a Planning document describing the logical result chain (impact, outcomes, and outputs), per the three assessment categories for each state. Figure 7 shows the percentage of IPs which did not have the full capacity of having planning documents clearly describing the logical result chain by state. The majority of the states reported that they do not have a planning document that describes a logical result chain - mostly in Gezira, Red Sea, West Kordofan, Gadarif, Blue Nile and North Kordofan.

UNICEF-WFP Final Report of Capacity Needs Assessment Analysis of Partner’s Practices of RBM and M&E in Sudan 2015-2016
37
Table 5: Percentages of IPs reported on Institution planning documents clearly describing logical result chain, by categories and by state
State
Awareness/Latent capacity
+Exploration/ Emergent capacity
Transition / Moderate capacity
Full implementation/strong
capacity
Sudan 31% 35% 34%
Northern 44% 33% 22%
River Nile 27% 0% 73%
Red Sea 46% 54% 0%
Kassala 13% 30% 57%
Gadarif 50% 42% 8%
Khartoum 30% 30% 40%
Gezira 78% 22% 0%
White Nile 21% 36% 43%
Sinnar 25% 50% 25%
Blue Nile 29% 62% 10%
North Kordofan
57% 29% 14%
South Kordofan
29% 36% 36%
West Kordofan
67% 28% 6%
North Darfur 29% 32% 39%

UNICEF-WFP Final Report of Capacity Needs Assessment Analysis of Partner’s Practices of RBM and M&E in Sudan 2015-2016
38
West Darfur 23% 27% 50%
South Darfur 14% 34% 52%
Central Darfur
10% 50% 40%
East Darfur 31% 38% 31%
2.2.2 Decision makers' level of commitment
In answer to the question regarding the decision makers' level of commitment to a management for development or humanitarian Results approach, Figure 8 below shows that 40 percent of UNICEF /WFP Implementing Partners reported latent to emergent capacities; 46 percent are Government bodies, 39 percent National NGOs and 40 percent are international NGOs. The highest full implementation was reported by INGOs (37 percent), followed by National NGOs (26 percent) then Government bodies (19 percent). Figure 8: Decision makers' level of commitment to a management for development or humanitarian Results approach, total and By IP
The lowest capacity of commitment to a management for development or humanitarian Results approach reported by IPs is in Gezira state and West and South Kordofan, as indicated by the following graph.

UNICEF-WFP Final Report of Capacity Needs Assessment Analysis of Partner’s Practices of RBM and M&E in Sudan 2015-2016
39
The transition and full capacity in implementation by state can be seen in the Table below: Table 6: Decision makers’ level of commitment to results, by state
Total
Awareness/Latent capacity +Exploration/
Emergent capacity
Transition / Moderate capacity
Full implementation/s
trong capacity
Total 40% 36% 24%
Northern 56% 33% 11%
River Nile 36% 9% 55%
Red Sea 23% 69% 8%
Kassala 36% 27% 36%
Gadarif 50% 50% 0%
Khartoum 30% 30% 40%
Gezira 89% 11% 0%
White Nile 14% 50% 36%
Sinnar 38% 25% 38%
Blue Nile 48% 33% 19%
North Kordofan 48% 38% 14%
South Kordofan 61% 21% 18%
West Kordofan 83% 17% 0%
North Darfur 19% 56% 25%
West Darfur 29% 39% 32%
South Darfur 31% 38% 31%
Central Darfur 25% 45% 30%
East Darfur 54% 38% 8%
2.2.3 RBM affecting management practices

UNICEF-WFP Final Report of Capacity Needs Assessment Analysis of Partner’s Practices of RBM and M&E in Sudan 2015-2016
40
In response to questions on RBM affecting management practices; the majority of IPs reported latent to emergent capacity in the use of RBM for management at individual level. Only 24 percent of the IPs have strong capacity. The Government bodies are mostly showing a latent to moderate level of capacity (60 percent).
The full implementation was reported by National NGOs (33 percent) followed by INGOs (32 percent) then Government bodies at (17 percent).
Figure 9: Extent that RBM affects management practices at the individual level.
As shown in Figure 9.1 below, the highest latent to emergent results on RBM affecting management practices at the individual level, was reported in Gadarif (90 percent), West Kordofan (89 percent) and North Kordofan (70 percent).
Table 7: Extent that RBM affects management practices at the individual level, by state
Kassala
West Darfur
North Darfur
South Kordofan
South Darfur
Sudan
Northern
White Nile
North Kordofan
Gadarif
14%15%
17%27%28%29%29%
31%34%
38%39%
43%44%
54%57%
63%70%
89%90%
Figure 9.1 : Extent that RBM affects management practices at the individual level at latent capacity to Emergent capacity

UNICEF-WFP Final Report of Capacity Needs Assessment Analysis of Partner’s Practices of RBM and M&E in Sudan 2015-2016
41
State
Awareness/Latent capacity +Exploration/
Emergent capacity Transition /
Moderate capacity
Full implementation/strong
capacity
Total 39% 37% 25%
Northern 44% 33% 22%
River Nile 27% 0% 73%
Red Sea 54% 31% 15%
Kassala 14% 50% 36%
Gadarif 90% 10% 0%
Khartoum 43% 36% 21%
Gezira 63% 38% 0%
White Nile 57% 21% 21%
Sinnar 38% 38% 25%
Blue Nile 29% 48% 24%
North Kordofan 70% 20% 10%
South Kordofan 29% 43% 29%
West Kordofan 89% 11% 0%
North Darfur 28% 41% 31%
West Darfur 17% 47% 37%
South Darfur 34% 28% 38%
Central Darfur 15% 65% 20%
East Darfur 31% 62% 8%
2.2.4 Level of IP’s collaboration with other actors
Looking at the chart below with regards to the question “if IP is collaborating with different partners in achieving development or humanitarian results”, it is reported that most of the IPs are within the latent to emergent level of practice (40 percent). Some 60 percent of IPs have fair to good organizational collaboration with different partners in achieving development or humanitarian results, while the remaining third have low collaboration.
Figure 10: Level of IP’s collaboration with civil society organizations or the private sector or the Government as equal partners in achieving development or humanitarian results, Total and by IP

UNICEF-WFP Final Report of Capacity Needs Assessment Analysis of Partner’s Practices of RBM and M&E in Sudan 2015-2016
42
Level of IP’s collaboration by state is illustrated by the table below:
Table 8: Level of IP’s collaboration with civil society organizations or the private sector or the
Government as equal partners in achieving development or humanitarian results, Total and by
state
State Awareness/Latent
capacity +Exploration/ Emergent capacity
Transition / Moderate capacity
Full implementation/strong
capacity
Sudan 16% 25% 59%
Northern 33% 33% 33%
River Nile 9% 9% 82%
Red Sea 8% 69% 23%
Kassala 9% 17% 74%
Gadarif 67% 33% 0%
Khartoum 23% 26% 52%
Gezira 33% 44% 22%
White Nile 29% 29% 43%
Sinnar 13% 13% 75%
Blue Nile 5% 38% 57%
North Kordofan 20% 20% 60%
South Kordofan 18% 25% 57%
West Kordofan 22% 61% 17%
North Darfur 19% 13% 68%
West Darfur 3% 14% 83%
South Darfur 10% 17% 72%
Central Darfur 0% 15% 85%
2.3. Pillar 2 - Monitoring & Evaluation
2.3.1 Policies, programmes and projects are subjected monitoring and evaluation
This pillar assesses the capacity and practices of IPs (Government, NGOs and others,) regarding the M&E of policies, programmes and projects for better accountability of development results, lessons learnt, evidence-based programming and policy advocacy. Implementation of regular evaluation of the policies and programs is one of the most important activities that must be taken into account for learning, accountability and further improvement of performance and results. UNICEF and WFP partners were asked “whether their programs are subjected to regular evaluation and to which extent findings of these evaluations are used to modify the objectives of the programs and projects”.

UNICEF-WFP Final Report of Capacity Needs Assessment Analysis of Partner’s Practices of RBM and M&E in Sudan 2015-2016
43
Figure 11 shows that 31 percent of the IPs have the full implementation capacity of sustainable monitoring and evaluation of polices, programms and projects, 35.3 percent at a transitional level and 33.3 percent are at latent/emergent level.
The highest full capacity of this implementation was reported by the international NGOs (40.4 percent), followed by the National NGOs (37.5 percent), and the Government bodies (22.8 percent).
Figure 11: Level that IP’s policies, programmes & project are subjected to regular and sustained monitoring and evaluation process that permits adjustments in performance objectives
Figure 11.1 below, shows the distribution of this capacity by state for the latent to emergent reported measurements.
As can be seen, the highest latent capacity is in Gadarif state (75 percent), followed by West Kordofan and Gezira state at (67 percent).

UNICEF-WFP Final Report of Capacity Needs Assessment Analysis of Partner’s Practices of RBM and M&E in Sudan 2015-2016
44
The moderate and full implementation of this capacity by state level is highlighted in Table 9. Table 9: Level that IP’s policies, programmes and projects are subjected to regular and sustained monitoring and evaluation process that permits adjustments in performance objectives, by state
Total
Awareness/Latent capacity +Exploration/ Emergent
capacity
Transition / Moderate capacity
Full implementation/stro
ng capacity
Total 34% 35% 31%
Northern 63% 25% 13%
River Nile 18% 0% 82%
Red Sea 14% 64% 21%
Kassala 17% 30% 52%
Gadarif 75% 25% 0%
Khartoum 26% 42% 32%
Gezira 67% 33% 0%
White Nile 43% 43% 14%
Sinnar 25% 38% 38%
Blue Nile 29% 29% 43%
North Kordofan 38% 48% 14%
South Kordofan 33% 30% 37%
West Kordofan 67% 28% 6%
North Darfur 34% 28% 38%
West Darfur 14% 55% 31%
South Darfur 31% 28% 41%
Central Darfur 20% 45% 35%
East Darfur 62% 23% 15%
2.3.2 Utilization of Factual information to improve better development
Only 18 percent of IPs reported the practice of full implementation of using the factual information from Monitoring and Evaluation for better development or humanitarian results. The following chart shows that 40 percent of the IPs reported being at the transitional phase, while 42 percent are still in the phase of awareness and exploration of the practice of utilization of evidence for better development result. This Finding reveals a challenging situation for decision-making without using accurate statistical information. This result should also be considered as one of the most critical of findings in this assessment since it reflects the extent to which findings from the monitoring activities are less used as a corrective measure of the program or project implementation.

UNICEF-WFP Final Report of Capacity Needs Assessment Analysis of Partner’s Practices of RBM and M&E in Sudan 2015-2016
45
The moderate and full implementation of this capacity by state level is illustrated in Table 10. The states that have good practice in using factual information for better development are South Darfur (34 percent), Kassala (30 percent) and River Nile (27 percent).
As shown in Figure 12.a below, the highest latent to emergent results on Utilization of Factual
information to improve better development was reported in West Kordofan (83 percent), Gezira (78
percent) and North Gadarif (58 percent).

UNICEF-WFP Final Report of Capacity Needs Assessment Analysis of Partner’s Practices of RBM and M&E in Sudan 2015-2016
46
Table 10: IP level of factual information from Monitoring and Evaluation used to improve better development and/or humanitarian results, by state
Total
Awareness/Latent capacity
+Exploration/ Emergent capacity
Transition / Moderate capacity
Full implementation/strong
capacity
Northern 44% 44% 11%
River Nile 27% 45% 27%
Red Sea 54% 38% 8%
Kassala 22% 48% 30%
Gadarif 58% 42% 0%
Khartoum 35% 48% 16%
Gezira 78% 22% 0%
White Nile 43% 57% 0%
Sinnar 13% 63% 25%
Blue Nile 38% 57% 5%
North Kordofan 57% 29% 14%
South Kordofan 41% 37% 22%
West Kordofan 83% 11% 6%
North Darfur 44% 34% 22%
West Darfur 40% 37% 23%
South Darfur 34% 31% 34%
Central Darfur 25% 50% 25%
East Darfur 46% 46% 8%
2.4. Pillar 3: Accountability, Reporting and Partners
2.4.1 Good practices of alignment on national priorities
This pillar focuses on the integration of external reporting with the actual Results-Based Management practices within an organization
With regards to ensuring good practices of alignment on national priorities, it is apparent that out of 346 IPs, 161 (47 percent) have strong alignment of national priorities within their programmes and 117 (34 percent) have a moderate level of alignment. The government has 49 percent of the IPs, the NNGOs have (37 percent), and the INGOs have 14 percent). As such, UNICEF and WFP need to ensure that all the IPs are aligning national priorities with their programme documents and work plans.
Figure 13: To what extent institutions ensure good practices of alignment on national priorities
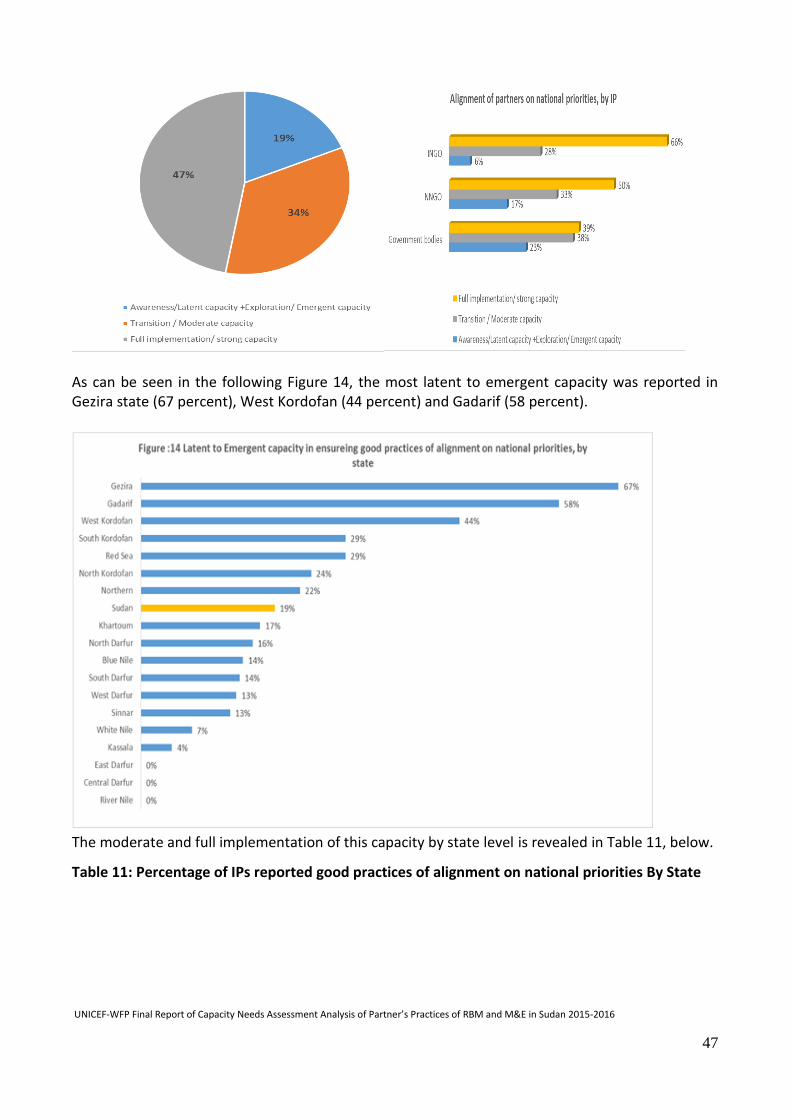
UNICEF-WFP Final Report of Capacity Needs Assessment Analysis of Partner’s Practices of RBM and M&E in Sudan 2015-2016
47
As can be seen in the following Figure 14, the most latent to emergent capacity was reported in Gezira state (67 percent), West Kordofan (44 percent) and Gadarif (58 percent).
The moderate and full implementation of this capacity by state level is revealed in Table 11, below.
Table 11: Percentage of IPs reported good practices of alignment on national priorities By State

UNICEF-WFP Final Report of Capacity Needs Assessment Analysis of Partner’s Practices of RBM and M&E in Sudan 2015-2016
48
State
Awareness/Latent capacity
+Exploration/ Emergent capacity
Transition / Moderate capacity
Full implementation/strong capacity
Total 19% 34% 47%
Northern 22% 78% 0%
River Nile 0% 27% 73%
Red Sea 29% 50% 21%
Kassala 4% 30% 65%
Gadarif 58% 42% 0%
Khartoum 17% 27% 57%
Gezira 67% 11% 22%
White Nile 7% 43% 50%
Sinnar 13% 50% 38%
Blue Nile 14% 48% 38%
North Kordofan 24% 33% 43%
South Kordofan 29% 25% 46%
West Kordofan 44% 39% 17%
North Darfur 16% 22% 63%
West Darfur 13% 40% 47%
South Darfur 14% 24% 62%
Central Darfur 0% 40% 60%
East Darfur 0% 31% 69%
2.5 Pillar 4: Planning and Budgeting
2.5.1 Budget allocation based on results and objectives
This element assesses how results should be linked to high-level organizational objectives and expressed in the form of operational processes. Managing for results should also be linked to risk management.
The focus of this element is on performance expectations and how these align with the corporate outcomes of an organization. The expectations include outputs and outcomes, when budgeting is possible.
The chart below, shows that 36.8 percent of the IPs believe they are strong in budget allocation based on each department's results and objectives, and 27.6 percent of the IPs think that they are moderate in budget allocation based on each department's results and objectives. Some 35.6 percent of the IPs say they are just starting to understand the issue and 12 percent believe they do not know about it. As to that, there is a gap and a weakness here that needs to be addressed. Budgeting is a critical component and to use results for budgeting, a prior M&E plan is required with clear indicators and M&E and RBM data that supports this budgeting process, which is not always readily available Figure 15: Level of budget allocation based on each department's results and objectives, taking into account the assessment of past results. Total and by IP

UNICEF-WFP Final Report of Capacity Needs Assessment Analysis of Partner’s Practices of RBM and M&E in Sudan 2015-2016
49
The highest percentages of full implementation was reported by INGOs (85.7 percent), followed by National NGOs (40.5 percent) and Government bodies at (27.5 percent). Most latent to emergent capacities were reported in Gezira state (78 percent), Gadarif state (75 percent) and West Kordofan (72 percent). Figure 16 shows the distribution of the latent emergent level per state.
The moderate and full implementation of this capacity by state level is shown in Table 12, below

UNICEF-WFP Final Report of Capacity Needs Assessment Analysis of Partner’s Practices of RBM and M&E in Sudan 2015-2016
50
Table 12: Level of budget allocation based on each department's results and objectives, by state
State
Awareness/Latent capacity +Exploration/
Emergent capacity
Transition / Moderate capacity
Full implementation/st
rong capacity
Total 36% 28% 37%
Northern 56% 33% 11%
River Nile 27% 9% 64%
Red Sea 21% 57% 21%
Kassala 5% 18% 77%
Gadarif 75% 25% 0%
Khartoum 29% 35% 35%
Gezira 78% 22% 0%
White Nile 50% 29% 21%
Sinnar 50% 25% 25%
Blue Nile 67% 24% 10%
North Kordofan 48% 24% 29%
South Kordofan 30% 22% 48%
West Kordofan 72% 17% 11%
North Darfur 23% 29% 48%
West Darfur 23% 33% 43%
South Darfur 21% 28% 52%
Central Darfur 25% 25% 50%
East Darfur 23% 38% 38%
2.5.2 Result Oriented framework
Although it is very important and necessary to have an oriented results framework as part of the
program's or project's document, only 33 percent of UNICEF/WFP Implementing Partners reported
strong capacity in this area. There are still more than 60 percent of IPs either at latent/emergent or
at moderate level. Figure 17 below, illustrates the Level of which the IP has a result-oriented
framework, total and by IPs.
Figure 17: Level that IP has a result oriented framework, total and by IPs

UNICEF-WFP Final Report of Capacity Needs Assessment Analysis of Partner’s Practices of RBM and M&E in Sudan 2015-2016
51
Figure 18 below, shows that the most latent/emergent capacites in the area of Level of which the IP has a result-oriented framework was reported in Gezira state (78 percent), followed by West Kordofan (67 percent) and North Kordofan (57 percent)
The moderate and full implementation of this capacity by state level, shows in the following Table
13.
Table 13: Level that IP has a result-oriented framework; by State
State Awareness/Latent
capacity +Exploration/ Emergent capacity
Transition / Moderate capacity
Full implementation/strong
capacity
Total 31% 35% 34%
Northern 44% 33% 22%
River Nile 27% 0% 73%
Red Sea 46% 54% 0%
Kassala 13% 30% 57%
Gadarif 50% 42% 8%
Khartoum 30% 30% 40%
Gezira 78% 22% 0%
White Nile 21% 36% 43%
Sinnar 25% 50% 25%
Blue Nile 29% 62% 10%
North Kordofan 57% 29% 14%
South Kordofan 29% 36% 36%
West Kordofan 67% 28% 6%
North Darfur 29% 32% 39%

UNICEF-WFP Final Report of Capacity Needs Assessment Analysis of Partner’s Practices of RBM and M&E in Sudan 2015-2016
52
West Darfur 23% 27% 50%
South Darfur 14% 34% 52%
Central Darfur 10% 50% 40%
East Darfur 31% 38% 31%
2.5.3 Funding being linked to programming by results
When the Implementing Partners were asked about funding being linked to programming by results, the chart below shows that 44 percent have a strong link and 30 percent have a moderate link. This indicates nearly 74 percent have a good capacity for all IPs. The NNGOs (62 IPs) show the strongest link of donor funding to programming results, which is understandable since donors and affiliated INGOs must be enforcing this to ensure they get the required impact for their funds. Figure 19: Extent that IP’s donor funding is linked to programming by results, total and by IPs
With regards to the percentage of annual funding being used for Monitoring and Evaluation activities at IP level, it is Clear that it is very low, with 62 percent latent to emergent capacity and 38 percent moderate to strong capacity. This indicates that the majority of IPs need to allocate more M&E funding from the beginning of the programming cycle. Furthermore, this could be a major factor in why all their M&E functions are not going according to plan, since they do not have enough funding incorporated in the work plan or project document from the beginning. As shown in Figure 18.1 below, most latent emergent capacities in IP’s donor funding linked to programming by results, are in Gezira (89 percent), Gadarif (73 percent) and West Kordofan (72 percent).

UNICEF-WFP Final Report of Capacity Needs Assessment Analysis of Partner’s Practices of RBM and M&E in Sudan 2015-2016
53
The moderate and full implementation of this capacity by state level is shown in Table 14, below
Table 14: Latent to emergent capacities in IP’s donor funding linked to programming by state.
State
Awareness/Latent capacity +Exploration/
Emergent capacity Transition /
Moderate capacity
Full implementation/stro
ng capacity
Total 26% 30% 44%
Northern 44% 22% 33%
River Nile 18% 9% 73%
Red Sea 43% 43% 14%
Kassala 0% 35% 65%
Gadarif 73% 27% 0%
Khartoum 33% 27% 40%
Gezira 89% 0% 11%
White Nile 46% 23% 31%
Sinnar 25% 13% 63%
Blue Nile 24% 62% 14%
North Kordofan 29% 33% 38%
South Kordofan 25% 39% 36%
West Kordofan 72% 22% 6%
North Darfur 19% 26% 55%
West Darfur 7% 27% 67%
South Darfur 7% 38% 55%
Central Darfur 11% 26% 63%
East Darfur 0% 8% 92%

UNICEF-WFP Final Report of Capacity Needs Assessment Analysis of Partner’s Practices of RBM and M&E in Sudan 2015-2016
54
2.5.4 Allocation for implementation of monitoring and evaluation activities
In relation to budget allocation for implementation of monitoring and evaluation activities, one of the biggest challenges is the absence of a separate plan highlighting financial resources to conduct the monitoring activities. In most of the cases, budgets for monitoring activities are either calculated as a percentage from resources allocated for activities, or it is incorporated in the budget for the activities without marking of it. Figure 19 below, shows percentages of annual budget allocation, total and by IP. Figure 19: Percent of annual budget funding allocated for M&E total and by IP
Only 16 percent of the IPs reported full capacity in allocation of funds for M&E activities. However, 84 percent are still either latent, emergent or at moderate level. Latent to emergent capacity was reported as the highest among the three IPs (Government bodies IGOs, and NNGOs). Figure 20 below, shows the most latent to emergent capacities in budget allocation for M&E per state. The least capacities is reported in West Kordofan and Gadarif (82 percent), and Gezira (78 percent).

UNICEF-WFP Final Report of Capacity Needs Assessment Analysis of Partner’s Practices of RBM and M&E in Sudan 2015-2016
55
The moderate and full implementation of this capacity by state level is shown in Table 15, below.
Table 15: Percent of annual budget funding allocated for M&E, by State
State
Awareness/Latent capacity +Exploration/ Emergent
capacity
Transition / Moderate capacity
Full implementation/stro
ng capacity
Sudan 62% 22% 16%
Northern 44% 44% 11%
River Nile 33% 22% 44%
Red Sea 62% 31% 8%
Kassala 43% 26% 30%
Gadarif 82% 18% 0%
Khartoum 50% 30% 20%
Gezira 78% 22% 0%
White Nile 77% 8% 15%
Sinnar 50% 25% 25%
Blue Nile 52% 29% 19%
North Kordofan 76% 19% 5%
South Kordofan 56% 33% 11%
West Kordofan 82% 18% 0%
North Darfur 55% 23% 23%
West Darfur 69% 8% 23%
South Darfur 72% 10% 17%
Central Darfur 58% 26% 16%
33%43%44%
50%50%
52%55%56%
58%62%62%
69%72%
76%77%78%
82%82%
River Nile
Kassala
Northern
Khartoum
Sinnar
Blue Nile
North Darfur
South Kordofan
Central Darfur
Red Sea
Sudan
West Darfur
South Darfur
North Kordofan
White Nile
Gezira
Gadarif
West Kordofan
Figure :20 Latent to Emergent capacity in Percent of annual budget funding allocated for M&E , by state

UNICEF-WFP Final Report of Capacity Needs Assessment Analysis of Partner’s Practices of RBM and M&E in Sudan 2015-2016
56
2.5.6 Data Segregation
As for the IP’s capacity in terms of data disaggregation, the chart below shows that 69 percent of all the IPs categories have strong to moderate abilities to use disaggregated data, which is a good indication that they can target certain age groups, gender groups, states, etc. Figure 21: Level of IP’s capacity in terms of data disaggregation. By IP
Figure 21 below, shows the most latent to emergent capacities in terms of data disaggregation. The most latent /emergent capacities was reported by Gezira state (67 percent), Red Sea (64 percent) and Northern state (56 percent).

UNICEF-WFP Final Report of Capacity Needs Assessment Analysis of Partner’s Practices of RBM and M&E in Sudan 2015-2016
57
The moderate and full implementation of this capacity by state level, is highlighted in Table 16,
below.
Table 16: Level of IP’s capacity in terms of data disaggregation, by State
State
Awareness/Latent capacity +Exploration/
Emergent capacity
Transition / Moderate capacity
Full implementation/stro
ng capacity
Total 31% 36% 33%
Northern 56% 33% 11%
River Nile 27% 36% 36%
Red Sea 64% 14% 21%
Kassala 17% 30% 52%
Gadarif 50% 50% 0%
Khartoum 31% 45% 24%
Gezira 67% 33% 0%
White Nile 42% 17% 42%
Sinnar 25% 38% 38%
Blue Nile 19% 43% 38%
North Kordofan 29% 38% 33%
South Kordofan 25% 25% 50%
West Kordofan 47% 53% 0%
North Darfur 19% 42% 39%
West Darfur 37% 27% 37%
South Darfur 31% 28% 41%
Central Darfur 5% 50% 45%
East Darfur 36% 36% 29%
2.5.7 Availably of data to measure all indicators
When analyzing the question of whether or not the scope of available data is broad enough to measure all indicators related to IPs’ priorities, we see that only 20 percent (figure 22) reported a strong capacity. This is a gap area which needs to be addressed in the capacity development plan. It suggests that IPs do not incorporate M&E plans with indicators from the beginning in their project documents and thus do not have the statistical data to measure all the needed indicators to show impact. Moreover, it is clear that IPs do not generally follow indicators in their reporting, since they do not have an M&E plan incorporated in the project documents from the beginning, therefore they do not collect data that can cover all indicators. Figure 22: How broad is the scope of available statistical data to measure all indicators related to IP’s priorities.

UNICEF-WFP Final Report of Capacity Needs Assessment Analysis of Partner’s Practices of RBM and M&E in Sudan 2015-2016
58
Figure 22 below, shows the state distribution of the most latent to emergent capacities in the scope of available statistical data to measure all indicators related to IP’s priorities. West Kordofan (76 percent), Gezira (67 percent) and East Darfur (64 percent) are the states mostly reporting latent to emergent capacity.
The moderate and full implementation of this capacity by state level is shown in Table 17, below.

UNICEF-WFP Final Report of Capacity Needs Assessment Analysis of Partner’s Practices of RBM and M&E in Sudan 2015-2016
59
Table 17: Scope of available statistical data to measure all indicators related to IP’s priorities, by state
State
Awareness/Latent capacity +Exploration/
Emergent capacity
Transition / Moderate capacity
Full implementation/strong capacity
Sudan 45% 35% 20%
Northern 56% 44% 0%
River Nile 18% 55% 27%
Red Sea 50% 36% 14%
Kassala 43% 22% 35%
Gadarif 42% 58% 0%
Khartoum 41% 41% 17%
Gezira 67% 33% 0%
White Nile 58% 17% 25%
Sinnar 50% 50% 0%
Blue Nile 29% 38% 33%
North Kordofan 48% 33% 19%
South Kordofan 50% 21% 29%
West Kordofan 76% 24% 0%
North Darfur 32% 39% 29%
West Darfur 57% 30% 13%
South Darfur 34% 38% 28%
Central Darfur 25% 50% 25%
East Darfur 64% 21% 14%
2.6. Pillar 5: Measuring Results and Statistics
2.6.1 Data Quality Assessment
This pillar assesses whether data collection includes outcomes and impact in addition to the measurement of inputs, activities and outputs. Measurement is linked to planning and reporting, and it integrates cost with results measurement, the development of a measurement strategy and the completion of an independent evaluation. The chart below, is indicative of the fact that data quality assessment means are not available or used by IPs to improve the quality of statistical data. It reveals that 109 (32 percent) stated that they are moderately using data quality assessment and (30 percent) stated that they are at the emergent level of use. The reason can be due to lack of M&E/RBM knowledge amongst the IPs, as well as poor reporting practices with non-availability of field monitoring tools such as checklists.
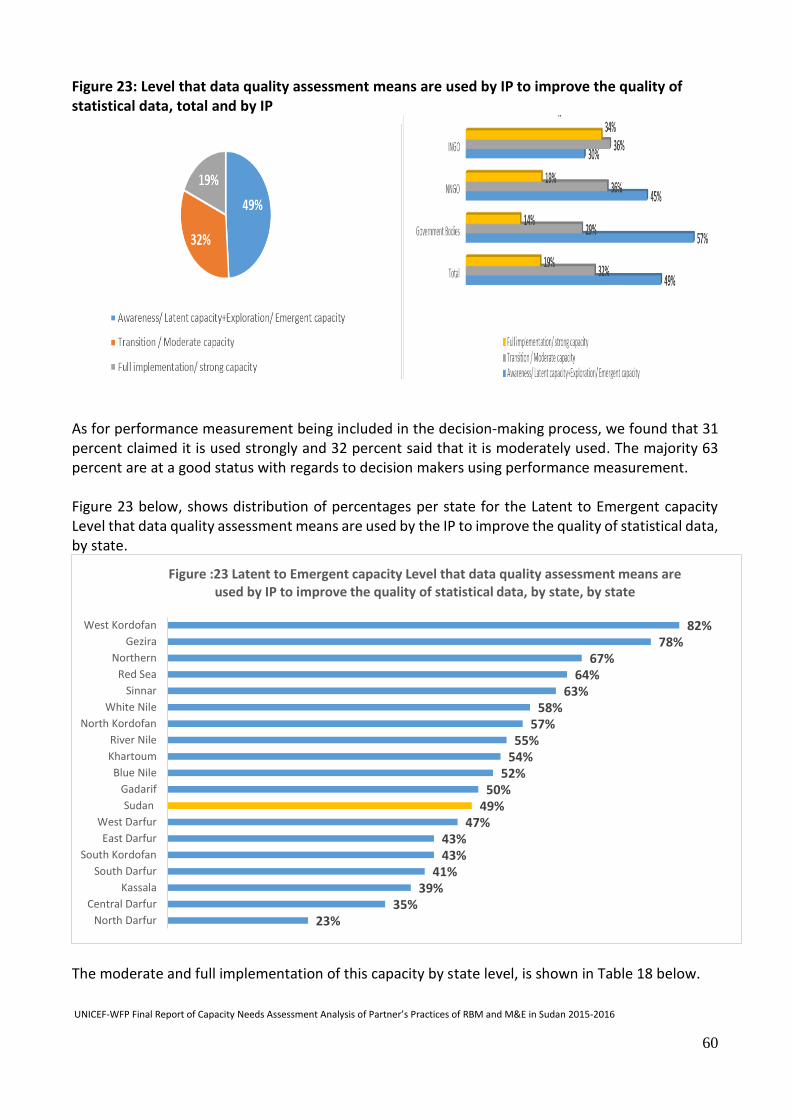
UNICEF-WFP Final Report of Capacity Needs Assessment Analysis of Partner’s Practices of RBM and M&E in Sudan 2015-2016
60
Figure 23: Level that data quality assessment means are used by IP to improve the quality of statistical data, total and by IP
As for performance measurement being included in the decision-making process, we found that 31 percent claimed it is used strongly and 32 percent said that it is moderately used. The majority 63 percent are at a good status with regards to decision makers using performance measurement. Figure 23 below, shows distribution of percentages per state for the Latent to Emergent capacity Level that data quality assessment means are used by the IP to improve the quality of statistical data, by state.
The moderate and full implementation of this capacity by state level, is shown in Table 18 below.
23%35%
39%41%
43%43%
47%49%
50%52%
54%55%
57%58%
63%64%
67%78%
82%
North Darfur
Central Darfur
Kassala
South Darfur
South Kordofan
East Darfur
West Darfur
Sudan
Gadarif
Blue Nile
Khartoum
River Nile
North Kordofan
White Nile
Sinnar
Red Sea
Northern
Gezira
West Kordofan
Figure :23 Latent to Emergent capacity Level that data quality assessment means are used by IP to improve the quality of statistical data, by state, by state
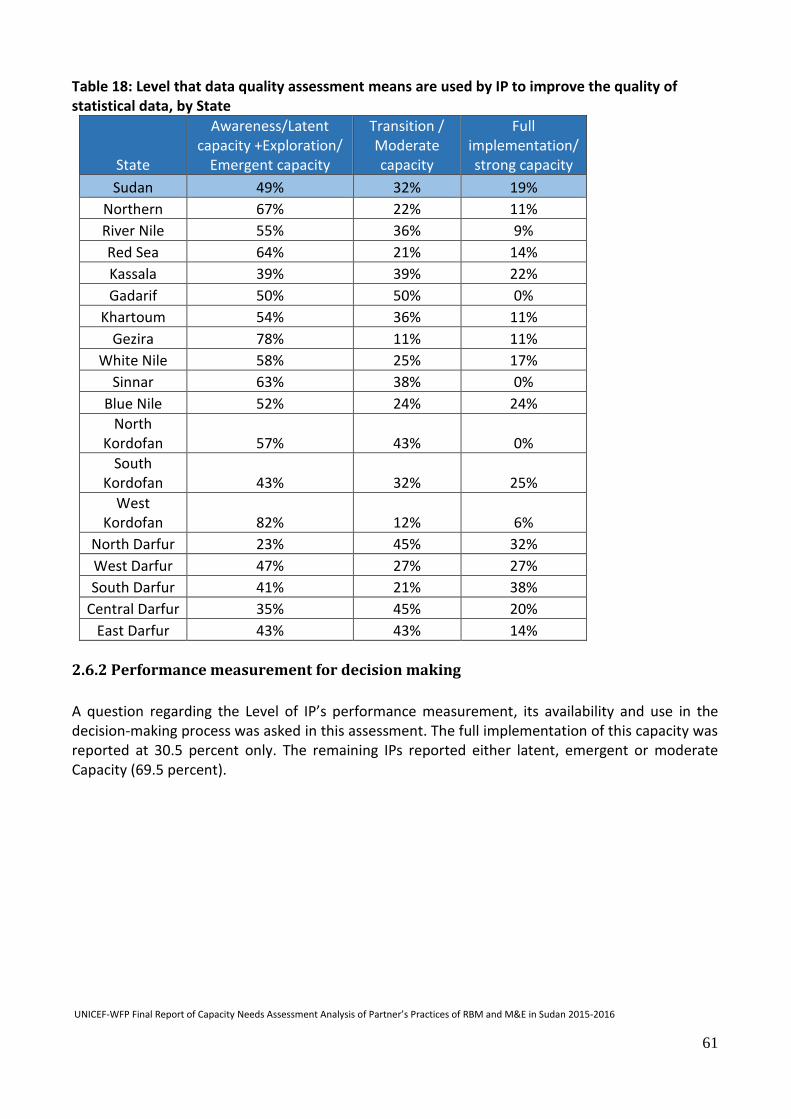
UNICEF-WFP Final Report of Capacity Needs Assessment Analysis of Partner’s Practices of RBM and M&E in Sudan 2015-2016
61
Table 18: Level that data quality assessment means are used by IP to improve the quality of statistical data, by State
State
Awareness/Latent capacity +Exploration/
Emergent capacity
Transition / Moderate capacity
Full implementation/strong capacity
Sudan 49% 32% 19%
Northern 67% 22% 11%
River Nile 55% 36% 9%
Red Sea 64% 21% 14%
Kassala 39% 39% 22%
Gadarif 50% 50% 0%
Khartoum 54% 36% 11%
Gezira 78% 11% 11%
White Nile 58% 25% 17%
Sinnar 63% 38% 0%
Blue Nile 52% 24% 24%
North Kordofan 57% 43% 0%
South Kordofan 43% 32% 25%
West Kordofan 82% 12% 6%
North Darfur 23% 45% 32%
West Darfur 47% 27% 27%
South Darfur 41% 21% 38%
Central Darfur 35% 45% 20%
East Darfur 43% 43% 14%
2.6.2 Performance measurement for decision making
A question regarding the Level of IP’s performance measurement, its availability and use in the decision-making process was asked in this assessment. The full implementation of this capacity was reported at 30.5 percent only. The remaining IPs reported either latent, emergent or moderate Capacity (69.5 percent).

UNICEF-WFP Final Report of Capacity Needs Assessment Analysis of Partner’s Practices of RBM and M&E in Sudan 2015-2016
62
Figure 24: Level of IP’s performance measurement available and used for decision making process, total and by IP
Figure 24.a below, shows distribution of percentages per state for the Latent to Emergent capacity
Level of IP’s performance measurement available and used for decision-making process, by state
The moderate and full implementation of this capacity by state level, is shown in Table 19, below.

UNICEF-WFP Final Report of Capacity Needs Assessment Analysis of Partner’s Practices of RBM and M&E in Sudan 2015-2016
63
Table 19: Level of IP’s performance measurement available and used for decision making process, by State
State
Awareness/Latent capacity
+Exploration/ Emergent capacity
Transition / Moderate capacity
Full implementation/strong capacity
Total 38% 32% 30%
Northern 44% 33% 22%
River Nile 18% 0% 82%
Red Sea 57% 21% 21%
Kassala 26% 30% 43%
Gadarif 50% 50% 0%
Khartoum 43% 27% 30%
Gezira 63% 25% 13%
White Nile 43% 29% 29%
Sinnar 13% 38% 50%
Blue Nile 43% 43% 14%
North Kordofan 38% 48% 14%
South Kordofan 39% 21% 39%
West Kordofan 72% 28% 0%
North Darfur 19% 29% 52%
West Darfur 37% 43% 20%
South Darfur 38% 24% 38%
Central Darfur 15% 60% 25%
East Darfur 36% 14% 50%
2.7. Pillar 6: Update on recent key capacity development
The assessment offers an opportunity to measure the degree and category of trainings that staff from NGOs benefited from recently, in order to strengthen internal capabilities to perform RBM and M&E roles and responsibilities effectively. 2.7.1 Training in data use and management
With regards to staff of the institution ever receiving training in data use and management, we found that 196 (57 percent) said yes and 150 (43 percent) said no, indicating it is nearly 50/50. We therefore need to address this issue in our capacity development and training on the subject of data analysis. The reason for this finding can be due to either the lack of perception by IPs management of the extreme need for such trainings, or the non-availability of funding for institutional capacity building components.

UNICEF-WFP Final Report of Capacity Needs Assessment Analysis of Partner’s Practices of RBM and M&E in Sudan 2015-2016
64
Figure 25: Has IP staff ever received training in data use and management. By IP
2.7.2 Training in Monitoring and Evaluation
As for staff training on M&E, it is obvious that 217 (63 percent) of IP’s staff did receive M&E training and the remaining 129 (37 percent) of the IP’s staff did not, and so need to be trained. This indicates a strength and should be utilized for further improvement of M&E functions as well as RBM. The reason can be due to IP management not considering the extreme need for such trainings, or the non-availability of funding for institutional capacity building components Figure 26: Have staff at your institution ever received training in Monitoring & Evaluation?
63%
37%
Received training in data use and managemen
Yes No
62% 65%61%
38% 35%39%
0%
10%
20%
30%
40%
50%
60%
70%
GovernmentBodies
NNGO INGO
Received training in data use and managemen, by IPs
Series1 Series2
62% 65%61%
38% 35%39%
Government bodies NNGO INGO
Received training in Monitoring & Evaluation, by IP
Series1 Series2

UNICEF-WFP Final Report of Capacity Needs Assessment Analysis of Partner’s Practices of RBM and M&E in Sudan 2015-2016
65
2.7.3 Training in Result Based Management
It is understandable since RBM is a new initiative that not all partners have the knowledge or have been trained on it. As such, it is evident from the chart below that the majority of IPs 237 (68 percent) have not been trained on RBM and only 109 (32 percent) have received training on RBM. This is clearly a weakness and therefore a high priority for the capacity building plan. Figure 27: Have staff at your institution ever received training in Result Based Management? By IP
One of the major findings of this assessment is the fact that 68 percent of UNICEF/WFP IPs did not
receive any training on RBM. This can be one of the leading factors of the weaknesses in management
and monitoring for results.
The graph below shows the gap in training of Government and NGOS on RBM by State.
It also reveals that partners of the State of West Kordofan (94 percent), Gadarif (92 percent), West
Darfur (84 percent), and Northern (72 percent), have benefitted less when it comes to training on
RBM and M&E.
32%
68%
Received training in Result Based Management
Yes No
33%30% 31%
67%70% 69%
Government bodies NNGO INGO
Received training in Result Based Management, by IP
Series1 Series2

UNICEF-WFP Final Report of Capacity Needs Assessment Analysis of Partner’s Practices of RBM and M&E in Sudan 2015-2016
66
2.8. Pillar 7: Reported weaknesses on RBM and M&E and priority solutions identified by
the partners
2.8.1 Documented system to manage implementation of plans, and strategies
This Pillar is mainly focused on documentation systems, tracking of records and reviewing programs
using the M&E results. The response to all questions under this Pillar confirm the good practices and
good institutional situations, especially in conducting a review of the program and the projects.

UNICEF-WFP Final Report of Capacity Needs Assessment Analysis of Partner’s Practices of RBM and M&E in Sudan 2015-2016
67
In response to the question regarding a documentation system to manage its plans and strategies,
the majority (85 percent) of IPs said this system is in place.
Figure 28: If IP has a documented system to manage implementation of plans, and strategies, in its programmes? By IP
2.8.2 Achieving
In response to whether or not the IP has a good track record of achieving programmatic results of similar complexity as those intended for the grant including timely implementation, the majority (70 percent) answered yes they do. The remaining 30 percent do not have a good track record of delivering training on how to track results of similar complexities. Figure 29: Does the IP have a good track record of achieving programmatic results of similar complexity as those intended for the grant including timely implementation? By IP
Total
Government bodies
NNGO
INGO
Total
85%
80%
87%
96%
85%
15%
20%
13%
4%
15%
Availability of documented system to manage implementation, by IP
No Yes

UNICEF-WFP Final Report of Capacity Needs Assessment Analysis of Partner’s Practices of RBM and M&E in Sudan 2015-2016
68
2.8.3 M&E results for planning and decision-making
In the area of reviewing the programs and using the M&E results for planning, decision-making and learning, 92 percent of the implementing partners confirmed that their institution is conducting regular review meetings for the programme/project. This reflects the good practice of follow-up on the progress made. Analysis of the question concerning whether or not the IP uses M&E results for planning, decision-making and learning, the majority (81 percent) responded yes, indicating the remaining 19 percent are in need of training on such uses. Figure 30: Use M&E results for planning, decision-making and learning? By IP
2.8.4 Adequate human resources
When asked if the IP has adequate human resources to support the programme and if the institution has the technical skills required, around 246 (76 percent) responded that yes they have and 76 (24 percent) said they do not.
Total
Government bodies
NNGO
INGO
81%
71%
80%
94%
19%
29%
20%
6%
use M&E results for planning, decision-making and learning
No Yes

UNICEF-WFP Final Report of Capacity Needs Assessment Analysis of Partner’s Practices of RBM and M&E in Sudan 2015-2016
69
Figure 32: Does the IP have adequate human resources with the required technical skills to support the programme? By IP
As per the respondent's answers, national and international NGOS have the highest response in confirming availability of adequate human resources with the required technical skills to support the programme, in comparison with Government Partners. This is endorsing the fact that more investment is needed to ensure adequate capacities for the program implementation at the Government level.
2.9. Pillar 8: Hunger Governance:
This pillar mainly addresses the questions related to Hunger Governance in the 18 states. Analysis of
questions under this pillar cover areas of Anti-hunger programmes and mandates, Social protection
policies, and social protection schemes, utilization of relevant outcomes in change of hunger and
poverty rates, impact assessment and funding stability.
2.9.1 Anti-hunger programmes and mandates
As can be seen from figure 1 below, (WFP Figure 1), 60 percent of the respondents said yes they do
have an anti-hunger mandate and 57 percent said yes they have anti-hunger programmes.
68%
85%80%
32%
15%20%
Governmentbodies
NNGO INGO
Response per Implementing Partners
Yes
76%
24%
Adequate human resources with the required technical skills to support the
programme
Yes No

UNICEF-WFP Final Report of Capacity Needs Assessment Analysis of Partner’s Practices of RBM and M&E in Sudan 2015-2016
70
WFP Figure 1: IP Anti-hunger programmes and mandates
Figure 2 below, illustrates the percentages of IPs with ongoing future anti-hunger programmes.
Only 32 percent of the IPs confirmed that they are fully implementing anti-hunger programmes,
while 29 percent are at latent to emergent capacities.
Table 1 below, illustrates the IPs which confirmed having an Anti-hunger programme and mandate, by state. State desegregated data shows that Blue Nile is the state with the highest number of IPs with both Anti-hunger programmes and mandates, and Gadarif state has the lowest.
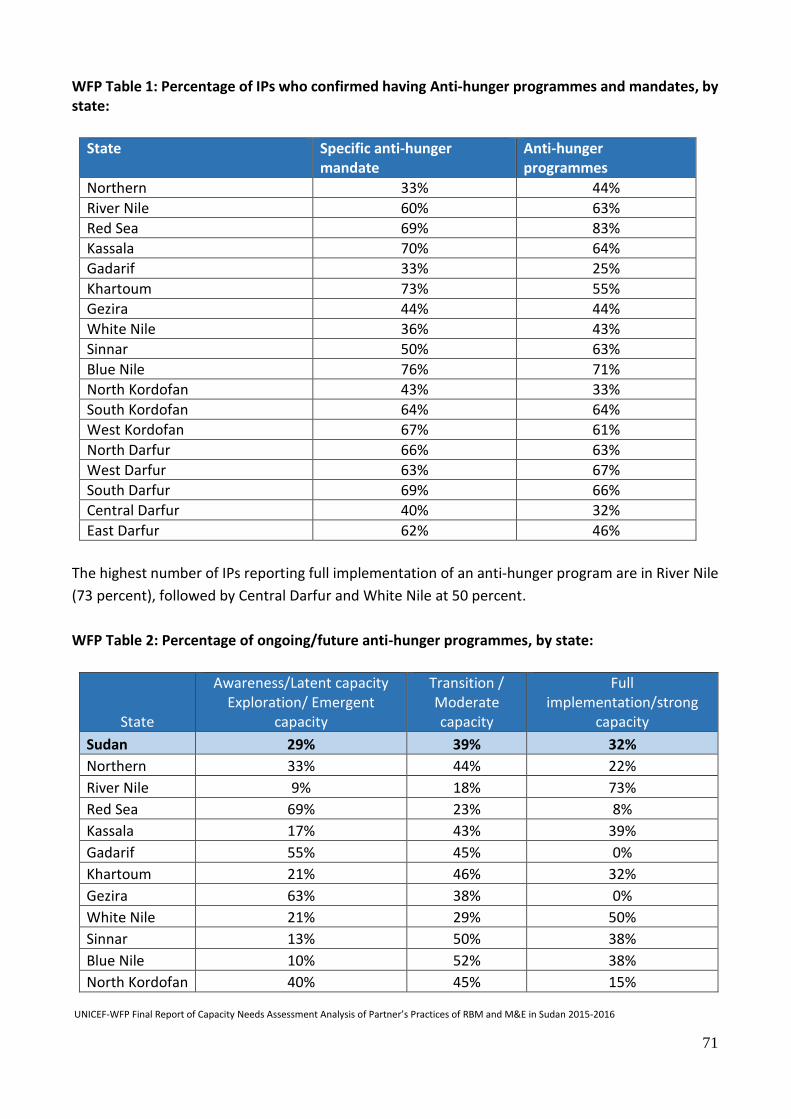
UNICEF-WFP Final Report of Capacity Needs Assessment Analysis of Partner’s Practices of RBM and M&E in Sudan 2015-2016
71
WFP Table 1: Percentage of IPs who confirmed having Anti-hunger programmes and mandates, by state:
State Specific anti-hunger mandate
Anti-hunger programmes
Northern 33% 44%
River Nile 60% 63%
Red Sea 69% 83%
Kassala 70% 64%
Gadarif 33% 25%
Khartoum 73% 55%
Gezira 44% 44%
White Nile 36% 43%
Sinnar 50% 63%
Blue Nile 76% 71%
North Kordofan 43% 33%
South Kordofan 64% 64%
West Kordofan 67% 61%
North Darfur 66% 63%
West Darfur 63% 67%
South Darfur 69% 66%
Central Darfur 40% 32%
East Darfur 62% 46%
The highest number of IPs reporting full implementation of an anti-hunger program are in River Nile
(73 percent), followed by Central Darfur and White Nile at 50 percent.
WFP Table 2: Percentage of ongoing/future anti-hunger programmes, by state:
State
Awareness/Latent capacity Exploration/ Emergent
capacity
Transition / Moderate capacity
Full implementation/strong
capacity
Sudan 29% 39% 32%
Northern 33% 44% 22%
River Nile 9% 18% 73%
Red Sea 69% 23% 8%
Kassala 17% 43% 39%
Gadarif 55% 45% 0%
Khartoum 21% 46% 32%
Gezira 63% 38% 0%
White Nile 21% 29% 50%
Sinnar 13% 50% 38%
Blue Nile 10% 52% 38%
North Kordofan 40% 45% 15%

UNICEF-WFP Final Report of Capacity Needs Assessment Analysis of Partner’s Practices of RBM and M&E in Sudan 2015-2016
72
State
Awareness/Latent capacity Exploration/ Emergent
capacity
Transition / Moderate capacity
Full implementation/strong
capacity
South Kordofan 36% 43% 21%
West Kordofan 61% 33% 6%
North Darfur 38% 25% 38%
West Darfur 23% 33% 43%
South Darfur 24% 38% 38%
Central Darfur 10% 40% 50%
East Darfur 15% 54% 31% 2.9.2 Social protection policies and social protection schemes
The results in figure 3 below, intended to explore if the IPs have within their institutional mandate,
social protection policies to improve factors such as health, nutrition, education and safety nets for
the disadvantaged population. Of the respondents, 40 percent stated they are at the latent to
emergent capacities in having such social protection polices within their institutions. Only 22 percent
of the IPs reported strong capacity; out of which 34 percent in the INGOs, 25 percent in NNGOs and
only 16 percent in the Government.
WFP Figure 3: Social protection policies and social protection schemes for the disadvantaged
States which respond to the Formal social protection policies within the institutions question, reveals
that 89 percent of the IPs in Gezira state describe their capacities as latent/emergent, followed by
East Darfur (77 percent) and West Kordofan (61 percent).
Figure 3.a is showing distribution of the latent to emergent capacities, by state.

UNICEF-WFP Final Report of Capacity Needs Assessment Analysis of Partner’s Practices of RBM and M&E in Sudan 2015-2016
73
The table below, shows the highest reported capacities is in South Darfur (52 percent), Sinnar (38
percent) and White Nile (36 percent).
However, and since the highest full implementation of this capacity is a little more than 50 percent,
this reveals a real gap in applying Social protection policies and social protection schemes within
UNICEF/WFP implementing partners.
WFP Table 3: Social protection policies and social protection schemes for the disadvantaged
State Awareness/Latent capacity
+Exploration/ Emergent capacity
Transition / Moderate capacity
Full implementation/strong
capacity
Sudan 40% 38% 22%
Northern 56% 22% 22%
River Nile 33% 33% 33%
Red Sea 29% 36% 36%
Kassala 35% 39% 26%
Gadarif 50% 50% 0%
Khartoum 32% 45% 23%
Gezira 89% 11% 0%
White Nile 43% 21% 36%
Sinnar 13% 50% 38%
Blue Nile 33% 67% 0%
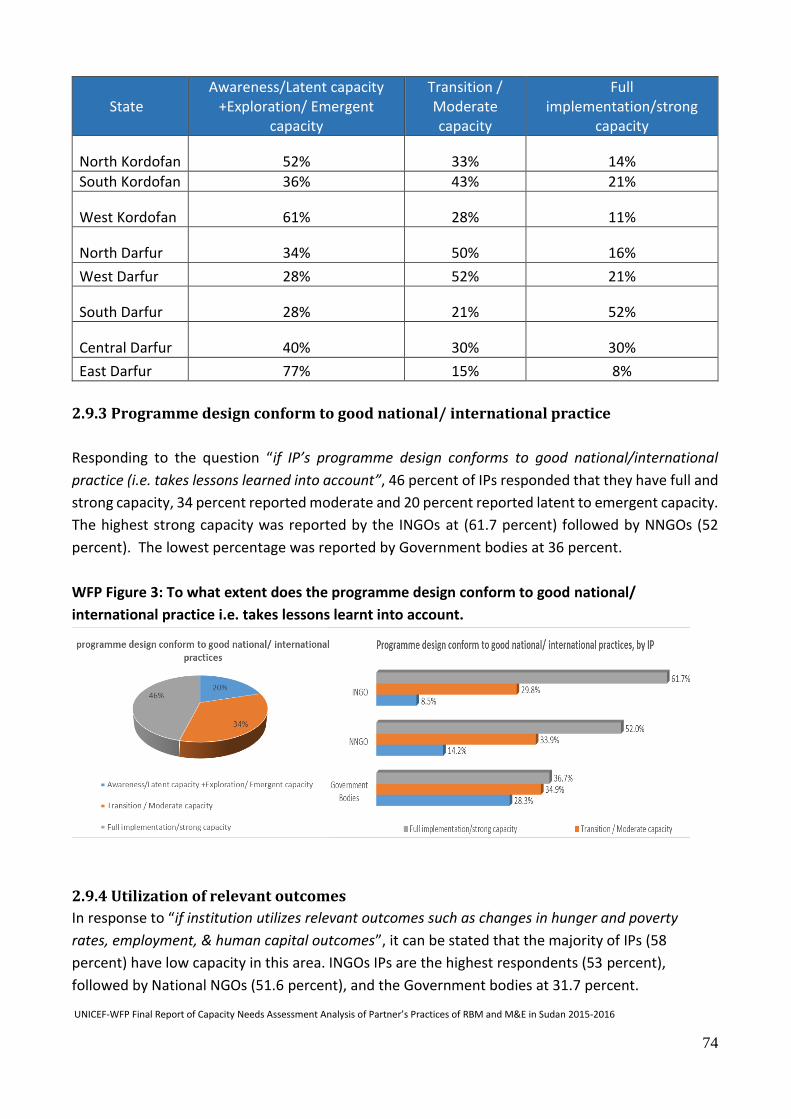
UNICEF-WFP Final Report of Capacity Needs Assessment Analysis of Partner’s Practices of RBM and M&E in Sudan 2015-2016
74
State Awareness/Latent capacity
+Exploration/ Emergent capacity
Transition / Moderate capacity
Full implementation/strong
capacity
North Kordofan 52% 33% 14%
South Kordofan 36% 43% 21%
West Kordofan 61% 28% 11%
North Darfur 34% 50% 16%
West Darfur 28% 52% 21%
South Darfur 28% 21% 52%
Central Darfur 40% 30% 30%
East Darfur 77% 15% 8%
2.9.3 Programme design conform to good national/ international practice
Responding to the question “if IP’s programme design conforms to good national/international
practice (i.e. takes lessons learned into account”, 46 percent of IPs responded that they have full and
strong capacity, 34 percent reported moderate and 20 percent reported latent to emergent capacity.
The highest strong capacity was reported by the INGOs at (61.7 percent) followed by NNGOs (52
percent). The lowest percentage was reported by Government bodies at 36 percent.
WFP Figure 3: To what extent does the programme design conform to good national/
international practice i.e. takes lessons learnt into account.
2.9.4 Utilization of relevant outcomes
In response to “if institution utilizes relevant outcomes such as changes in hunger and poverty
rates, employment, & human capital outcomes”, it can be stated that the majority of IPs (58
percent) have low capacity in this area. INGOs IPs are the highest respondents (53 percent),
followed by National NGOs (51.6 percent), and the Government bodies at 31.7 percent.

UNICEF-WFP Final Report of Capacity Needs Assessment Analysis of Partner’s Practices of RBM and M&E in Sudan 2015-2016
75
Figure 4: To what extent does your institution utilize relevant outcomes, such as changes in
hunger and poverty rates, employment, human capital outcomes etc?
2.9.5 Funding from international organizations.
In response to “if institution assesses the proportion of funding from international organizations and
they have international & national funding components, and the international component is being
followed up, reported on and liquidated properly in reports”, only 32 percent of the IPs replied that
they are strong in receiving international funding, and reporting on it properly, and 29 percent are
at a moderate level and 39 percent are at the latent/emergent level.
WFP Figure 5: To what extent does your institution assess and report on the proportion of
funding from international organizations
2.9.6 Rules governing financial management
In response to the question; “To what extent are there rules of institution governing financial
management”, it is clear that 34 percent of the IPs reported transitional capacity, and the same
percentage was reported latent to emergent capacity. Only 32 percent reported full implementation
of this capacity.

UNICEF-WFP Final Report of Capacity Needs Assessment Analysis of Partner’s Practices of RBM and M&E in Sudan 2015-2016
76
The governmental IPs have reported that they are mostly having latent capacity in terms of existing
rules that govern financial management.
WFP Figure 6.a, and Figure 6.b below; show the distribution of percentages by assessment
categories and by states
As seen in Figure 6.c (Rules Governing financial management, by state ), the result indicates that
Gadarif is the highest in latent/emergent capacities in rules governing financial management with
92 percent, followed by Gezira state (89 percent) and West Kordofan (76 percent).

UNICEF-WFP Final Report of Capacity Needs Assessment Analysis of Partner’s Practices of RBM and M&E in Sudan 2015-2016
77
2.9.7 Impact Measurement
A question about measurement of impact was asked to UNICEF/WFP implementing partners, and
only 25 percent of the IPs reported a full implementation and strong capacity in this area. Some 36
percent of the IPs are still at Latent capacity or Emergent capacity. This points to a real need to invest
more in capacity building to ensure that good orientation and understanding of Impact measurement
is in place.
Figure 7.a below, shows distribution of percentages of IP capacities in conducting impact
measurement.
International NGOs show the highest reporting of impact measurement (42 percent), followed by
National NGOs (32 percent) and lastly, the Government counterpart with (20 percent). This capacity
is very critical and it needs to be developed and improved in a continuous manner at Government
bodies; where the country priorities of the programs and projects are determined and endorsed. The
measurement of impact at this level should be taken a step forward to make sure that it will be one
of the main focus areas for a capacity building plan.
For state reported data, more attention needs to be given to West Kordofan, Gezira and Gadarif
states, as their data shows the highest percentages of IPs that are still at latent/emergent capacities
in measurement of impact.
Governmentbodies
NNGO
INGO
42%
19%
11%
38%
49%
47%
20%
32%
42%
WFP Figure 7.b: Impact Measurement , by IP
Full implementation/strong capacity Transition / Moderate capacity

UNICEF-WFP Final Report of Capacity Needs Assessment Analysis of Partner’s Practices of RBM and M&E in Sudan 2015-2016
78
Figure 7.c below, shows the distribution of latent/emergent capacities by state
2.9.8 Funding Stability
Stability of funding of programs and the projects was one of the areas that was assessed by this
exercise. The majority of Implementing Partners (54 percent) revealed that they have issues related
to instability of funding, which is something that affects the continuous provision of services. Of the
Government counterparts, 60 percent mentioned constraints in having a stable fund for the program
and project, followed by the National NGOs (52 percent), and international NGOs (32 percent).
Raising the National capabilities in fundraising is one of the most important areas to be considered
in the next step for more strategies and sustainable results.

UNICEF-WFP Final Report of Capacity Needs Assessment Analysis of Partner’s Practices of RBM and M&E in Sudan 2015-2016
79
Figure 8.a below, shows the percentage of funding stability by Implementing Partner
Figure 8.b, shows the percentage of funding instability by state. The highest percentage of IPs who
reported instability of funds is in Sinnar state (100 percent); followed by Northern state (89 percent)
and West Kordofan (78 percent).
The funding situation in North Darfur, South Darfur, Kassala, West Darfur and River Nile, is better in
comparison with other states.

UNICEF-WFP Final Report of Capacity Needs Assessment Analysis of Partner’s Practices of RBM and M&E in Sudan 2015-2016
80
CHAPTER 3: CONCLUSIONS AND RECOMMENDATIONS
3.1: Lesson learned
Key lessons learned from the capacity need assessment of partners on the practice of Results-Based Management and Monitoring and Evaluation in Sudan, are as follows: Understanding the Inter-linkages and dependence between Planning, Monitoring and Evaluation and thus Results-Based Management (RBM); 1. Without proper planning and clear articulation of intended results, it is not clear what should be monitored and how; hence monitoring cannot be done well. 2. Without effective planning (clear results chain frameworks) the basis for evaluation tools will be very weak; hence evaluation of the programs cannot be done well. 3. Without careful and close monitoring, the necessary data is not collected; hence evaluation cannot be done well.
4. Monitoring is necessary but not sufficient for evaluation. Monitoring facilitates evaluation, but evaluation uses additional new data collection and different frameworks for analysis.
5. Monitoring and evaluation of a programme will often lead to changes in programme plans. This may mean further changes or modifying data collection for monitoring purposes.
UNICEF/WFP Implementing partners are the same for most if not all the other UN agencies, and other development agents in the field of development and humanitarian investments. By upgrading their abilities and capacities in planning, M&E/RBM, UNICEF and WFP will be building a robust infrastructure for the whole of Sudan in general and within UNICEF in particular. Since it is important and critical to create a mass of planning, M&E and RBM experts to support and embed performance management practice at all levels within the UNICEF/WFP Partners, the following actions are required:
3.2. RECOMMENDATIONS TO GOVERNMENT
1. Develop one National Monitoring and Evaluation plan, and pool all resources in one place for an integrated implementation. 2. Move towards a culture of managing for results practice: the Governmental, NNGOs, and INGOs entities should seek to create a culture of managing for results, and treat institutional capacity building on results‐based management/M&E as a strategic investment to improve organizational performance rather than only budgeting for it. 3. Equip leaders/Managers within IPs with the tools and knowledge to manage for results and own their results: putting in place systematic tools and more effective leadership and management

UNICEF-WFP Final Report of Capacity Needs Assessment Analysis of Partner’s Practices of RBM and M&E in Sudan 2015-2016
81
training strategies is critical to ensure that managers and Officers are better equipped to provide results driven leadership, own their results and help ensure long‐term performance sustainability. 4. Treat M&E staff development as a strategic investment: The management for results is based on change which is requesting practitioners of RBM/M&E to act as “Change Agents” and have unique skills, competencies and proper orientation on management and monitoring for results.
5. Encourage a more integrated and functional M&E at all levels: building capacity for RBM/M&E at all levels requires giving clear strategic direction and strong support from senior management.
6. Do better with existing M&E staff, tools and materials: there is a need to take a more systematic approach to M&E training for all categories of personnel in order to improve learning of M&E methodologies, and systematically apply standard M&E tools across all sectors.
7. Focus on training outcomes, measurements and reporting : to support the strategic investment in M&E training, it is crucial to assess and evaluate the actual impact of M&E training and practice. The RBM/M&E training provided should not be viewed as a final stage but rather as a first step toward the development of senior government and NGOs/CBOs officials and other staff in terms of M&E capacity‐building.
Managing for results (RBM) practice: Investments should be made to raise the capacity
building of the M&E staffs regarding the RBM and M&E practices in addition to restructuring the
government strategic plan in order to include this practice at all levels.
3.3 RECOMMENDATIONS TO PARTNERS
1. Establish and support systems for data collection and data analysis at the community level 2. Utilize regular meetings (monthly, quarterly and annually) to review the program and project performance and adjust if needed 3. Establish electronic systems to post questions, technical information and assistance needs that can facilitate knowledge sharing and exchange 4. Organize cross-level (federal, state and locality) learning processes, such as workshops and retreats to take stock and analyze results 5. Use stakeholder’s events as an opportunity for dissemination of successful initiatives and practices 6. Upgrade capacity of Logical framework development and utilization 7. Upgrade capacity on M&E/RBM analysis and reporting, M&E/RBM planning and budgeting, planning and programme development and streamlining M&E/RBM with national strategic plan

UNICEF-WFP Final Report of Capacity Needs Assessment Analysis of Partner’s Practices of RBM and M&E in Sudan 2015-2016
82
8. Upgrade capacity of development of monitoring check lists, tools that can be utilized in data collection and analysis 9. Upgrade capacity of reporting and reports flow and formats 10. Upgrade capacity of feedback reporting and review/adjustment of implementation plan 11. Upgrade capacity of Implementation schedule/matrix development 12. Upgrade capacity of budget development and proper resources utilization 13. Ensure the fostering of senior-level leadership from all organizations with national actors playing a major lead in results-based management
14. Promote and support a results-based culture with regards to:
Demand for results-based information
Supporting the National system
Results-based accountability system
Fostering the habit of learning and adjustment
Creating and adopting clear roles and responsibilities for M&E and RBM 15. Upgrade capacity of building results frameworks with clearly defined ownership on the part of national actors at all levels, and the contribution roles for all stakeholders clearly agreed upon 16. Upgrade capacity of development of user friendly RBM information systems 17. Upgrade capacity of using results information for learning, decision-making, managing, as well as for reporting and accountability 18. Upgrade capacity of building an adaptive RBM regime through regular review and updating of frameworks. This can be done through: 19. Arrangements for routine collection of monitoring data, based on indicators identified in the
logical framework 20. Setting a standardized baseline to gauge change over time in indicators identified in the logical framework 21. Arrangement for periodic evaluation data collection, based on indicators identified in the logical framework and including how, when, and by whom data will be collected, analyzed and reported

UNICEF-WFP Final Report of Capacity Needs Assessment Analysis of Partner’s Practices of RBM and M&E in Sudan 2015-2016
83
3.4 RECOMMENDATIONS TO UN AGENCIES
After devising and operationalizing the M&E/RBM Capacity Building Plan (CBP) in a participatory manner with all stakeholders such as the line Ministries, UN Agencies, NGOs, CBOs, Academia, Donors and other players in the field, to train the IPs on the practice of M&E/RBM and then follow up on: 1. UN agencies should in the short term organize comprehensive workshop trainings on
results-based management to all of their Government counterparts and NGOs at federal and state
levels (both humanitarian and development partners); the establishment of a systematic reporting
template for results-based monitoring is required
2. UNDP and WB and partners should organize training of Government counterparts and
NGOs on results-based budget planning and public financial management
3. Funding Partners and UN agencies should provide joint technical and financial support for
capacity development on Monitoring and Evaluation and the operationalization by Government of
a systematic sector coordination mechanism; Joint efforts should assist the Ministry of International
Cooperation to develop an adequate results-focused report format that will be implemented by all
Line Ministries and states and to ensure the high quality reporting for results using sound evidence
4. Partners in development/UN agencies should provide technical and financial support to the
Central Bureau of Statistics in establishing a sector coordination platform for statistics co-lead by
CBS and one Donor around the national strategy of development of Statistics in Sudan: multiyear
and annual operational plan of key national Household Surveys, Statistical activities must be
developed and monthly meetings of all donors in support to Statistics must be organized.
5. A Joint partnerships of UNFPA, UNICEF, WFP and UNDP and partners should be established
in order to ensure the funding of bursaries for the Master Diploma training of Students in
Demography and Statistics for the CBS and Sector MIS in strengthening capacity for the monitoring
of SDG, PRSP, sector Strategic Plan. The availability of a critical mass of experts on Demography and
Statistics is important for preparation of the forthcoming National Population Census 2018, MICS
2019, Food Vulnerability Assessment and the enhancing of availability of the annual statistical MIS
report. Support for capacity building related to secondary data analysis of national household survey
will be very useful to generate sound evidence on main issues of children and vulnerable populations.
6. A national network on sharing best practices and knowledge of M&E and the use of data
for strategic planning and decision-making should be established and co-led by one national NGO
and the Ministry of International Cooperation and the CBS, that will contribute in building the culture
of evaluation and accountability for results.

UNICEF-WFP Final Report of Capacity Needs Assessment Analysis of Partner’s Practices of RBM and M&E in Sudan 2015-2016
84
Annexes
Annex I- TORs
…
Annex II- Questionnaires
…
Annex III- List of implementing partners
…
Annex IV-Computation Tables