
Capacity Building for Humanitarian, Aid & Disaster Recovery Operations
Upload
truongminhCategory
view
213download
0
Introduction to Operations Management - IB MahadevanWeek 2
© All Rights Reserved, Indian Institute of Management Bangalore
Capacity Issues in Operations
Section 2, Sub-section 2.1

Introduction to Operations Management - IB MahadevanWeek 2
© All Rights Reserved, Indian Institute of Management Bangalore
Module 1 Highlights…
• Three broad flow patterns in the overall configuration of manufacturing & service organizations
– Streamlined flow
– Intermittent flow
– Jumbled flow
• Complexity of Operations Management varies on account of these differences
• It is important to choose appropriate measures for operations so that we can increase the propensity to succeed in the market

Introduction to Operations Management - IB MahadevanWeek 2
© All Rights Reserved, Indian Institute of Management Bangalore
Options for Improving Operations…
Improving the operations requires addressing some of the core aspects of operations.
• Capacity in the system
• Productivity Initiatives
• Supply Chain choices that we need to make
• Quality Assurance in Operations

Introduction to Operations Management - IB MahadevanWeek 2
© All Rights Reserved, Indian Institute of Management Bangalore
The Notion of Capacity in organizations
Section 2, Sub-section 2.2

Introduction to Operations Management - IB MahadevanWeek 2
© All Rights Reserved, Indian Institute of Management Bangalore
Some examples of capacity in organizations
• Associated Cements Corporation (ACC) has an installed capacity of 17.65 million tons.
• Bharat Petroleum Corporation Limited (BPCL) has a refining capacity of 260,000 barrels of crude every day.
• Recently Tata Consultancy Services (TCS), India's leading software firm announced that it will double its capacity at its largest delivery center, Hyderabad, with an addition of 28,000 employees over a period of three to four years.

Introduction to Operations Management - IB MahadevanWeek 2
© All Rights Reserved, Indian Institute of Management Bangalore
Importance of Capacity
Capacity and its relationship to competitiveness of business firms.
• In the Executive health check-up unit in a multi-specialty hospital many people wait in the system for their turn and some may choose to post-pone or abandon the idea.
• Firms find it difficult to deliver products and services on the promised date simply because of a huge backlog in customer orders.
• In a manufacturing shop floor components pile up in front of some machines while some other machines downstream starve for want of components for processing.

Introduction to Operations Management - IB MahadevanWeek 2
© All Rights Reserved, Indian Institute of Management Bangalore
Importance of Capacity (cont.)
• When capacity choices have not been made appropriately it can result in:
– Market share loss
– Loss of goodwill
– Customer dissatisfaction etc.

Introduction to Operations Management - IB MahadevanWeek 2
© All Rights Reserved, Indian Institute of Management Bangalore
Definition of Capacity
Capacity directly relates to the quantum of these resources that an operating system has:
• In the case of a garment manufacturer the number of cutting and sewing machines, the number of people employed in the shop for production, quality assurance etc. will all determine the capacity of the system.
• In a restaurant the number of dining spaces, the capacity of various machines used for cooking, the number of servers and chefs, availability of utensils, plates, cups etc. will all determine the capacity in the system.
• It also denotes the maximum output of products and services one can achieve using these resources.

Introduction to Operations Management - IB MahadevanWeek 2
© All Rights Reserved, Indian Institute of Management Bangalore
Measuring Capacity
Capacity is measured in two ways in any organization:
• On the basis of output: An automobile manufacturer such as Toyota will measure capacity on the basis of daily production of vehicles, say 20,000 vehicles per day.
• In terms of input resources: A software service provider or a management consulting firm can measure capacity in terms of the number of professionals that they have.

Introduction to Operations Management - IB MahadevanWeek 2
© All Rights Reserved, Indian Institute of Management Bangalore
Process Design & Capacity Analysis
Section 2, Sub-section 2.3

Introduction to Operations Management - IB MahadevanWeek 2
© All Rights Reserved, Indian Institute of Management Bangalore
Capacity Planning Issues
What is of interest to us are the following:
• How do these multiple resources in an operating system eventually determine the capacity of the system?
• How do they affect the outcomes and customer oriented measures such as output, and delivery promises?
• How to make an assessment of the capacity in my organization?
• What kind of data are required in order to estimate the capacity in an organization?

Introduction to Operations Management - IB MahadevanWeek 2
© All Rights Reserved, Indian Institute of Management Bangalore
Capacity Planning IssuesA Healthcare example
• Issues affecting capacity in a typical hospital:
– Doctors, para-medical staff who are involved in the treatment of the patients.
– The hospital uses certain equipments, diagnostic gadgets such as scanners.
– The hospital may also have a certain number of waiting spaces, operating theaters etc.
• Given a certain number of each of these resources,
– How it will affect the outcome in terms patient waiting, residence time in the hospital?
– These are determined by the design of the process deployed to deliver health care.

Introduction to Operations Management - IB MahadevanWeek 2
© All Rights Reserved, Indian Institute of Management Bangalore
Process Analysis
Process Analysis is a method by which:
• We can incorporate details pertaining to resources and other process related data.
• Use some logic to analyze these aspects pertaining to the capacity in the system.

Introduction to Operations Management - IB MahadevanWeek 2
© All Rights Reserved, Indian Institute of Management Bangalore
Process Analysis Building Blocks
1. Activities: These are the building blocks that make up a process – let us look at one manufacturing and one service example to understand this.
2. Technological & Logical Constraints: Dictates the order in which the steps are carried out. This is important because only then we will know the flow of activities.

Introduction to Operations Management - IB MahadevanWeek 2
© All Rights Reserved, Indian Institute of Management Bangalore
Activities & Process Constraints: The Case of Shirt Manufacturing
Cut
Attach S Sew HemAttach Co
Collar Sleeve Front Back ShoulderCuff
Iron Fold & PackInspect

Introduction to Operations Management - IB MahadevanWeek 2
© All Rights Reserved, Indian Institute of Management Bangalore
Activities & Process Constraints: The Case of Insurance Services
Review
Request
Under
WritingRating
Policy
Writing

Introduction to Operations Management - IB MahadevanWeek 2
© All Rights Reserved, Indian Institute of Management Bangalore
Process AnalysisBuilding Blocks
3. Process time for each activity: This is going to give us an idea of the extent to which resources are consumed in each activity.
4. Resources available: May include the skills of labor, types of machines, special storages, fixtures, other tools, computers etc.

Introduction to Operations Management - IB MahadevanWeek 2
© All Rights Reserved, Indian Institute of Management Bangalore
Process Times & Resource Availability: The Case of Shirt Manufacturing
No. Operation Process time/shirt (min)
1 Cutting 1.25
2 Make collar 1.48
3 Make cuffs 0.50
4 Make Sleeves 2.30
5 Make front 1.41
6 Make back 2.45
7 Join Shoulders 0.33
8 Attach collar 1.45
9 Attach Sleeves 1.38
10 Sew side seam 1.45
11 Hem Bottom 1.42
12 Inspect 2.35
13 Iron 0.48
14 Fold, Package 1.45
For example, we may have 3 cutting machines, 12 sewing machines, 7 labor in each stage of stitching the shirt, 6 inspector and so on…

Introduction to Operations Management - IB MahadevanWeek 2
© All Rights Reserved, Indian Institute of Management Bangalore
Process Times & Resource Availability: The Case of Insurance Services
Review
Request
Under
WritingRating
Policy
Writing
35 mins 26 mins 70 mins 45 mins
(4) (2) (6) (5)
Number of people for under writing
Introduction to Operations Management - IB MahadevanWeek 2
© All Rights Reserved, Indian Institute of Management Bangalore
Process Analysis FundamentalsSummary
The basic information required for process and capacity analysis:
• Activities that make up a process
• Technological & Logical Constraints
• Process Times
• Resources available at each stage of processing

Introduction to Operations Management - IB MahadevanWeek 2
© All Rights Reserved, Indian Institute of Management Bangalore
Process Analysis Toy Manufacturing Example
A toy manufacturer receives crafted toys from local carpenters and performs the final operations before stocking it for sale. The process consists of five steps.
• Step 1: Arrange a set of four toys in a pallet (8 minutes).
• Step 2: The pallet moves to the next station where the toys are pre-treated (12 Minutes).
• Step 3: Send it to the spray-painting chamber, where it is painted as per the specifications (there is one spray-painting machine) (20 minutes).
• Step 4: It is left in an open area for drying (10 minutes).
• Step 5: The toys are inspected and packed (5 minutes).
Source: Mahadevan , B. (2015), “Operations Management: Theory & Practice, Pearson Education, 3rd Edition, pp 186 – 189.

Introduction to Operations Management - IB MahadevanWeek 2
© All Rights Reserved, Indian Institute of Management Bangalore
Process Analysis Toy Manufacturing Example (Process Flow Diagram)
Prepare8 mins
Pre-treat12 mins
Paint20 mins
Dry10 mins
Inspect &Pack
5 mins
55 minutes
Source: Mahadevan, B. (2015), “Operations Management: Theory & Practice”, Pearson Education, 3rd Edition, pp 186.

Introduction to Operations Management - IB MahadevanWeek 2
© All Rights Reserved, Indian Institute of Management Bangalore
Process Analysis Throughput or Lead Time
The measure 55 minutes is the throughput time or manufacturing lead time for the process.
• There is no way we will be able to roll out a batch of toys before 55 minutes from the time we started.
• This is the response time for a rush order assuming we have nothing in stock.
• organizations need to know this number so that they can make meaningful promise to the customer as to how soon an emergency requirement could be met.
Introduction to Operations Management - IB MahadevanWeek 2
© All Rights Reserved, Indian Institute of Management Bangalore
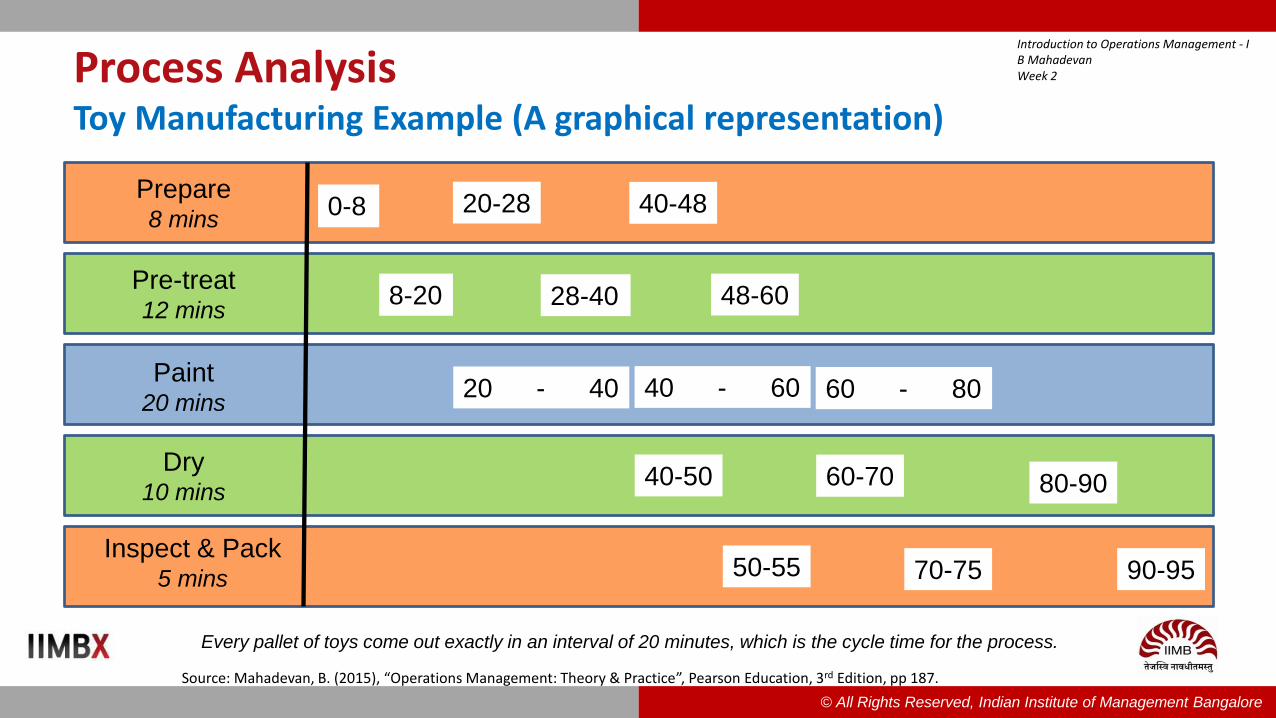
Process Analysis Toy Manufacturing Example (A graphical representation)
Prepare8 mins
Pre-treat12 mins
Paint 20 mins
Dry10 mins
Inspect & Pack5 mins
0-8
8-20
20-28 40-48
28-40 48-60
20 - 40 40 - 60 60 - 80
80-90
90-95
40-50 60-70
70-7550-55
Every pallet of toys come out exactly in an interval of 20 minutes, which is the cycle time for the process.
Source: Mahadevan, B. (2015), “Operations Management: Theory & Practice”, Pearson Education, 3rd Edition, pp 187.

Introduction to Operations Management - IB MahadevanWeek 2
© All Rights Reserved, Indian Institute of Management Bangalore
Process Analysis Cycle Time & Bottleneck
• The measure 20 minutes is known as cycle time.
– If we manufacture these toys continuously, we will notice that a batch of toys will come out of the system every 20 minutes.
• The stage of processing which determines the cycle time controls the output from the system.
– In our example, the painting station dictates the output from the system. This is known as the bottleneck in the system.

Introduction to Operations Management - IB MahadevanWeek 2
© All Rights Reserved, Indian Institute of Management Bangalore
Process Analysis Toy Manufacturing Example (Summary of key measures)
Prepare8 mins
Pre-treat12 mins
Paint20 mins
Dry10 mins
Inspect &Pack
5 mins
• The throughput time for the process is 55 minutes.
• Cycle time is 20 minutes. The implication of this is that when the process operates in a
continuous manner, a pallet of finished toys come out every 20 minutes.
• The spray painting is the bottleneck in the process.
Source: Mahadevan, B. (2015), “Operations Management: Theory & Practice”, Pearson Education, 3rd Edition, pp 186.

Introduction to Operations Management - IB MahadevanWeek 2
© All Rights Reserved, Indian Institute of Management Bangalore
Process Analysis Some more measures of Interest
• What is the daily output of this toy manufacturing process if they have 8 hours working schedule?
• What is the utilization of each work station?
• What is the idle time in each work station?

Introduction to Operations Management - IB MahadevanWeek 2
© All Rights Reserved, Indian Institute of Management Bangalore
Process Analysis Toy Manufacturing Example (Station Output)
Prepare8 mins
Pre-treat12 mins
Paint20 mins
Dry10 mins
Inspect &Pack
5 mins
7.5 pallets/hr 5 pallets/hr 3 pallets/hr 12 pallets/hrNot relevant
The capacity calculation at “Dry” is not meaningful. This is called a non-capacity constrained resource.
Source: Mahadevan, B. (2015), “Operations Management: Theory & Practice”, Pearson Education, 3rd Edition, pp 188.

Introduction to Operations Management - IB MahadevanWeek 2
© All Rights Reserved, Indian Institute of Management Bangalore
Process Analysis Toy Manufacturing Example (Process Utilizations)
Prepare8 mins
Pre-treat12 mins
Paint20 mins
Dry10 mins
Inspect &Pack
5 mins
7.5 pallets/hour 5 pallets/hour 3 pallets/hour 12 pallets/hourNot relevant
Station Station Output per hour
Line Output per hour
Utilization
Prepare 7.5 3.0 3.0/7.5 = 40%
Pre-Treat 5.0 3.0 3.0/5.0 = 60%
Paint 3.0 3.0 3.0/3.0 = 100%
Dry Not Relevant
Inspect & Pack 12.0 3.0 3.0/12.0 = 25%
Source: Mahadevan, B. (2015), “Operations Management: Theory & Practice”, Pearson Education, 3rd Edition, pp 188.

Introduction to Operations Management - IB MahadevanWeek 2
© All Rights Reserved, Indian Institute of Management Bangalore
Process Analysis Toy Manufacturing Example (Station Idle Times)
Prepare8 mins
Pre-treat12 mins
Paint20 mins
Dry10 mins
Inspect &Pack
5 mins
7.5 pallets/hour 5 pallets/hour 3 pallets/hour 12 pallets/hourNot relevant
Station Cycle Time (min) Station ProcessTime (min)
Idle Time (min)
Prepare 20 8 12
Pre-Treat 20 12 8
Paint 20 20 0
Dry Not Relevant
Inspect & Pack 20 5 15
Source: Mahadevan, B. (2015), “Operations Management: Theory & Practice”, Pearson Education, 3rd Edition, pp 188.

Introduction to Operations Management - IB MahadevanWeek 2
© All Rights Reserved, Indian Institute of Management Bangalore
Capacity Estimation & Debottlenecking
Section 2, Sub-section 2.4

Introduction to Operations Management - IB MahadevanWeek 2
© All Rights Reserved, Indian Institute of Management Bangalore
Process Analysis Toy Manufacturing Example (Additional Information)
Let us include some more information pertaining to our toy manufacturing example.
• The Preparation stage has two parts to it:
– Part 1 is to set up the pallets, which takes 4 minutes.
– Part 2 is arranging a set of four toys into each pallet, which takes 4 minutes per pallet.
• Further, the painting booth can hold up to 3 pallets at a time.

Introduction to Operations Management - IB MahadevanWeek 2
© All Rights Reserved, Indian Institute of Management Bangalore
Process Analysis Toy Manufacturing Example (Options for Increasing the output)
There are two choices to improve the output from the system:
• Adding more units of capacity at the stations to increase the output.
• Increasing the number of pallets processed at a time from one up to a maximum of three (because the paint booth can accommodate that many).

Introduction to Operations Management - IB MahadevanWeek 2
© All Rights Reserved, Indian Institute of Management Bangalore
Process Analysis Toy Manufacturing Example (Impact of 2 painting booths)
Scenario 1: Batch Size of the Process = 1 pallet, 2 painting units
Prepare(8 mins)
7.5 pallets/hour
Pre-treat(12 mins)
5 pallets/hour
Paint(20 mins)
3 pallets/hour
DryInspect & Pack
(5 mins)12 pallets/hour
Prepare(8 mins)
7.5 pallets/hour
Pre-treat(12 mins)
5 pallets/hour
Paint(20 mins)
3 pallets/hourDry
Inspect & Pack(5 mins)
12 pallets/hour
Existing Scenario: Batch Size of the Process = 1 pallet, 1 painting booth
Paint(20 mins)
3 pallets/hour

Introduction to Operations Management - IB MahadevanWeek 2
© All Rights Reserved, Indian Institute of Management Bangalore
Process Analysis Impact of Debottlenecking option
The output did not double when we added the second painting booth. In fact the line output went up from 3 to 5 only.
• Bottleneck shifted out of Painting. Pre-treatment now becomes the bottleneck. This is known as wandering bottleneck.
• This has important implication in investment justification when new capacity is added at a bottleneck station.
• We may not be able to calculate the net increase in production unless we locate where the new bottleneck is.

Introduction to Operations Management - IB MahadevanWeek 2
© All Rights Reserved, Indian Institute of Management Bangalore
Process Analysis Toy Manufacturing Example (Impact of Policy Changes)
• It is also important to know that certain operating policies can help us alter the output from the system.
• In our example, it is possible to accommodate up to 3 batches of pallets in the paint booth.
• Therefore, we shall increase the pallets processed at the painting booth and see its impact on output.

Introduction to Operations Management - IB MahadevanWeek 2
© All Rights Reserved, Indian Institute of Management Bangalore
Process Analysis Toy Manufacturing Example (Impact of Policy Changes)
Prepare(8 mins)
7.5 pallets/hour
Pre-treat(12 mins)
5 pallets/hour
Paint(20 mins)
3 pallets/hour
DryInspect & Pack
(5 mins)12 pallets/hour
Existing Scenario: Batch Size of the Process = 1 pallet
Scenario 1: Batch Size of the Process = 2 pallets
Prepare(4+ (2*4) =
12 mins)10 pallets/hour
Pre-treat(12 mins)
5 pallets/hour
Paint(20 mins)
6 pallets/hourDry
Inspect & Pack(5 mins)
12 pallets/hour
Scenario 2: Batch Size of the Process = 3 pallets
Prepare(4+ (3*4) =
16 mins)11.25 pallets/hour
Pre-treat(12 mins)
5 pallets/hour
Paint(20 mins)
9 pallets/hour
DryInspect & Pack
(5 mins)12 pallets/hour
Source: Mahadevan, B. (2015), “Operations Management: Theory & Practice”, Pearson Education, 3rd Edition, pp 188.
Introduction to Operations Management - IB MahadevanWeek 2
© All Rights Reserved, Indian Institute of Management Bangalore
Process Analysis Impact of Policy Change Option
• The bottleneck shifted out of Painting. Pre-treatment now becomes the bottleneck.
• By changing the operating policy at the process, we have been able to increase the output from the line from 3 pallets per hour to 5 pallets per hour.

Introduction to Operations Management - IB MahadevanWeek 2
© All Rights Reserved, Indian Institute of Management Bangalore
Process Analysis Toy Manufacturing Example (Hybrid Option)
Hybrid Option: We can simultaneously implement operational policy change and capacity addition alternatives
• We shall add one more pre-treatment unit and,
• Also implement a policy of processing three pallets at a time

Introduction to Operations Management - IB MahadevanWeek 2
© All Rights Reserved, Indian Institute of Management Bangalore
Process Analysis Toy Manufacturing Example (Hybrid Option)
Scenario 1: Batch Size of the Process = 3 pallets, 2 pre-treatment units
Prepare(4+ (3*4) =
16 mins)
11.25 pallets/hour
Paint(20 mins)
9 pallets/hour
Pre-treat(12 mins)
5 pallets/hour
DryInspect & Pack
(5 mins)12 pallets/hour
Prepare(8 mins)
7.5 pallets/hour
Pre-treat(12 mins)
5 pallets/hour
Paint(20 mins)
3 pallets/hourDry
Inspect & Pack(5 mins)
12 pallets/hour
Existing Scenario: Batch Size of the Process = 1 pallet, 1 painting booth
Pre-treat(12 mins)
5 pallets/hour
Source: Mahadevan, B. (2015), “Operations Management: Theory & Practice”, Pearson Education, 3rd Edition, pp 189.

Introduction to Operations Management - IB MahadevanWeek 2
© All Rights Reserved, Indian Institute of Management Bangalore
Process Analysis Toy Manufacturing Example (Summary of Findings)
• When we added one more painting booth, the capacity went up from 3 pallets per hour to 5 pallets per hour.
• We could have achieved the same increase in output by avoiding the capacity investment and instead changing the operating policy.
• When we used a combination of both of these, the output could indeed go up to 9 pallets per hour.

Introduction to Operations Management - IB MahadevanWeek 2
© All Rights Reserved, Indian Institute of Management Bangalore
Process Analysis Toy Manufacturing Example (Key Inferences)
The above examples point to us certain important issues related to capacity improvement & addressing bottlenecks.
• Capacity is not increased merely by adding more units at the bottleneck stage.
• Process choices can also contribute to improving the output.
• A judicious combination can provide innovative options for organizations to increase their output at least cost of capacity addition.

Introduction to Operations Management - IB MahadevanWeek 2
© All Rights Reserved, Indian Institute of Management Bangalore
Capacity Estimation (Multiple Jobs)
Section 2, Sub-section 2.4
Introduction to Operations Management - IB MahadevanWeek 2
© All Rights Reserved, Indian Institute of Management Bangalore
Process Analysis in the case of Multiple JobsA Health Diagnostics Example (cont.)
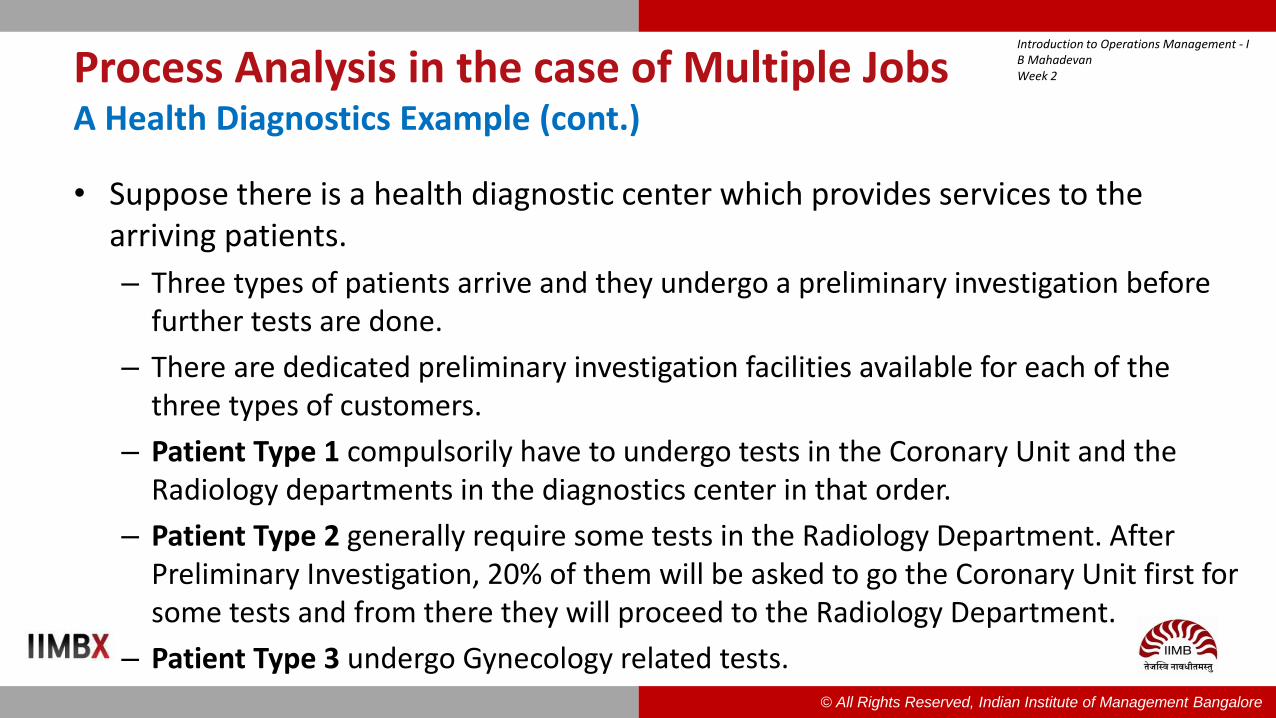
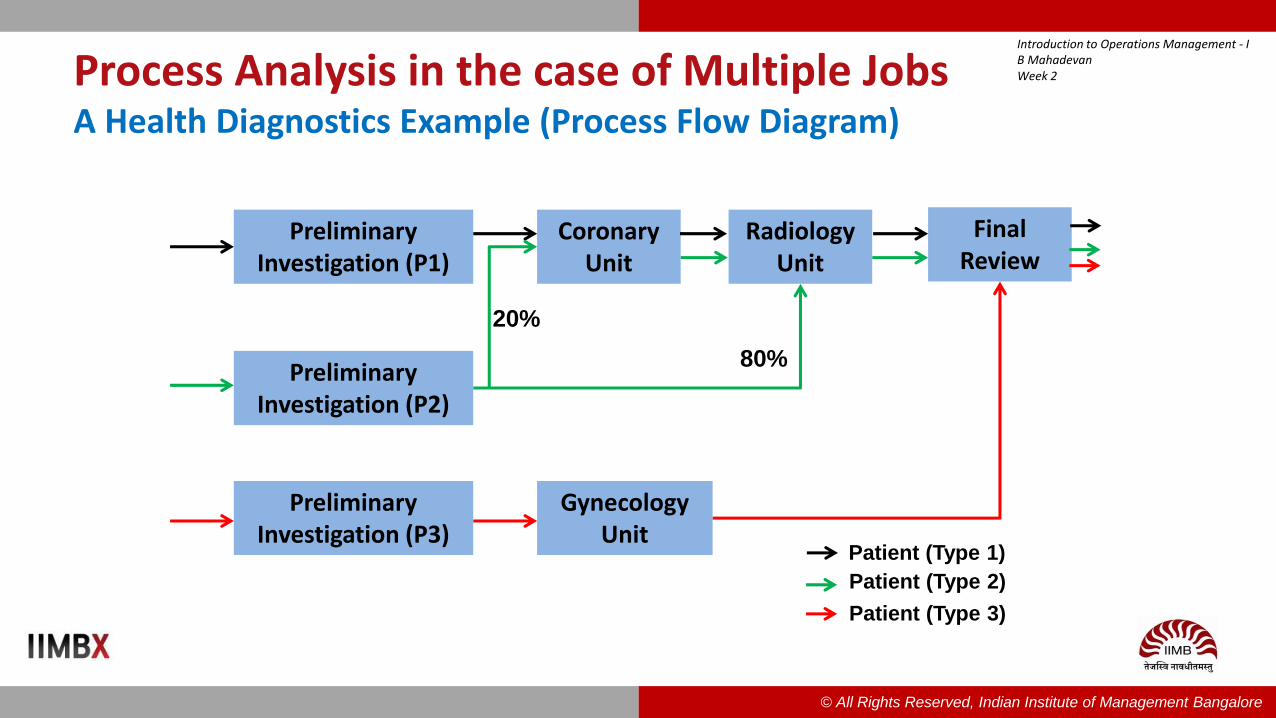
• Suppose there is a health diagnostic center which provides services to the arriving patients.
– Three types of patients arrive and they undergo a preliminary investigation before further tests are done.
– There are dedicated preliminary investigation facilities available for each of the three types of customers.
– Patient Type 1 compulsorily have to undergo tests in the Coronary Unit and the Radiology departments in the diagnostics center in that order.
– Patient Type 2 generally require some tests in the Radiology Department. After Preliminary Investigation, 20% of them will be asked to go the Coronary Unit first for some tests and from there they will proceed to the Radiology Department.
– Patient Type 3 undergo Gynecology related tests.

Introduction to Operations Management - IB MahadevanWeek 2
© All Rights Reserved, Indian Institute of Management Bangalore
Process Analysis in the case of Multiple JobsA Health Diagnostics Example
• After all tests are done, all the three types of patients visit a common facility in which a pool of doctors is available.
• One of the doctors meets with the patient, reviews the reports and provides further advice wherever required.
• Irrespective of the patient type, they meet any of the available doctor for this final review.
• Based on some historical trends, the diagnostic center expects the potential daily arrivals of the three patient types as follows:
– Patient Type 1: 100
– Patient Type 2: 200
– Patient Type 3: 220
Introduction to Operations Management - IB MahadevanWeek 2
© All Rights Reserved, Indian Institute of Management Bangalore
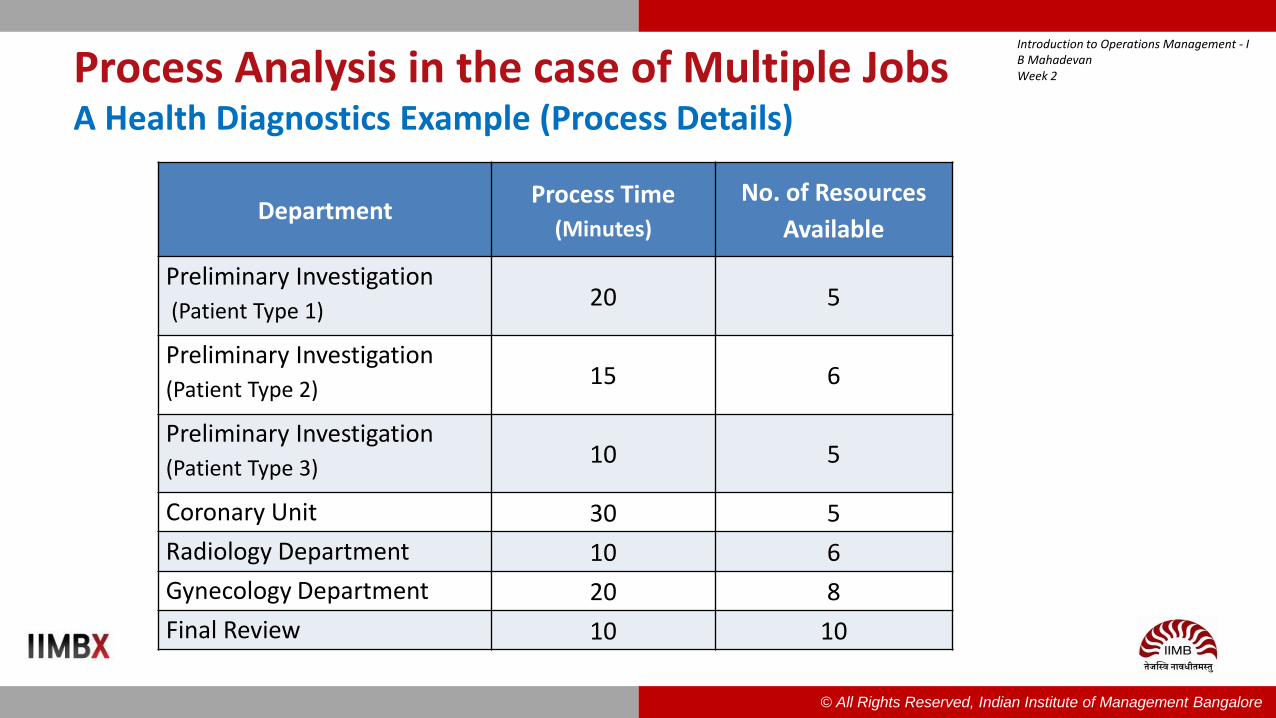
Process Analysis in the case of Multiple JobsA Health Diagnostics Example (Process Details)
DepartmentProcess Time
(Minutes)
No. of Resources
Available
Preliminary Investigation
(Patient Type 1)20 5
Preliminary Investigation
(Patient Type 2)15 6
Preliminary Investigation
(Patient Type 3)10 5
Coronary Unit 30 5
Radiology Department 10 6
Gynecology Department 20 8
Final Review 10 10
Introduction to Operations Management - IB MahadevanWeek 2
© All Rights Reserved, Indian Institute of Management Bangalore
Process Analysis in the case of Multiple JobsA Health Diagnostics Example (Process Flow Diagram)
Preliminary Investigation (P1)
Preliminary Investigation (P2)
Preliminary Investigation (P3)
Coronary Unit
Radiology Unit
Final Review
Gynecology Unit
20%
80%
Patient (Type 1)
Patient (Type 2)
Patient (Type 3)

Introduction to Operations Management - IB MahadevanWeek 2
© All Rights Reserved, Indian Institute of Management Bangalore
Process Analysis in the case of Multiple JobsA Health Diagnostics Example (Capacity Calculations)
Process StepProcess
Time (min)
Capacityper hour
per available resource
Number of Resources Available
Potential Daily
Station Output
Demand at the
Station
Actual Station Output
Preliminary Investigation (P1) 20 3 5 120 100 100
Preliminary Investigation(P2) 15 4 6 192 200 192
Preliminary Investigation(P3) 10 6 5 240 220 220
Coronary Unit 30 2 5 80 138.4 80
Radiology Department 10 6 6 288 233.6 233.6
Gynecology Department 20 3 8 192 220 192
Final Review 10 6 10 480 425.6 425.6

Introduction to Operations Management - IB MahadevanWeek 2
© All Rights Reserved, Indian Institute of Management Bangalore
Process Analysis in the case of Multiple JobsA Health Diagnostics Example (Inferences)
• Even though 520 patients can potentially make use of the diagnostic center services, the center can handle only 425.60 patients every day.
• There is a foregone opportunity on account of bottlenecks in the system.
– Coronary Unit is a bottleneck in the system as it controls the output of type 1 and type 2 patients coming into the system.
– Therefore, efforts to improve the system output will invariably need some capacity additions in this stage of the processing.
– The gynecology department constraints the flow of type 3 patients in the system as it is the bottleneck in the current state of the process.

Introduction to Operations Management - IB MahadevanWeek 2
© All Rights Reserved, Indian Institute of Management Bangalore
Process StepProcess
Time (min)
Capacityper hour
per available resource
Number of Resources Available
Potential Daily
Station Output
Demand at the
Station
Actual Station Output
Preliminary Investigation (P1) 20 3 5 120 100 100
Preliminary Investigation(P2) 15 4 6 192 200 192
Preliminary Investigation(P3) 10 6 5 240 220 220
Coronary Unit 30 2 6 96 138.4 96
Radiology Department 10 6 6 288 249.6 249.6
Gynecology Department 20 3 8 192 220 192
Final Review 10 6 10 480 441.60 441.60
Process Analysis in the case of Multiple JobsA Health Diagnostics Example (Output – 6 Coronary Units)

Introduction to Operations Management - IB MahadevanWeek 2
© All Rights Reserved, Indian Institute of Management Bangalore
Process Analysis in the case of Multiple JobsA Health Diagnostics Example (Output – 9 Coronary Units)
Process StepProcess
Time (min)
Capacityper hour
per available resource
Number of Resources Available
Potential Daily
Station Output
Demand at the
Station
Actual Station Output
Preliminary Investigation (P1) 20 3 5 120 100 100
Preliminary Investigation(P2) 15 4 6 192 200 192
Preliminary Investigation(P3) 10 6 5 240 220 220
Coronary Unit 30 2 9 144 138.4 138.4
Radiology Department 10 6 6 288 292 288.0
Gynecology Department 20 3 8 192 220 192
Final Review 10 6 10 480 480.00 480.00

Introduction to Operations Management - IB MahadevanWeek 2
© All Rights Reserved, Indian Institute of Management Bangalore
Process Analysis in the case of Multiple JobsA Health Diagnostics Example (Inferences)
• As more number of units are added to the coronary unit the wandering bottleneck phenomenon sets in.
• At a capacity of 9 in the coronary units, the bottleneck shifts to radiology department for the type 1 and type 2 patients.
• The output at the coronary unit can be increased not merely by adding more units.
• There may be other process choices and improvement opportunities which may bring down the process time and thereby increase the capacity.

Introduction to Operations Management - IB MahadevanWeek 2
© All Rights Reserved, Indian Institute of Management Bangalore
Capacity Estimation (Worker Paced Systems)
Section 2, Sub-section 2.4

Introduction to Operations Management - IB MahadevanWeek 2
© All Rights Reserved, Indian Institute of Management Bangalore
Capacity Estimation (Worker Paced Systems)
• Several situations in real life where the capacity decisions are made on the basis of certain targeted output from the operating system.
• Such systems are predominantly worker paced.
• Typically involve final assembly, finishing operations and delivery of the product or service to the customer.

Introduction to Operations Management - IB MahadevanWeek 2
© All Rights Reserved, Indian Institute of Management Bangalore
Capacity Estimation (Worker Paced Systems)Examples
• Maruti Suzuki Limited, India’s largest manufacturer of passenger cars produces about 1.35 million cars a year.
– Suppose Maruti works for 15 hours a day and 25 days a month.
– This would mean that every 12 seconds one car must roll out of its final assembly shop.
• Consider a fast food joint such as McDonalds or Hotel Saravana Bhavan.
– During peak hours, the number of customers that they need to serve is say 40 per hour.
– This would translate into a per customer serving time of 90 seconds.
• In both the above examples the operations must be aligned to this aspect.
• The number of workers required & the process design are determined on the basis of the targeted output from the system.

Introduction to Operations Management - IB MahadevanWeek 2
© All Rights Reserved, Indian Institute of Management Bangalore
Capacity Estimation (Worker Paced Systems)Fast Food Joint Example
• The food delivery section of a fast food joint needs to be designed for a targeted daily service rate of 320 customer orders.
• The restaurant works for 8 hours. Irrespective of variations in the customer order, the delivery of the food as per customer order follows a standardized process.
• With this information we need to design the process and address capacity related issues for meeting the targeted daily requirement of 320 customer orders.

Introduction to Operations Management - IB MahadevanWeek 2
© All Rights Reserved, Indian Institute of Management Bangalore
Capacity Estimation (Worker Paced Systems)Fast Food Joint Example (Activities & Process Times)
It consists of 8 steps, the details and process times are as follows:
1. Deconstruct the order and identify the ingredients for the order – 70 seconds.
2. Prepare the main dish as per the order – 80 seconds.
3. Prepare the topping/additives for the main dish – 40 seconds.
4. Obtain Delivery tray – 20 seconds.
5. Prepare the beverages as per the order – 40 seconds.
6. Microwave the main dish along with toppings – 30 seconds.
7. Dish out side dishes for the menu – 50 seconds.
8. Verify and Assemble the order and handover – 50 seconds.

Introduction to Operations Management - IB MahadevanWeek 2
© All Rights Reserved, Indian Institute of Management Bangalore
Capacity Estimation (Worker Paced Systems)Fast Food Joint Example (Precedence Constraints)
Identify Ingredients
PrepareMain Dish
Topping/Additives
DeliveryTray
PrepareBeverages
Micro-wave
Main Dish
Add
Side Dishes
AssembleVerify
Deliver

Introduction to Operations Management - IB MahadevanWeek 2
© All Rights Reserved, Indian Institute of Management Bangalore
Capacity Estimation (Worker Paced Systems)Fast Food Joint Example (Targeted Cycle Time)

Introduction to Operations Management - IB MahadevanWeek 2
© All Rights Reserved, Indian Institute of Management Bangalore
Capacity Estimation (Worker Paced Systems)Fast Food Joint Example (Minimum No. of workstations required)

Introduction to Operations Management - IB MahadevanWeek 2
© All Rights Reserved, Indian Institute of Management Bangalore
Capacity Estimation (Worker Paced Systems)Fast Food Joint Example (Design of Workstations)
PrepareMain Dish
Additives & Toppings
Delivery Tray
BeverageMicro-wave
Side Dishes
Deliver
70 80 40 20 40 30 50 50
Station 1 2 3 4 5
TasksPrepare Main Dish Additives &
Toppings, Micro-wave
Beverage, Side Dishes
Delivery Tray, Deliver
ProcessTime
70 80 40 + 30 = 70
40 + 50 = 90
20 + 50 =70
Idle Time 20 10 20 0 20
Utilization 70/90 = 77.78%
80/90 = 88.89%
77.78% 100% 77.78%

Introduction to Operations Management - IB MahadevanWeek 2
© All Rights Reserved, Indian Institute of Management Bangalore
Capacity Estimation (Worker Paced Systems)Fast Food Joint Example (Inferences)
• The most important requirement is that the cycle time of the station should not exceed 90 seconds.
• As long as we are able to accommodate precedence constraints, we can group the activities in any fashion.
• We may want to use practical considerations for grouping the tasks.
• This will have implications for skill level, training, the extent of imbalance across stations etc.

Introduction to Operations Management - IB MahadevanWeek 2
© All Rights Reserved, Indian Institute of Management Bangalore
Capacity Estimation (Worker Paced Systems)Fast Food Joint Example (Impact of increased Demand)
Suppose if the daily demand is likely to increase to 400 from the current level of 320.
𝑇𝑎𝑟𝑔𝑒𝑡𝑒𝑑 𝐶𝑦𝑐𝑙𝑒 𝑇𝑖𝑚𝑒 =8 ∗ 60 ∗ 60
400= 72 𝑠𝑒𝑐𝑜𝑛𝑑𝑠
𝑀𝑖𝑛𝑖𝑚𝑢𝑚 𝑁𝑜. 𝑜𝑓 𝑤𝑜𝑟𝑘𝑠𝑡𝑎𝑡𝑖𝑜𝑛𝑠 𝑟𝑒𝑞𝑢𝑖𝑟𝑒𝑑 =380
72= 5.27 ≅ 6

Introduction to Operations Management - IB MahadevanWeek 2
© All Rights Reserved, Indian Institute of Management Bangalore
Capacity Estimation (Worker Paced Systems)Fast Food Joint Example (Impact of increased Demand)
• It is not possible to meet the demand with 5 work stations.
• We need to add a sixth workstation and accordingly redistribute the tasks among the six work stations.
• Main dish has a process time of 80 seconds. The only way to bring down this process time below 72 is to duplicate one more unit at this workstation.
• All these changes will reduce the average resource utilization but we will be able to meet the targeted daily demand of 400.

Introduction to Operations Management - IB MahadevanWeek 2
© All Rights Reserved, Indian Institute of Management Bangalore
Other Issues in Capacity Planning
Section 2, Sub-section 2.5

Introduction to Operations Management - IB MahadevanWeek 2
© All Rights Reserved, Indian Institute of Management Bangalore
Capacity Planning under uncertaintyUse of Queueing Theory
• In all the examples that we have seen so far demand and process times were assumed to be known and deterministic.
• However, in reality, both these information tend to be varying and quite uncertain. The question of interest is how will this impact the capacity?
• One way to address this is to incorporate these idiosyncrasies into our analysis and then compute measures such a delays, waiting times, utilization etc.
• Queueing Theory or Waiting Line Models provide a structured approach to address capacity issues under such conditions.

Introduction to Operations Management - IB MahadevanWeek 2
© All Rights Reserved, Indian Institute of Management Bangalore
Capacity Planning under uncertaintyComponents of a Queueing System
ArrivalsServer Served
customersWaiting Line
Population
This is a single server queue.
Source: Mahadevan, B. (2015), “Operations Management: Theory & Practice”, Pearson Education, 3rd Edition, pp 271.

Introduction to Operations Management - IB MahadevanWeek 2
© All Rights Reserved, Indian Institute of Management Bangalore
Capacity Planning under uncertaintyRelevant Measures in Queueing Systems
Mean Arrival rate
Mean Service rate
𝜌 Utilization of the Server
Lq Average number of customers in the waiting line
(Length of the Queue)
Lq =
Single server Queue
(Exponential service time)

Introduction to Operations Management - IB MahadevanWeek 2
© All Rights Reserved, Indian Institute of Management Bangalore
Capacity Planning under uncertaintySome Managerial Implications
The formula for the length of the queue implies the following:
• As the difference between the service rate and arrival rate narrows down, the queue can build longer and longer.
• Since utilization is a ratio of these two numbers, at higher utilization the queue gets longer.
• When the service rate and the arrival rate are the same, the utilization is 100% and the queue length becomes infinite.
• This means that when we deal with uncertainties in demand and service times we should not design a process for 100% utilization of resources.

Introduction to Operations Management - IB MahadevanWeek 2
© All Rights Reserved, Indian Institute of Management Bangalore
Capacity Planning under uncertaintyEffect of reducing uncertainty
• Suppose we were able to automate the step in the process and reduce the variability in service time to zero.
– The mean remains at 𝜇, but the standard deviation 𝜎 is zero.
• The queue length has halved compared to the earlier case. This greatly motivates us to put efforts in process variability.
• Automation, better training, unambiguous policies, clear authorization, availability of right information and well-designed processes are ways by which we can reduce variability.
Lq =
Single server Queue
Deterministic service time

Introduction to Operations Management - IB MahadevanWeek 2
© All Rights Reserved, Indian Institute of Management Bangalore
Capacity Planning under uncertaintySome Managerial Implications
In real life situations involving complex network of queues, the following two results are invariable:
• Higher utilization leads to delays and huge pile ups.
• It pays to invest in reducing process time variability.

Introduction to Operations Management - IB MahadevanWeek 2
© All Rights Reserved, Indian Institute of Management Bangalore
Capacity Planning under uncertaintyFlexibility/Utilization Trade-off
Utilization 100%0
Opera
tional Perf
orm
ance
M
easu
res
High utilization
Low cost of operation
Poor service
Low utilization
High cost of operation
Good service
Source: Mahadevan, B. (2015), “Operations Management: Theory & Practice”, Pearson Education, 3rd Edition, pp 278.

Introduction to Operations Management - IB MahadevanWeek 2
© All Rights Reserved, Indian Institute of Management Bangalore
Capacity Planning under uncertaintyCost of the service
Exp
ecte
d c
osts
Level of service
Total cost
Service
cost
Waiting Costs

Introduction to Operations Management - IB MahadevanWeek 2
© All Rights Reserved, Indian Institute of Management Bangalore
Other Alternatives for increasing the capacity
• Let us consider a service system such as a restaurant:
– Peak Demand: Between 7.30 am and 9.30 am
– Non-Peak Demand: Between 3.00 pm and 5.00 pm
• Most service systems have peak hour and non-peak hour zones of demand.
• How do we address capacity requirements during peak hours?

Introduction to Operations Management - IB MahadevanWeek 2
© All Rights Reserved, Indian Institute of Management Bangalore
Increasing the capacity in the systemOther alternatives (Product Portfolio Choices)
• Narrow the service portfolio offered to the customers
– If we offer too many varieties, we lose capacity in changing over from one variety to the other, setting up the system for a new variety etc.
• Shift the excess demand from the peak zone to a non-peak zone.
– Introduce capacity reservation system & prior appointments – such as table reservations and doctor appointments.
– Use pricing strategies to address capacity problems.
• Offering discounts will help shift the demand from peak to non-peak.
• Offering premium pricing for the peak hour capacity will also adjust the demand.

Introduction to Operations Management - IB MahadevanWeek 2
© All Rights Reserved, Indian Institute of Management Bangalore
Increasing the capacity in the systemOther alternatives (Multi-skilling)
• Have multi-skilling of the work force so that one can utilize a flexible work force in various stages of the service delivery to address the demand.
– During the peak hour time, the order taking personnel can also double up as severs by addressing certain service requirements.
– In the kitchen area multi-skilled flexible workforce can address the surge in demand more effectively.
• One can also hire temporary workers to increase capacity.
– This will be limited to semi-skilled and unskilled trade.

Introduction to Operations Management - IB MahadevanWeek 2
© All Rights Reserved, Indian Institute of Management Bangalore
Increasing the capacity in the systemOther alternatives
• Use alternative planning premises to address capacity issues during peak-hour.
• There are three planning premises normally used in businesses.
– Made-to-Order (MTO)
– Made-to-Stock (MTS)
– Assemble-to-Order (ATO)
• In the case of MTS the requirement is fulfilled using what is already available in inventory as semi-configured.

Introduction to Operations Management - IB MahadevanWeek 2
© All Rights Reserved, Indian Institute of Management Bangalore
Increasing the capacity in the systemOther alternatives (Planning Modifications)
• In most cases, services cannot be inventoried. Therefore MTS has a limited use in service businesses.
• However, services make use of ATO.
– A planning premise in which part of the service is pre-processed.
– The preparatory work is done during the non-peak zone that precedes the peak hour.
– Capacity required for delivering service during peak hour is minimized.
– As soon as the customer arrives in the system, the balance work is done and service is delivered faster.

Introduction to Operations Management - IB MahadevanWeek 2
© All Rights Reserved, Indian Institute of Management Bangalore
Increasing the capacity in the systemOther alternatives (Planning Modifications)
• During non-peak hours a service system can resort to other process choices and offerings. These include:
– MTO method of handling service requests
– specialized work force
– Wide service portfolio