Capacity for producing economic statistics in the Pacific
30
INFORMATION PAPER Capacity for producing economic statistics in the Pacific Nilima Lal Economic Statistics Advisor Statistics for Development Division | Division statistique pour le développement Pacific Community | Communauté du Pacifique CPS – B.P. D5 | 98848 Noumea, New Caledonia | Nouméa, Nouvelle Calédonie Tel: (687) 26 20 00 | ext: 31 471 Fax: (687) 26 38 18 Email: [email protected] | Web: www.spc.int/sdd
Transcript of Capacity for producing economic statistics in the Pacific

INFORMATION PAPER
Capacity for producing economic statistics in the Pacific Nilima Lal Economic Statistics Advisor Statistics for Development Division | Division statistique pour le développement Pacific Community | Communauté du Pacifique CPS – B.P. D5 | 98848 Noumea, New Caledonia | Nouméa, Nouvelle Calédonie Tel: (687) 26 20 00 | ext: 31 471 Fax: (687) 26 38 18 Email: [email protected] | Web: www.spc.int/sdd


Capacity for producing Economic Statistics in the Pacific
ii
Table of Contents
Acknowledgement ................................................................................................................................. iv
Abbreviations .......................................................................................................................................... v
A. BACKGROUND ......................................................................................................................... 1
B. THE CORE SET OF ECONOMIC STATISTICS ............................................................................... 1
1. Prices and costs ....................................................................................................................... 1
2. Demand and output ................................................................................................................ 1
3. Income and wealth .................................................................................................................. 2
4. Money and banking ................................................................................................................. 2
5. Government............................................................................................................................. 2
6. Labour market ......................................................................................................................... 2
7. Natural resources and the environment ................................................................................. 2
C. THE SURVEY ............................................................................................................................. 2
D. THE RESULTS ............................................................................................................................ 3
1. Number of core economic indicators produced by PICTs ....................................................... 3
2. Number of core economic indicators produced by PICTs that met the recommended frequency of production ................................................................................................................. 4
3. Types of core economic indicators produced by PICTs ........................................................... 5
3.1. Prices and costs ............................................................................................................... 7
3.2. Demand and output ........................................................................................................ 7
3.3. Income and wealth ......................................................................................................... 8
3.4. Money and banking ........................................................................................................ 9
3.5. Government .................................................................................................................... 9
3.6. Labour market ................................................................................................................. 9
3.7. Natural resources and environment ............................................................................... 9
4. Types of core economic indicators produced by PICTs sub-regions: Melanesia, Polynesia and Micronesia.............................................................................................................................. 11
4.1. Highlights ...................................................................................................................... 11
E. REASONS GIVEN BY COUNTRIES FOR NOT PRODUCING ALL THE RECOMMENDED CORE ECONOMIC INDICATORS ................................................................................................................... 12
1. Size of the country has an impact on the size of the NSOs ................................................... 12
2. Lack of coordination amongst institutions ............................................................................ 15
3. Lack of a national strategy or adherence to it to drive statistics development .................... 15
F. NSO VIEW ON OVERCOMING CONSTRAINTS ........................................................................ 15
1. Comparison of the 2017 results with the 2013 results ......................................................... 15
2. The Pacific core set ................................................................................................................ 17
G. THE WAY FORWARD .............................................................................................................. 19
H. CONCLUSION ......................................................................................................................... 20

Capacity for producing Economic Statistics in the Pacific
iii
Appendix 1: Member countries of technical assistance providers ....................................................... 22
Appendix 2: Areas of lead and secondary technical assistance responsibility: summary table ........... 23
Tables
Table 1: Number of core economic indicators produced by PICTs ......................................................... 3
Table 2: Number of core economic indicators that met the recommended frequency of production . 4
Table 3: Types of core economic indicators produced by PICTs ............................................................. 6
Table 4: The different types of core economic indicators produced by Melanesia, Polynesia and Micronesia ............................................................................................................................................ 11
Table 5: Percentage of indicators compiled, sorted by population size of country ............................. 13
Table 6: Number of countries compiling indicators in 2017 compared to 2013 .................................. 16
Table 7: The Pacific core set .................................................................................................................. 17
Table 8: Number of Pacific core set of economic indicators compared with the Asia-Pacific core set produced by a country .......................................................................................................................... 18
Figures
Graph 1: Core economic indicators ...................................................................................................... 5
Graph 2: Number of countries producing the different core economic indicator ............................. 10
Graph 3: Population of a country compared to number of core economic indicators produced ...... 14

Capacity for producing Economic Statistics in the Pacific
iv
Acknowledgement
Ms Rikke Munk Hansen, United Nations Economic and Social Commission for Asia and the Pacific
Mr Epeli Waqavonovono, Pacific Community
Mr David Frank Abbott, Pacific Community
Ms Alison Culpin, Pacific Community
Ms Gaelle Le Gall, Pacific Community
Capacity for producing Economic Statistics in the Pacific
v
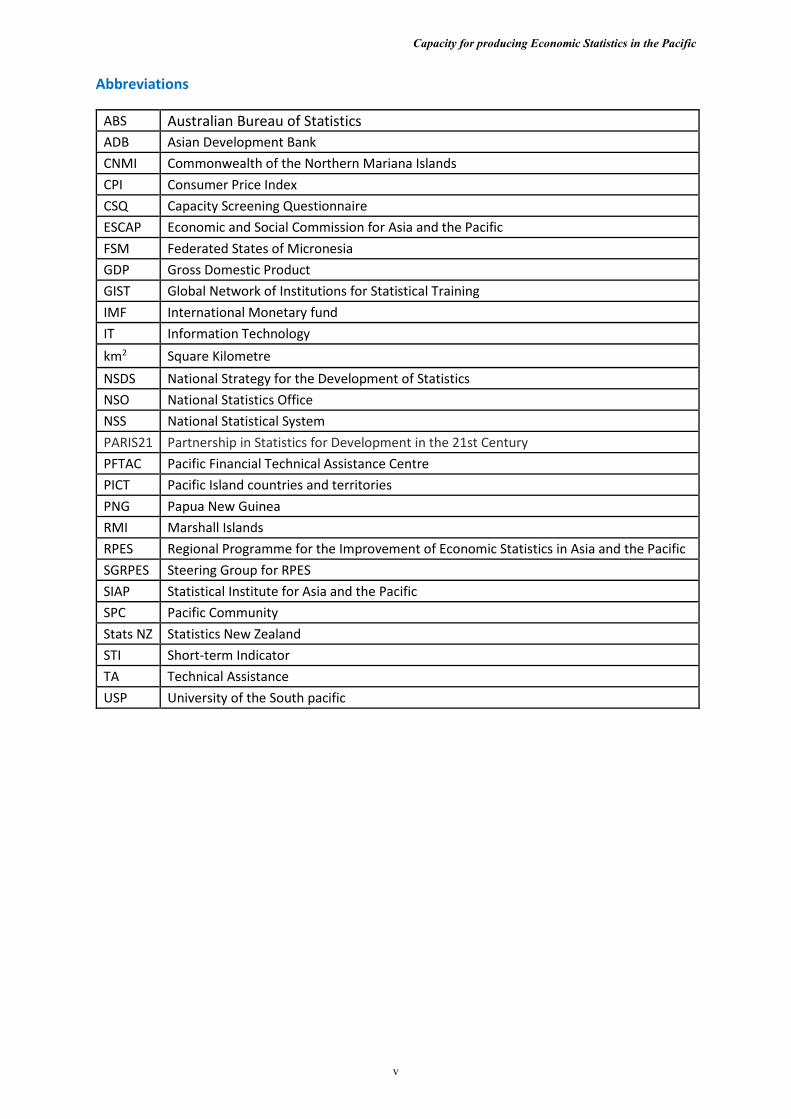
Abbreviations ABS Australian Bureau of Statistics ADB Asian Development Bank CNMI Commonwealth of the Northern Mariana Islands CPI Consumer Price Index CSQ Capacity Screening Questionnaire ESCAP Economic and Social Commission for Asia and the Pacific FSM Federated States of Micronesia GDP Gross Domestic Product GIST Global Network of Institutions for Statistical Training IMF International Monetary fund IT Information Technology km2 Square Kilometre NSDS National Strategy for the Development of Statistics NSO National Statistics Office NSS National Statistical System PARIS21 Partnership in Statistics for Development in the 21st Century PFTAC Pacific Financial Technical Assistance Centre PICT Pacific Island countries and territories PNG Papua New Guinea RMI Marshall Islands RPES Regional Programme for the Improvement of Economic Statistics in Asia and the Pacific SGRPES Steering Group for RPES SIAP Statistical Institute for Asia and the Pacific SPC Pacific Community Stats NZ Statistics New Zealand STI Short-term Indicator TA Technical Assistance USP University of the South pacific
Capacity for producing Economic Statistics in the Pacific
Page 1 of 23
A. BACKGROUND
The Regional Programme for the Improvement of Economic Statistics in Asia and the Pacific (RPES) aims to ensure that, by 2020, all countries in Asia and the Pacific have the capacity to produce and disseminate a core set of economic statistics. RPES was approved by the United Nations Economic and Social Commission for Asia and the Pacific (ESCAP) Committee on Statistics in 2010 and has since then been coordinated and serviced by ESCAP.
The Steering Group for RPES, the SGRPES, comprises experts from National Statistics Offices (NSO) and central banks of 22 Asia-Pacific nations, the Asian Development Bank, the Association of Southeast Asian Nations, the Statistics Division of the United Nations Department of Economic and Social Affairs, the International Labour Organization, and the Pacific Community (SPC).
A task force of the SGRPES designed and tested the capacity screening tool, a questionnaire with the purpose of monitoring progress towards the objective of RPES. The capacity screening questionnaire (CSQ) was designed to collect information from member states on capacities and constraints related to producing the core set of economic statistics in their country. The CSQ covered thirty-one indicators divided into seven categories.
The CSQ has been administered twice: in 2014 and 2017. This information paper focuses mainly on the results of the 2017 capacity screening.
B. THE CORE SET OF ECONOMIC STATISTICS
The core set of economic statistics comprises thirty-one indicators divided into seven categories:
1. Prices and costs
Six indicators -
a. Consumer price index (CPI) b. Producer price index c. Commodity price index d. External merchandise trade price indices e. Wages/earnings data f. Labour costs index /wage index
2. Demand and output
Eleven indicators -
a. Gross Domestic Product (GDP) (production) nominal and real b. GDP (expenditure) nominal and real c. External trade – merchandise d. External trade – services e. Short-term indicators (STI) on:
• industry output • services output • consumer demand • fixed investment • inventories
g. Economy structure statistics h. Productivity

Capacity for producing Economic Statistics in the Pacific
Page 2 of 23
3. Income and wealth
Six indicators -
a. Integrated national accounts for the total economy a. Institutional sector accounts b. Balance of payments c. International investment position d. External debt e. Income distribution
4. Money and banking
Three indicators -
a. Assets/liabilities of depository corporations b. Broad money and credit aggregates c. Interest rates statistics
5. Government
Two indicators -
a. General government operations b. General government debt
6. Labour market
Two indicators -
a. Labour supply and demand b. Hours worked
7. Natural resources and the environment
One indicator -
a. Natural resources
C. THE SURVEY
The CSQ collected information from NSOs on a variety of aspects related to the capacity of the institutions to produce the core set of economic statistics: technical cooperation, institutional setting, training and infrastructure. It also asked for current production of each of the indicators included in the core set.
This paper focuses on the responses provided on current production of the core set, including:
a. the recommended core economic indicators produced by NSOs of the member states;
b. the number of core indicators produced by the NSOs that met the recommended frequency of production e.g. the recommended frequency for countries to produce external trade merchandise was monthly; the survey asked if the countries did this;
c. responses to the reasons for countries not being able to compile the recommended core economic indicators; and
Capacity for producing Economic Statistics in the Pacific
Page 3 of 23
d. views of the NSOs in overcoming the constraints faced to produce the recommended core economic indicators.
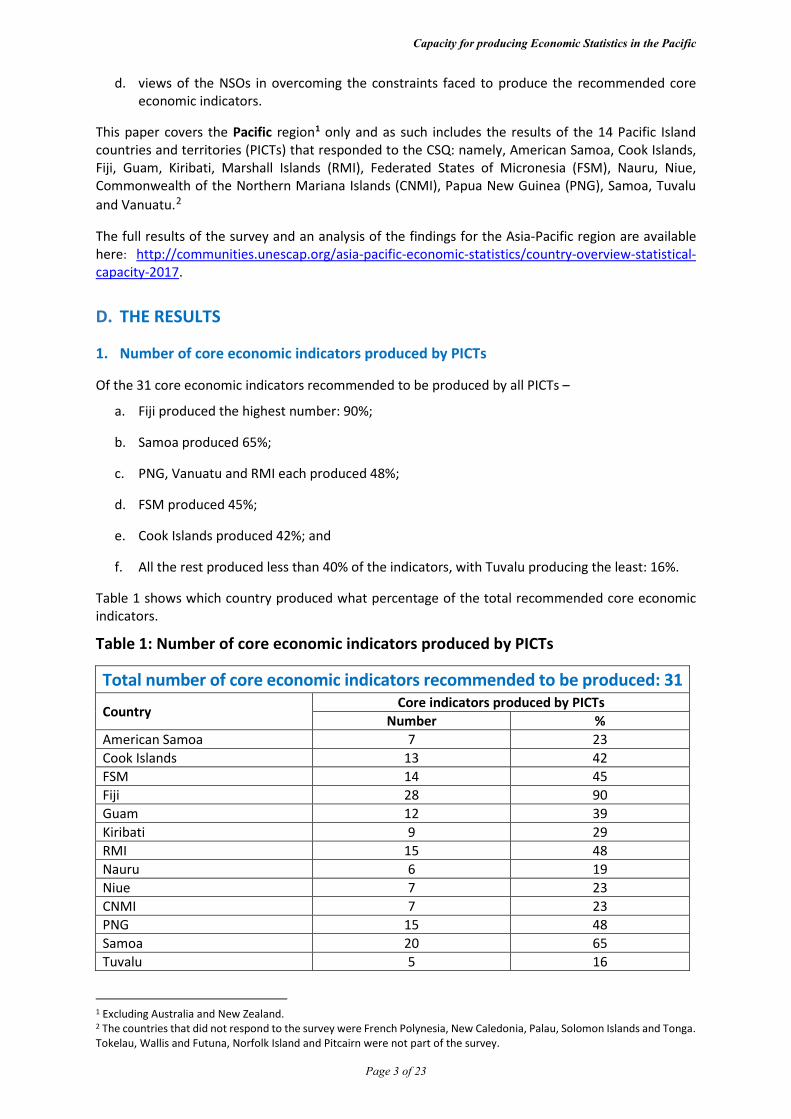
This paper covers the Pacific region1 only and as such includes the results of the 14 Pacific Island countries and territories (PICTs) that responded to the CSQ: namely, American Samoa, Cook Islands, Fiji, Guam, Kiribati, Marshall Islands (RMI), Federated States of Micronesia (FSM), Nauru, Niue, Commonwealth of the Northern Mariana Islands (CNMI), Papua New Guinea (PNG), Samoa, Tuvalu and Vanuatu.2
The full results of the survey and an analysis of the findings for the Asia-Pacific region are available here: http://communities.unescap.org/asia-pacific-economic-statistics/country-overview-statistical-capacity-2017.
D. THE RESULTS
1. Number of core economic indicators produced by PICTs
Of the 31 core economic indicators recommended to be produced by all PICTs –
a. Fiji produced the highest number: 90%;
b. Samoa produced 65%;
c. PNG, Vanuatu and RMI each produced 48%;
d. FSM produced 45%;
e. Cook Islands produced 42%; and
f. All the rest produced less than 40% of the indicators, with Tuvalu producing the least: 16%.
Table 1 shows which country produced what percentage of the total recommended core economic indicators.
Table 1: Number of core economic indicators produced by PICTs
Total number of core economic indicators recommended to be produced: 31
Country Core indicators produced by PICTs Number %
American Samoa 7 23 Cook Islands 13 42 FSM 14 45 Fiji 28 90 Guam 12 39 Kiribati 9 29 RMI 15 48 Nauru 6 19 Niue 7 23 CNMI 7 23 PNG 15 48 Samoa 20 65 Tuvalu 5 16
1 Excluding Australia and New Zealand. 2 The countries that did not respond to the survey were French Polynesia, New Caledonia, Palau, Solomon Islands and Tonga. Tokelau, Wallis and Futuna, Norfolk Island and Pitcairn were not part of the survey.

Capacity for producing Economic Statistics in the Pacific
Page 4 of 23
Total number of core economic indicators recommended to be produced: 31
Country Core indicators produced by PICTs Number %
Vanuatu 15 48
2. Number of core economic indicators produced by PICTs that met the recommended frequency of production
Timeliness of data production is an important dimension of quality. It allows users/people to make informed decisions based on recent data. These decisions prepare them to face the upcoming challenges and help prepare them for a better tomorrow.
Unfortunately, many of the indicators produced by PICTs did not meet the recommended frequency of production. Refer to Table 2.
Table 2: Number of core economic indicators that met the recommended frequency of production
Country Core indicators produced Core indicators that met the recommended frequency of production
Number Number Percentage American Samoa 7 1 14 Cook Islands 13 2 15 FSM 14 4 29 Fiji 28 18 64 Guam 12 4 33 Kiribati 9 3 33 RMI 15 4 27 Nauru 6 1 17 Niue 7 2 29 CNMI 7 2 29 PNG 15 11 73 Samoa 20 15 75 Tuvalu 5 1 20 Vanuatu 15 7 47
Table 2 shows that:
a. 75% of core economic indicators met the recommended frequency of production in Samoa;
b. 73% met the recommended frequency in PNG;
c. 64% met the recommended frequency in Fiji;
d. 47% met the recommended frequency in Vanuatu; and
e. in all other PICTs, less than 40% of the indicators met the recommended frequency of production. In American Samoa, the smallest proportion of core indicators met the recommended frequency: 14%.

Capacity for producing Economic Statistics in the Pacific
Page 5 of 23
Graph 1 visually illustrates the gap between:
a. the number of economic indicators produced by a country; and
b. the number of economic indicators produced by a country meeting the recommended frequency.
Comparing the results of Table 2 with Table 1 shows that Fiji produced 90% of the core set indicators, of which 64% were produced with the required frequency. Samoa and PNG, on the other hand, produced a lower percentage of core set indicators than Fiji but a higher percentage of their indicators met the recommended frequency of production.
Inference 1: It can be deduced that in some situations there could be a trade-off between producing indicators and producing indicators that meet the recommended frequency of production.
For example, to introduce new statistics or analysis, the frequency of some indicators may need to be put on hold temporarily to free up the required human resources.
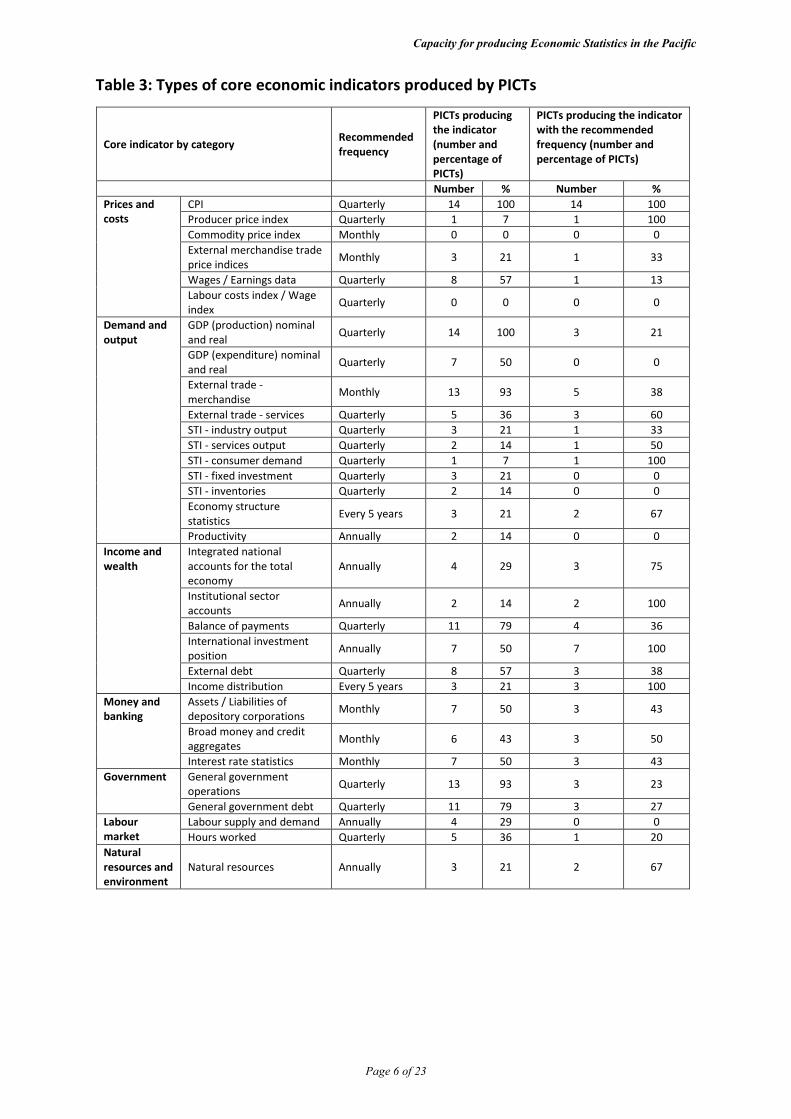
3. Types of core economic indicators produced by PICTs
Table 3, which is graphically presented in Graph 2, provides information on the types and frequency of core economic indicators produced by PICTs, classified according to the seven categories.
0
5
10
15
20
25
30
Amer
ican
Sam
oaCo
ok Is
Fede
rate
d St
ates
of M
icro
nesia Fi
jiGu
amKi
ribat
iM
arsh
all I
sland
sN
auru
Niu
eN
orth
ern
Mar
iana
IsPN
GSa
moa
Tuva
luVa
nuat
u
Graph 1: Core economic indicatorsNumber
Number of indicators produced
Number meeting the recommended frequency
Capacity for producing Economic Statistics in the Pacific
Page 6 of 23
Table 3: Types of core economic indicators produced by PICTs
Core indicator by category Recommended frequency
PICTs producing the indicator (number and percentage of PICTs)
PICTs producing the indicator with the recommended frequency (number and percentage of PICTs)
Number % Number % Prices and costs
CPI Quarterly 14 100 14 100 Producer price index Quarterly 1 7 1 100 Commodity price index Monthly 0 0 0 0 External merchandise trade price indices Monthly 3 21 1 33
Wages / Earnings data Quarterly 8 57 1 13 Labour costs index / Wage index Quarterly 0 0 0 0
Demand and output
GDP (production) nominal and real Quarterly 14 100 3 21
GDP (expenditure) nominal and real Quarterly 7 50 0 0
External trade - merchandise Monthly 13 93 5 38
External trade - services Quarterly 5 36 3 60 STI - industry output Quarterly 3 21 1 33 STI - services output Quarterly 2 14 1 50 STI - consumer demand Quarterly 1 7 1 100 STI - fixed investment Quarterly 3 21 0 0 STI - inventories Quarterly 2 14 0 0 Economy structure statistics Every 5 years 3 21 2 67
Productivity Annually 2 14 0 0 Income and wealth
Integrated national accounts for the total economy
Annually 4 29 3 75
Institutional sector accounts Annually 2 14 2 100
Balance of payments Quarterly 11 79 4 36 International investment position Annually 7 50 7 100
External debt Quarterly 8 57 3 38 Income distribution Every 5 years 3 21 3 100
Money and banking
Assets / Liabilities of depository corporations Monthly 7 50 3 43
Broad money and credit aggregates Monthly 6 43 3 50
Interest rate statistics Monthly 7 50 3 43 Government General government
operations Quarterly 13 93 3 23
General government debt Quarterly 11 79 3 27 Labour market
Labour supply and demand Annually 4 29 0 0 Hours worked Quarterly 5 36 1 20
Natural resources and environment
Natural resources Annually 3 21 2 67

Capacity for producing Economic Statistics in the Pacific
Page 7 of 23
Table 3 shows that one factor in meeting or exceeding the recommended frequency of production is the length of time3 given for compiling the indicator. Short timeframes, such as monthly and quarterly, are hard to meet for small NSOs employing a few staff.
Reponses to selected indicators are analysed below.
3.1. Prices and costs
a. The CPI is produced by all the countries and all of them produce this indicator with the required frequency, clearly indicating the importance of this indicator to the users. The CPI has many uses in the Pacific region. In addition to being used for calculating the inflation rate, almost all PICTs use it as a price deflator in the national accounts, i.e. it substitutes for other price indices4 which, due to resource constraints, many NSOs in the Pacific do not construct. This can be seen by the external merchandise trade price indices which were produced by three countries, and the producer price index, which was produced by one country.
b. Wages/earnings data were produced by eight countries. Collecting wages/earnings data through a survey is not a preferred option, as many PICTs do not have the human and financial resources. The preferred source for these data is administrative records and for some countries this source is yet to be tapped.
c. The commodity price index and the labour costs index/wage index were not produced by any country, probably due to resource constraints and lack of skill.
Inference 2: It can be deduced that, due to the size and skillsets of PICTs’ NSOs, several core indices were not constructed, despite data being available for some, such as the external merchandise trade price indices and the wage index.
3.2. Demand and output
a. The GDP in nominal and real prices compiled using the production approach was produced by all the countries, with 21% of them meeting the recommended frequency. In contrast to this, the GDP in nominal and real prices compiled using the expenditure approach was compiled by only 50% of countries, with none of them meeting the recommended frequency of production.
3 Indicators sorted by recommended frequency of production
Monthly Quarterly Annually Every five years
Commodity price index External merchandise trade
price indices External trade –
merchandise Assets / Liabilities of
depository corporations Broad money and credit
aggregates Interest rate statistics
CPI Producer price index Wages / Earnings data Labour costs index / Wage index GDP (production) nominal and real, GDP (expenditure) nominal and real External trade – services STI - industry output STI - services output STI - consumer demand STI - fixed investment STI – inventories Balance of payments External debt General government operations General government debt Hours worked
Productivity Integrated national
accounts for the total economy
Institutional sector accounts
International investment position
Labour supply and demand
Natural resources
Economy structure statistics
Income distribution
4 There are four major types of price index available to derive volume measures in the national accounts: CPIs, producer price indices (PPIs), export price indices (XPIs) and import price indices (MPIs). CPIs are measures of purchasers’ prices and PPIs are measures of basic prices. XPIs are measures of FOB prices; MPIs may measure FOB or CIF prices. (2008 SNA 15.108)

Capacity for producing Economic Statistics in the Pacific
Page 8 of 23
b. The external trade - merchandise was produced by 93% of the countries but only 38% of the countries that produced it met the recommended frequency of production.
c. The external trade - services was produced by 36% of the countries, of which 60% met the recommended frequency of production. In quite a few countries, trade in services is not done as a stand-alone compilation. Estimates are derived from the overseas exchange transaction records with the central banks for use in the balance of payments.
d. STIs were not produced by many countries. Fiji is the only country that produced all the recommended short-term core economic indicators.
e. Economy structure statistics were produced by 21% of the countries, of which 67% met the recommended frequency of production.
f. Productivity statistics were produced by 14% of the countries. None of the countries met the recommended frequency of production.
Inference 3: It can be deduced that priority was given to the indicators that are demand driven, i.e. most users want GDP data compiled using the production approach to be able to assess how much different industries contribute to the GDP.
3.3. Income and wealth
Balance of payments, statistics on external debt and the international investment position were the three most used indicators in this category.
a. Balance of payments was produced by 79% of the countries, of which only 36% met the recommended frequency.
b. Statistics on external debt were produced by 57% of the countries, of which only 38% met the recommended frequency.
c. Statistics on international investment position were produced by 50% of the countries and they all met the recommended frequency.
Due to the short data production frequency, many countries were not able to meet the recommended frequency of production for balance of payments and external debt, whilst for the international investment position, countries that produced this indicator were able to meet the recommended frequency because of the longer timeframe given to produce the indicator.
Data on integrated national accounts, institutional sector accounts and income distribution were not produced by many countries, due to lack of resources/skills. However, many that did produce them were able to meet the recommended frequency of production, due to a longer timeframe given to produce the indicator.
a. Statistics on integrated national accounts for the total economy were produced by 29% of the countries, of which 75% met the recommended frequency.
b. Statistics on institutional sector accounts were produced by 14% of the countries and they all met the recommended frequency.
c. Statistics on income distribution, were produced by 21% of the countries and they all met the recommended frequency.
Inference 4: It can be deduced that, if the recommended frequency given is short, many PICTs are not able to meet the recommended frequency of production for those indicators they are able to produce.

Capacity for producing Economic Statistics in the Pacific
Page 9 of 23
3.4. Money and banking
The data used for the compilation of statistics on money and banking come mainly from the central banks/monetary institutions of PICTs.
a. Statistics on assets / liabilities of depository corporations were produced by 50% of the countries, of which 43% met the recommended frequency.
b. Statistics on broad money and credit aggregates were produced by 43% of the countries, of which 50% met the recommended frequency.
c. Interest rate statistics were produced by 50% of the countries, of which 43% met the recommended frequency.
Inference 5: It can be deduced that there is some need to strengthen the statistics units of the central banks. Central banks are a part of the National Statistical System5 (NSS) in the PICTs.
3.5. Government
a. Statistics on general government operations were produced by 93% of the countries, of which 23% met the recommended frequency of production.
b. Statistics on general government debt were produced by 79% of the countries, of which 27% met he recommended frequency of production.
Inference 6: It can be deduced that government indicators are considered important, but that the recommended frequency (quarterly) is difficult for countries to meet.
3.6. Labour market
a. Statistics on labour supply and demand were produced by 29% of the countries. None of the countries met the recommended frequency of production.
b. Statistics on hours worked were produced by 36% of the countries, of which 20% met the recommended frequency of production.
Inference 7: It can be deduced that countries are giving low priority to the compilation of data on the labour market, probably due to the extensive work and financial resources required for conducting a labour force survey.
3.7. Natural resources and environment
Data on natural resources were produced by 21% of the countries, of which 67% of the countries met the recommended frequency of production. Statistics on natural resources and environment are of immense importance to PICTs, but to compile them requires additional resources, both human and financial, and appropriate training of staff is needed.
Inference 8: It can be deduced that additional resources and Technical Assistance (TA) in new areas of statistics, such as natural resources and the environment, are needed by PICTs.
5 The NSS is the combination of statistical organisations and units within a country that jointly collect, process and disseminate official statistics on behalf of a national government – PARIS21.

Capacity for producing Economic Statistics in the Pacific
Page 10 of 23
Graph 2 graphically presents Table 3.
Graph 2 shows that:
• none of the countries produced: o the commodity price index; or o the labour cost index/wage index.
• in some cases, the indicators produced by a country all met the recommended frequency of
production. These indicators were: o the producer price index (one country); o the STI-consumer demand (one country); o institutional sector accounts (two countries); o income distribution (three countries); o international investment position (seven countries); and o the CPI (all the fourteen countries).
0
2
4
6
8
10
12
14
16Co
nsum
er p
rice
inde
xPr
oduc
er p
rice
inde
xCo
mm
odity
pric
e in
dex
Exte
rnal
mer
chan
dise
trad
e pr
ice
indi
ces
Wag
es /
Earn
ings
dat
aLa
bour
cos
ts in
dex
/ Wag
e in
dex
GDP
(pro
duct
ion)
nom
inal
and
real
GDP
(exp
endi
ture
) nom
inal
and
real
Exte
rnal
trad
e - m
erch
andi
seEx
tern
al tr
ade
- ser
vice
sST
I - in
dust
ry o
utpu
tST
I - se
rvic
es o
utpu
tST
I - c
onsu
mer
dem
and
STI -
fixe
d in
vest
men
tST
I - in
vent
orie
sEc
onom
y st
ruct
ure
stat
istic
sPr
oduc
tivity
Inte
grat
ed n
atio
nal a
ccou
nts f
or th
e to
tal e
cono
my
Inst
itutio
nal s
ecto
r acc
ount
sBa
lanc
e of
pay
men
tsIn
tern
atio
nal i
nves
tmen
t pos
ition
Exte
rnal
deb
tIn
com
e di
strib
utio
nAs
sets
/ lia
bilit
ies o
f dep
osito
ry c
orpo
ratio
nsBr
oad
mon
ey a
nd c
redi
t agg
rega
tes
Inte
rest
rate
stat
istic
sGe
nera
l gov
ernm
ent o
pera
tions
Gene
ral g
over
nmen
t deb
tLa
bour
supp
ly a
nd d
eman
dHo
urs w
orke
dN
atur
al re
sour
ces
Graph 2: Number of countries producing the different core economic indicator
Number of indicators produced Number meeting the recommended frequency

Capacity for producing Economic Statistics in the Pacific
Page 11 of 23
4. Types of core economic indicators produced by PICTs sub-regions: Melanesia, Polynesia and Micronesia
The Pacific region comprises three sub-regions: Melanesia6, Polynesia7 and Micronesia8.
Table 4 throws light on the percentage of countries by sub-region that produced the recommended core economic indicators.
Table 4: The different types of core economic indicators produced by Melanesia, Polynesia and Micronesia
Type of Indicator Melanesia Polynesia Micronesia
Percentage of countries Prices and costs
CPI 100 100 100 Producer price index 33 0 0 Commodity price index 0 0 0 External merchandise trade price indices 67 20 0 Wages / Earnings data 33 60 67 Labour costs index / Wage index 0 0 0
Demand and output
GDP (production) nominal and real 100 100 100 GDP (expenditure) nominal and real 67 20 67 External trade - merchandise 100 100 83 External trade - services 67 40 17 STI - industry output 67 0 17 STI - services output 67 0 0 STI - consumer demand 33 0 0 STI - fixed investment 100 0 0 STI - inventories 67 0 0 Economy structure statistics 33 20 17 Productivity 33 20 0
Income and wealth
Integrated national accounts for the total economy 33 20 33 Institutional sector accounts 0 0 33 Balance of payments 100 80 67 International investment position 100 40 33 External debt 100 40 50 Income distribution 33 20 17
Money and banking
Assets / Liabilities of depository corporations 100 20 50 Broad money and credit aggregates 100 40 17 Interest rate statistics 100 40 33
Government General government operations 100 80 100 General government debt 100 60 83
Labour market Labour supply and demand 33 40 17 Hours worked 33 40 33
Natural resources and environment
Natural resources 33 20 17
4.1. Highlights
a. All countries in all the three sub-regions produced the CPI and the GDP (production) nominal and real.
Shows only countries that responded to the CSQ: 6 Melanesia comprises PNG, Fiji and Vanuatu. 7 Polynesia comprises American Samoa, Cook Islands, Niue, Samoa and Tuvalu. 8 Micronesia comprises FSM, Guam, Kiribati, Northern Marianas, RMI, Nauru and Palau.

Capacity for producing Economic Statistics in the Pacific
Page 12 of 23
b. All countries in Melanesia and Polynesia and 87% in Micronesia produced the external trade - merchandise.
c. All countries in Melanesia produced the STI - fixed investment, which no country in Polynesia and Micronesia produced.
d. All countries in Melanesia produced the balance of payments, while 80% in Polynesia and 67% in Micronesia did so.
e. All countries in Melanesia produced the International Investment position, while 40% in Polynesia and 33% in Micronesia did so.
f. All countries in Melanesia produced the external debt, while 40% in Polynesia and 50% in Micronesia did so.
The above results may be due to the larger population size of the three Melanesian countries. The next section looks further into the correlation between the population size and the number of indicators produced by the countries.
E. REASONS GIVEN BY COUNTRIES FOR NOT PRODUCING ALL THE RECOMMENDED CORE ECONOMIC INDICATORS
In the CSQ, countries were requested to tick the box(es) containing the reason(s) for their inability to compile the recommended core economic indicators. The options given were:
not relevant low priority no or insufficient funds no or inadequate source data no or inadequate manpower lack of skills or expertise inadequate IT systems no clear stakeholder and/or champion.
SPC looked through the responses and analysed the underlying issues. The analysis is presented in three parts – issues related to the size of the population/NSO, issues related to institutional coordination, and issues related to statistics planning.
1. Size of the country has an impact on the size of the NSOs
PICTs vary in geographical size and population, ranging from PNG, with the largest land area of 462,840 km2 and a population of around 8.3 million people, to Nauru, with a land area of 21 km2 and a population of 10,900 people and Niue with a land area of 259 km2 and a population of 1,520 people.

Capacity for producing Economic Statistics in the Pacific
Page 13 of 23
A good way to test the underlying assumption that countries with a small population cannot have a big statistics office9 is to look at the percentage of indicators produced by a country against its population size.
Table 5 shows countries sorted by their population size and the percentage of core economic indicators produced by them. To supplement the information, their land area is also provided.
The countries have been divided into six population-size groups:
• Group 1: Population greater than one million: PNG. • Group 2: Population greater than 500,000 but less than a million: Fiji. • Group 3: Population greater than 250,000 but less than 500,000: Vanuatu. • Group 4: Population greater than 100,000 but less than 250,000: Samoa, Guam, Kiribati and
FSM. • Group 5: Population greater than 50,000 but less than 100,000: American Samoa, CNMI and
RMI. • Group 6: Population less than 50,000: Cook Islands, Nauru, Tuvalu and Niue.
Table 5: Percentage of indicators compiled, sorted by population size of country
Groups Country Land area (km2)
2017 Mid-year population estimates
Percentage of total population
Percentage of core indicators produced
1 PNG 462,840 8,330,600 80.93 48 2 Fiji 18,333 888,400 8.63 90 3 Vanuatu 12,281 283,300 2.75 48
4
Samoa 2,934 196,800 1.91 65 Guam 541 170,900 1.66 39 Kiribati 811 113,200 1.10 29 FSM 701 104,900 1.02 45
5
American Samoa 199 56,570 0.55 23 CNMI 457 55,900 0.54 23 RMI 181 55,200 0.54 48
6
Cook Islands 237 15,150 0.15 42 Nauru 21 10,900 0.11 19 Tuvalu 26 10,200 0.10 16 Niue 259 1,520 0.01 23
Total 10,293,540
9 The number of people employed in 2017 is not available. 2019 estimates are:
Country No of staff Source American Samoa 7 Statistics Office Cook Islands 10 Statistics Office FSM 21 Statistics Office Fiji 146 Fiji Bureau of Statistics Guam 30 Bureau of Statistics and Plans Kiribati 14 National Statistics Office RMI 5 Economic Policy, Planning and Statistics Office PNG 134 National Statistical Office Nauru 5 Bureau of Statistics Niue 4 Statistics Niue CNMI 6 Central Statistics Samoa 87 Samoa Bureau of Statistics Tuvalu 4 Central Statistics Division Vanuatu 52 National Statistics Office
Note that the estimates include the heads of the NSOs, the administrative and finance officers and IT persons.

Capacity for producing Economic Statistics in the Pacific
Page 14 of 23
In terms of size, PNG is by far the largest. In 2017 it accounted for 80.93% of the total population but the percentage of indicators it produced:
a. is similar to what Vanuatu in Group 3 (2.75% of total population) and RMI in Group 5 (0.54% of total population) produced; and
b. is less than what Fiji in Group 2 (8.63% of total population) and Samoa in Group 4 (1.91% of total population) produced.
Vanuatu in Group 2 (2.75% of total population) produced fewer indicators than Samoa in Group 4 (1.91% of total population).
Table 5 is graphically presented in Graph 3.
Graph 3 shows that Cook Islands in Group 6 (0.15% of total population) produces more indicators than Guam (1.66% of population) and Kiribati in Group 4 (1.10% of population) and American Samoa and the CNMI in Group 5 (0.55% and 0.54% of population respectively).
The analysis also shows that, whilst the size of a country is a major contributor to its ability to produce the recommended core economic indicators, that may not be true for PNG, which is 25 times bigger in land area and nine times bigger in population size than Fiji but produces only 48% of the recommended core economic indicators. Fiji with less than a million population produces 90% of the recommended core economic indicators.
The broader Asia-Pacific analysis concluded that population size was the main explanatory factor for the number of core indicators produced. It is interesting that this conclusion does not hold once the analysis is further disaggregated. Size certainly is a major parameter, but it is not the main determinant. Others are:
a. resource constraints at NSOs: human, technical and financial; b. skillsets at NSOs for the compilation of specialised/advanced statistics: most NSOs have
generalists as opposed to specialists working for them; c. insufficient source data for the compilation of statistics, e.g. in American Samoa, Nauru and
Niue, the trade data from the customs is either absent or incomplete; and d. outdated IT systems at NSOs and organisations from which administrative data are sourced.
Lack of skills in IT is also an issue.
0 10 20 30 40 50 60 70 80 90 100
Papua New GuineaFiji
VanuatuSamoaGuam
KiribatiFederated States of Micronesia
American SamoaNorthern Mariana Islands
Marshall IslandsCook Islands
NauruTuvalu
Niue
Graph 3: Population of a country compared to number of core economic indicators produced
Percentage of total core indicators produced Percentage of total population

Capacity for producing Economic Statistics in the Pacific
Page 15 of 23
2. Lack of coordination amongst institutions
Coordination amongst institutions is very important. This is where the NSS comes in. For example, expertise for the compilation of monetary statistics lies with the central banks and not the NSOs. Therefore, the coordination powers of the two institutions need to be enshrined in their respective legal acts. This should also be the case in coordinating the relationship between the NSOs and the tax agencies, the NSOs and the Commissioner of Insurance, the NSOs and Customs and the NSOs and private businesses.
Strong coordination between organisations will somewhat appease the issues relating to ‘No or inadequate source data’, ‘No or inadequate manpower’ and ‘Lack of skills or expertise’.
Inference 9: NSOs are the official source of all statistics but the compilations need to be done by the organisations having expertise in the thematic area and access to the source data, e.g. monetary statistics by the central banks. The different institutions mandated to compile statistics are collectively known as NSS. This system should be led by the NSOs, whose coordination powers and data access should be enshrined in their legal act.
3. Lack of a national strategy or adherence to it to drive statistics development
An issue facing some countries is ‘No clear stakeholder and/or champion.’ All PICTs need to have a National Strategy for the Development of Statistics (NSDS).10 Such a strategy is an important document and should reflect the countries’ development plan. Stakeholders should be a part of the NSDS development. The demand for statistics should come from the development plan and the stakeholders – countries need to make statistics user-driven. They will then have a better chance of getting funds for more staff and staff training and the whole process, from the collection to the dissemination of data, will be facilitated.
Inference 10: All PICTs need to develop an NSDS, reflective of their national development plans, and follow it through. It is one thing to have a NSDS and quite another to follow it, so the NSOs need to have a committee of eminent persons to monitor and champion the implementation of the NSDS.
F. NSO VIEW ON OVERCOMING CONSTRAINTS
The questionnaire also sought views from the NSOs on their plans to overcome the constraints. Only Niue, Samoa and Tuvalu answered this question. This low response rate may be due to countries not wanting to commit themselves to something they were not sure of.
It will therefore be interesting at this point to investigate progress from 2013 to 2017 by comparing the 2017 capacity screening survey results with those of 2013 for the countries that responded to both surveys. This would give some indication of the scale of improvements that may be possible for PICTs going forward from 2017.
1. Comparison of the 2017 results with the 2013 results
Thirteen countries participated in both the surveys: Cook Islands, FSM, Fiji, Guam, Kiribati, RMI, Nauru, Niue, CNMI, PNG, Samoa, Tuvalu and Vanuatu.
10 An NSDS is expected to provide a country with a strategy for developing statistical capacity across the entire NSS. The NSDS will provide a vision for where the NSS should be in five to ten years and will set milestones for getting there. It will present a comprehensive and unified framework for continual assessment of evolving user needs and priorities for statistics and for building the capacity needed to meet these needs in a more coordinated, synergistic and efficient manner. It will also provide a framework for mobilising, harnessing, and leveraging resources (both national and international) and a basis for effective and results-oriented strategic management of the NSS – PARIS21.

Capacity for producing Economic Statistics in the Pacific
Page 16 of 23
Table 6: Number of countries compiling indicators in 2017 compared to 2013
Positive change Negative change
Type of indicator 2013 2017 Change Number of countries
Prices and costs CPI 13 13 0 Producer price index 2 1 -1 Commodity price index 0 0 0 External merchandise trade price indices 2 3 +1 Wages / Earnings data 7 8 +1 Labour costs index / Wage index 0 0 0
Demand and output GDP (production) nominal and real 13 13 0 GDP (expenditure) nominal and real 9 6 -3 External trade - merchandise 12 12 0 External trade - services 3 5 +2 STI - industry output 5 3 -2 STI - services output 3 2 -1 STI - consumer demand 1 1 0 STI - fixed investment 3 3 0 STI - inventories 2 2 0 Economy structure statistics 2 3 +1 Productivity 1 2 +1
Income and wealth Integrated national accounts for the total economy 3 3 0
Institutional sector accounts 2 2 0 Balance of payments 11 11 0 International investment position 7 7 0 External debt 7 8 +1 Income distribution 3 3 0
Money and banking Assets / Liabilities of depository corporations 7 7 0 Broad money and credit aggregates 6 6 0 Interest rate statistics 7 7 0
Government General government operations 13 12 -1 General government debt 11 10 -1
Labour market Labour supply and demand 2 4 +2 Hours worked 3 5 +2
Natural resources and environment Natural resources 0 3 +3
The change in Table 6 is a mixed bag: whilst some countries were able to produce more indicators, others had to curtail a compilation or two.
Reasons for the positive change may have been:
a. that some compilations were done on an ad hoc basis; this is true for wages / earnings data, labour supply and demand, hours worked, economy structure statistics and productivity, all of which were done for 2017; and
b. the possibility that external merchandise trade price indices, external trade - services, external debt and natural resources were new compilations that countries added on to their work plan and not ad hoc compilations.
Reasons for the negative change may have been:
a. that some compilations were done on an ad hoc basis, i.e. done in 2013 and not in 2017; and
b. that some compilations were started in 2017 through TA but eventually were not completed.

Capacity for producing Economic Statistics in the Pacific
Page 17 of 23
The comparison of the results between the two years show that there are chances of some countries overcoming constraints, whilst for some it may not be possible.
Inference 11: Another capacity screening survey is needed to assess the performance of PICTs since 2017.
2. The Pacific core set
When the results of the 2014 capacity screening survey were released, the SPC deliberated on what a reasonable core set could be for the Pacific region, keeping in mind the reasons mentioned above that may hinder countries from producing all 31 indicators. The criteria used for selecting the Pacific indicators were that they needed to be a subset of the broader Asia-Pacific core set, with priority given to:
a. indicators currently prioritized and produced by PICTs; and
b. indicators for which PICTs are requesting TA by TA providers such as SPC and the Pacific Financial Technical Assistance Centre (PFTAC) (refer to Appendices 1 and 2).
Applying these criteria, SPC came up with a sub-set of the Asia-Pacific core set known as the Pacific core set that comprised 16 indicators, indicated in green in Table 7.
Table 7: The Pacific core set
Category Indicator
Prices and costs
CPI Producer price index Commodity price index External merchandise trade price indices Wages / Earnings data Labour costs index / Wage index
Demand and output
GDP (production) nominal and real GDP (expenditure) nominal and real External trade - merchandise External trade - services STI - industry output STI - services output STI - consumer demand STI - fixed investment STI - inventories Economy structure statistics Productivity
Income and wealth
Integrated national accounts for the total economy Institutional sector accounts Balance of payments International investment position External debt Income distribution
Money and banking Assets / Liabilities of depository corporations Broad money and credit aggregates Interest rate statistics
Government General government operations General government debt
Labour market Labour supply and demand Hours worked
Natural resources and environment Natural resources

Capacity for producing Economic Statistics in the Pacific
Page 18 of 23
Table 7 shows the indicators that were selected: in the prices and costs category, three of the six indicators ; in the demand and output category, four of the 11 indicators; in the income and wealth category, three of the six indicators; in the money and banking category, all three indicators; in the government category, both the indicators; in the labour market category, neither of the two indicators; and in the natural resources and environment category, the sole indicator.
Table 8 shows how the Pacific nations fared in producing the Pacific core set compared to the Asia-Pacific core set.
Table 8: Number of Pacific core set of economic indicators compared with the Asia-Pacific core set produced by a country
Number of indicators recommended 31 Asia-Pacific core set indicators 16 Pacific core set indicators
Country Number and percentage of indicators PICTs are producing
Number Percentage Number Percentage American Samoa 7 23 6 38 Cook Islands 13 42 11 69 Fiji 28 90 16 100 Guam 12 35 7 44 Kiribati 9 29 9 56 RMI 15 48 11 69 FSM 14 45 11 69 Nauru 6 19 6 38 Niue 7 23 7 44 CNMI 7 23 4 25 PNG 15 48 12 75 Samoa 20 65 14 88 Tuvalu 5 16 4 25 Vanuatu 15 48 13 81
Table 8 shows that:
a. Fiji produced all the indicators in the Pacific core set compared to 90% in the Asia-Pacific core set;
b. Samoa produced 88% of the indicators in the Pacific core set compared to 65% in the Asia-Pacific core set;
c. Vanuatu produced 81% of the indicators in the Pacific core set compared to 48% in the Asia-Pacific core set;
d. PNG produced 75% of the indicators in the Pacific core set compared to 48% in the Asia-Pacific core set;
e. Countries that produced between 50% and 75% of the Pacific core set of indicators are Cook Islands, Kiribati, RMI and FSM; and
f. all the rest produced less than 50% of the recommended Pacific core set.
A smaller set of core indicators obviously suits the Pacific nations, but there is a lot of room for them to improve their performance.
Capacity for producing Economic Statistics in the Pacific
Page 19 of 23
G. THE WAY FORWARD
This paper looks at the ability of the 14 PICTs to produce the 31 recommended core economic indicators.
The conclusion reached is that, whilst some PICTs are able to produce more indicators than others, overall, the inability of the many PICTs to produce all the 31 indicators prescribed in the Asia-Pacific recommended core set, as well as their inability to meet the recommended frequency for many of the indicators, needs to be accepted.
The reasons are many. Some are described below.
The size of the PICTs is important. Countries with small populations cannot have large NSOs. With a small work force, countries need to give priority to compiling indicators that are important to their users.
The size of the NSOs is also the main reason for countries not being able to meet the recommended frequency of production, particularly for high-frequency indicators. A country whose NSO has ten or less staff cannot compile the GDP every quarter. This country may opt to compile the CPI quarterly and the GDP annually. Trade-offs like this are necessary and should be dealt with on a case by case basis.
In small offices, staff lack specialisation, as they must multi-skill themselves to produce basic statistics. A classic example can be seen in Table 2 under the category prices and costs; despite 57% of the countries producing the wages/earnings data, none of them were producing the wage index. In situations like this, countries need to seek TA from TA providers, such as but not limited to SPC, PFTAC, ESCAP, Australian Bureau of Statistics (ABS), Statistics New Zealand (Stats NZ) and International Labour Organisation.
For all PICTs, the skill set at the NSOs needs to be developed. Experience alone is not enough. The knowledge of staff needs to be strengthened for them to be able to produce the required statistics. Supplementing experience with academic knowledge, work attachments, specialised training and workshops, and understudying consultants providing in-country TA are some of the things important for NSOs going forward.
High staff turnover and funding constraints to hire casual staff are issues faced by all NSOs in PICTs, particularly the small NSOs.
a. All NSOs should build in their work curriculum succession planning, particularly the larger NSOs.
b. NSOs should request TA providers for capacity supplementation and or substitution.
Inadequate source data, where administrative records are the source, for example for the compilation of the GDP and merchandise trade, are setbacks faced by NSOs. In such cases NSOs should:
a. hold discussions with the data providers to resolve the issue, e.g. to update their business registers for an economic survey, NSOs should request the tax department to classify all businesses according to the UNs Industrial Classification (International Standard Industrial Classification); and
b. look at alternative data sources, e.g. using partner country data with valuation adjustments to compile international merchandise trade statistics.
Quite a few countries’ NSOs and agencies/providers of administrative data have outdated Information Technology (IT) systems. In such circumstances, they should talk to the ministry they come under for the upgrade of the IT systems.

Capacity for producing Economic Statistics in the Pacific
Page 20 of 23
Another issue is the absence of staff from the office as they attend training or workshops offered by international organisations. Their absence affects the output the office can produce. Whilst training is necessary to upskill staff, PICTs should attend training only on statistics they are mandated to produce.
Taking on new projects (e.g. environmental accounts) is not possible for many NSOs. PICTs like Tuvalu and Kiribati need these statistics but are not able to produce them due to lack of resources and skills. In such circumstances, NSOs should engage in discussions with their governments for resources and contact TA providers to assist them.
Undertaking of ad hoc surveys, such as labour force surveys and household income and expenditure surveys, absorbs a lot of resources. NSOs should therefore endeavour to produce as many types of statistics as possible from such undertakings.
NSOs also need to establish a long-term survey programme to make most effective use of data collected from each individual survey and avoid duplication in questions as well as reduce respondent burden.
In going forward, the following are also of utmost importance to all PICTs:
a. the NSS should be strengthened and run smoothly, with the NSO at the helm;
b. all NSOs need to have an NSDS and in developing/revising one, they need to ensure that it is not over ambitious;
c. all NSOs with outdated statistics acts need to revise them and, in doing so, strengthen the coordination powers to allow NSOs access to data – memoranda of agreement are an option NSOs can consider; and
d. all NSOs need to form an advisory committee made up of eminent persons11 to monitor the implementation of the NSDS, as well as provide advice on statistics to NSOs.
Finally, accepting a smaller number of core set indicators for different sized NSOs and relaxing the recommended frequency criteria of the indicators is highly recommended. This should not stop a PICT from producing more indicators than is prescribed or from improving the frequency of the production of an indicator. What is important is what a country can manage to produce as per the Quality Assessment Framework with or without assistance from technical agencies such as SPC, ESCAP, PFTAC and Asian Development Bank (ADB) and statistical agencies such as ABS and Stats NZ.
The recommendations in this section align with the nine commitments on page 3 of ESCAP’s Declaration on Navigating Policy with Data to Leave No One Behind, which was agreed to by all countries in Asia-Pacific in 2018.12
H. CONCLUSION
SPC acknowledges the work done by ESCAP on the capacity screening tool and is looking forward to further collaborations.
The information collected through the capacity screening tool is helping develop national strategies for the development of statistics and is facilitating an exchange of expertise across NSSs, including through South-South cooperation, as well as assistance provided by development partners external to the NSS. It has also helped mobilise donor support.
11 NSO, university, private sector, government representative and others 12 https://www.unescap.org/sites/default/files/ESCAP_CST_2018_7_Declaration.pdf

Capacity for producing Economic Statistics in the Pacific
Page 21 of 23
The capacity screening tool has also identified skill gaps at NSOs, and this has led ESCAP to develop a set of training modules and resources that trainers of statisticians in basic economic statistics can use in designing training workshops. http://www.unsiap.or.jp/tot/index.html.
Also, a new platform of resources from several institutions has been created by the Global Network of Institutions for Statistical Training (GIST) https://www.unsdglearn.org/statistics/.
How much PICTs have benefited from the training materials and from the assistance provided by SPC and its partners needs to be known. It is therefore important to conduct another capacity screening of PICTs, with the inclusion of indicators on informal statistics and tourism earnings in the broader Asia-Pacific region, due to their importance to PICTs as well as Asia.

Capacity for producing Economic Statistics in the Pacific
Page 22 of 23
Appendix 1: Member countries of technical assistance providers13
Member
Not a member
Countries
ABS
ADB
IMF/
PFTA
C
IMF/
TAO
LAM
IMF
SPC
SNZ
US
Gra
duat
e Sc
hool
UN
SD/E
SCAP
SIAP
USP
1 American Samoa
2 Cook Islands
3 Fiji
4 French Polynesia
5 Guam
6 Kiribati
7 Marshall Islands
8 Federated States of Micronesia
9 Nauru
10 New Caledonia
11 Niue
12 CNMI
13 Palau
14 Papua New Guinea
15 Samoa
16 Solomon Islands
17 Timor Leste
18 Tokelau
19 Tonga
20 Tuvalu
21 Vanuatu
22 Wallis and Futuna
13 As at 2017-2018

Capacity for producing Economic Statistics in the Pacific
Page 23 of 23
Appendix 2: Areas of lead and secondary technical assistance responsibility: summary table13
ABS
ADB
IMF/
PFTA
C
IMF/
TAO
LAM
IMF
HQ
SPC
SNZ
US
Gra
duat
e Sc
hool
UN
SD/E
SCAP
SIAP
USP
Institutional setting
Strategic planning for Economic Statistics (National strategy for the development of statistics)
S S S S L S √
Economic data dissemination S S S S L L S
Statistical infrastructure
Setting-up of statistical business registers S S L S S √
Regional standards and classifications S S L S √
Inter-agency data sharing L L L S S
Prices and costs
CPI S S S √ L S S √ √
Producer Price Index S S √ L S √
Trade Price Index S S √ L S S √
Demand and output
National accounts S S L √ S S S S √ √
International merchandise trade statistics L S S S √
Income and wealth
External sector statistics (balance of payments, international investment position (IIP) and external debt)
L L √ S √
Money and banking
Monetary statistics (broad money and credit aggregates)
L S √
Government
Government finance statistics (general government operations and general government debt)
S L √ S √
Natural resources and the environment
Environmental economic accounting (natural resources)
S L √ √
Number of staff * 5 5 3 n/a 2 1 2 5 4 4
L=Lead agency; S=supporting agency; √= discipline in which learning opportunities are provided • Mix of economic statisticians work in the region and other ABS staff assist in conjunction with their domestic work
programme.