CAP 754 UK Regional Air Services
121
CAP 754 UK Regional Air Services A study by the Civil Aviation Authority www.caa.co.uk Economic Regulation Group
Transcript of CAP 754 UK Regional Air Services

CAP 754
UK Regional Air Services
A study by the Civil Aviation Authority
www.caa.co.uk
Economic Regulation Group

CAP 754
UK Regional Air Services
A study by the Civil Aviation Authority
Economic Regulation Group
24 February 2005

CAP 754 UK Regional Air Services
© Civil Aviation Authority 2005
ISBN 0 11790 344 2
Published 24 February 2005
Enquiries regarding the content of this publication should be addressed to:Economic Regulation Group, Civil Aviation Authority, CAA House, 45-59 Kingsway, London, WC2B 6TE
The latest version of this document and all applicable amendments are available in electronic format atwww.caa.co.uk/publications, where you may also register for e-mail notification of amendments.Details for purchasing paper copy can be found at the same web address.
CAP 754 UK Regional Air Services
Contents
Executive Summary
Introduction
Chapter 1 Overview of UK regional air services
Context 1
Structure of the UK economy 1
The Regional Economic Development Agenda 1
Effect of liberalisation 2
Traffic development at regional airports since 1980 3
Chapter 2 International services from UK regional airports
Growth in international services 7
Changes in travel patterns 9
Developments in international services from Manchester and Birmingham 9
Developments in international scheduled services at other UK regional airports 13
Developments in long-haul services 18
UK regional–USA services 21
Fifth-freedom services 22
Case study 1: Continental Airlines 23
Charter services 24
Chapter 3 Services between UK regional airports
Impact of new entry 30
Surface transport alternatives 32
Chapter 4 Services between UK regional airports and London
Developments since 1990 33
Traffic development on five regional routes to London 37
The recent picture 40
Case study 2: VLM Airlines 42
Fares comparison 43
Case study 3: Inverness (and the Highlands and Islands) 44
Access to Heathrow 45
Page iii24 February 2005
CAP 754 UK Regional Air Services
Chapter 5 Connections to the global network
“Self-interlining” 52
Connections via airports other than Heathrow 55
Summary 56
Chapter 6 Developments in regional services – the airline perspective
The changing structure of the regional airline market 57
The advent of no-frills airlines 60
Case study 4: Jet2.com 61
Case study 5: flybe 62
Case study 6: BA’s “Future Size and Shape” restructuring 65
Impact of no-frills airlines on growth at UK regional airports 65
Regional jets 66
Case study 7: Regional jets 67
Airline competition 67
Case study 8: bmi regional and bmibaby 72
Emerging trends 72
Case study 9: Air Southwest 73
Charter services 73
Inbound traffic 74
Barriers to new regional services 74
Withdrawing service 75
Environmental issues 75
Chapter 7 Developments in regional services – the airport perspective
Airport ownership 78
Airport competition 80
Case Study 10: Exeter Airport 83
Case study 11: Bristol Airport 83
Scheduled international services from Bristol 84
Case study 12: Liverpool John Lennon Airport 85
Scheduled international services from Liverpool 85
“Visibility” and perception of airports 86
Challenges for capacity development 87
Chapter 8 Public policy initiatives
Slot allocation and regional access 89
Public Service Obligations 90
The use of PSOs to protect a regional service to London 92
Route Development Funds 93
Case Study 13: Route Development Funds 95
Chapter 9 Conclusions
Page iv24 February 2005
CAP 754 UK Regional Air Services
List of Figures
Figure No. Title Page No.
Figure 1 Total passengers at UK regional airports ix
Figure 2 The “virtuous circle” x
Figure 3 International scheduled passengers at UK regional airports 1990–2004 xi
Figure 4 Passengers between UK regional airports and London xii
Figure 5 Domestic scheduled services to Heathrow 1986–2004 xiii
Figure 1.1 Traffic at UK airports 1980–2004 3
Figure 2.1 Number of frequently served international scheduled destinations from UK regional airports, 1990 and 2004 7
Figure 2.2 International scheduled and charter passengers at Manchester 1990–2004 9
Figure 2.3 International connections between selected UK regional centres and major European centres – 1994 and 2004 17
Figure 2.4 Scheduled services between UK regional airports and the US 1986–2004 20
Figure 3.1 Connections between selected UK regional centres – 1994 and 2004 27
Figure 3.2 Traffic on Belfast–Edinburgh routes 1990–2004 31
Figure 3.3 Traffic on Bristol–Edinburgh routes 1990–2004 31
Figure 4.1 Traffic between UK regional airports and London 34
Figure 4.2 Traffic on London–Belfast routes by airport-pair 1990–2004 38
Figure 4.3 Traffic on London–Edinburgh routes by airport-pair 1990–2004 38
Figure 4.4 Traffic on London–Glasgow routes by airport-pair 1990–2004 39
Figure 4.5 Traffic on London–Inverness routes by airport-pair 1990–2004 39
Figure 4.6 Traffic on London–Newcastle routes by airport-pair 1990–2004 40
Figure 7.1 Traffic on Liverpool–Barcelona and Manchester–Barcelona 1990–2004 85
Figure 7.2 Traffic on Liverpool–Nice and Manchester–Nice 1990–2004 85
Page v24 February 2005

Page vi

CAP 754 UK Regional Air Services
List of Tables
Table No. Title Page No.
Table 1 International destinations with a frequent scheduled service from UK regional airports: 1990 and 2004 xi
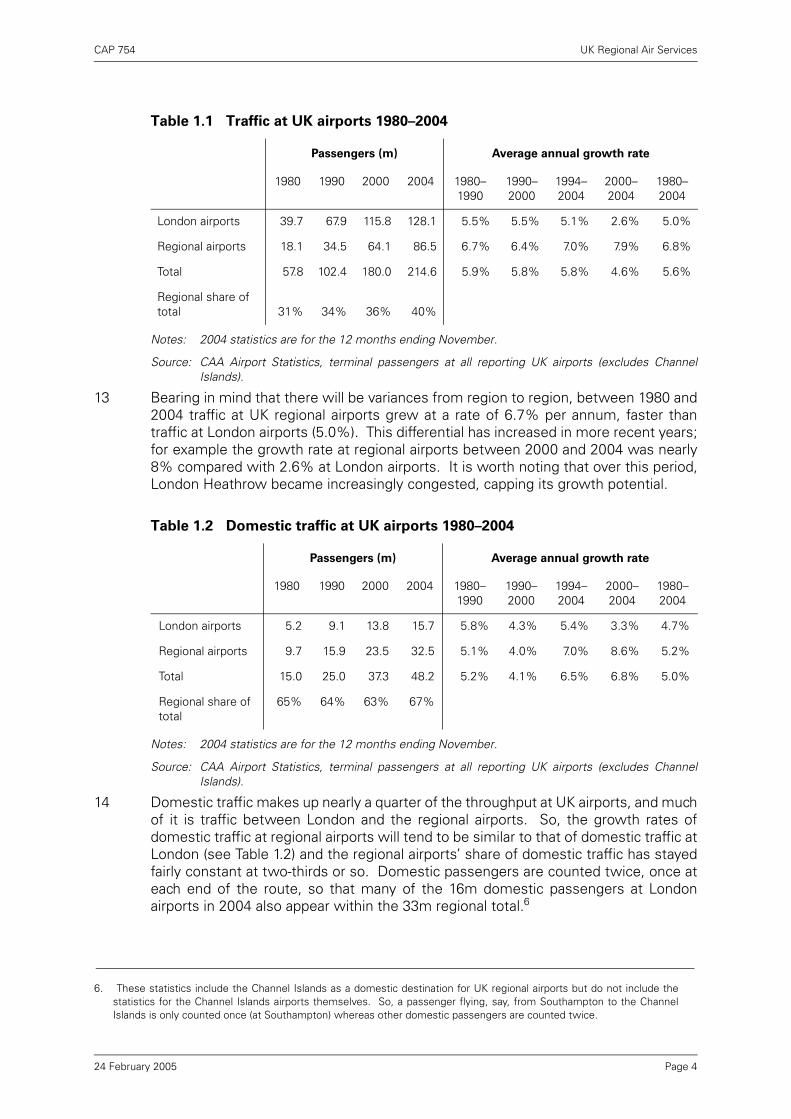
Table 1.1 Traffic at UK airports 1980–2004 4
Table 1.2 Domestic traffic at UK airports 1980–2004 4
Table 1.3 Total international traffic at UK airports 1980–2004 5
Table 1.4 International charter traffic at UK airports 1980–2004 5
Table 1.5 International scheduled traffic at UK airports 1980–2004 6
Table 2.1 International scheduled traffic at top six regional airports 1990–2004 8
Table 2.2 International scheduled flights from Manchester 1990–2004 10
Table 2.3 International scheduled flights from Birmingham 1990–2004 12
Table 2.4 International scheduled destinations from UK regional airports 1990–2004 14
Table 2.5 International long-haul scheduled flights at Manchester 18
Table 2.6 International passengers at regional airports, 2004 24
Table 2.7 Destination of charter passengers from UK regional airports, 2000 and 2004 25
Table 3.1 Traffic on the main inter-regional scheduled routes in 2004 28
Table 3.2 Traffic on the main inter-regional scheduled routes in 1990 29
Table 3.3 Traffic on scheduled services between Belfast and Liverpool/Manchester 1990–2004 30
Table 4.1 Destinations and frequency on domestic scheduled services from London: 1990 and 2004 35
Table 4.2 UK regional airports served from London 36
Table 4.3 Services between UK regional airports and London gained and lost since 2003 41
Table 4.4 Return fares on services between Scotland and London 43
Table 4.5 Air fares on services between Edinburgh and Gatwick 44
Table 4.6 Scheduled flights between UK regional airports and Heathrow 1992–2004 46
Table 5.1 Hub share of passengers from regional airports who connect en route 49
Table 5.2 Services from UK regional airports to European hubs, 1990 and 2003 50
Table 5.3 Services from UK regional airports to European hubs, 2003 50
Table 5.4 Connecting traffic on routes to major European hubs 51
Page vii24 February 2005
CAP 754 UK Regional Air Services
Table 5.5 Proportion of connecting passengers on services to European hubs – comparison of hub airlines with other airlines 52
Table 5.6 Connecting traffic at London airports from UK regional airports, 2003 55
Table 5.7 Shortest elapsed journey times from UK regional points to long-haul destinations – on-line connections via Amsterdam relative to Heathrow 56
Table 6.1 Principal scheduled airlines serving UK regional airports 60
Table 6.2 Business/leisure mix on a selection of routes to European business destinations, 2003 66
Table 6.3 Business/leisure mix on a selection of domestic routes from London, 2003 66
Table 6.4 Examples of regional routes with direct competition (1) 70
Table 6.5 Examples of regional routes with direct competition (2) 72
Table 7.1 Traffic development at UK airports 1990–2004 (000s) 79
Table 7.2 Total passengers at top 15 UK regional airports 1990–2004 81
Table 7.3 Ownership of UK airports 82
Table 8.1 Public Service Obligations imposed by the UK 95
Page viii24 February 2005
CAP 754 UK Regional Air Services
Executive Summary
A study of UK regional air services
A good-news story for the UK regions
1 This study paints a broad picture of the development of UK regional air services overthe last 10–20 years, examining emerging trends and drawing some conclusions. Itis based on statistical data collected routinely by the CAA from UK airlines andairports, and on interviews with representatives of regional airlines, airports andregional bodies. It became apparent from these interviews that issues differed fromregion to region; this was particularly so for the more peripheral regions such asNorthern Ireland or northern Scotland.
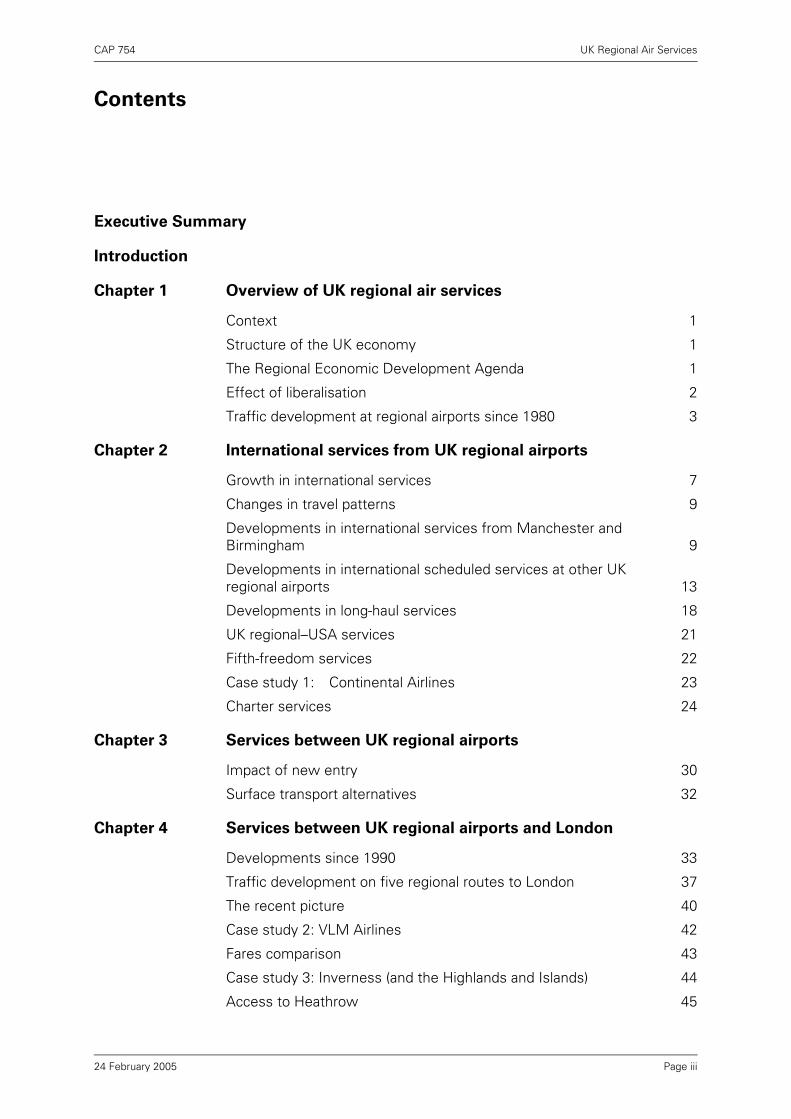
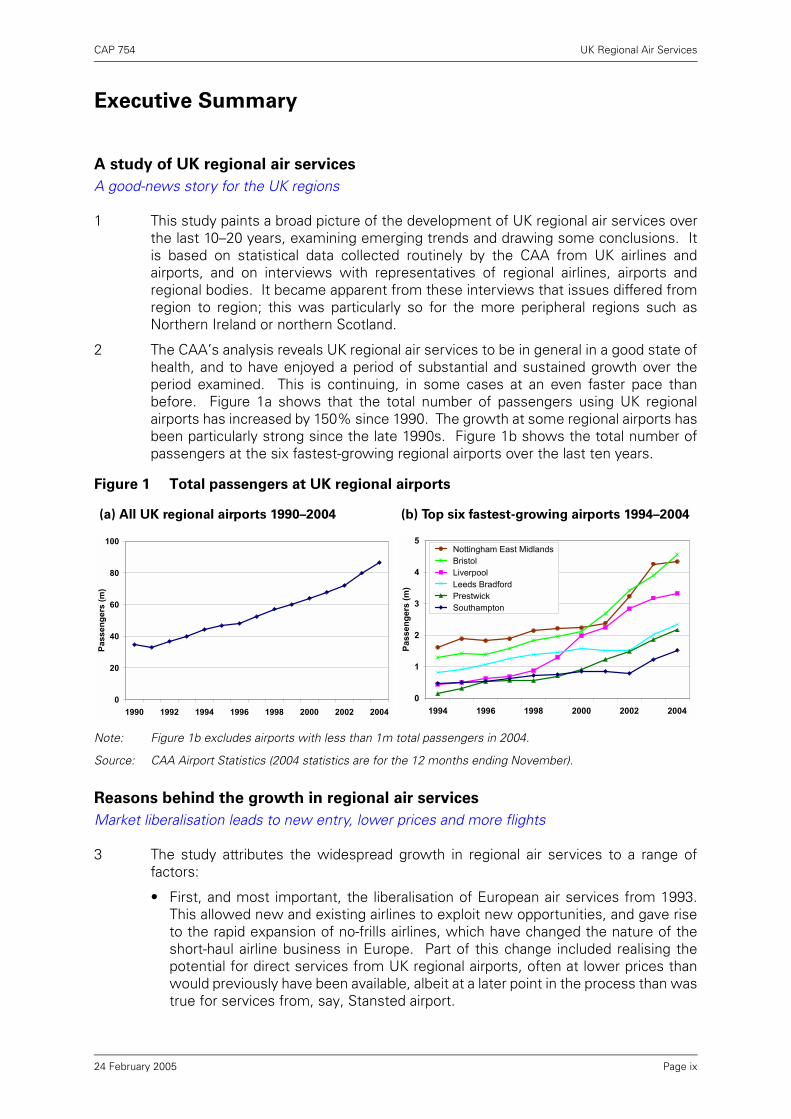
2 The CAA’s analysis reveals UK regional air services to be in general in a good state ofhealth, and to have enjoyed a period of substantial and sustained growth over theperiod examined. This is continuing, in some cases at an even faster pace thanbefore. Figure 1a shows that the total number of passengers using UK regionalairports has increased by 150% since 1990. The growth at some regional airports hasbeen particularly strong since the late 1990s. Figure 1b shows the total number ofpassengers at the six fastest-growing regional airports over the last ten years.
Note: Figure 1b excludes airports with less than 1m total passengers in 2004.
Source: CAA Airport Statistics (2004 statistics are for the 12 months ending November).
Reasons behind the growth in regional air services
Market liberalisation leads to new entry, lower prices and more flights
3 The study attributes the widespread growth in regional air services to a range offactors:
• First, and most important, the liberalisation of European air services from 1993.This allowed new and existing airlines to exploit new opportunities, and gave riseto the rapid expansion of no-frills airlines, which have changed the nature of theshort-haul airline business in Europe. Part of this change included realising thepotential for direct services from UK regional airports, often at lower prices thanwould previously have been available, albeit at a later point in the process than wastrue for services from, say, Stansted airport.
Figure 1 Total passengers at UK regional airports
(a) All UK regional airports 1990–2004 (b) Top six fastest-growing airports 1994–2004
0
20
40
60
80
100
1990 1992 1994 1996 1998 2000 2002 2004
Pass
enge
rs (m
)
0
1
2
3
4
5
1994 1996 1998 2000 2002 2004
Pass
enge
rs (m
)
Nottingham East Midlands Bristol Liverpool Leeds Bradford Prestwick Southampton
Page ix24 February 2005
CAP 754 UK Regional Air Services
• Second, these new services unlocked latent demand from passengers who werekeen to travel from their local airport, rather than via London or some otherconnecting point. As demand began to increase, so did the realisation of thepossibilities of low-cost air travel, and hence the propensity to fly; what is more,the profile of the airlines, airports and regions concerned also increased.
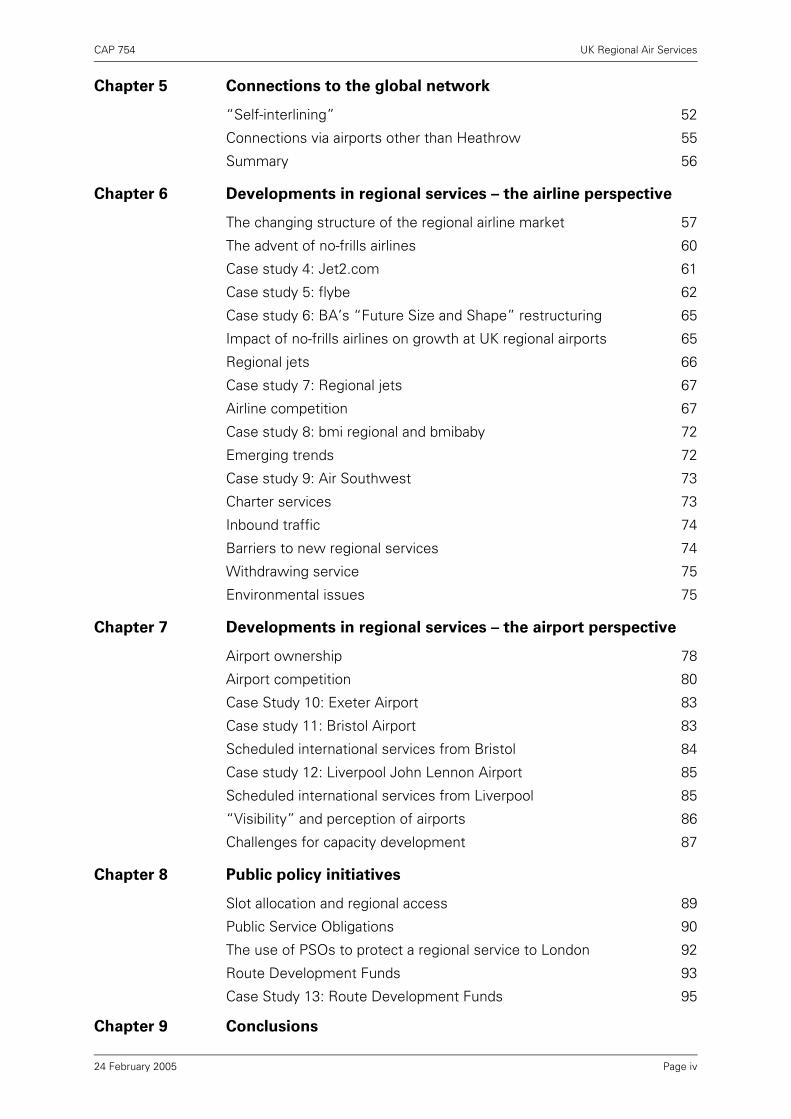
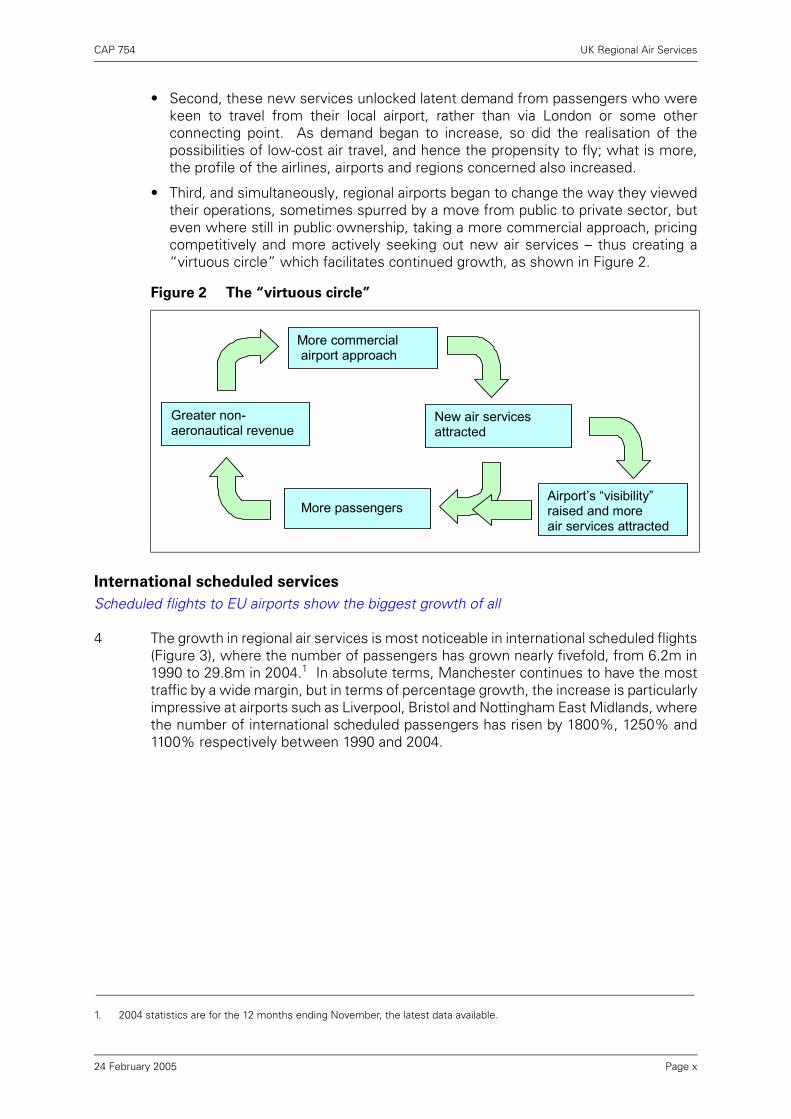
• Third, and simultaneously, regional airports began to change the way they viewedtheir operations, sometimes spurred by a move from public to private sector, buteven where still in public ownership, taking a more commercial approach, pricingcompetitively and more actively seeking out new air services – thus creating a“virtuous circle” which facilitates continued growth, as shown in Figure 2.
International scheduled services
Scheduled flights to EU airports show the biggest growth of all
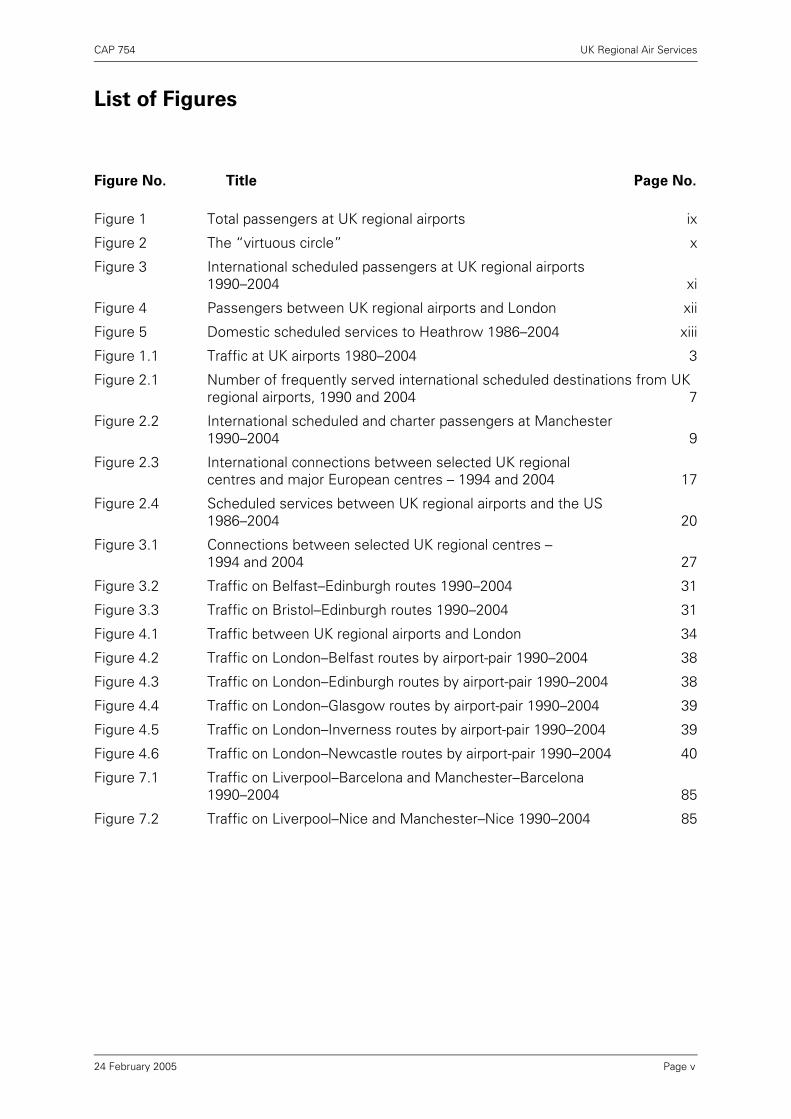
4 The growth in regional air services is most noticeable in international scheduled flights(Figure 3), where the number of passengers has grown nearly fivefold, from 6.2m in1990 to 29.8m in 2004.1 In absolute terms, Manchester continues to have the mosttraffic by a wide margin, but in terms of percentage growth, the increase is particularlyimpressive at airports such as Liverpool, Bristol and Nottingham East Midlands, wherethe number of international scheduled passengers has risen by 1800%, 1250% and1100% respectively between 1990 and 2004.
Figure 2 The “virtuous circle”
1. 2004 statistics are for the 12 months ending November, the latest data available.
Greater non-aeronautical revenue
More commercial airport approach
New air services attracted
Airport�s �visibility� raised and more air services attracted
More passengers
Page x24 February 2005

CAP 754 UK Regional Air Services
Source: CAA Airport Statistics (2004 statistics are for the 12 months ending November)
5 The total number of international scheduled routes2 from UK regional airports in 2004is nearly four times that in 1990, with more routes being added during 2005. Table 1shows the increase in the number of destinations for the ten biggest regional airports.Although a proportion of the new services is to popular leisure-orientedMediterranean destinations, often already served by charters, there are also manynew links to major business centres.
Notes: Based on destinations with a minimum frequency broadly equating to a daily round-trip serviceeach weekday.
Source: CAA Airport Statistics and OAG World Airways Guide December 2004.
Figure 3 International scheduled passengers at UK regional airports 1990–2004
2. Based on routes with a minimum frequency broadly equating to a daily round-trip service each weekday.
Table 1 International destinations with a frequent scheduled service from
UK regional airports: 1990 and 2004
International destinations
Top 10 UK regional airports 1990 2004
Manchester 15 60
Birmingham 13 36
Bristol 5 21
Nottingham East Midlands 3 17
Liverpool 1 15
Newcastle 4 15
Glasgow Prestwick 0 12
Edinburgh 3 10
Glasgow 5 10
Leeds Bradford 4 10
0
5
10
15
20
25
30
35
1990 1995 2000 2004
Pass
enge
rs (m
)
Page xi24 February 2005
CAP 754 UK Regional Air Services
Long-haul scheduled services
Less dramatic but steady growth in long-haul flights
6 Developments in long-haul services from regional airports – which are predominantlyoperated by foreign airlines – have been less dramatic, although there has beensteady growth. While Manchester has a much bigger share than any other UKregional airport, there has been some increase in the diversity of UK airports offeringscheduled flights to long-haul destinations. In 1986 there was just one daily servicebetween a UK regional airport and the US, whereas 16 are expected to be operatingin summer 2005. Newark will be linked to six UK regional airports – Birmingham,Glasgow, Manchester and the new gateways of Edinburgh, Belfast and Bristol – withthe majority of services operated by smaller, narrowbody aircraft. The Edinburgh andBelfast routes, and a new Glasgow–Dubai service, have been offered routedevelopment funding. Most of the long-haul routes are to hub airports, serving notjust the destination itself but also points beyond. This suggests that point-to-pointmarkets need to be relatively strong to support a frequent long-haul service, whichmay limit the scope for new long-haul services at regional airports with relatively smallcatchment areas.
Services between regional airports and London
Strong growth in services to London and a wider range of services, but scarce capacity constrains services to Heathrow
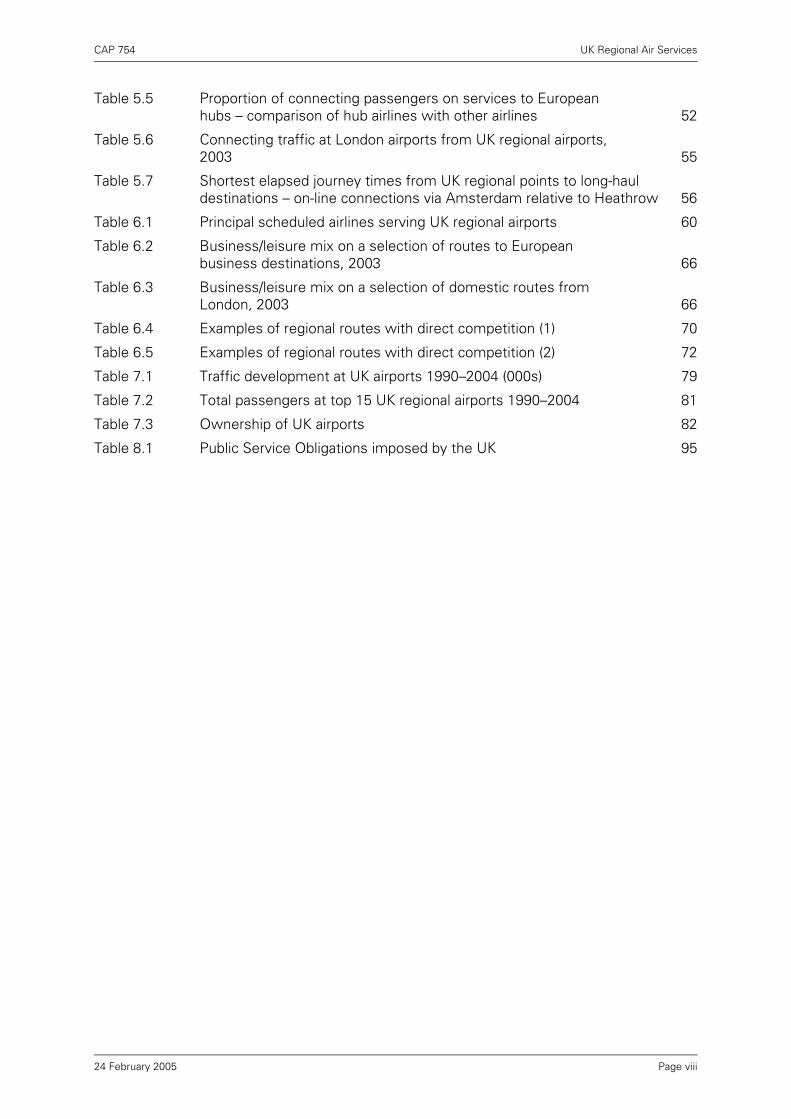
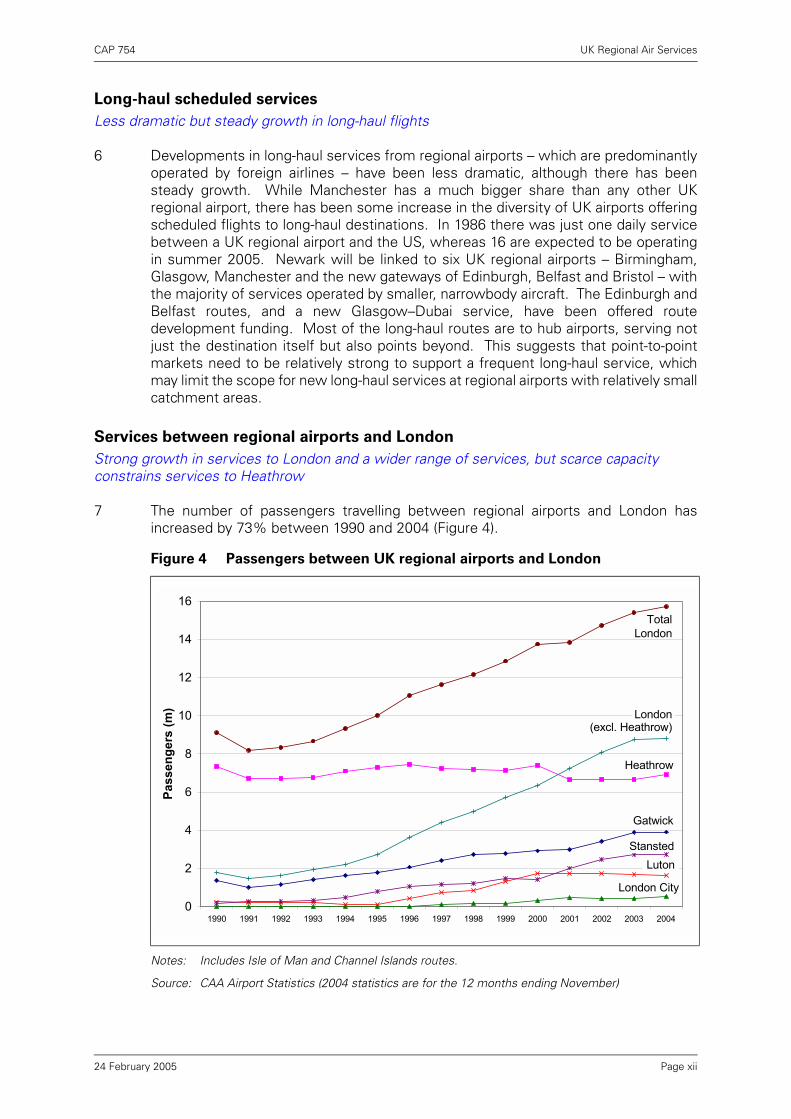
7 The number of passengers travelling between regional airports and London hasincreased by 73% between 1990 and 2004 (Figure 4).
Notes: Includes Isle of Man and Channel Islands routes.
Source: CAA Airport Statistics (2004 statistics are for the 12 months ending November)
Figure 4 Passengers between UK regional airports and London
0
2
4
6
8
10
12
14
16
1990 1991 1992 1993 1994 1995 1996 1997 1998 1999 2000 2001 2002 2003 2004
Pass
enge
rs (m
)
Heathrow
Total London
Gatwick
Stansted
London City
Luton
(excl. Heathrow)London
Page xii24 February 2005
CAP 754 UK Regional Air Services
8 Total passenger numbers on services to Heathrow have remained relatively staticwithin the 6–8m range since 1990. Heathrow remains the principal London airport forregional services in terms of passenger numbers, with 44% of the London total in2004, but this share has fallen from 80% in 1990. Virtually all the recent growth hasbeen at other London airports, partly because many of the airlines newly offeringservices to London from regional airports choose not to serve Heathrow foroperational reasons, but also because the scarcity of capacity has constrained furtherexpansion at Heathrow.
9 There is now a much wider spread of services from London airports other thanHeathrow, giving rise to travel options (often at a lower price) that did not previouslyexist. 21 UK regional airports (including the Channel Islands and Isle of Man) wereserved from London airports in 2004 compared with 20 in 1990, and over the sameperiod the average number of flights to London each day rose by 43%. This overallexpansion was welcomed by many of those interviewed during research for the study.Between January 2003 and January 2005, nine new services to London have beenintroduced from UK regional airports, two of which were to Heathrow. In the sameperiod a further two routes have been introduced but then suspended, while only twoexisting routes have been suspended.
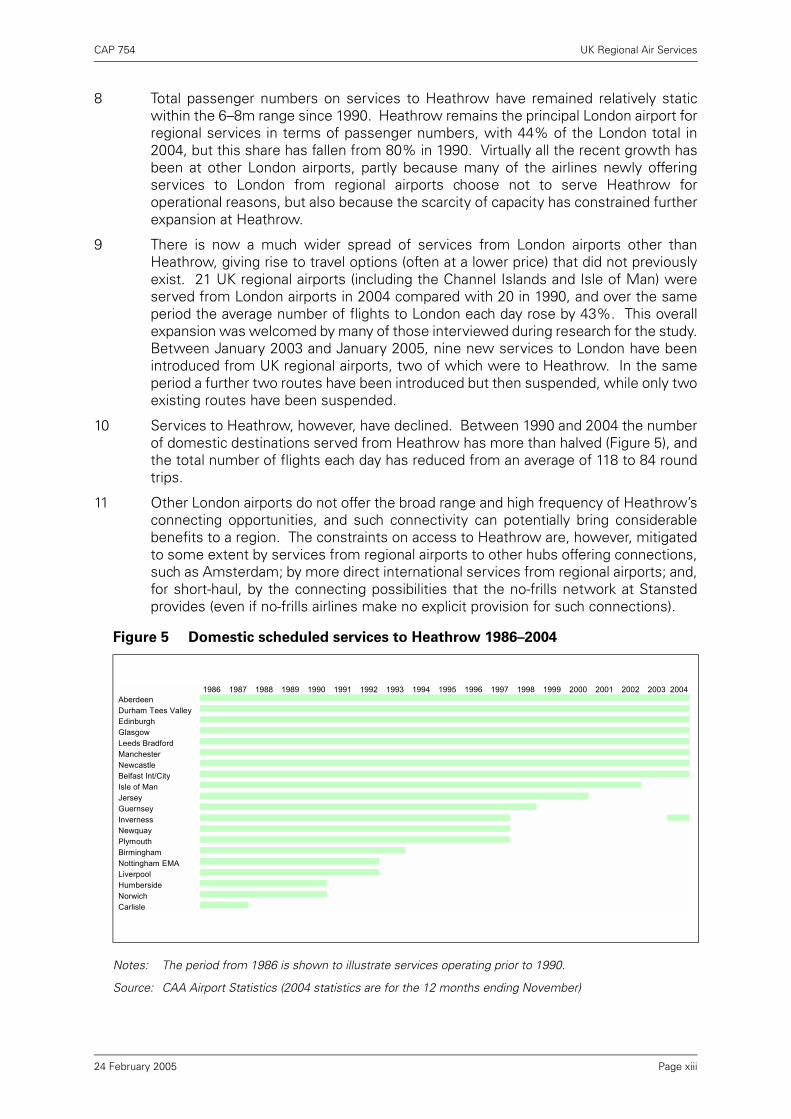
10 Services to Heathrow, however, have declined. Between 1990 and 2004 the numberof domestic destinations served from Heathrow has more than halved (Figure 5), andthe total number of flights each day has reduced from an average of 118 to 84 roundtrips.
11 Other London airports do not offer the broad range and high frequency of Heathrow’sconnecting opportunities, and such connectivity can potentially bring considerablebenefits to a region. The constraints on access to Heathrow are, however, mitigatedto some extent by services from regional airports to other hubs offering connections,such as Amsterdam; by more direct international services from regional airports; and,for short-haul, by the connecting possibilities that the no-frills network at Stanstedprovides (even if no-frills airlines make no explicit provision for such connections).
Notes: The period from 1986 is shown to illustrate services operating prior to 1990.
Source: CAA Airport Statistics (2004 statistics are for the 12 months ending November)
Figure 5 Domestic scheduled services to Heathrow 1986–2004
1986 1987 1988 1989 1990 1991 1992 1993 1994 1995 1996 1997 1998 1999 2000 2001 2002 2003 2004
Carlisle
Isle of ManJerseyGuernsey
Nottingham EMALiverpoolHumbersideNorwich
InvernessNewquayPlymouthBirmingham
AberdeenDurham Tees ValleyEdinburghGlasgowLeeds Bradford
NewcastleManchester
Belfast Int/City
Page xiii24 February 2005

CAP 754 UK Regional Air Services
12 Congestion has created a scarcity of suitable take-off and landing slots at Heathrowand made those slots more valuable. Airlines are able to switch slots to otherservices, and their motivation stems less from unprofitability of domestic servicesthan their being potentially less profitable than an alternative use of the scarce slots.
13 There may be some natural constraints on the extent to which the remainingHeathrow-based airlines operating domestic services would wish significantly toreduce the amount of regional feed traffic they bring into an airport they use as a hub,as this would negatively impact on the viability of other services operating from thathub. While the Channel Islands and Isle of Man lost their Heathrow services between1998 and 2002, there has been no complete loss of Heathrow services by a UKregional city since 1997, when Inverness, Newquay and Plymouth services weretransferred to Gatwick (Inverness has since regained a once-daily Heathrow service).Previous losses of Heathrow services were as far back as 1992–1993 or earlier(Figure 5). The domestic services remaining at Heathrow are all operated by BA orbmi.
14 The extent to which regional access to Heathrow in particular can be protected, andthe interaction with the method by which slots at congested airports such asHeathrow are allocated, is an area where there has been lively debate. The CAAbelieves that the introduction of a formalised secondary market in slots is the bestway of dealing with the allocation of scarce capacity at Heathrow. If such tradingmade it easier for Heathrow airlines serving the regions to expand their portfolios, itcould reduce the pressure on regional services. It might also provide opportunitiesfor non-airline ownership of slots.
Other regional air services
Stability in region-to-region connections
15 The study found no great change in the air network between UK regional centres,although traffic volumes have grown. The densest of such routes are those servingNorthern Ireland and Scotland; in 2005 Aberdeen, Edinburgh and Glasgow will eachhave air services to between 12 and 14 other UK regional centres; Inverness will belinked to five; and Belfast will be linked to as many as 17.
16 Charter traffic from regional airports showed strong growth in the 1990s but has nowlevelled off. Some charter airlines are operating an increasing number of routes on ascheduled basis and to longer-haul destinations.
Public policy initiatives
With the market delivering growth in regional air services, intervention requires a cautious approach
17 The study concludes that the regional air services market is generally working well,and developing at a healthy rate. The link with the wider regional economy isunderstood, and it is encouraging that development agencies and devolvedadministrations are vigorously engaged in considering air transport policy questions,as part of wider strategies for developing regional economies.
18 Public Service Obligations (PSOs) can play a valuable role when used to protectcertain routes that are vital to the economic development of a region and that cannototherwise sustain a commercial air service. However, any wider application of PSOs,for instance the ring-fencing of slots at Heathrow, carries a greater risk because of thepotential for distortion of the normal workings of the airline market.
Page xiv24 February 2005

CAP 754 UK Regional Air Services
19 The use of public funding through Route Development Funds has proved successfulin Scotland and Northern Ireland in helping to provide a limited “kick-start” to new airservices and in overcoming information and perception problems to the benefit of theregion’s overall economic development. However, this sort of support shouldcontinue to be used cautiously and against strict and transparent criteria.
Conclusions
Regional air services are generally in good health
20 Looking forward, the challenge for policy makers is to ensure that the dynamism ofthe aviation industry can continue to facilitate regional economic growth by workingwith the grain of the commercial incentives that have driven the success of UKregional air services so far.
21 The study explores these topics in more detail, and is structured as follows:
Chapter 1 Overview of UK regional air services
Chapter 2 International services from UK regional airports
Chapter 3 Services between UK regional airports
Chapter 4 Services between UK regional airports and London
Chapter 5 Connections to the global network
Chapter 6 Developments in regional services – the airline perspective
Chapter 7 Developments in regional services – the airport perspective
Chapter 8 Public policy initiatives
Finally, the conclusions of the study are set out in Chapter 9.
Page xv24 February 2005

Page xvi
CAP 754 UK Regional Air Services
Introduction
1 This study paints a broad picture of recent developments in UK regional air servicesas we enter 2005. It is intended to enhance the evidence base and so enrich theongoing debate within Government, in the regions and among industry participantsabout the optimal policy responses to the stated Government aim of encouraginggrowth of regional airports.
2 As well as setting out relevant statistical data over the last 10–20 years, andassociated factual information, the study also examines developing trends and drawssome conclusions. The study does not seek to cover every possible aspect ofregional air services, and deliberately focuses on passenger services and not cargo(which can represent particularly significant business for some regional airports).Rather it seeks to tease out the issues that seem to be particularly relevant orsignificant, and to look at these more closely. It is necessarily a snapshot in time; UKregional air services are changing fast and the aviation market generally can be highlydynamic.
3 Overall, the picture is that regional air services are in good health and that normalmarket forces have delivered this. Services in the regions are expanding, both interms of destinations and frequency, particularly to European cities; regional airportshave developed a more commercial view of their operations, competing for airlinesand passengers; and there is a rich mix of strongly competing airlines that are seekingout market opportunities where they arise. Indeed, a “virtuous circle” can developwhereby airports’ more commercial approach, competitive pricing and improvedfacilities stimulate traffic growth, which in turn generates revenue from non-aeronautical activities and underpins further expansion. Long-haul services from UKregional airports have developed more slowly than short-haul, but recentdevelopments here are also encouraging, in some cases facilitated through routedevelopment funding.
4 The main difficulties facing the regions are probably those surrounding access tolimited capacity at Heathrow. But there do not generally seem to be other significantphysical constraints to growth at regional airports. There are some current publicpolicy initiatives that seek to enhance the desirability of services to and from theregions, which are discussed in Chapter 8.
5 The study is based on various sources. Primarily it draws from analyses of CAAstatistics relating to UK airlines and airports, and CAA origin and destinationpassenger surveys at UK airports, supplemented by other published sources such asschedule data and news items. In addition, it draws on information gleaned from aseries of meetings with key stakeholders, including Government, airlines, airports,chambers of commerce, devolved administrations and regional developmentagencies. The need to limit the scope of the study to manageable proportionsdictated that interviews were confined to areas of the UK furthest from Londonwhere regional air services are a particularly prominent issue. Therefore not everyairport or even every region was interviewed. The Channel Islands and the Isle of Man(which are outside the EU single market) have also been omitted from the main scopeof the study, although the obvious importance of air services to them is recognised.What came across from the many meetings that were held was how the issuesdiffered from region to region; this was particularly so for the more peripheral regionssuch as Northern Ireland and northern Scotland.
Page xvii24 February 2005
CAP 754 UK Regional Air Services
6 The statistical data in the study generally focuses on the period from 1990 onwards,mainly to show the effect of progressive liberalisation of the European market, butwhere appropriate, such as the overview in Chapter 1, the data goes back a littlefurther. Over this period of time there have been changes to the coverage of anddefinitions used in the CAA Airport Statistics. Every attempt has been made to ensureconsistency and these changes should not significantly affect comparisons betweendifferent time periods other than possibly at the most detailed level.
7 The paper does not explicitly seek to explore any environmental consequences ofincreases in regional air services, but the CAA remains committed to sustainabledevelopment in all aspects of aviation.
8 We express our thanks to those who gave their time to speak to us about these issuesand our apologies to those we were unable to see.
Page xviii24 February 2005

CAP 754 UK Regional Air Services
Chapter 1 Overview of UK regional air services
Context
1 This study analyses UK regional air services and attempts a snapshot of what is anever-changing picture of regional economic development generally, and regional airservices in particular. The CAA naturally seeks to explore these issues from anaviation-specific perspective, but it is important to set those issues in the context ofthe underlying structure of the UK economy, and the respective roles played byLondon (as the capital city and a major international financial centre) and the differentregions.
Structure of the UK economy
2 London dominates the national economy to a greater extent than is true for mostother capital cities in Europe. As well as being the major population centre, Londonis the key business and financial centre of the UK, and indeed one of the world’sleading financial centres; it is also the home of other key industries and ofgovernment. London contributes nearly 20% to the UK’s total GDP, and the SouthEast, including London, accounts for around one-third.1 GDP per head in London isalso around 30% higher than the UK average.
3 By comparison, Germany, for example, has a more even distribution of GDP and nosingle city plays such an important role. While the region of Nordrhein-Westfalencontributes around 20% to total German GDP, this region includes five major cities(Bonn, Cologne, Dusseldorf, Essen and Dortmund). The Bayern region (whichincludes Munich and Nuremberg) contributes around 17%, and Baden-Württemberg(Stuttgart, Freiburg and Karlsruhe) around 15%.2 These and other areas alsooutperform the EU average in terms of GDP per head – for example in 2001 Stuttgart,Oberbayern (Munich) and Darmstadt (Frankfurt) each had between 130% and 170%of average EU GDP per head. This compared favourably with Greater Manchester at91%, the West Midlands at 95% and South Yorkshire at 77% of average EU GDP perhead.3
4 What this shows is that London (and the South East more generally) is a much moreimportant element of the UK’s total economy than is true for any one city or region inGermany. This is also true in comparison with many other European countries. Thishas implications for the structure of air services that will best match with theunderlying economic drivers of demand, for both business and leisure markets. Whileeconomic growth in the UK regions may narrow the differential with the South East,it is likely that London and the South East will remain the biggest contributors to UKGDP for the foreseeable future, with consequent effects on air services.
The Regional Economic Development Agenda
5 The development of regional air transport is closely linked to the broader regionaleconomic development agenda. Since 1997 there has generally been an increasedrole for devolved administrations and regional development agencies in co-ordinatingregional economic development and regeneration, seeking to improve regions’productivity and growth and to address any identified market failures.
1. Source: “Regional Gross Domestic Product”, Office of National Statistics, February 2001.2. Source: “GDP by Bundesland 1991 to 2003”, Statistisches Landesamt Baden-Württemberg.3. Source: “Productivity in the UK – The Regional Dimension”, HM Treasury, November 2001.
Page 124 February 2005
CAP 754 UK Regional Air Services
6 In Scotland, Northern Ireland and Wales, regional development falls primarily to thedevolved administrations and to development agencies such as Scottish Enterpriseand Highlands and Islands Enterprise; Invest Northern Ireland; and the WelshDevelopment Agency, respectively. In England it falls mainly to the nine RegionalDevelopment Agencies (RDAs). The primary role of these bodies is to act as strategicdrivers of regional economic development in their region. The RDAs aim to enable theregions to improve their relative competitiveness and reduce the imbalance thatexists within and between regions and to draw up economic strategies to achievethese objectives. Their work also has a direct relationship with regional transportstrategies and they each have delegated budgets to achieve their various goals.
7 Many (but not all) of these agencies will place emphasis on enhancing air servicesfrom their region. But the choice of spending any money in this area must bebalanced against the large number of other competing priorities, and must be justifiedas representing value for taxpayers’ money. All the agencies have to work within andalongside frameworks provided by central Government and local authoritydevelopment plans but retain flexibility to target their resources in the way theyconsider most effective. The Government is now working with regional bodies todevelop guidance for devolved administrations and development agencies – in theform of a protocol to which they can voluntarily adhere – regarding the operation ofRoute Development Funds (see Chapter 8) aimed at bringing forward new air servicesand overcoming information and perception problems to benefit the region.
8 Aviation is, primarily, a support service for other forms of economic activity, whetherthat be business or leisure. While an enhanced network of air services from a regionwould be likely to be conducive to economic growth, it is unlikely alone to be aneffective tool for driving economic development. It can, however, make a particularcity or region more attractive, at the margin, than another as a location for business.Development agencies therefore need to consider whether it is better to allowinvestment in air transport to occur solely through a private sector response toincreasing demand from businesses and passengers, or to take a more proactiveapproach. This may include using public funds to support new services and toadvance the point where demand makes them commercially viable in their own right;and to improve the perception of the viability of services from regions. Agencies alsoneed to consider whether the use of public funds to achieve this end would representvalue for money per se, and better value for money than alternative options for usingthe available budget.
Effect of liberalisation
9 In the past, regulatory restrictions may have prevented air services, at least oninternational routes, from properly responding to the demand for air travel that hasbeen shown in recent years to exist in the UK regions. The removal of the limits onmarket access within the EU with the advent of the single EU aviation market from1993 onwards allowed new and existing airlines to exploit these opportunities andtransform air services from UK regions into the dynamic and much expanded networkof services that exists today.
10 The impact of liberalisation was not felt immediately, for a number of reasons. First,there was the usual time lag between the removal of regulatory restrictions and theexploitation of new opportunities by airlines. New entrants or expanding airlinesneeded time to build their fleets and to respond to the success of the first movers.Second, liberalisation affected the denser London markets sooner than thinnerregional markets. Finally, it took time for consumers to change their existing patternsof behaviour and to respond fully to the new offers available in the marketplace.
Page 224 February 2005

CAP 754 UK Regional Air Services
11 This change has been delivered almost entirely without the injection of public moneyinto the sector. Rather it has been the result of commercially focused airlines andairports seeking out opportunities as and when they have become available andmaking investments accordingly. Aviation fortunately does not face the sameproblems of the rail or road sectors and, in the context of regional airports at least, hasnot faced capacity constraints on any major scale. This points to the possibility ofcontinued growth in regional air services through the airline market operatingeffectively in an increasingly liberalised and competitive environment, aided by thesharper commercial focus within regional airports and greater innovation in attractingviable services to and from UK regions. The challenges facing peripheral regions suchas Northern Ireland and northern Scotland in relation to air services are likely to bedifferent in nature from those in more densely populated regions. It is against thisbackdrop that policy issues relating to regional air services (discussed in Chapter 8)need to be considered.
Traffic development at regional airports4 since 1980
12 Between 1980 and 20045 the total traffic at UK airports grew from 58m to 215mpassengers, an average annual growth rate of 5.6% (Figure 1.1 and Table 1.1).
Notes: 2004 statistics are for the 12 months ending November.
Source: CAA Airport Statistics at all reporting UK airports (excludes Channel Islands).
4. For the purposes of the statistics used in this study, the term “UK regional airport” excludes the five London airports(Heathrow, Gatwick, Stansted, Luton and London City), Southend, and the Channel Islands, but includes the Isle of Man.See Table 7.1 in Chapter 7 for a full list.
5. References to 2004 relate to the 12 months ending November, which is the latest statistical data available.
Figure 1.1 Traffic at UK airports 1980–2004
0
20
40
60
80
100
120
140
160
1980
1982
1984
1986
1988
1990
1992
1994
1996
1998
2000
2002
2004
term
inal
pas
seng
ers
per a
nnum
(m)
0%
5%
10%
15%
20%
25%
30%
35%
40%
45%
regi
onal
airp
orts
as
% o
f all
UK
airp
orts
passengers on routes to/from London
passengers on routes to/from UK regional
airports
regions as % of total UK
Page 324 February 2005
CAP 754 UK Regional Air Services
Notes: 2004 statistics are for the 12 months ending November.
Source: CAA Airport Statistics, terminal passengers at all reporting UK airports (excludes ChannelIslands).
13 Bearing in mind that there will be variances from region to region, between 1980 and2004 traffic at UK regional airports grew at a rate of 6.7% per annum, faster thantraffic at London airports (5.0%). This differential has increased in more recent years;for example the growth rate at regional airports between 2000 and 2004 was nearly8% compared with 2.6% at London airports. It is worth noting that over this period,London Heathrow became increasingly congested, capping its growth potential.
Notes: 2004 statistics are for the 12 months ending November.
Source: CAA Airport Statistics, terminal passengers at all reporting UK airports (excludes ChannelIslands).
14 Domestic traffic makes up nearly a quarter of the throughput at UK airports, and muchof it is traffic between London and the regional airports. So, the growth rates ofdomestic traffic at regional airports will tend to be similar to that of domestic traffic atLondon (see Table 1.2) and the regional airports’ share of domestic traffic has stayedfairly constant at two-thirds or so. Domestic passengers are counted twice, once ateach end of the route, so that many of the 16m domestic passengers at Londonairports in 2004 also appear within the 33m regional total.6
Table 1.1 Traffic at UK airports 1980–2004
Passengers (m) Average annual growth rate
1980 1990 2000 2004 1980–1990
1990–2000
1994–2004
2000–2004
1980–2004
London airports 39.7 67.9 115.8 128.1 5.5% 5.5% 5.1% 2.6% 5.0%
Regional airports 18.1 34.5 64.1 86.5 6.7% 6.4% 7.0% 7.9% 6.8%
Total 57.8 102.4 180.0 214.6 5.9% 5.8% 5.8% 4.6% 5.6%
Regional share of total 31% 34% 36% 40%
Table 1.2 Domestic traffic at UK airports 1980–2004
Passengers (m) Average annual growth rate
1980 1990 2000 2004 1980–1990
1990–2000
1994–2004
2000–2004
1980–2004
London airports 5.2 9.1 13.8 15.7 5.8% 4.3% 5.4% 3.3% 4.7%
Regional airports 9.7 15.9 23.5 32.5 5.1% 4.0% 7.0% 8.6% 5.2%
Total 15.0 25.0 37.3 48.2 5.2% 4.1% 6.5% 6.8% 5.0%
Regional share of total
65% 64% 63% 67%
6. These statistics include the Channel Islands as a domestic destination for UK regional airports but do not include thestatistics for the Channel Islands airports themselves. So, a passenger flying, say, from Southampton to the ChannelIslands is only counted once (at Southampton) whereas other domestic passengers are counted twice.
Page 424 February 2005

CAP 754 UK Regional Air Services
Notes: 2004 statistics are for the 12 months ending November.
Source: CAA Airport Statistics, terminal passengers at all reporting UK airports (excludes ChannelIslands).
15 The significantly higher growth at UK regional airports is much more noticeable forinternational services (see Table 1.3). Between 1980 and 2004 international traffic atUK regional airports increased by a factor of more than six, whereas internationaltraffic at London grew by a factor of just over three. In 1980 international traffic atregional airports was only one quarter of that at London. In 1990 it was nearly onethird, and by 2004 it had increased to nearly half.
Notes: 2004 statistics are for the 12 months ending November.
Source: CAA Airport Statistics, terminal passengers at all reporting UK airports (excludes ChannelIslands).
16 In the 1980s the growth in the regional share had been fuelled by charter airlinesexpanding into the regions. In 1973 70% of UK charter passengers were travellingfrom London airports, but by the late 1980s more were travelling from regionalairports than from London. In 2004 twice as many charter passengers travelled fromregional airports as from London. The number travelling from London stagnated andactually declined between 2000 and 2004 (Table 1.4).
Table 1.3 Total international traffic at UK airports 1980–2004
Passengers (m) Average annual growth rate
1980 1990 2000 2004 1980–1990
1990–2000
1994–2004
2000–2004
1980–2004
London airports 34.5 58.7 102.1 112.3 5.5% 5.7% 5.1% 2.5% 5.1%
Regional airports 8.4 18.6 40.6 54.0 8.3% 8.1% 7.0% 7.5% 8.1%
Total 42.8 77.4 142.7 166.3 6.1% 6.3% 5.7% 4.0% 5.8%
Regional share of total 20% 24% 28% 32%
Table 1.4 International charter traffic at UK airports 1980–2004
Passengers (m) Average annual growth rate
1980 1990 2000 2004 1980–1990
1990–2000
1994–2004
2000–2004
1980–2004
London airports 8.1 11.4 13.8 12.1 3.5% 1.9% -0.2% -3.3% 1.7%
Regional airports 7.1 12.5 23.3 24.2 5.8% 6.4% 2.4% 1.0% 5.3%
Total 15.1 23.9 37.1 36.3 4.6% 4.5% 1.5% -0.6% 3.7%
Regional share of total 47% 52% 63% 67%
Page 524 February 2005

CAP 754 UK Regional Air Services
Notes: 2004 statistics are for the 12 months ending November.
Source: CAA Airport Statistics, terminal passengers at all reporting UK airports (excludes ChannelIslands).
17 The growth in the share of international scheduled services at regional airports begansomewhat later, in the mid 1980s, when the first steps to remove restrictions onmarket entry and capacity were taken as a prelude to full liberalisation of the EUmarket. Table 1.5 shows the remarkable changes in the volumes of internationalscheduled passengers between 1980 and 2004. Since 1980 the regional share ofinternational scheduled services has more than quadrupled, from 5% to 23%, and thevolume of international scheduled passengers at regional airports increased by anannual average of 14% – from just 1.3m in 1980 to 30m in 2004. Over the last fouryears the growth in passenger numbers has been particularly spectacular, with anadditional 12.5m passengers travelling, of which 5m was added in 2004 alone.
Table 1.5 International scheduled traffic at UK airports 1980–2004
Passengers (m) Average annual growth rate
1980 1990 2000 2004 1980–1990
1990–2000
1994–2004
2000–2004
1980–2004
London airports 26.4 47.4 88.3 100.2 6.0% 6.4% 6.0% 3.3% 5.7%
Regional airports 1.3 6.2 17.3 29.8 16.9% 10.8% 13.3% 14.9% 14.0%
Total 27.7 53.5 105.6 130.0 6.8% 7.0% 7.3% 5.4% 6.7%
Regional share of total 5% 12% 16% 23%
Page 624 February 2005
CAP 754 UK Regional Air Services
Chapter 2 International services from UK regional airports
Growth in international services
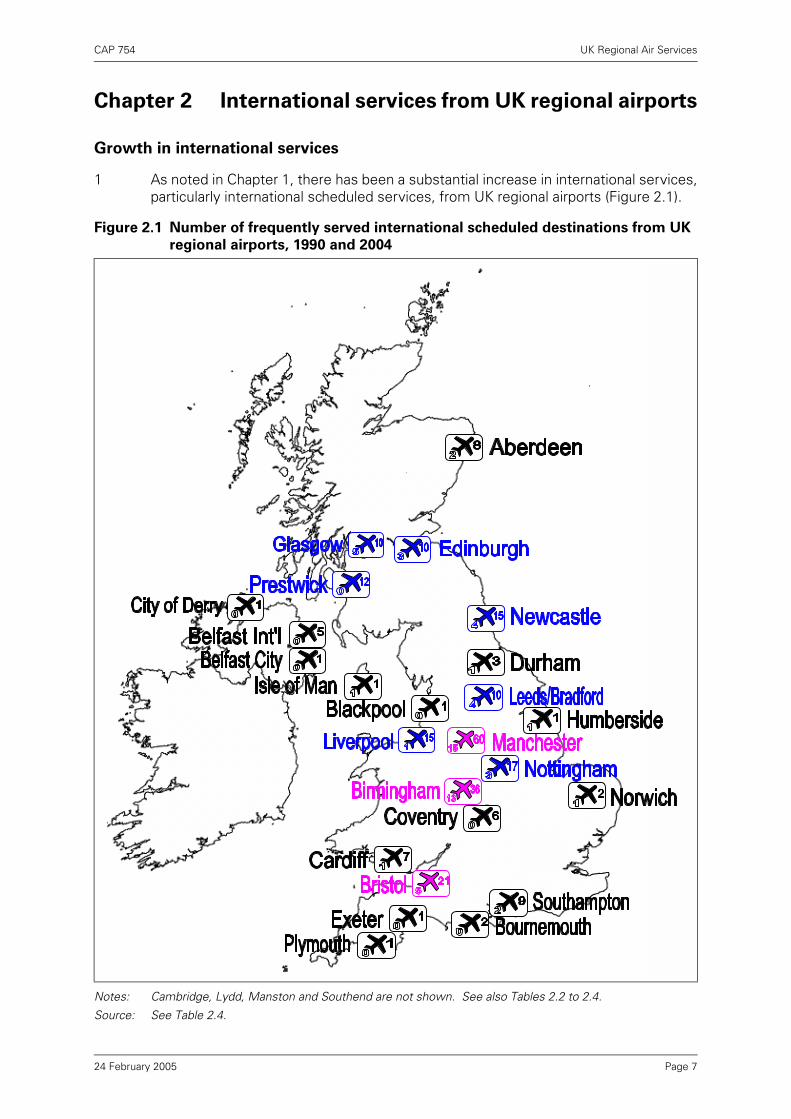
1 As noted in Chapter 1, there has been a substantial increase in international services,particularly international scheduled services, from UK regional airports (Figure 2.1).
Notes: Cambridge, Lydd, Manston and Southend are not shown. See also Tables 2.2 to 2.4.
Source: See Table 2.4.
Figure 2.1 Number of frequently served international scheduled destinations from UK
regional airports, 1990 and 2004
Page 724 February 2005
CAP 754 UK Regional Air Services
2 Figure 2.1 shows the increase in the number of international destinations from eachairport based on frequent1 scheduled services operating in 1990 and 2004. Airportswith 10 or more international scheduled services in 2004 are shown in blue, and thosewith 20 or more are shown in pink.
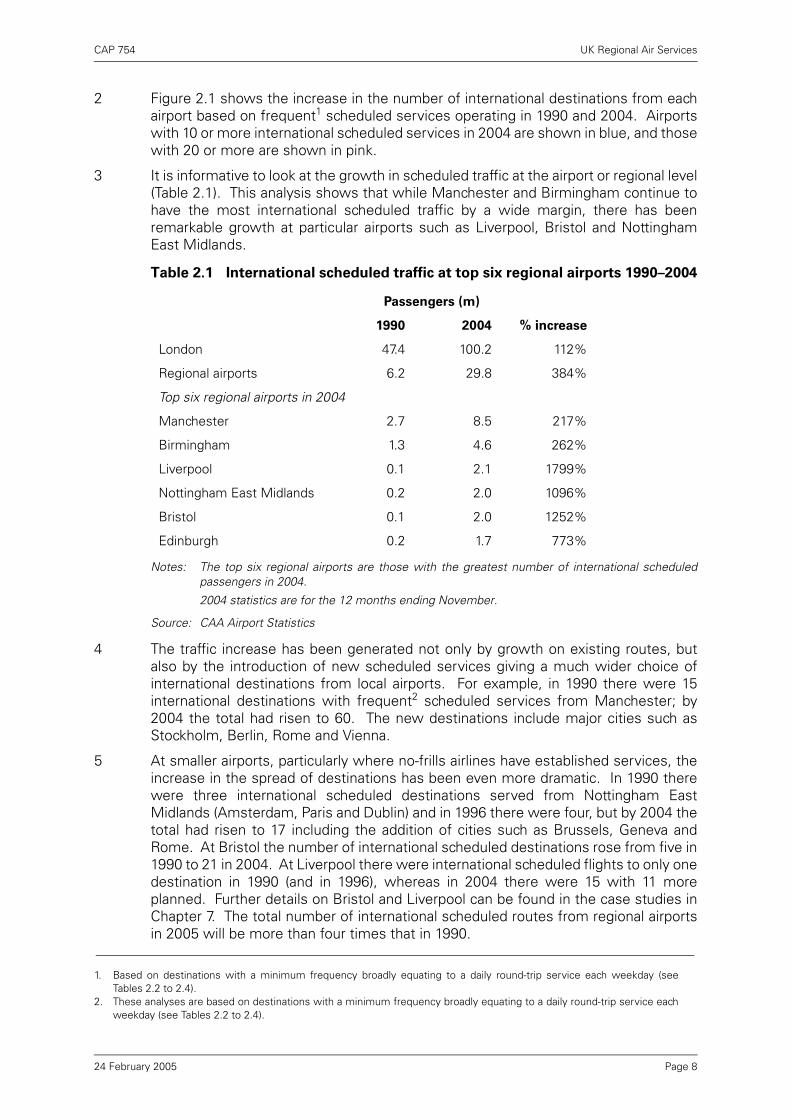
3 It is informative to look at the growth in scheduled traffic at the airport or regional level(Table 2.1). This analysis shows that while Manchester and Birmingham continue tohave the most international scheduled traffic by a wide margin, there has beenremarkable growth at particular airports such as Liverpool, Bristol and NottinghamEast Midlands.
Notes: The top six regional airports are those with the greatest number of international scheduledpassengers in 2004.
2004 statistics are for the 12 months ending November.
Source: CAA Airport Statistics
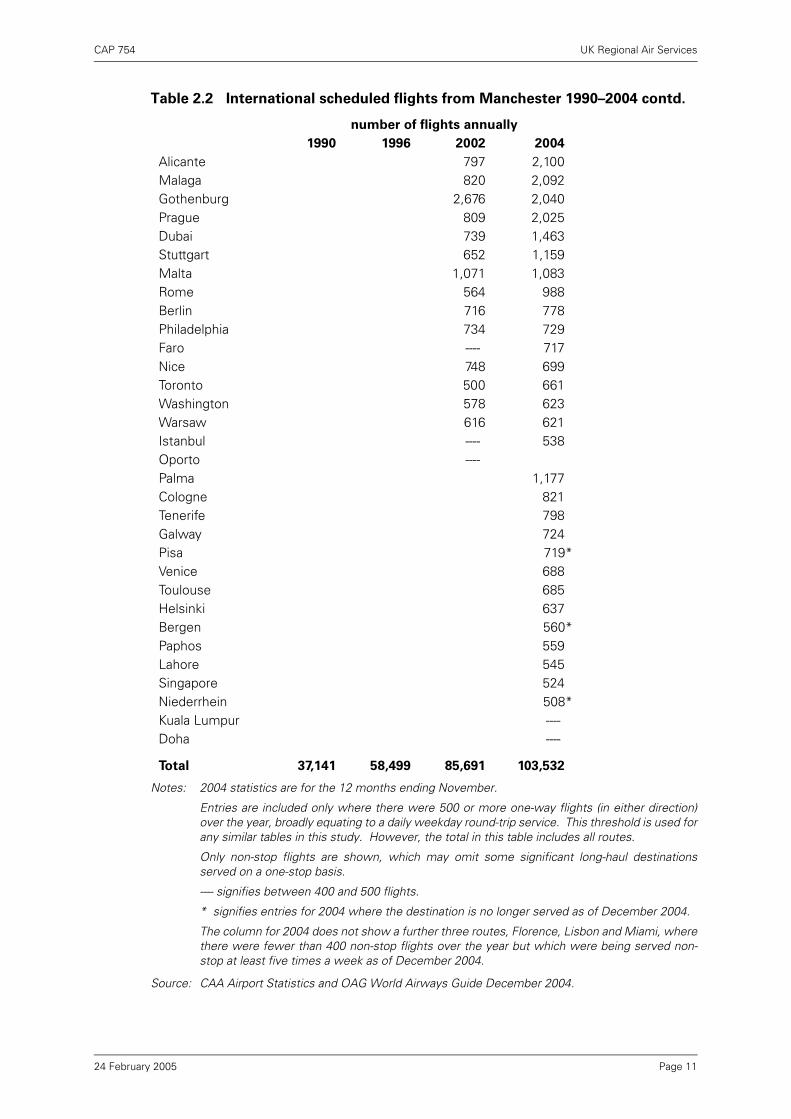
4 The traffic increase has been generated not only by growth on existing routes, butalso by the introduction of new scheduled services giving a much wider choice ofinternational destinations from local airports. For example, in 1990 there were 15international destinations with frequent2 scheduled services from Manchester; by2004 the total had risen to 60. The new destinations include major cities such asStockholm, Berlin, Rome and Vienna.
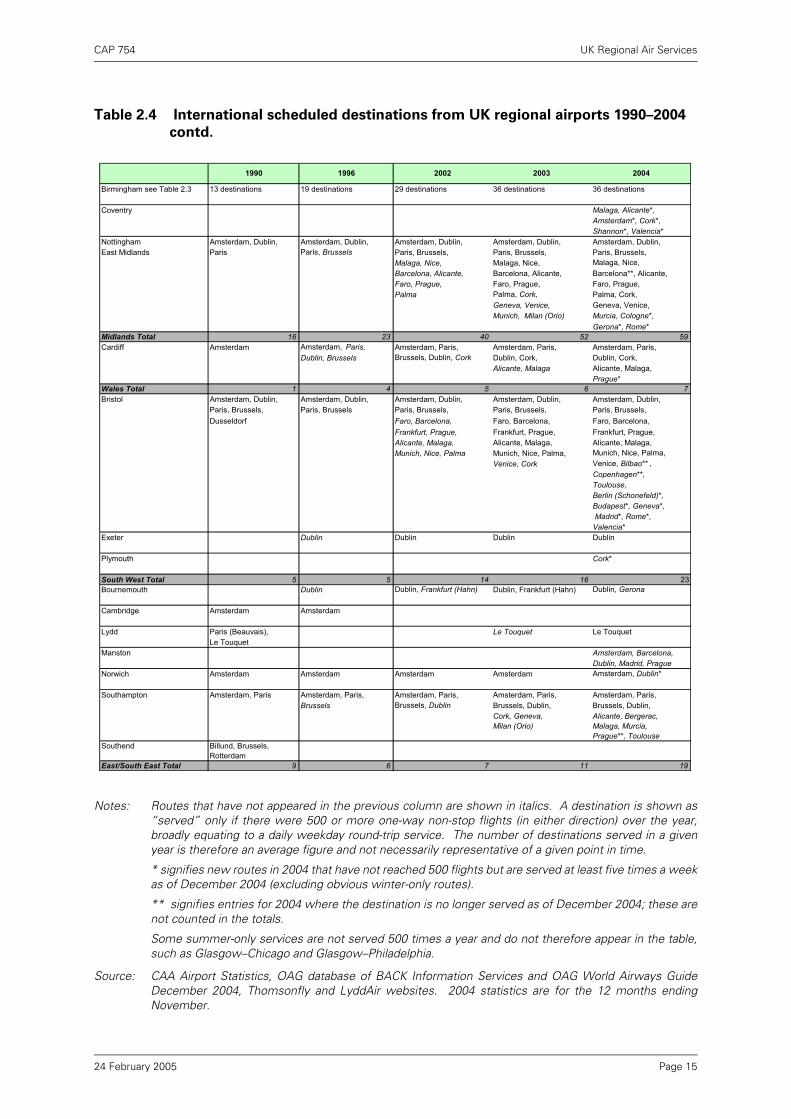
5 At smaller airports, particularly where no-frills airlines have established services, theincrease in the spread of destinations has been even more dramatic. In 1990 therewere three international scheduled destinations served from Nottingham EastMidlands (Amsterdam, Paris and Dublin) and in 1996 there were four, but by 2004 thetotal had risen to 17 including the addition of cities such as Brussels, Geneva andRome. At Bristol the number of international scheduled destinations rose from five in1990 to 21 in 2004. At Liverpool there were international scheduled flights to only onedestination in 1990 (and in 1996), whereas in 2004 there were 15 with 11 moreplanned. Further details on Bristol and Liverpool can be found in the case studies inChapter 7. The total number of international scheduled routes from regional airportsin 2005 will be more than four times that in 1990.
1. Based on destinations with a minimum frequency broadly equating to a daily round-trip service each weekday (seeTables 2.2 to 2.4).
Table 2.1 International scheduled traffic at top six regional airports 1990–2004
Passengers (m)
1990 2004 % increase
London 47.4 100.2 112%
Regional airports 6.2 29.8 384%
Top six regional airports in 2004
Manchester 2.7 8.5 217%
Birmingham 1.3 4.6 262%
Liverpool 0.1 2.1 1799%
Nottingham East Midlands 0.2 2.0 1096%
Bristol 0.1 2.0 1252%
Edinburgh 0.2 1.7 773%
2. These analyses are based on destinations with a minimum frequency broadly equating to a daily round-trip service eachweekday (see Tables 2.2 to 2.4).
Page 824 February 2005

CAP 754 UK Regional Air Services
Changes in travel patterns
6 Analysis of some of the broader changes to the nature of UK demand can help toexplain some of the changes in activity at regional airports, particularly on internationalroutes.
7 UK residents travelling abroad for leisure purposes have been by far the fastestgrowing component of international traffic at UK airports and, according to data fromthe International Passenger Survey (IPS), the total number of UK resident trips tointernational destinations grew from about 21m in 1993 to nearly 40m by 2003. As aresult, UK-originating leisure passengers formed 61% of the total international trafficat UK airports in 2003, compared with 53% in 1993.
8 The survey data also suggests that, on average, passengers are tending to takeshorter holidays. Trips lasting one to three nights grew at an average annual rate ofnearly 10% between 1998 and 2003 whereas trips lasting 14 or more nights (i.e.including traditional fortnight packages) grew at a much slower average rate of justover 2% a year. The recent growth in UK outbound leisure passengers has beendriven mainly by rapid expansion of the independent and 'VFR' (visiting friends andrelatives) sectors, which now account for about 60% of total UK leisure passengers.According to Office of National Statistics data, spending on holidays abroad has beenone of the fastest growing of the major categories of expenditure – second only tocommunications – and, during the past decade, has expanded three times as fast asoverall consumer expenditure. Although price has played its part in stimulatingdemand, holidays abroad still account for only 4% or so of total UK consumerexpenditure, suggesting that market maturity may be some way off.
Developments in international services from Manchester and Birmingham
9 Figure 2.2 illustrates the consistently strong growth in the number of passengers(both scheduled and charter) at Manchester, including a steady rise in the number oflong-haul passengers.
Notes: 2004 statistics are for the 12 months ending November.
Source: CAA Airport Statistics.
Figure 2.2 International scheduled and charter passengers at Manchester
1990–2004
0
4
8
12
16
1990 1991 1992 1993 1994 1995 1996 1997 1998 1999 2000 2001 2002 2003 2004
Pass
enge
rs (m
)
Long haul
Short haul
Page 924 February 2005

CAP 754 UK Regional Air Services
10 Tables 2.2 and 2.3 below show in more detail the progressive development of theinternational scheduled networks from Manchester and Birmingham respectively.More routes have commenced. As noted above, international scheduled destinationsrose from 15 at Manchester in 1990 to 60 in 2004, which compares with 13 atBirmingham in 1990 rising to 36 in 2004. But the number of flights on each route hasalso tended to show a general upward trend. For example, flights to Paris andFrankfurt have broadly doubled from both airports since 1990, as have those onManchester–Chicago. Flights on newer routes like Manchester–Prague andManchester–Rome, not served in 1996, have broadly doubled since 2002. Jet2.comhas set up a new base at Manchester, adding 10 routes. GB Airways is also settingup a base at Manchester operating five new scheduled routes.
11 Strong growth on newer Birmingham routes is less obvious, perhaps because theairport is in competition with London to a greater extent (the failure of Duo in May2004 is also likely to have had an effect on 2004 traffic levels). But since 1990international scheduled flights at Birmingham and at Manchester have increased bymore than two and a half times.
Table 2.2 International scheduled flights from Manchester 1990–2004
number of flights annually
1990 1996 2002 2004
Paris 3,266 6,260 7,083 7,628Dublin 4,793 7,206 7,823 6,901Amsterdam 4,602 6,558 8,009 6,607Frankfurt 2,982 3,874 4,889 5,770Dusseldorf 2,539 3,076 4,162 4,207Copenhagen 2,062 2,124 2,559 3,941Brussels 2,387 4,212 5,365 3,490Zurich 1,345 1,774 3,224 2,981Munich 721 2,491 2,559 2,464Barcelona 634 664 720 2,013Milan 1,627 1,223 1,234 1,827Chicago 725 728 1,458 1,594Madrid ---- 1,021 1,151 1,562Geneva 748 680 724 1,546Hanover ---- 694 719 1,245Hamburg 940 609 1,154 1,222New York (JFK) 709 721 1,157 1,163Cork 1,617 1,881 2,015Stockholm 1,083 2,248 1,686Oslo 569 1,213 1,559Basle 1,227 1,804 1,234Billund 553 1,077 1,070Connaught ---- ---- 974Atlanta 732 729 732Newark 731 680 730Lyon 711 799 730Shannon 1,096 727 725Luxembourg ---- 726 722Islamabad ---- ---- 711Vienna 622 833 709Orlando 524 604Rotterdam 913 1,007
Page 1024 February 2005
CAP 754 UK Regional Air Services
Notes: 2004 statistics are for the 12 months ending November.
Entries are included only where there were 500 or more one-way flights (in either direction)over the year, broadly equating to a daily weekday round-trip service. This threshold is used forany similar tables in this study. However, the total in this table includes all routes.
Only non-stop flights are shown, which may omit some significant long-haul destinationsserved on a one-stop basis.
---- signifies between 400 and 500 flights.
* signifies entries for 2004 where the destination is no longer served as of December 2004.
The column for 2004 does not show a further three routes, Florence, Lisbon and Miami, wherethere were fewer than 400 non-stop flights over the year but which were being served non-stop at least five times a week as of December 2004.
Source: CAA Airport Statistics and OAG World Airways Guide December 2004.
Table 2.2 International scheduled flights from Manchester 1990–2004 contd.
number of flights annually
1990 1996 2002 2004
Alicante 797 2,100Malaga 820 2,092Gothenburg 2,676 2,040Prague 809 2,025Dubai 739 1,463Stuttgart 652 1,159Malta 1,071 1,083Rome 564 988Berlin 716 778Philadelphia 734 729Faro ---- 717Nice 748 699Toronto 500 661Washington 578 623Warsaw 616 621Istanbul ---- 538Oporto ----Palma 1,177Cologne 821Tenerife 798Galway 724Pisa 719*Venice 688Toulouse 685Helsinki 637Bergen 560*Paphos 559Lahore 545Singapore 524Niederrhein 508*Kuala Lumpur ----Doha ----
Total 37,141 58,499 85,691 103,532
Page 1124 February 2005

CAP 754 UK Regional Air Services
Table 2.3 International scheduled flights from Birmingham 1990–2004
number of flights annually
1990 1996 2002 2004
Cologne 840 ----Paris 3,575 6,257 7,580 6,647Dublin 3,583 6,607 6,031 6,407Frankfurt 2,070 2,558 4,554 5,015Amsterdam 3,233 5,545 6,779 4,036Dusseldorf 3,113 3,591 4,086 4,029Brussels 2,736 2,772 6,912 2,682Munich 711 2,144 3,739 2,224Copenhagen 1,281 1,075 3,954 2,173Stuttgart 610 1,050 1,673 2,107Zurich 1,325 623 1,862 1,990Milan 1,059 1,324 1,716 1,968Barcelona 731 686 593 1,295Hamburg ---- 1,053 1,086Cork 833 1,576 1,509Lyon 718 1,208 1,218Basle 618 1,174 1,083Rotterdam 864 926Chicago 730New York (JFK) 665Billund 550Berlin 1,177Gothenburg 1,014 2,353Stockholm 1,052 1,113Newark 694 1,035Prague 562 845Dubai 734 737Shannon 642 723Hanover 584 723Madrid 670 722Vienna 636 637Rome 562 632Toulouse ---- 628Geneva 525 547Malaga 1,096Alicante 1,047Murcia 977Connaught 708Salzburg 666Palma 617Faro 555Ashkhabad ----Islamabad ----Perpignan ----Almeria ----
Total 27,346 40,683 68,762 67,352
Page 1224 February 2005

CAP 754 UK Regional Air Services
Notes: 2004 statistics are for the 12 months ending November.
Entries are included only where there were 500 or more one-way flights (in either direction)over the year, broadly equating to a daily weekday round-trip service. However, the total in thistable includes all routes.
Only non-stop flights are shown.
---- signifies between 400 and 500 flights.
The column for 2004 does not show one further route, Tashkent, where there were fewer than400 non-stop flights over the year but which was being served non-stop five times a week asof December 2004.
Source: CAA Airport Statistics and OAG World Airways Guide December 2004.
Developments in international scheduled services at other UK regional airports
12 Table 2.4 below shows the development of international scheduled networks at otherregional airports. As with Tables 2.2 and 2.3 above, Table 2.4 omits low-frequencyservices or those served on a one-stop basis. The significant increase in destinationsover the last three years compared with the position in 1990 and 1996 is immediatelyapparent. This includes Scotland and Northern Ireland, which had few or no frequentinternational services in 1990. Growth in services from Scotland has been strongerthan from Northern Ireland where there remain few frequent international services.
Page 1324 February 2005

CAP 754 UK Regional Air Services
Table 2.4 International scheduled destinations from UK regional airports 1990–2004
Aberdeen Amsterdam, Stavanger Amsterdam, Stavanger, Amsterdam, Stavanger, Amsterdam, Stavanger, Amsterdam, Stavanger,Bergen, Esbjerg Bergen, Esbjerg, Bergen, Esbjerg, Bergen, Esbjerg,
Dublin Dublin, Paris Dublin, Paris,Copenhagen*,Groningen*
Edinburgh Amsterdam, Dublin, Amsterdam, Dublin, Amsterdam, Dublin, Amsterdam, Dublin, Amsterdam, Dublin,Paris Paris, Brussels, Paris, Brussels, Paris, Brussels, Paris, Brussels,
Copenhagen Copenhagen, Frankfurt Copenhagen, Frankfurt Copenhagen, Frankfurt,Cork Cork, Galway, Prague,
Newark*Glasgow Amsterdam, Dublin, Amsterdam, Dublin, Amsterdam, Dublin, Amsterdam, Dublin, Amsterdam, Dublin,
Paris, Copenhagen, Copenhagen, Brussels, Copenhagen, Newark, Copenhagen, Newark, Copenhagen, Newark,Dusseldorf New York, Toronto Cork Cork Cork, Malaga, Palma,
Toronto, Alicante*,Dubai*
Prestwick Dublin Dublin, Paris (Beauvais), Dublin, Paris (Beauvais), Dublin, Paris (Beauvais), Frankfurt (Hahn), Frankfurt (Hahn), Frankfurt (Hahn),Oslo (Torp), Oslo (Torp), Oslo (Torp),Brussels (Charleroi) Brussels (Charleroi), Brussels (Charleroi),
Stockholm (Skavsta) Stockholm (Skavsta),Gerona,Gothenburg (Saeve), Shannon, Milan (Orio),Rome*, Dusseldorf*
Scotland Total 10 16 21 24 40Belfast Int Amsterdam Amsterdam Amsterdam Amsterdam, Alicante*,
Barcelona*, Paris*,Prague*
Belfast City Cork Cork Cork
City of Derry Dublin Dublin
Northern Ireland Total 0 2 1 3 7Blackpool Dublin
Liverpool Dublin Dublin Dublin, Amsterdam, Dublin, Amsterdam, Dublin, Amsterdam,Barcelona, Palma, Barcelona, Palma, Barcelona, Palma,Madrid, Geneva, Madrid, Geneva, Madrid, Geneva,Malaga, Nice, Malaga, Nice, Malaga, Nice,Paris Paris, Alicante Paris, Alicante, Gerona,
Brussels (Charleroi) Basel*,Berlin (Schonefeld)*,Cologne*, Connaught*,
Manchester see Table 2.2 15 destinations 29 destinations 43 destinations 49 destinations 60 destinations
North West Total 16 30 52 60 76Humberside Amsterdam Amsterdam, Brussels Amsterdam Amsterdam Amsterdam
Leeds/Bradford Amsterdam, Dublin, Amsterdam, Dublin, Amsterdam, Dublin, Amsterdam, Dublin, Amsterdam, Dublin,Brussels, Paris Brussels, Paris Brussels, Paris Brussels, Paris Brussels, Paris,
Barcelona, Cork, Barcelona, Cork,Malaga Malaga, Alicante,
Palma, PragueYorks and Humber Total 5 6 5 8 11Newcastle Amsterdam, Brussels, Amsterdam, Brussels, Amsterdam, Brussels, Amsterdam, Brussels, Amsterdam, Brussels,
Dublin, Stavanger Dublin, Stavanger, Dublin, Stavanger, Dublin, Stavanger, Dublin, Stavanger,Copenhagen, Oslo, Paris, Dusseldorf Paris, Dusseldorf, Paris, Dusseldorf,Paris Alicante, Barcelona Alicante, Barcelona,
Copenhagen,Malaga, Prague, Berlin (Schonefeld)*,Budapest*, Geneva*,Rome*
Durham Amsterdam Amsterdam Amsterdam, Dublin Amsterdam, Dublin Amsterdam, Dublin,Tees Valley Malaga*North East Total 5 8 8 10 18
1990 1996 2002 20042003
Page 1424 February 2005
CAP 754 UK Regional Air Services
Notes: Routes that have not appeared in the previous column are shown in italics. A destination is shown as“served” only if there were 500 or more one-way non-stop flights (in either direction) over the year,broadly equating to a daily weekday round-trip service. The number of destinations served in a givenyear is therefore an average figure and not necessarily representative of a given point in time.
* signifies new routes in 2004 that have not reached 500 flights but are served at least five times a weekas of December 2004 (excluding obvious winter-only routes).
** signifies entries for 2004 where the destination is no longer served as of December 2004; these arenot counted in the totals.
Some summer-only services are not served 500 times a year and do not therefore appear in the table,such as Glasgow–Chicago and Glasgow–Philadelphia.
Source: CAA Airport Statistics, OAG database of BACK Information Services and OAG World Airways GuideDecember 2004, Thomsonfly and LyddAir websites. 2004 statistics are for the 12 months endingNovember.
Table 2.4 International scheduled destinations from UK regional airports 1990–2004
contd.
Birmingham see Table 2.3 13 destinations 19 destinations 29 destinations 36 destinations 36 destinations
Coventry Malaga, Alicante*,Amsterdam*, Cork*,Shannon*, Valencia*
Nottingham Amsterdam, Dublin, Amsterdam, Dublin, Amsterdam, Dublin, Amsterdam, Dublin, Amsterdam, Dublin,East Midlands Paris Paris, Brussels Paris, Brussels, Paris, Brussels, Paris, Brussels,
Malaga, Nice, Malaga, Nice, Malaga, Nice,Barcelona, Alicante, Barcelona, Alicante, Barcelona**, Alicante,Faro, Prague, Faro, Prague, Faro, Prague,Palma Palma, Cork, Palma, Cork,
Geneva, Venice, Geneva, Venice,Munich, Milan (Orio) Murcia, Cologne*,
Gerona*, Rome*Midlands Total 16 23 40 52 59Cardiff Amsterdam Amsterdam, Paris, Amsterdam, Paris, Amsterdam, Paris, Amsterdam, Paris,
Dublin, Brussels Brussels, Dublin, Cork Dublin, Cork, Dublin, Cork,Alicante, Malaga Alicante, Malaga,
Prague*Wales Total 1 4 5 6 7Bristol Amsterdam, Dublin, Amsterdam, Dublin, Amsterdam, Dublin, Amsterdam, Dublin, Amsterdam, Dublin,
Paris, Brussels, Paris, Brussels Paris, Brussels, Paris, Brussels, Paris, Brussels,Dusseldorf Faro, Barcelona, Faro, Barcelona, Faro, Barcelona,
Frankfurt, Prague, Frankfurt, Prague, Frankfurt, Prague,Alicante, Malaga, Alicante, Malaga, Alicante, Malaga,Munich, Nice, Palma Munich, Nice, Palma, Munich, Nice, Palma,
Venice, Cork Venice, Bilbao** ,Copenhagen**,Toulouse,Berlin (Schonefeld)*,Budapest*, Geneva*, Madrid*, Rome*,Valencia*
Exeter Dublin Dublin Dublin Dublin
Plymouth Cork*
South West Total 5 5 14 16 23Bournemouth Dublin Dublin, Frankfurt (Hahn) Dublin, Frankfurt (Hahn) Dublin, Gerona
Cambridge Amsterdam Amsterdam
Lydd Paris (Beauvais), Le Touquet Le TouquetLe Touquet
Manston Amsterdam, Barcelona,Dublin, Madrid, Prague
Norwich Amsterdam Amsterdam Amsterdam Amsterdam Amsterdam, Dublin*
Southampton Amsterdam, Paris Amsterdam, Paris, Amsterdam, Paris, Amsterdam, Paris, Amsterdam, Paris,Brussels Brussels, Dublin Brussels, Dublin, Brussels, Dublin,
Cork, Geneva, Alicante, Bergerac,Milan (Orio) Malaga, Murcia,
Prague**, ToulouseSouthend Billund, Brussels,
RotterdamEast/South East Total 9 6 7 11 19
1990 1996 2002 20042003
Page 1524 February 2005

CAP 754 UK Regional Air Services
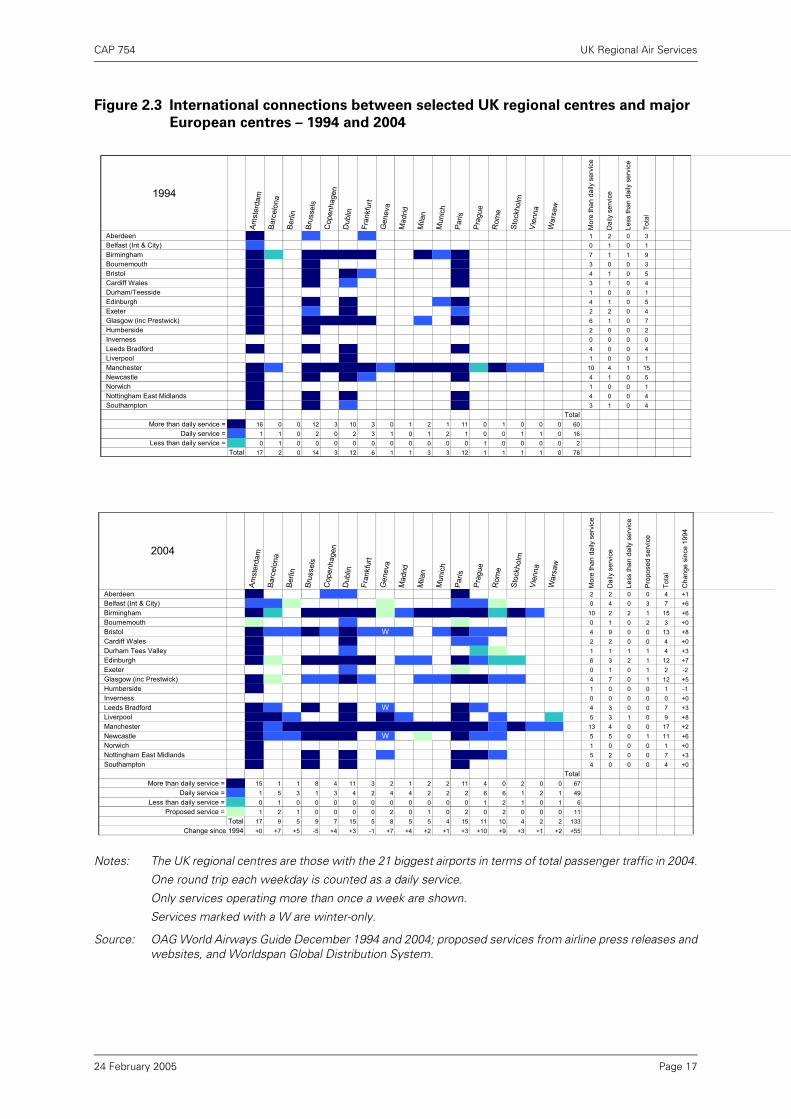
13 Table 2.4 shows that some of the new international scheduled destinations are,perhaps not surprisingly, linking regional points with leisure-oriented “sun”destinations like Alicante, Malaga or Palma (each of these points will have scheduledservices from around 12–13 UK regional airports in 20053). Figure 2.3 below thereforelooks at the richness of the new destinations in terms of linking UK regions with majorpopulation or business centres, and makes a comparison with ten years ago, just afterthe EU aviation market had been liberalised. The table includes proposed services for2005, although given the rapid expansion taking place in regional air services this cannecessarily only be indicative.
14 Overall, the number of direct connections in this sample has increased by about half,with the bulk of this accounted for by new once-daily services. Manchester wasalready a relatively mature market in 1994 with services to 15 of the 17 points in thesample, the exceptions being Berlin and Warsaw, both of which were being served by2004. Most of the routes (slightly more than in 1994) are now served at a greater thandaily frequency. Birmingham is not far behind, with the nine destinations in 1994increasing to 15 in 2005. The table shows a significant increase in the number ofmajor European destinations served from Bristol, Edinburgh and Liverpool.
15 The most popular major European destinations served from UK regional airports areAmsterdam, Dublin and Paris. By 2005, Barcelona, Prague and Rome will be servedfrom between seven and ten more UK regional airports compared with 1994.Brussels, on the other hand, has lost services from five UK regional airports, probablya reflection of the decline of the airport as a hub following the collapse of Sabena.
3. Not all these services appear in Table 2.4 because some are served less than daily and some do not commence until2005.
Page 1624 February 2005
CAP 754 UK Regional Air Services
Notes: The UK regional centres are those with the 21 biggest airports in terms of total passenger traffic in 2004.
One round trip each weekday is counted as a daily service.
Only services operating more than once a week are shown.
Services marked with a W are winter-only.
Source: OAG World Airways Guide December 1994 and 2004; proposed services from airline press releases andwebsites, and Worldspan Global Distribution System.
Figure 2.3 International connections between selected UK regional centres and major
European centres – 1994 and 2004
1994
Amst
erda
m
Barc
elon
a
Berli
n
Brus
sels
Cop
enha
gen
Dub
lin
Fran
kfur
t
Gen
eva
Mad
rid
Mila
n
Mun
ich
Paris
Prag
ue
Rom
e
Stoc
khol
m
Vien
na
War
saw
Mor
e th
an d
aily
ser
vice
Dai
ly s
ervi
ce
Less
than
dai
ly s
ervi
ce
Tota
l
Aberdeen 1 2 0 3 Belfast (Int & City) 0 1 0 1 Birmingham 7 1 1 9 Bournemouth 3 0 0 3 Bristol 4 1 0 5 Cardiff Wales 3 1 0 4 Durham/Teesside 1 0 0 1 Edinburgh 4 1 0 5 Exeter 2 2 0 4 Glasgow (inc Prestwick) 6 1 0 7 Humberside 2 0 0 2 Inverness 0 0 0 0 Leeds Bradford 4 0 0 4 Liverpool 1 0 0 1 Manchester 10 4 1 15 Newcastle 4 1 0 5 Norwich 1 0 0 1 Nottingham East Midlands 4 0 0 4 Southampton 3 1 0 4
TotalMore than daily service = 16 0 0 12 3 10 3 0 1 2 1 11 0 1 0 0 0 60
Daily service = 1 1 0 2 0 2 3 1 0 1 2 1 0 0 1 1 0 16Less than daily service = 0 1 0 0 0 0 0 0 0 0 0 0 1 0 0 0 0 2
Total 17 2 0 14 3 12 6 1 1 3 3 12 1 1 1 1 0 78
2004
Amst
erda
m
Barc
elon
a
Berli
n
Brus
sels
Cop
enha
gen
Dub
lin
Fran
kfur
t
Gen
eva
Mad
rid
Mila
n
Mun
ich
Paris
Prag
ue
Rom
e
Stoc
khol
m
Vien
na
War
saw
Mor
e th
an d
aily
ser
vice
Dai
ly s
ervi
ce
Less
than
dai
ly s
ervi
ce
Pro
pose
d se
rvic
e
Tota
l
Cha
nge
sinc
e 19
94
Aberdeen 2 2 0 0 4 +1 Belfast (Int & City) 0 4 0 3 7 +6 Birmingham 10 2 2 1 15 +6 Bournemouth 0 1 0 2 3 +0 Bristol W 4 9 0 0 13 +8 Cardiff Wales 2 2 0 0 4 +0 Durham Tees Valley 1 1 1 1 4 +3 Edinburgh 6 3 2 1 12 +7 Exeter 0 1 0 1 2 -2 Glasgow (inc Prestwick) 4 7 0 1 12 +5 Humberside 1 0 0 0 1 -1 Inverness 0 0 0 0 0 +0 Leeds Bradford W 4 3 0 0 7 +3 Liverpool 5 3 1 0 9 +8 Manchester 13 4 0 0 17 +2 Newcastle W 5 5 0 1 11 +6 Norwich 1 0 0 0 1 +0 Nottingham East Midlands 5 2 0 0 7 +3 Southampton 4 0 0 0 4 +0
TotalMore than daily service = 15 1 1 8 4 11 3 2 1 2 2 11 4 0 2 0 0 67
Daily service = 1 5 3 1 3 4 2 4 4 2 2 2 6 6 1 2 1 49Less than daily service = 0 1 0 0 0 0 0 0 0 0 0 0 1 2 1 0 1 6
Proposed service = 1 2 1 0 0 0 0 2 0 1 0 2 0 2 0 0 0 11Total 17 9 5 9 7 15 5 8 5 5 4 15 11 10 4 2 2 133
Change since 1994 +0 +7 +5 -5 +4 +3 -1 +7 +4 +2 +1 +3 +10 +9 +3 +1 +2 +55
Page 1724 February 2005
CAP 754 UK Regional Air Services
Developments in long-haul services
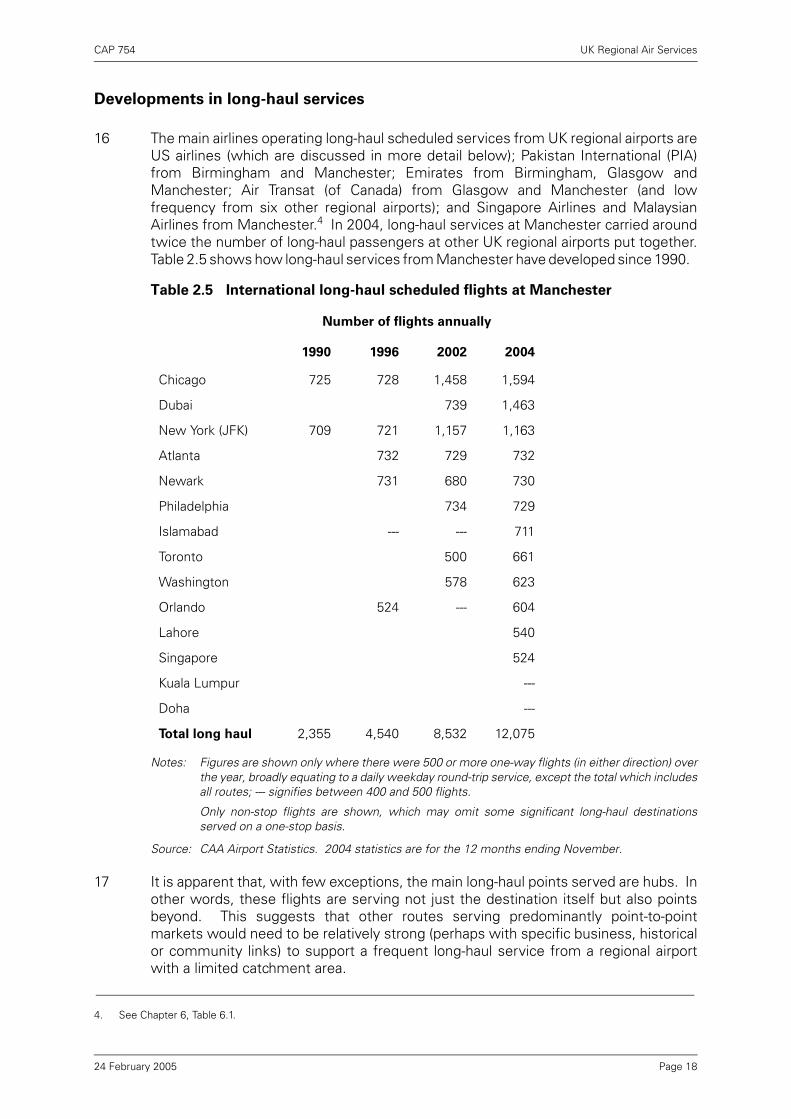
16 The main airlines operating long-haul scheduled services from UK regional airports areUS airlines (which are discussed in more detail below); Pakistan International (PIA)from Birmingham and Manchester; Emirates from Birmingham, Glasgow andManchester; Air Transat (of Canada) from Glasgow and Manchester (and lowfrequency from six other regional airports); and Singapore Airlines and MalaysianAirlines from Manchester.4 In 2004, long-haul services at Manchester carried aroundtwice the number of long-haul passengers at other UK regional airports put together.Table 2.5 shows how long-haul services from Manchester have developed since 1990.
Notes: Figures are shown only where there were 500 or more one-way flights (in either direction) overthe year, broadly equating to a daily weekday round-trip service, except the total which includesall routes; --- signifies between 400 and 500 flights.
Only non-stop flights are shown, which may omit some significant long-haul destinationsserved on a one-stop basis.
Source: CAA Airport Statistics. 2004 statistics are for the 12 months ending November.
17 It is apparent that, with few exceptions, the main long-haul points served are hubs. Inother words, these flights are serving not just the destination itself but also pointsbeyond. This suggests that other routes serving predominantly point-to-pointmarkets would need to be relatively strong (perhaps with specific business, historicalor community links) to support a frequent long-haul service from a regional airportwith a limited catchment area.
4. See Chapter 6, Table 6.1.
Table 2.5 International long-haul scheduled flights at Manchester
Number of flights annually
1990 1996 2002 2004
Chicago 725 728 1,458 1,594
Dubai 739 1,463
New York (JFK) 709 721 1,157 1,163
Atlanta 732 729 732
Newark 731 680 730
Philadelphia 734 729
Islamabad --- --- 711
Toronto 500 661
Washington 578 623
Orlando 524 --- 604
Lahore 540
Singapore 524
Kuala Lumpur ---
Doha ---
Total long haul 2,355 4,540 8,532 12,075
Page 1824 February 2005
CAP 754 UK Regional Air Services
18 Emirates began serving Dubai twice a week from Manchester in 1990, alongside itsGatwick service. During the 1990s it focused on building up its Heathrow andGatwick services (each of which is now three daily), but in 1999 the Manchesterservice was increased to daily and then twice daily in 2003. In 2001 Emirates starteda daily Birmingham service, which became twice daily in March 2004. Its Dubai–Glasgow service, which started in April 2004, was a relatively unexpecteddevelopment given the few long-haul scheduled services operated from Scotland, allof which have been transatlantic. This route is benefiting from start-up financialassistance from the Scottish Route Development Fund. Emirates’ prime market is thecarriage of passengers on a sixth-freedom5 basis bound for points beyond Dubai. Itsextensive and growing network of around 80 destinations from Dubai provides analternative to London or continental hubs for long-haul passengers travelling to orfrom the UK regions to Africa, Asia or Australasia. CAA survey data for 2003 showsthat on Emirates’ services 74% of Birmingham passengers and 75% of Manchesterpassengers were connecting at Dubai.
5. “Sixth-freedom” means the carriage of passengers by an airline of Country A between two other countries viaCountry A; for example, Emirates carrying a passenger from the UK to Australia with a transfer at Dubai.
Page 1924 February 2005
CA
P 754
UK
Regional A
ir Services
Page 20
ted. Flights operating less than once per week are omitted.
ommenced August 1990. (c) bmi Manchester–Las Vegas
000 2001 2002 2003 2004
(a)
(a)
(c)
11 12 12 11 14 +2000 2001 2002 2003 2004 2005
Key:
consistently less than6 services per week
daily (approximately 6 to 8 services per week)
consistently more than8 services per week(maximum 14)
24 February 2005
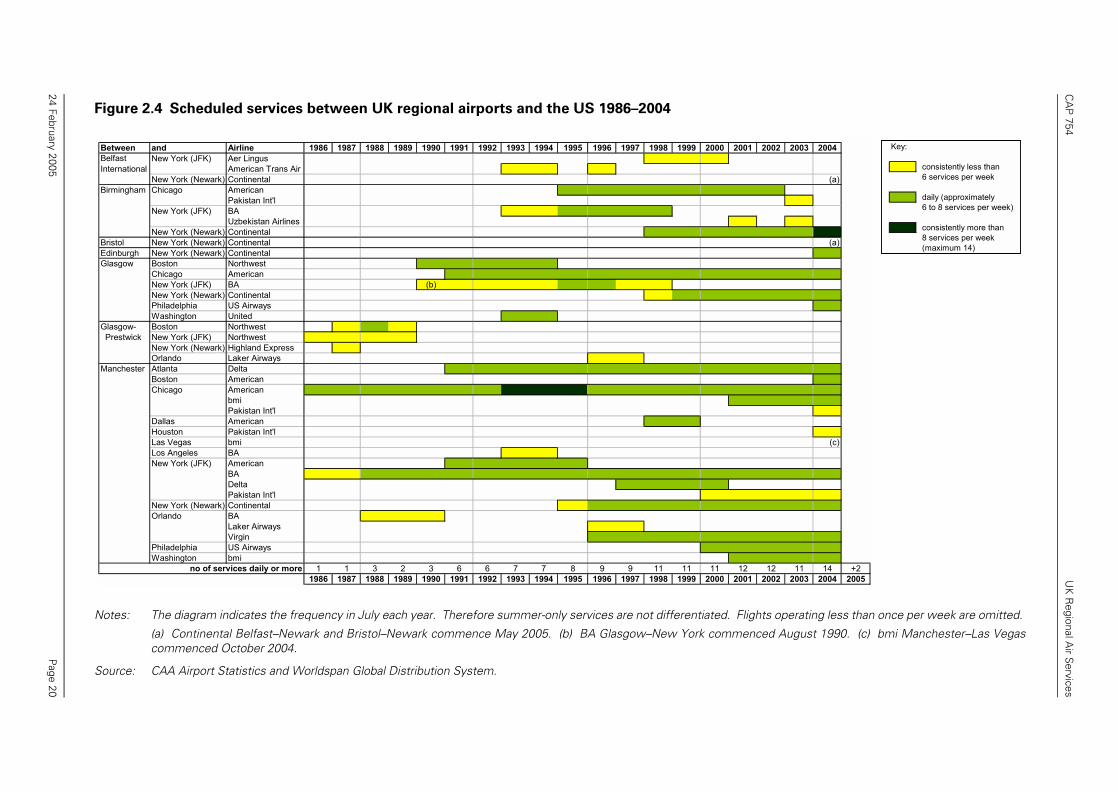
Notes: The diagram indicates the frequency in July each year. Therefore summer-only services are not differentia
(a) Continental Belfast–Newark and Bristol–Newark commence May 2005. (b) BA Glasgow–New York ccommenced October 2004.
Source: CAA Airport Statistics and Worldspan Global Distribution System.
Figure 2.4 Scheduled services between UK regional airports and the US 1986–2004
Between and Airline 1986 1987 1988 1989 1990 1991 1992 1993 1994 1995 1996 1997 1998 1999 2Belfast New York (JFK) Aer LingusInternational American Trans Air
New York (Newark) ContinentalBirmingham Chicago American
Pakistan Int'lNew York (JFK) BA
Uzbekistan AirlinesNew York (Newark) Continental
Bristol New York (Newark) ContinentalEdinburgh New York (Newark) ContinentalGlasgow Boston Northwest
Chicago AmericanNew York (JFK) BA (b)New York (Newark) ContinentalPhiladelphia US AirwaysWashington United
Glasgow- Boston Northwest Prestwick New York (JFK) Northwest
New York (Newark) Highland ExpressOrlando Laker Airways
Manchester Atlanta DeltaBoston AmericanChicago American
bmiPakistan Int'l
Dallas AmericanHouston Pakistan Int'lLas Vegas bmiLos Angeles BANew York (JFK) American
BADeltaPakistan Int'l
New York (Newark) ContinentalOrlando BA
Laker AirwaysVirgin
Philadelphia US AirwaysWashington bmi
no of services daily or more 1 1 3 2 3 6 6 7 7 8 9 9 11 111986 1987 1988 1989 1990 1991 1992 1993 1994 1995 1996 1997 1998 1999 2
CAP 754 UK Regional Air Services
UK regional–USA services
19 Figure 2.4 shows how services have developed between UK regional points and theUSA over the period 1986 to 2004. In 1986 there was just one daily service, AmericanAirlines’ Manchester service feeding its Chicago hub, alongside BA’s twice-weeklyManchester–New York service and Northwest’s weekly Prestwick–New York service.There was a rapid expansion in the number of routes in the early 1990s. By 1991 sixroutes had achieved a daily service, with Delta serving Manchester from its Atlantahub and American starting a daily Manchester–New York service alongside that of BA.With the opening of Glasgow to transatlantic services, Prestwick services werereplaced by daily services to Boston (Northwest), Chicago (American) andWashington (United), but by 1995 the Boston and Washington services had beensuspended and the Chicago service became summer-only. BA started services toNew York from Glasgow and Birmingham, which became daily in 1995, but thesewere both suspended in 1998.
20 Between 1993 and 1994 BA also operated a five-times weekly Manchester–LosAngeles service while American’s Manchester-Chicago service moved to double dailyin the summer.
21 Birmingham gained a second daily transatlantic service in 1995, operated by Americanto its Chicago hub, but this was suspended for the Winter 2001/02 season afterSeptember 11, and has not operated since Summer 2002. Virgin started itsManchester–Orlando service in 1996 (for several years operating during the summerseason only), a route that had been operated at low frequency by BA in the late 1980s.Between 1995 and 1998, Continental started new daily services feeding its Newarkhub from Birmingham, Glasgow and Manchester, the latter possibly being one reasonfor American suspending its New York service, another perhaps being American’salliance with BA. American also served Manchester from its Dallas hub in thesummers of 1998 and 1999, while Delta also operated a Manchester–New Yorkservice between 1997 and 2001. US Airways began its first UK regional route in 2000,linking Manchester with its Philadelphia hub. In 2001, bmi began Manchesterservices to Chicago and Washington, both hubs of its Star Alliance partner, United.
22 By 2001 there were 12 daily services from seven US gateways. Despite the effectsof September 11 on the industry, it is noteworthy that none of the regional serviceswas suspended immediately (unlike London services), although, as noted above,American did suspend Birmingham–Chicago a year later, leaving Birmingham withjust its Newark service, now twice-daily, by 2004. Glasgow had only two dailyservices until US Airways started its summer-only Philadelphia service in 2004. Mostof the expansion in recent years has been at Manchester, which had nine daily USservices by 2004.
23 But new UK regional gateways have also been added. Continental Airlines continuesto add new daily Boeing 757 (i.e. narrowbody) services from its Newark hub to UKregional airports, most recently Edinburgh, Belfast and Bristol (see Case Study 1).American also began a seasonal Manchester–Boston service using a Boeing 757 in2004. This expansion of US services at regional airports using smaller, narrowbodyaircraft is an interesting development. It seems to allow new, relatively thin, long-haulmarkets to be opened with less risk. It has also demonstrated to operators of otherUK airports with sufficient runway length that a transatlantic link may be achievable.
Page 2124 February 2005
CAP 754 UK Regional Air Services
24 These new services have increased the number of US routes served daily or morefrom UK regional airports to 14 in 2004 and 16 in 2005.6
25 With specific exceptions, such as New York (JFK), Orlando and Las Vegas, which areless dependent on US connecting traffic, the US gateways are all hub airports. Forexample, there are currently no services between UK regional airports and the westcoast; such traffic must still travel via another hub (whether London, US, orelsewhere).
26 United and Northwest are the only US transatlantic airlines not to operate in their ownright to a UK regional airport. However, United places its code on Star Alliance partnerbmi’s Manchester services, and on bmi’s UK domestic flights feeding United’s US–Heathrow services. Similarly, Northwest places its code on alliance partner KLM’sextensive network of flights from UK regional airports feeding the Amsterdam hub.
27 While the first routes, American’s Manchester-Chicago and BA’s Manchester–NewYork services, have operated throughout the period 1986–2004, there has been areasonable amount of churn in other routes. However, given the serious problems theairlines have faced in recent years it is of significance that the number of services thatare daily or more should be 16 by summer 2005. This suggests that for routes to theUS at least, UK regional services are more resilient than may sometimes besuggested. There seem to be reasonable future prospects for further servicesbetween US hubs and UK regional airports, although services to non-hub airports(other than very dense markets like Orlando or New York) may present a more difficultproposition.
Fifth-freedom services
28 The restrictions enshrined in bilateral air services agreements can also form a barrierto foreign airlines seeking to operate new services from regional airports on a fifth-freedom basis.7 Loosening these restrictions could facilitate an increase in long-haulservices from regional airports operated by overseas airlines. The likely impacts onthe airline industry and consumers of granting such freedoms from UK regionalairports are being assessed in an ongoing, separate CAA study.
6. While American began a Manchester–Miami service in November 2004, this is not scheduled to operate between Mayand October 2005.
7. “Fifth-freedom” means the right for an airline of Country A to carry passengers and cargo between Country B andCountry C on a flight that originates or terminates in Country A; for example, Air India picking up a passenger in the UKfor carriage to the USA using an aircraft that is routing India–UK–USA.
Page 2224 February 2005

CAP 754 UK Regional Air Services
Case study 1: Continental Airlines
By the end of 2004, Continental Airlines was serving 272 airports (119 outside the USA) witha fleet of around 350 aircraft and was carrying 54m passengers annually. The airline hasbeen serving the UK since 1985 and operates non-stop flights from New York (Newark) toGatwick and Birmingham (both twice daily), Manchester, Glasgow and, from June 2004,Edinburgh (all once daily; an additional daily flight shared between Glasgow and Edinburghbegins in 2005). It will commence daily services from Newark to Bristol on 20 May 2005and Newark to Belfast on 27 May 2005.1 Continental also serves Houston–Gatwick (twicedaily) and Cleveland–Gatwick (daily, summer only) and places its code on flights operated byVirgin Atlantic between Heathrow and Gatwick and several US cities. Continental is amember of the Skyteam alliance.
Continental’s current business strategy is to move from a predominantly domestic routeportfolio to one more balanced between international and domestic services. In recentyears it has begun re-deploying its narrowbody Boeing 757-200 aircraft from domesticroutes to relatively thin long-haul markets between its Newark hub and the UK regions (andEuropean cities such as Oslo and, in 2005, Berlin, Hamburg and Stockholm). These serviceshave significant feed traffic to/from points served beyond Newark, particularly in the wintermonths when traffic to the New York area is weaker. (For example, CAA survey data for2003 shows an average of 71% of Birmingham passengers and 50% of Manchesterpassengers connecting at Newark.)
Continental’s 757s are configured with the full BusinessFirst product (16 seats) that theairline offers on the rest of its long-haul network, and sees the aircraft as having verycompetitive operating costs, which lessen the risks of starting a new service in relativelyuntried markets such as these. A possibility is fitting the 757 with winglets, improving theaerodynamics and fuel efficiency, and allowing longer range services like US–Germanywithout payload restrictions. Once a market has become established, Continental wouldconsider moving to wide-bodied aircraft (as it did, for example, on the Glasgow andManchester routes) or increasing frequency with the 757 (as it has, for example, on theBirmingham route).
An early failure of this strategy was Newark–Stansted, a 757 route Continental started inMay 2001 in view of the slot constraints at Gatwick and the growth of blue-chip companiesin Stansted’s catchment area. Continental suspended the service after September 11, and,by the time traffic had recovered, Gatwick had become less slot-constrained and the markethad changed such that Continental decided not to restart the service. Continental seesstart-up risks on services to regional airports – and Stansted – as greater than those to majorcapital cities. The market is slightly different from London services, being made up of ahigher proportion of UK-originating passengers. There has been strong support from the UKregions for Continental’s services and the airline believes it can repeat this at Belfast andBristol, attracting passengers that would otherwise have travelled via London (or Dublin) aswell as generating new business. Both the Edinburgh and Belfast routes qualified forassistance from route development funding.
Source: websites of Continental Airlines and Aviation Partners Boeing, and CAA discussions with the airline.
1. Some regional services reduce frequency in the winter season.
Page 2324 February 2005

CAP 754 UK Regional Air Services
Charter services
29 The focus of the discussion above has been on international scheduled services atregional airports, which have been the main generator of growth in recent years.Overall these now account for more than half the international passengers at regionalairports (see Table 2.6). Previously, the most important component of regionalinternational services was charter services. As noted in Chapter 1, charter servicesat regional airports had grown rapidly in the 1980s and 1990s to overtake those atLondon, but in recent years the volume of passengers travelling on charters from theUK appears to have reached a plateau. Nevertheless, as Table 2.6 indicates, theyremain a significant component of international traffic at most regional airports.
Note: (a) Traffic to oil rigs is classified as International Charter in CAA Airport Statistics.
Source: CAA Airport passenger-related statistics, 12 months to November 2004.
Table 2.6 International passengers at regional airports, 2004
International passengers (000) Charter
Airport Scheduled Charter Total share
Manchester 8,545 9,060 17,605 51%Birmingham 4,553 2,944 7,497 39%Glasgow 1,604 2,296 3,900 59%Nottingham East Midlands 1,972 1,546 3,517 44%Bristol 1,970 1,300 3,270 40%Newcastle 1,304 1,680 2,984 56%Liverpool 2,128 380 2,508 15%Edinburgh 1,720 431 2,152 20%Leeds Bradford 1,236 535 1,771 30%Cardiff 639 923 1,562 59%Prestwick 1,246 148 1,394 11%Belfast International 282 882 1,164 76%Aberdeen 531 467 998 47%Southampton 590 68 658 10%Durham Tees Valley 309 270 579 47%Humberside 132 371 503 74%Exeter 130 290 420 69%Bournemouth 174 181 355 51%Coventry 352 3 355 1%Norwich 124 220 344 64%Blackpool 68 50 118 42%Scatsta (a) 0 105 105 100%City of Derry 31 24 55 44%Manston 49 1 50 3%Isle of Man 37 2 40 6%Belfast City 32 4 36 10%Inverness 3 10 13 77%Others 5 7 12 57%
Total 29,769 24,196 53,965 45%
Page 2424 February 2005

CAP 754 UK Regional Air Services
30 Tour operators and charter airlines were arguably the pioneers in bringing low-costtravel to the regions, although the product they offered was relatively inflexible. Thelack of growth in the charter market in recent years appears to be the result of anumber of factors: changing preferences of UK holiday-makers in terms both of thetypes of holidays they take and the way in which they want to organise them; growingfamiliarity of UK passengers with international travel and increasing ownership ofsecond homes abroad; the transparency and accessibility provided by the internet;and head-to-head competition from no-frills airlines on routes to a number oftraditional charter destinations.
31 The tour operators and charter airlines are adopting a number of strategies to respondto the new forms of demand and the increasing competition that is emerging. Asnoted above, the major operators have created no-frills offshoots and are developingmore flexible packages, while some are focusing on specialist holiday products. AsTable 2.7 indicates, Spain was still the dominant charter destination from regionalairports in 2004, although its share has fallen since 2000. Turkey, Bulgaria and Croatiawere among the shorter-haul destinations to have gained. The 2004 charter volumesto the US and Canada are below the 2000 level, reflecting the aftermath of September11 and the restructuring of Canadian airlines, but Egypt, the Dominican Republic andCuba are among a number of very strongly growing long-haul destinations.
Source: CAA Airport passenger-related statistics, 2000 and 12 months to November 2004.
Table 2.7 Destination of charter passengers from UK regional airports, 2000
and 2004
Passengers (000)
Destination 2000 2004 Change
Spain 13,350 12,862 -4%Greece 2,762 2,957 7%Turkey 868 1,278 47%Portugal 1,217 1,257 3%Cyprus 1,090 1,152 6%USA 798 598 -25%Italy 476 555 17%Bulgaria 56 339 505%Malta 358 329 -8%Tunisia 297 323 9%France 253 302 20%Dominican Republic 112 229 105%Austria 189 215 14%Mexico 149 166 11%Egypt 49 162 228%Switzerland 86 111 30%Barbados 68 104 52%Canada 84 81 -5%Finland 34 73 114%Jamaica 48 69 45%India 55 68 22%Cuba 8 66 702%Croatia 17 61 257%Others 885 839 -5%
Total 23,311 24,196 4%
Page 2524 February 2005

CAP 754 UK Regional Air Services
32 So, in addition to entry into the scheduled mode (and the other changes noted aboveand elsewhere in this study), within the charter mode there has been a move awayfrom the traditional shorter-haul destinations such as Spain in reaction to the strengthof the euro as well as competition, and a move towards medium/longer-hauldestinations which can offer a different holiday experience. It is unclear as yet howthese different responses will impact on regional airports, but although products mayalter, it seems likely that the activity at regional airports will be most influenced by thestrength of demand in the local catchment area.
Page 2624 February 2005

CAP 754 UK Regional Air Services
Chapter 3 Services between UK regional airports
Notes: The UK regional centres are those with the 21 biggest airports in terms of total passenger traffic in 2004.One round trip each weekday is counted as a daily service. None of the services was less than daily.Includes throughplane services with an intermediate stop.
Source: OAG World Airways Guide.
Figure 3.1 Connections between selected UK regional centres – 1994 and 2004
1994
Abe
rdee
n
Bel
fast
(Int
& C
ity)
Birm
ingh
am
Bou
rnem
outh
Bris
tol
Car
diff
Dur
ham
/Tee
ssid
e E
dinb
urgh
Exe
ter
Gla
sgow
(inc
PIK
) H
umbe
rsid
e
Inv
erne
ss
Lee
ds B
radf
ord
Liv
erpo
ol
Man
ches
ter
New
cast
le
Nor
wic
h
Not
tingh
am E
MA
Sou
tham
pton
Aberdeen Belfast (Int & City) Birmingham Bournemouth Bristol Cardiff Wales Durham/Teesside Edinburgh Exeter Glasgow (inc Prestwick) Humberside Inverness Leeds Bradford Liverpool Manchester Newcastle Norwich Nottingham East Midlands Southampton
TotalMore than daily service = 13 12 5 2 5 2 4 10 2 11 2 2 5 3 10 6 3 4 5 106
Daily service = 3 2 0 0 0 3 1 2 1 0 2 1 0 0 1 1 2 0 3 22Total 16 14 5 2 5 5 5 12 3 11 4 3 5 3 11 7 5 4 8 128
Centres less than 100 miles apart =
2004
Abe
rdee
n
Bel
fast
(Int
& C
ity)
Birm
ingh
am
Bou
rnem
outh
Bris
tol
Car
diff
Dur
ham
T.V
.
Edi
nbur
gh
Exe
ter
Gla
sgow
(inc
PIK
) H
umbe
rsid
e
Inv
erne
ss
Lee
ds B
radf
ord
Liv
erpo
ol
Man
ches
ter
New
cast
le
Nor
wic
h
Not
tingh
am E
MA
Sou
tham
pton
Aberdeen Belfast (Int & City) Birmingham Bournemouth Bristol Cardiff Wales Durham Tees Valley Edinburgh Exeter Glasgow (inc Prestwick) Humberside Inverness Leeds Bradford Liverpool Manchester Newcastle Norwich Nottingham East Midlands Southampton
TotalMore than daily service = 12 11 6 0 6 6 1 10 0 8 1 3 5 3 8 6 3 4 7 100
Daily service = 2 3 0 1 0 0 1 1 4 4 0 1 0 0 0 1 0 0 0 18Proposed service = 0 3 0 1 1 0 0 1 2 2 0 1 2 4 0 0 2 0 1 20
Total 14 17 6 2 7 6 2 12 6 14 1 5 7 7 8 7 5 4 8 138Change since 1994 -2 +3 +1 +0 +2 +1 -3 +0 +3 +3 -3 +2 +2 +4 -3 +0 +0 +0 +0 +10
Centres less than 100 miles apart =
Page 2724 February 2005
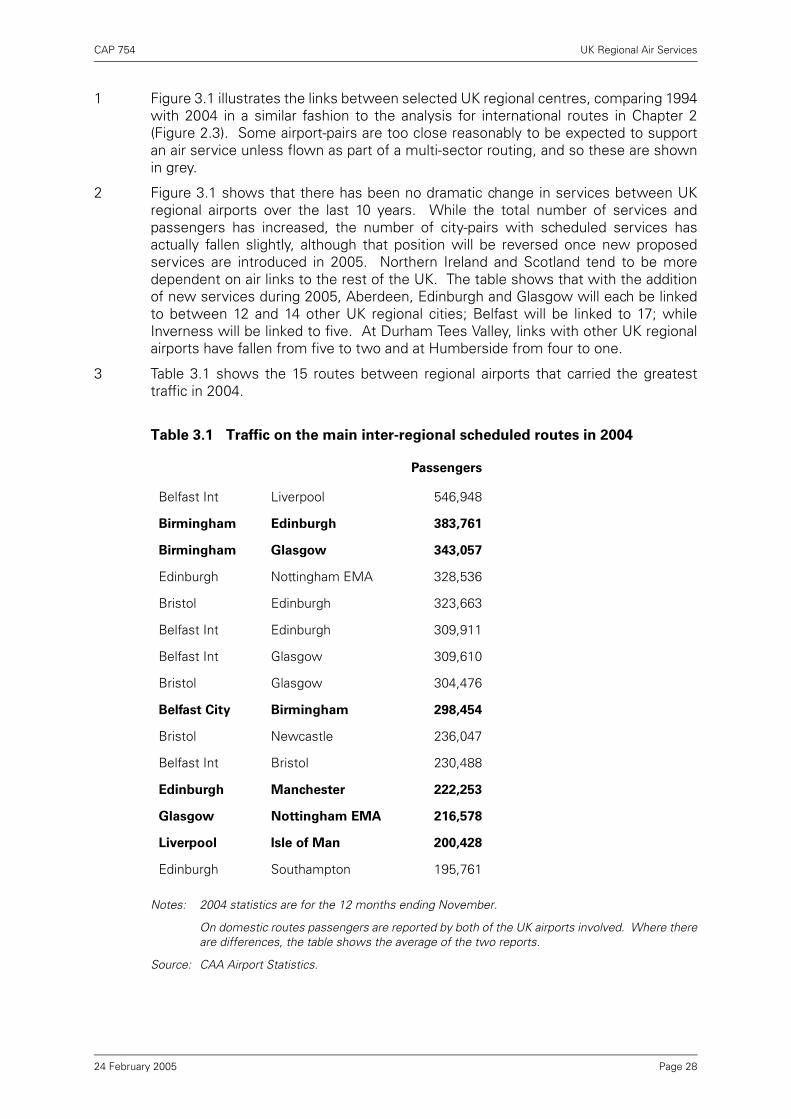
CAP 754 UK Regional Air Services
1 Figure 3.1 illustrates the links between selected UK regional centres, comparing 1994with 2004 in a similar fashion to the analysis for international routes in Chapter 2(Figure 2.3). Some airport-pairs are too close reasonably to be expected to supportan air service unless flown as part of a multi-sector routing, and so these are shownin grey.
2 Figure 3.1 shows that there has been no dramatic change in services between UKregional airports over the last 10 years. While the total number of services andpassengers has increased, the number of city-pairs with scheduled services hasactually fallen slightly, although that position will be reversed once new proposedservices are introduced in 2005. Northern Ireland and Scotland tend to be moredependent on air links to the rest of the UK. The table shows that with the additionof new services during 2005, Aberdeen, Edinburgh and Glasgow will each be linkedto between 12 and 14 other UK regional cities; Belfast will be linked to 17; whileInverness will be linked to five. At Durham Tees Valley, links with other UK regionalairports have fallen from five to two and at Humberside from four to one.
3 Table 3.1 shows the 15 routes between regional airports that carried the greatesttraffic in 2004.
Notes: 2004 statistics are for the 12 months ending November.
On domestic routes passengers are reported by both of the UK airports involved. Where thereare differences, the table shows the average of the two reports.
Source: CAA Airport Statistics.
Table 3.1 Traffic on the main inter-regional scheduled routes in 2004
Passengers
Belfast Int Liverpool 546,948
Birmingham Edinburgh 383,761
Birmingham Glasgow 343,057
Edinburgh Nottingham EMA 328,536
Bristol Edinburgh 323,663
Belfast Int Edinburgh 309,911
Belfast Int Glasgow 309,610
Bristol Glasgow 304,476
Belfast City Birmingham 298,454
Bristol Newcastle 236,047
Belfast Int Bristol 230,488
Edinburgh Manchester 222,253
Glasgow Nottingham EMA 216,578
Liverpool Isle of Man 200,428
Edinburgh Southampton 195,761
Page 2824 February 2005
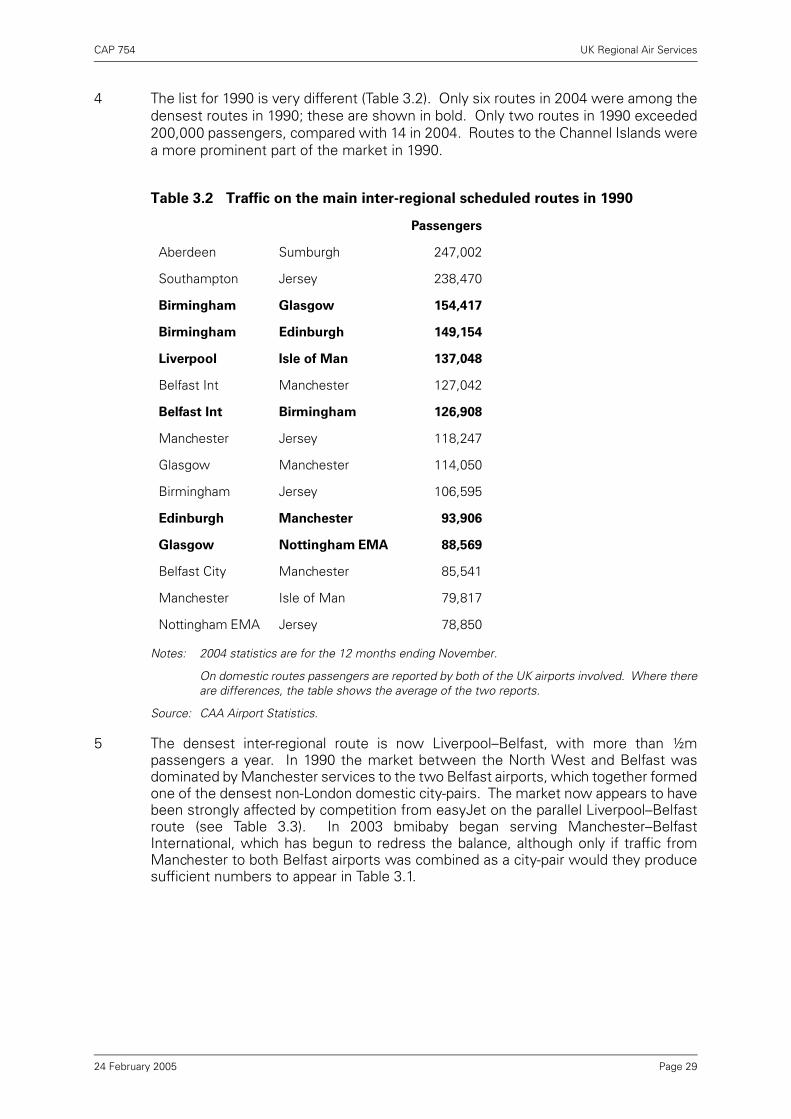
CAP 754 UK Regional Air Services
4 The list for 1990 is very different (Table 3.2). Only six routes in 2004 were among thedensest routes in 1990; these are shown in bold. Only two routes in 1990 exceeded200,000 passengers, compared with 14 in 2004. Routes to the Channel Islands werea more prominent part of the market in 1990.
Notes: 2004 statistics are for the 12 months ending November.
On domestic routes passengers are reported by both of the UK airports involved. Where thereare differences, the table shows the average of the two reports.
Source: CAA Airport Statistics.
5 The densest inter-regional route is now Liverpool–Belfast, with more than ½mpassengers a year. In 1990 the market between the North West and Belfast wasdominated by Manchester services to the two Belfast airports, which together formedone of the densest non-London domestic city-pairs. The market now appears to havebeen strongly affected by competition from easyJet on the parallel Liverpool–Belfastroute (see Table 3.3). In 2003 bmibaby began serving Manchester–BelfastInternational, which has begun to redress the balance, although only if traffic fromManchester to both Belfast airports was combined as a city-pair would they producesufficient numbers to appear in Table 3.1.
Table 3.2 Traffic on the main inter-regional scheduled routes in 1990
Passengers
Aberdeen Sumburgh 247,002
Southampton Jersey 238,470
Birmingham Glasgow 154,417
Birmingham Edinburgh 149,154
Liverpool Isle of Man 137,048
Belfast Int Manchester 127,042
Belfast Int Birmingham 126,908
Manchester Jersey 118,247
Glasgow Manchester 114,050
Birmingham Jersey 106,595
Edinburgh Manchester 93,906
Glasgow Nottingham EMA 88,569
Belfast City Manchester 85,541
Manchester Isle of Man 79,817
Nottingham EMA Jersey 78,850
Page 2924 February 2005
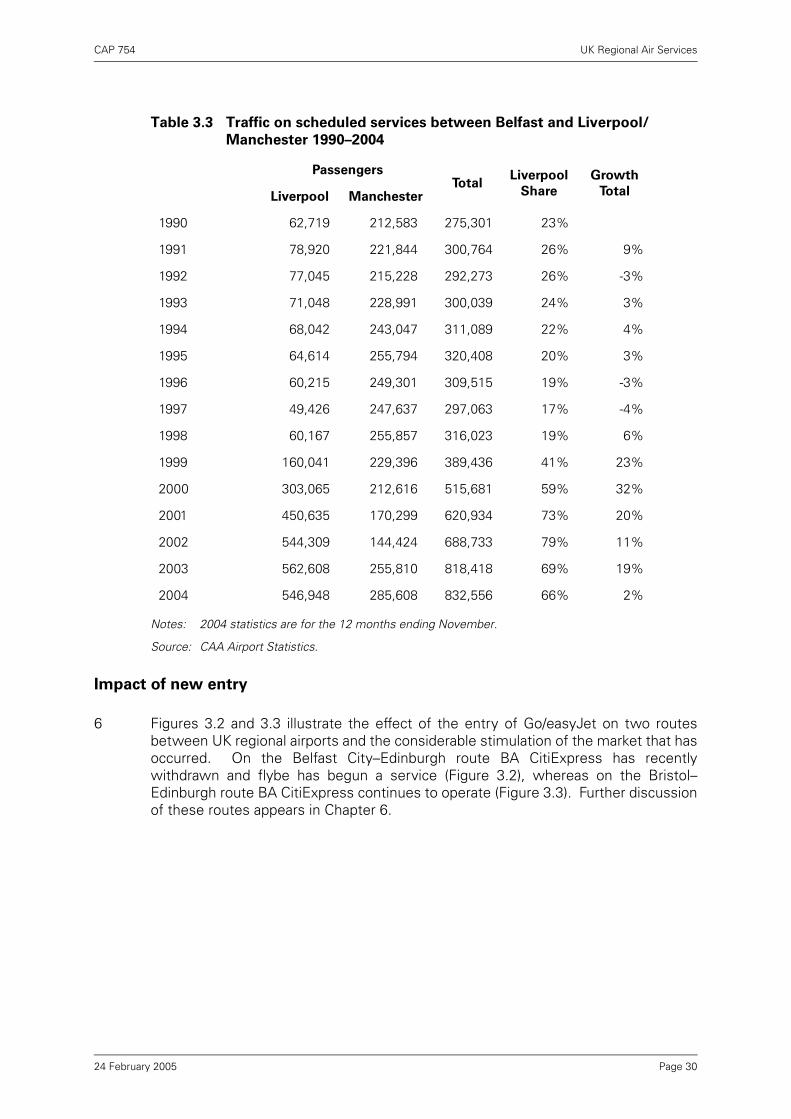
CAP 754 UK Regional Air Services
Notes: 2004 statistics are for the 12 months ending November.
Source: CAA Airport Statistics.
Impact of new entry
6 Figures 3.2 and 3.3 illustrate the effect of the entry of Go/easyJet on two routesbetween UK regional airports and the considerable stimulation of the market that hasoccurred. On the Belfast City–Edinburgh route BA CitiExpress has recentlywithdrawn and flybe has begun a service (Figure 3.2), whereas on the Bristol–Edinburgh route BA CitiExpress continues to operate (Figure 3.3). Further discussionof these routes appears in Chapter 6.
Table 3.3 Traffic on scheduled services between Belfast and Liverpool/
Manchester 1990–2004
PassengersTotal
Liverpool
Share
Growth
TotalLiverpool Manchester
1990 62,719 212,583 275,301 23%
1991 78,920 221,844 300,764 26% 9%
1992 77,045 215,228 292,273 26% -3%
1993 71,048 228,991 300,039 24% 3%
1994 68,042 243,047 311,089 22% 4%
1995 64,614 255,794 320,408 20% 3%
1996 60,215 249,301 309,515 19% -3%
1997 49,426 247,637 297,063 17% -4%
1998 60,167 255,857 316,023 19% 6%
1999 160,041 229,396 389,436 41% 23%
2000 303,065 212,616 515,681 59% 32%
2001 450,635 170,299 620,934 73% 20%
2002 544,309 144,424 688,733 79% 11%
2003 562,608 255,810 818,418 69% 19%
2004 546,948 285,608 832,556 66% 2%
Page 3024 February 2005
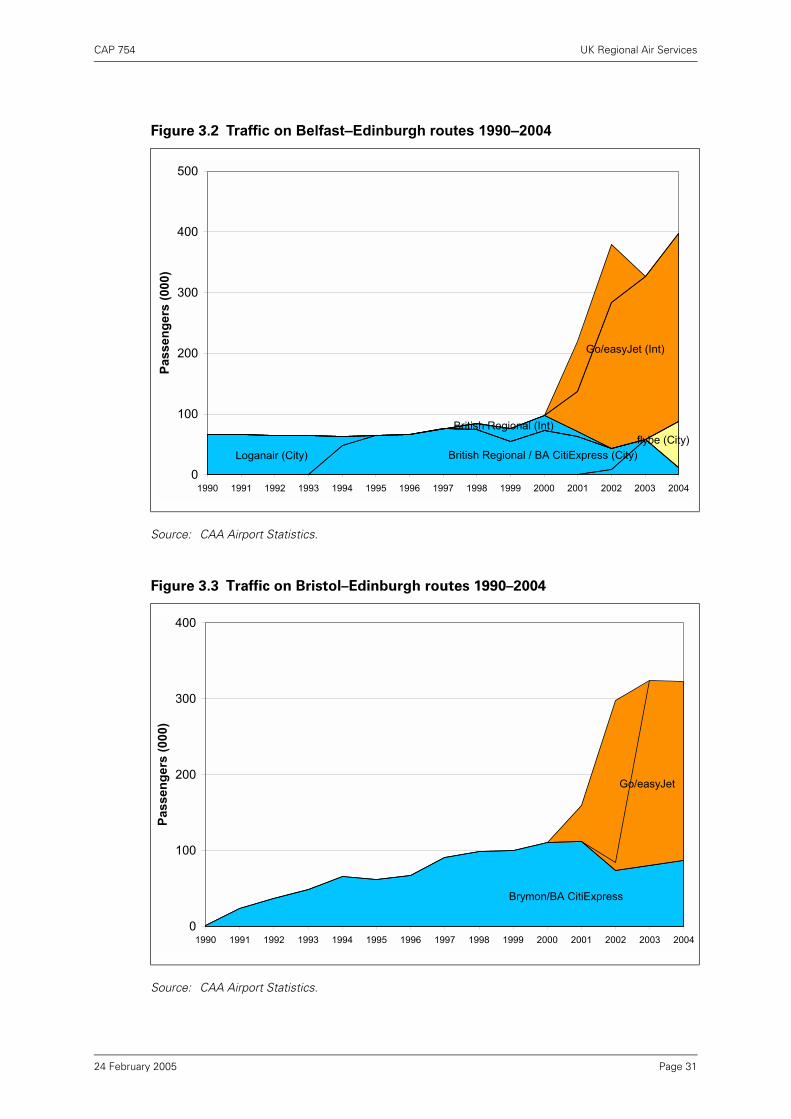
CAP 754 UK Regional Air Services
Source: CAA Airport Statistics.
Source: CAA Airport Statistics.
Figure 3.2 Traffic on Belfast�Edinburgh routes 1990�2004
Figure 3.3 Traffic on Bristol–Edinburgh routes 1990–2004
0
100
200
300
400
500
1990 1991 1992 1993 1994 1995 1996 1997 1998 1999 2000 2001 2002 2003 2004
Pass
enge
rs (0
00)
Loganair (City) British Regional / BA CitiExpress (City)
Go/easyJet (Int)
British Regional (Int)flybe (City)
0
100
200
300
400
1990 1991 1992 1993 1994 1995 1996 1997 1998 1999 2000 2001 2002 2003 2004
Pass
enge
rs (0
00)
Brymon/BA CitiExpress
Go/easyJet
Page 3124 February 2005

CAP 754 UK Regional Air Services
Surface transport alternatives
7 Improvements in surface transport, and in particular high-speed rail services, mayhave a big impact on regional air services that have no overwater sector. Aviationindustry representatives suggest that on journeys of less than three hours or so,surface modes will tend to be preferred by passengers, and that the same effect hasbeen observed in continental Europe. There must, therefore, be an expectation thatsurface competition will eventually play a greater role in inter-regional connections.On the other hand, road congestion is generally increasing, and many people have apoor perception of the rail network in the UK. Rail links between some regional pointsmay also be relatively slow, perhaps requiring a change of train, compared with, say,a high-speed link to London.
8 The business model adopted by airlines such as flybe (see case study in Chapter 6)presents the opportunity to offer air services between UK regional points that arecompetitive with road and rail on price and which offer shorter journey times.Consequently, there is significant potential to generate new markets, particularly onany surface journey of more than a few hours. For example, depending on schedules,a weekend trip may be feasible by air but less practical by road or rail. A visit thatwould previously have been impractical either because of cost or because of thejourney time is now a realistic possibility, and anecdotal evidence at least suggeststhat the entry of no-frills airlines offering low fares between regional cities may haveresulted in changes in the way air travel is perceived as an alternative to surfacemodes.
Page 3224 February 2005
CAP 754 UK Regional Air Services
Chapter 4 Services between UK regional airports and
London
1 Connections by air to London are important for any region where air travel is the onlyrealistic option or is a feasible alternative to surface modes. They will be particularlyimportant for regions where the surface alternative involves a journey time of severalhours or more. Consequently, there is much focus on the need to maintain, expandor introduce such services. Access to Heathrow for domestic services can beparticularly desirable because of the potential economic benefits from connectivity tothe global air network provided by a Heathrow service. The issue of take-off andlanding slots at Heathrow is discussed later in this chapter.
Developments since 1990
2 Figure 4.1 shows how traffic has developed on routes between regional airports andLondon since 1990. The total number of passengers has increased by 73%. AnnualHeathrow domestic traffic has broadly stayed within the 6–8m band. Gatwick traffichas been gradually increasing, with strong growth between 2001 and 2003, levellingoff at 3.9m passengers in 2003–2004. Stansted and Luton both grew rapidlyfollowing the entry of no-frills airlines, but domestic traffic at Luton has remainedstatic at the 1.6–1.7m mark from 2000 onwards, while Stansted continued to grow,levelling off at 2.7m in 2003–2004. Domestic traffic at London City continues toexpand and reached 0.5m in 2004. Heathrow’s share of the London total exceededthe other four airports combined until 2001. In 2004 it still accounted for 44% of theLondon total, but this has fallen from 80% in 1990. Virtually all the recent growth hasbeen at other London airports, partly because many of the airlines newly offeringservices to London from regional airports choose not to serve Heathrow foroperational reasons, but also because the scarcity of capacity has constrained furtherexpansion at Heathrow.
Page 3324 February 2005

CAP 754 UK Regional Air Services
Note: Includes Isle of Man and Channel Islands routes.
Source: CAA Airport Statistics
3 Between 1990 and 2004 the number of domestic destinations served from Heathrowhas more than halved, and the overall number of flights has declined by nearly 30%(Table 4.1). However, there is now a much wider spread of domestic services aroundthe other four London airports, bringing travel options (often at lower prices) that didnot previously exist. From those four airports, the number of flights to UK regionalpoints has increased by about 250% since 1990.
Figure 4.1 Traffic between UK regional airports and London
0
2
4
6
8
10
12
14
16
1990 1991 1992 1993 1994 1995 1996 1997 1998 1999 2000 2001 2002 2003 2004
Pass
enge
rs (m
)
Heathrow
Total London
Gatwick
Stansted
London City
Luton
(excl. Heathrow)London
Page 3424 February 2005

CAP 754 UK Regional Air Services
Notes: Includes Isle of Man and Channel Islands routes.
Belfast City and Belfast International, and Prestwick and Glasgow are counted as four separatedestinations.
Only non-stop services are shown.
A destination is shown as “served” from a London airport only if there are 500 or more one-way flights (in either direction) over the year, broadly equating to a daily weekday round-tripservice. The number of destinations served in a given year is therefore an average figure andnot necessarily representative of a given point in time.
Similarly the number of round trips per day is an average across the year so is again notnecessarily typical of a specific day.
2004 statistics are for the 12 months ending November.
bmi’s daily Heathrow–Inverness service, which started in March 2004, had not reached 500flights by November. If included this will increase the number of domestic destinations servedfrom Heathrow to nine (Aberdeen, Belfast City, Durham Tees Valley, Edinburgh, Glasgow,Inverness, Leeds Bradford, Manchester, Newcastle).
Source: CAA Airport Statistics
4 Overall, the number of regional destinations that are linked to London by air wasslightly greater in 2004 (at 21) than in 1990 (at 20). Four destinations served in 1990were no longer served in 2004 (Birmingham, Nottingham East Midlands, Humbersideand Exeter). Five destinations gained a direct service during the same period(Blackpool, Cardiff, Dundee, City of Derry and Prestwick). The number of flightsbetween regional airports and all five London airports increased by 43% between1990 and 2004.
5 Table 4.2 shows in more detail which regional airports have been served from eachLondon airport since 1990.
Table 4.1 Destinations and frequency on domestic scheduled services from
London: 1990 and 2004
UK destinations served Round trips per day
1990 2004 1990 2004
Heathrow 18 8 118 84
Gatwick 11 13 36 62
Stansted 3 12 3 36
Luton 2 6 3 20
London City 0 7 0 27
Total 34 46 160 229
Total (excluding Heathrow) 16 38 42 145
UK destinations served from London 20 21
UK destinations served from London (excluding Heathrow) 12 19
Page 3524 February 2005

CAP 754 UK Regional Air Services
Notes: Destinations are shown only if there were 500 or more one-way non-stop flights (in either direction) overthe year, broadly equating to a daily weekday round-trip service. 2004 is based on the 12 months endingNovember. This methodology will therefore mask services that have come and gone without achieving500 flights over the selected calendar years shown prior to 2004.
(a) These destinations began during 2004 but will exceed 500 one-way flights based on December 2004schedules.
(b) Suspended October 2004.
Source: CAA Airport Statistics and December 2004 OAG World Airways Guide.
Table 4.2 UK regional airports served from London
Aberdeen Gatwick, Heathrow Gatwick, Heathrow, Gatwick, Heathrow, Gatwick, Heathrow,Stansted, Luton Luton Luton
Dundee London City London City
Edinburgh Gatwick, Heathrow, Gatwick, Heathrow, Gatwick, Heathrow, Gatwick, Heathrow,Stansted Stansted, Luton, London City Stansted, Luton, London City Stansted, Luton, London City
Glasgow Gatwick, Heathrow Gatwick, Heathrow, Gatwick, Heathrow, Gatwick, Heathrow,Stansted, Luton Stansted, Luton Stansted, Luton
Inverness Heathrow Heathrow Gatwick, Luton Gatwick, Heathrow (a),Luton
Prestwick Stansted Stansted Stansted
Belfast International Gatwick, Heathrow, Heathrow, Heathrow, Gatwick, Luton Stansted Stansted, Luton Stansted, Luton
Belfast City Luton Gatwick, Gatwick, Heathrow, Gatwick, HeathrowStansted, Luton London City
City of Derry Stansted Stansted
Blackpool Stansted
Isle of Man Heathrow Heathrow Gatwick, London City, Gatwick, Luton Stansted, Luton, London City
Liverpool Heathrow London City
Manchester Gatwick, Heathrow Gatwick, Heathrow, Gatwick, Heathrow, Gatwick, Heathrow,Stansted Stansted, London City Stansted, London City
Humberside Heathrow
Leeds Bradford Gatwick, Heathrow Gatwick, Heathrow Gatwick, Heathrow Heathrow,London City (a)
Durham Tees Valley Heathrow Heathrow Heathrow Heathrow
Newcastle Gatwick, Heathrow Gatwick, Heathrow, Gatwick, Heathrow, Gatwick, Heathrow,Stansted, Luton Stansted Stansted
Birmingham Gatwick, Heathrow Gatwick
Nottingham HeathrowEast Midlands
Cardiff London City (b)
Exeter Gatwick
Newquay Heathrow Heathrow Gatwick, Gatwick,Stansted Stansted
Plymouth Heathrow Heathrow Gatwick Gatwick
Guernsey Gatwick , Heathrow, Gatwick, Heathrow Gatwick, Gatwick,Stansted Stansted Stansted
Jersey Gatwick, Heathrow, Gatwick, Heathrow, Gatwick, Gatwick,Stansted Stansted London City Stansted, London City
20041990 1996 2002
Page 3624 February 2005

CAP 754 UK Regional Air Services
Traffic development on five regional routes to London
6 Figures 4.2 to 4.6 below show traffic development on five London routes to Belfast,Edinburgh, Glasgow, Inverness and Newcastle between 1990 and 2004. Theseroutes have been selected because they are either the densest domestic routes orillustrate well the effect of new entry by no-frills airlines. Each coloured arearepresents a particular airline on a particular airport-pair, so areas of the same colourrepresent services by the same airline (or airline group) operated from differentairports. For clarity, most of the charts label only the current operators.
7 On London–Belfast, easyJet operates from three London airports and now outcarriesthe other two airlines, bmi and flybe, put together. On London–Edinburgh (Figure 4.3)both BA and easyJet operate from three London airports but are in direct competitiononly from Gatwick; easyJet’s market share in 2004 is just over a third, slightly lessthan BA. On London–Edinburgh and London–Glasgow (Figures 4.3 and 4.4), BA andbmi operate in head-to-head competition. There is no other head-to-head competitionon London–Glasgow routes, as easyJet (with a market share of around a quarter) doesnot operate to Glasgow from Gatwick, but there is additional competition fromRyanair’s Stansted–Prestwick service (with a market share of around one fifth). Ineach case the overall traffic growth is immediately apparent, even where Heathrowtraffic has actually fallen (for example Belfast – Figure 4.2) or Heathrow services havebeen withdrawn (for example Inverness – Figure 4.5).
8 The charts show that on London–Edinburgh (Figure 4.3) and London–Glasgow (Figure4.4) the no-frills airlines have generally stimulated traffic rather than diverted it fromincumbent airlines. London–Newcastle (Figure 4.6) illustrates this quite starkly, whenGo’s Stansted service replaced Gill Airways’ turboprop service. On London–Inverness, the entry of easyJet from Luton coincided with a decline in traffic for BA,although BA did transfer its service from Heathrow to Gatwick at the same time usinga smaller aircraft. The BA service now faces direct competition from easyJet’sGatwick service as well as a new service by bmi from Heathrow. On London–Belfast,easyJet’s entry had no obvious immediate effect on BA and bmi, but Heathrow traffichas declined since BA’s withdrawal. The effect of the entry of no-frills airlines on faresbetween London and Scotland is examined later in this chapter.
Page 3724 February 2005
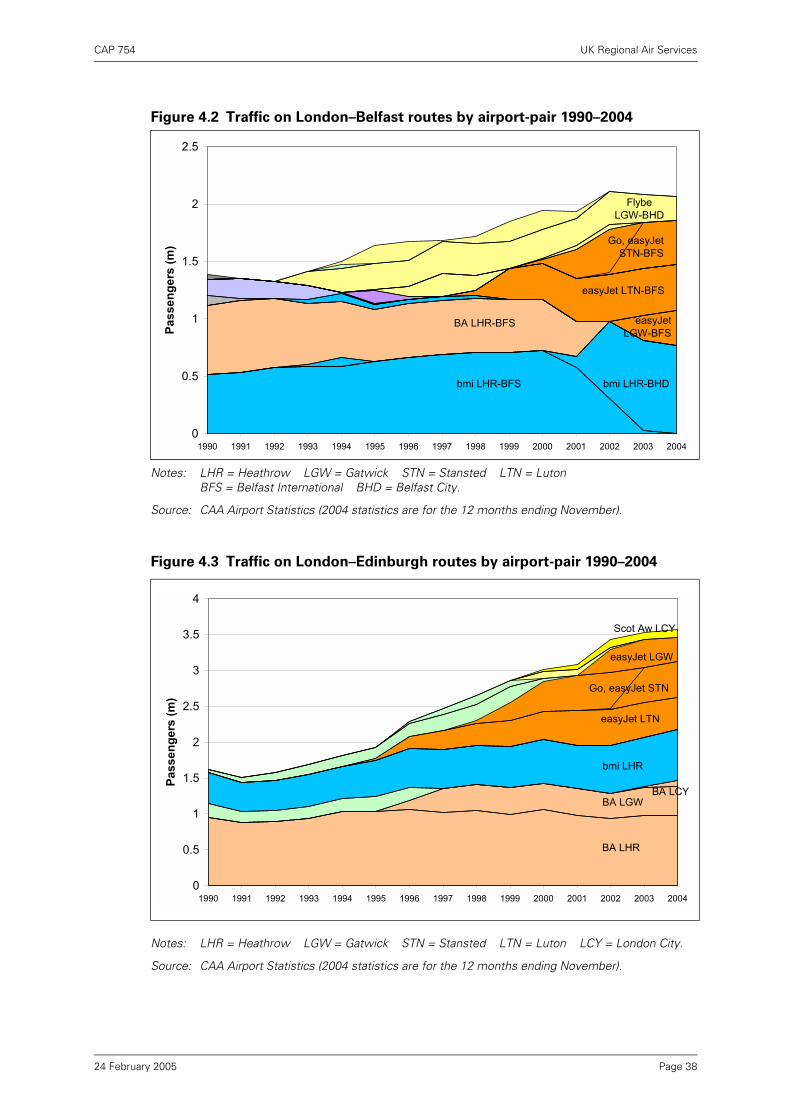
CAP 754 UK Regional Air Services
Notes: LHR = Heathrow LGW = Gatwick STN = Stansted LTN = Luton BFS = Belfast International BHD = Belfast City.
Source: CAA Airport Statistics (2004 statistics are for the 12 months ending November).
Notes: LHR = Heathrow LGW = Gatwick STN = Stansted LTN = Luton LCY = London City.
Source: CAA Airport Statistics (2004 statistics are for the 12 months ending November).
Figure 4.2 Traffic on London–Belfast routes by airport-pair 1990–2004
Figure 4.3 Traffic on London–Edinburgh routes by airport-pair 1990–2004
0
0.5
1
1.5
2
2.5
1990 1991 1992 1993 1994 1995 1996 1997 1998 1999 2000 2001 2002 2003 2004
Pass
enge
rs (m
)
easyJet LTN-BFS
Go, easyJet STN-BFS
easyJet LGW-BFS
bmi LHR-BHD
BA LHR-BFS
bmi LHR-BFS
Flybe LGW-BHD
0
0.5
1
1.5
2
2.5
3
3.5
4
1990 1991 1992 1993 1994 1995 1996 1997 1998 1999 2000 2001 2002 2003 2004
Pass
enge
rs (m
)
BA LHR
BA LGW
bmi LHR
easyJet LTN
Go, easyJet STN
easyJet LGW
Scot Aw LCY
BA LCY
Page 3824 February 2005
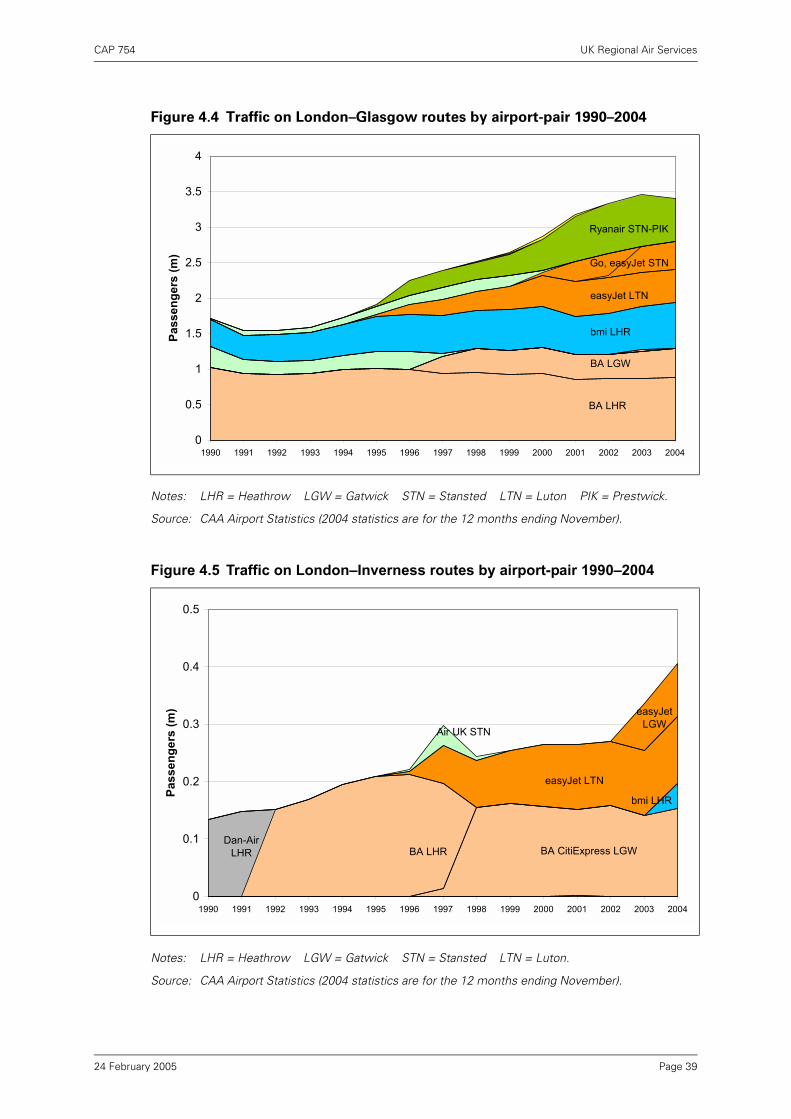
CAP 754 UK Regional Air Services
Notes: LHR = Heathrow LGW = Gatwick STN = Stansted LTN = Luton PIK = Prestwick.
Source: CAA Airport Statistics (2004 statistics are for the 12 months ending November).
Notes: LHR = Heathrow LGW = Gatwick STN = Stansted LTN = Luton.
Source: CAA Airport Statistics (2004 statistics are for the 12 months ending November).
Figure 4.4 Traffic on London–Glasgow routes by airport-pair 1990–2004
Figure 4.5 Traffic on London�Inverness routes by airport-pair 1990�2004
0
0.5
1
1.5
2
2.5
3
3.5
4
1990 1991 1992 1993 1994 1995 1996 1997 1998 1999 2000 2001 2002 2003 2004
Pass
enge
rs (m
)
BA LHR
bmi LHR
BA LGW
easyJet LTN
Go, easyJet STN
Ryanair STN-PIK
0
0.1
0.2
0.3
0.4
0.5
1990 1991 1992 1993 1994 1995 1996 1997 1998 1999 2000 2001 2002 2003 2004
Pass
enge
rs (m
)
Dan-Air LHR BA CitiExpress LGWBA LHR
easyJet LTN
easyJet LGW
Air UK STN
bmi LHR
Page 3924 February 2005
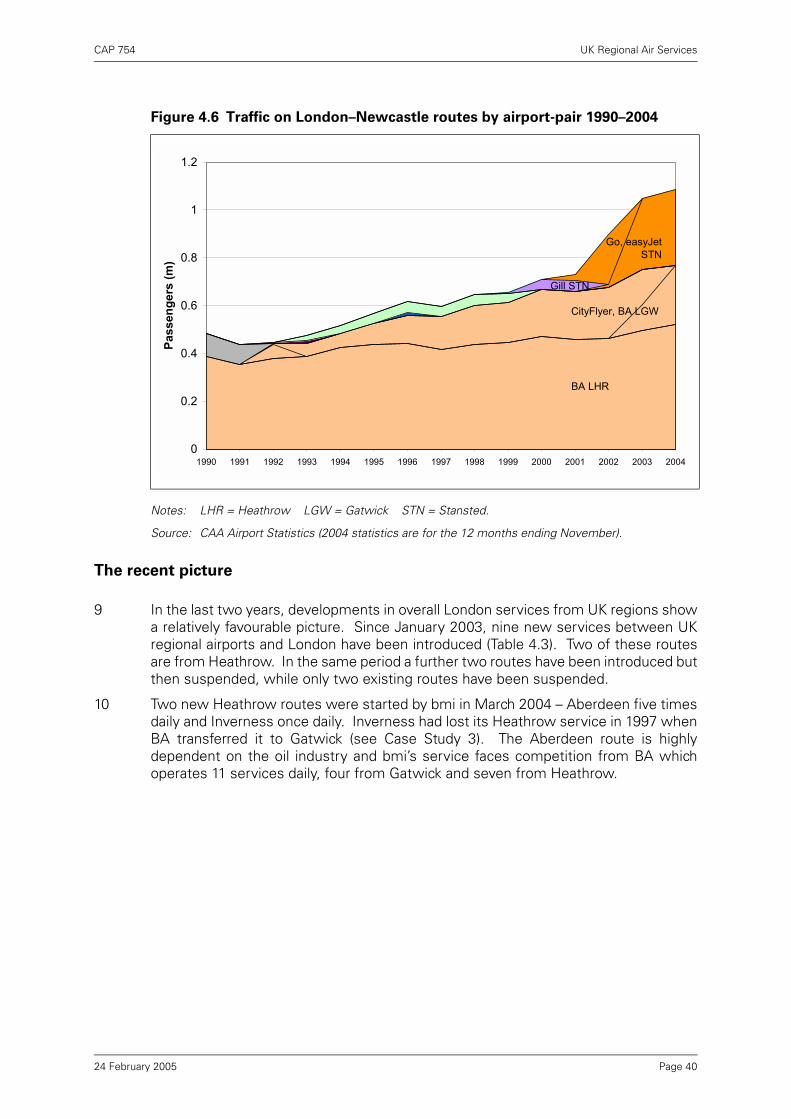
CAP 754 UK Regional Air Services
Notes: LHR = Heathrow LGW = Gatwick STN = Stansted.
Source: CAA Airport Statistics (2004 statistics are for the 12 months ending November).
The recent picture
9 In the last two years, developments in overall London services from UK regions showa relatively favourable picture. Since January 2003, nine new services between UKregional airports and London have been introduced (Table 4.3). Two of these routesare from Heathrow. In the same period a further two routes have been introduced butthen suspended, while only two existing routes have been suspended.
10 Two new Heathrow routes were started by bmi in March 2004 – Aberdeen five timesdaily and Inverness once daily. Inverness had lost its Heathrow service in 1997 whenBA transferred it to Gatwick (see Case Study 3). The Aberdeen route is highlydependent on the oil industry and bmi’s service faces competition from BA whichoperates 11 services daily, four from Gatwick and seven from Heathrow.
Figure 4.6 Traffic on London–Newcastle routes by airport-pair 1990–2004
0
0.2
0.4
0.6
0.8
1
1.2
1990 1991 1992 1993 1994 1995 1996 1997 1998 1999 2000 2001 2002 2003 2004
Pass
enge
rs (m
)
BA LHR
CityFlyer, BA LGW
Go, easyJet STN
Gill STN
Page 4024 February 2005
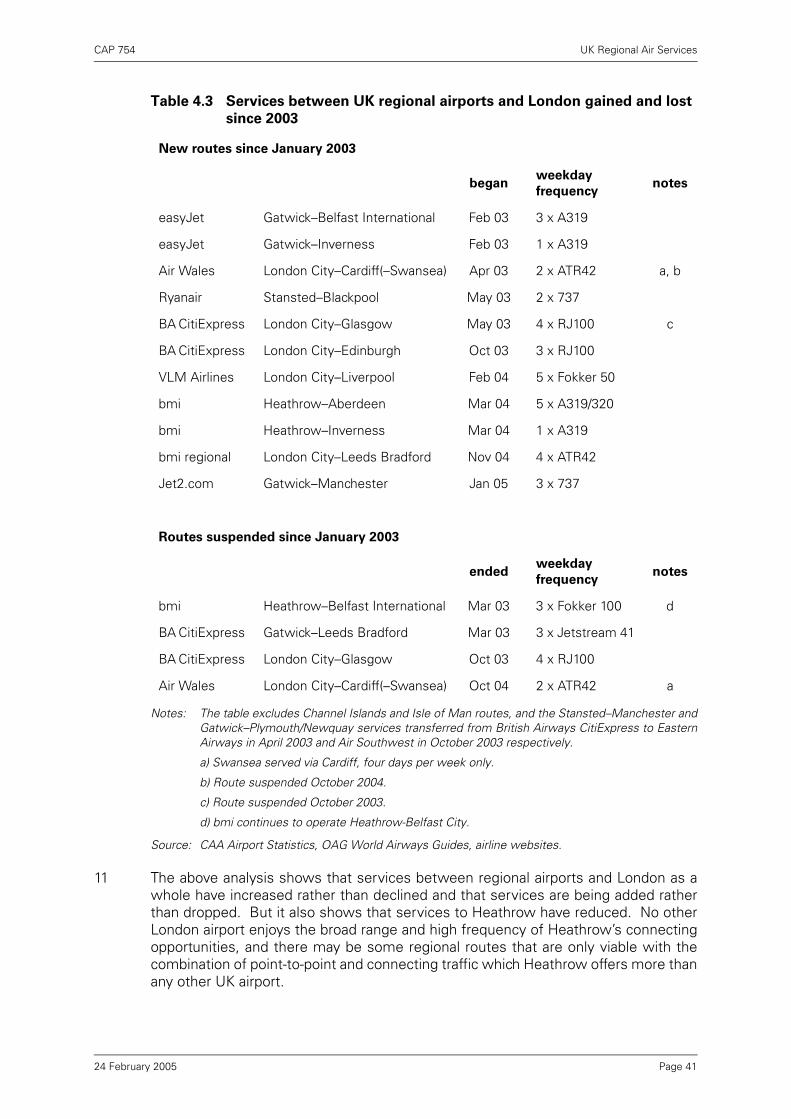
CAP 754 UK Regional Air Services
Notes: The table excludes Channel Islands and Isle of Man routes, and the Stansted–Manchester andGatwick–Plymouth/Newquay services transferred from British Airways CitiExpress to EasternAirways in April 2003 and Air Southwest in October 2003 respectively.
a) Swansea served via Cardiff, four days per week only.
b) Route suspended October 2004.
c) Route suspended October 2003.
d) bmi continues to operate Heathrow-Belfast City.
Source: CAA Airport Statistics, OAG World Airways Guides, airline websites.
11 The above analysis shows that services between regional airports and London as awhole have increased rather than declined and that services are being added ratherthan dropped. But it also shows that services to Heathrow have reduced. No otherLondon airport enjoys the broad range and high frequency of Heathrow’s connectingopportunities, and there may be some regional routes that are only viable with thecombination of point-to-point and connecting traffic which Heathrow offers more thanany other UK airport.
Table 4.3 Services between UK regional airports and London gained and lost
since 2003
New routes since January 2003
beganweekday
frequencynotes
easyJet Gatwick–Belfast International Feb 03 3 x A319
easyJet Gatwick–Inverness Feb 03 1 x A319
Air Wales London City–Cardiff(–Swansea) Apr 03 2 x ATR42 a, b
Ryanair Stansted–Blackpool May 03 2 x 737
BA CitiExpress London City–Glasgow May 03 4 x RJ100 c
BA CitiExpress London City–Edinburgh Oct 03 3 x RJ100
VLM Airlines London City–Liverpool Feb 04 5 x Fokker 50
bmi Heathrow–Aberdeen Mar 04 5 x A319/320
bmi Heathrow–Inverness Mar 04 1 x A319
bmi regional London City–Leeds Bradford Nov 04 4 x ATR42
Jet2.com Gatwick–Manchester Jan 05 3 x 737
Routes suspended since January 2003
endedweekday
frequencynotes
bmi Heathrow–Belfast International Mar 03 3 x Fokker 100 d
BA CitiExpress Gatwick–Leeds Bradford Mar 03 3 x Jetstream 41
BA CitiExpress London City–Glasgow Oct 03 4 x RJ100
Air Wales London City–Cardiff(–Swansea) Oct 04 2 x ATR42 a
Page 4124 February 2005

CAP 754 UK Regional Air Services
12 So, unsurprisingly, a strong message from airports and regional bodies is thatHeathrow services remain important to them. However, while Heathrow access isoften regarded as an important part of the overall “ideal package” of services, it wouldnot in isolation be likely to meet all the demands of the market. There is a desire alsofor services to other London airports (providing competition for point-to-pointpassengers as well as some connecting possibilities particularly to short-hauldestinations) and frequent services by “hub” carriers to one or more continental hubs(thus providing competition to the Heathrow service in markets for connectingpassengers).
13 Industry representatives are generally of the view that improved high-speed, high-frequency rail services to London could pose a competitive threat to air services fromsome regions. For example, it remains to be seen what effect the recent West CoastMain Line upgrade (reducing the rail journey to 140 minutes or less) will have on arelatively short air route like Manchester, which in January 2005 had 19 services a dayto Heathrow (and around 40 to all London airports). However, in the short term, poorpublic perceptions created by the recent troubles of the rail industry have helpedrather than hindered air services. First Class rail fares may also be viewed asuncompetitive with air.
Case study 2: VLM Airlines
Created in 1992, the privately-owned Belgian airline VLM Airlines has focused on providingpoint-to-point connections between small airports close to major business markets. Theairline commenced its first service from Antwerp to London City in May 1993. It is now thebiggest operator at London City with daily services to Manchester, Liverpool, Rotterdam,Brussels, Luxembourg and Jersey, facilitated by the liberalised EU aviation market. Onlyone VLM Airlines service does not involve the UK (Rotterdam–Hamburg). The airline carriedmore than 500,000 passengers in 2004.
VLM Airlines offers ten flights a day to London City from Manchester and five a day fromLiverpool using 50-seat turboprop Fokker 50 aircraft. The Manchester service competeswith frequent services to Heathrow (19 a day) and Gatwick (10 a day from January 2005),and while Liverpool currently has no other London services, its catchment area overlapswith that of Manchester. Both routes also face competition from surface modes, and whilerecent problems with the West Coast Main Line rail service have boosted air traffic, thereduced journey times as the rail service improves may become more of a threat.
A large proportion of VLM Airlines’ passengers (around 85%) travel on business. The airlinedoes not see itself as competing directly with no-frills airlines, but has observed thatpassengers now have a greater expectation of low prices; previously passengers werechoosing its services largely for the time-saving benefits, with less consideration of farelevels. With a greater emphasis now being placed on price, VLM Airlines has adopted amore flexible structure of eight one-way fare levels instead of the more limited choice offlexible and conditioned fares it was previously offering on its network.
Although primarily serving the point-to-point market, VLM Airlines times arrivals anddepartures at London City to allow connections. For example there is only one direct flightbetween Luxembourg and Manchester each day and VLM Airlines can offer an alternativerouting over London City. Currently, less than 20% of bookings are made on-line, reflectingthe fact that most bookings for business travellers are via corporate travel agents.
VLM Airlines has not experienced any particular barriers to entering new markets nor metwith significant problems from being a Belgian airline operating within the UK.
Source: VLM Airlines’ website and CAA discussions with the airline.
Page 4224 February 2005

CAP 754 UK Regional Air Services
Fares comparison
14 A passenger making a domestic journey to or from London will be concerned not onlywith the frequency of the service but also its price. Table 4.4 shows estimates of theaverage fare paid by passengers in 1990, 2001 and 2003 as recorded in the CAApassenger survey.
Source: CAA O&D Surveys.
15 At Heathrow and Gatwick, the average fares paid by business travellers1 rose by about50% in nominal terms by 2001 compared with 1990, but fell back by 2003. AtStansted and Luton, fares paid by business travellers were about half the levels atHeathrow in 2003. Most leisure fares in 2003 were either at a broadly similar level innominal terms as those in 1990, or have fallen.
16 Most of the new services on these routes are by no-frills airlines. The table showsthat their entry has had a clear downward effect on fares, providing new low-fareoptions to both business and leisure passengers travelling between Scotland andLondon (or the South East). The effect is most noticeable at those airports where no-frills airlines are operating, but the impact of their entry also seems to have reducedthe average fares paid at Heathrow between 2001 and 2003.
Table 4.4 Return fares on services between Scotland and London
UK Business
Aberdeen Glasgow Edinburgh
1990 2001 2003 1990 2001 2003 1990 2001 2003
Heathrow £177 £255 £230 £145 £221 £202 £148 £225 £194
Gatwick £153 £240 £174 £137 £207 £163 £135 £196 £128
Stansted -- -- -- £143 £111 £81 £140 £119 £90
Luton -- £100 £110 -- £91 £84 -- £100 £91
London City -- £245 -- -- £203 £231 -- £212 £210
UK Leisure
Aberdeen Glasgow Edinburgh
1990 2001 2003 1990 2001 2003 1990 2001 2003
Heathrow £115 £146 £104 £97 £90 £92 £107 £94 £90
Gatwick £107 £113 £101 £90 £91 £90 £94 £103 £70
Stansted -- -- -- £104 £55 £60 £98 £64 £64
Luton -- £79 £76 -- £65 £61 -- £73 £59
London City -- £91 -- -- £143 £107 -- £97 £115
1. The survey questions determine journey purpose and the fare paid. The fares shown are therefore an average of thefares actually paid by the business travellers surveyed.
Page 4324 February 2005

CAP 754 UK Regional Air Services
17 On Gatwick–Edinburgh, BA and easyJet are now competing head to head. Table 4.5further refines the analysis in Table 4.4 to show the average fares paid by passengerson each airline. The table shows the effect of easyJet’s entry, with BA’s response tothe additional competition being a reduction in its own fares.
Source: CAA O&D Surveys.
Table 4.5 Air fares on services between Edinburgh and Gatwick
UK Business 2001 2003
BA average £211 £163
easyJet average £94 £98
Gatwick average (from Table 4.4) £196 £128
UK Leisure 2001 2003
BA average £111 £93
easyJet average £67 £57
Gatwick average (from Table 4.4) £103 £70
Case study 3: Inverness (and the Highlands and Islands)
Air links are of crucial importance to the Highlands and Islands region, because the surfacealternatives linking the region to other parts of the UK are generally poor. For example, therail journey to London takes at least eight hours. The attractiveness of the area tobusinesses and to new and inward investment – and the creation of high-value jobs as aconsequence – therefore depends on air services, particularly to London, and the accessthey give to major business centres for local companies. Good quality air links also make aperipheral region more attractive to a workforce being relocated there and can provideopportunities for inbound tourism.
Inverness is the air gateway to the Highlands. Ten years ago BA was the sole London–Inverness operator with a Heathrow service that it inherited from the takeover of Dan-Air.BA switched this service to Gatwick in 1997 and it is now operated by its CitiExpresssubsidiary using smaller aircraft. The Gatwick service has three rotations a day, timed sothat business passengers from Inverness can do a full day’s work in London (the servicefrom Gatwick is less well timed, giving around six hours in Inverness). easyJet began a dailyservice from Luton in late 1996 and more recently a daily service from Gatwick in 2003.From March 2004 bmi added a daily Heathrow service. All three services operate in themiddle of the day.
BA’s switch to Gatwick caused considerable controversy in the region, primarily because ofthe fewer connecting possibilities that Gatwick offers compared with Heathrow, althoughthe BA service was still regarded as of great importance. There is concern in the region thatthe Gatwick service itself may be lost, and in 2001 the Scottish Executive asked theGovernment to impose a Public Service Obligation to protect the Gatwick service, althoughno such PSO has been imposed. (There are 16 PSOs currently imposed on routes withinthe Highlands and Islands – see Chapter 8.) Despite the loss of the Heathrow service,aggregate passenger numbers between Inverness and London have continued to grow.
Page 4424 February 2005
CAP 754 UK Regional Air Services
Case Study 3 contd.
Access to Heathrow
18 Although the links from UK regional airports to European and other internationaldestinations have increased over recent years and brought considerable benefits, thelink to London – and especially to Heathrow – remains important for domestic andtransfer passengers and for regional economies. Indeed, some regions expressedthe view that guaranteed Heathrow access was an essential part of their economicdevelopment package.
19 As has been observed earlier, even where regional services from Heathrow havereduced somewhat, the links to London overall have increased. And, despite theincreasingly competitive nature of short-haul markets, there has not been any recentloss of UK regional services to Heathrow. Indeed, in 2004 bmi began two Heathrowservices to Aberdeen and Inverness, both markets where easyJet is an established
The region is very keen to retain the BA brand because of its global visibility, the interliningand codeshare possibilities it provides, and the associated prestige that this brings to theregion. CAA survey data shows that in 2003, 41% of passengers on the BA route wereconnecting in London, compared with 9% and 25% on the easyJet Luton and Gatwickservices respectively.
Inverness Airport believes that (having a relatively strong propensity to use air services) therelatively small population (around ¼m) could support an international service if there wassufficient inbound traffic. Air UK began an Amsterdam service in 1997 alongside a serviceto Stansted, but both were withdrawn a year later. Snowflake, a division of SAS, began atwice weekly Inverness–Stockholm service in March 2004 with funding from the ScottishRoute Development Fund (RDF). There proved to be a market for Scandinavian tourists, butfew Scots travelled to Stockholm. A Dash 8 operation had originally been planned, butbecause of aircraft availability much larger MD81 aircraft were used. Load factors of lessthan 50% indicated that these aircraft were too large for the route, at least in its earlystages. The service was suspended at the end of July 2004, having carried less than 3,000passengers, and Inverness again has no international scheduled services.
The difficulties in attracting international services to Inverness makes the link to London thatmuch more important to the region. But, overall, access for the region to London hasimproved considerably. The entry of easyJet has boosted services and injected animportant element of price competition that has resulted in lower fares. Traffic has nearlydoubled in the last 10 years, as illustrated by Figure 4.5. The access to Heathrow providedby the new bmi service – started, like the easyJet routes, without RDF assistance – is notas good as in the past, but does provide some connecting possibilities, for example withinbound flights from the USA. As well as links to Loganair’s comprehensive network withinScotland, including its Highlands and Islands network, Inverness is also served three timesdaily from Manchester and Birmingham by Eastern Airways using Jetstream turboprops,the latter route aided by RDF funding.
The terminal building at Inverness Airport was built under a PFI contract by a privatecompany and is paid for by way of a levy per passenger and income from the car park andconcessions. In some quarters it is felt that this deal constrains the airport's owncommercial freedom.
Source: CAA discussions with Highlands and Islands Airports Ltd, airlines and regional bodies.
Page 4524 February 2005

CAP 754 UK Regional Air Services
operator from Gatwick or Luton. Heathrow remains a prime UK transfer point,especially for passengers connecting to long-haul flights, even though there are nowgood connections from many regional airports to other European hubs. It is also ofcourse an important airport for point-to-point traffic, particularly because of itsproximity to central London, to west London business and population centres and tothe M4 corridor and, to a lesser extent, the M40 corridor.
20 Loss of a Heathrow link may be a particular disbenefit for connecting passengers andthus for a region’s wider economic interests. Congestion has created a scarcity ofsuitable take-off and landing slots at Heathrow and made those slots more valuable.Airlines are able to switch slots to other services, and their motivation stems lessfrom unprofitability of domestic services than their being potentially less profitablethan an alternative use of the scarce slots, especially when an airline with domesticservices cannot expand its slot portfolio. The difficulties of access to Heathrow aretherefore essentially a result of scarce capacity at Heathrow, not at regional airportswhere infrastructure is generally not a major constraint, at least as regardsincremental development at existing locations.
21 The intrinsic value of Heathrow slots and airlines’ ability to switch them to otherservices creates tensions. Some regions feel frustrated in their wish to see accessre-established, or believe that their existing service to Heathrow is under threat.Opinions in the industry differ as to how real that threat is. BA and bmi have been theonly operators of domestic services to Heathrow since 2002 (Table 4.6). Both saythey are fully committed to regional services, which form an important part of theirnetworks, in particular feeding their own and alliance partners’ services at their hub.That said, no airline can give a cast-iron guarantee to continue serving a route, ascommercial considerations sometimes require hard choices, for example if anotherairline were to add excessive capacity. Demand patterns can also change, for exampleif a big corporate user on a particular route shrinks its operations. The impact of theintroduction of formalised slot trading on regional services from Heathrow isdiscussed in Chapter 8.
Notes: 2004 statistics are for the 12 months to November.
Brymon became a BA subsidiary in 1993; British Regional and Manx were taken over by BA in2001.
The total covers only the airlines shown; there were a small number of other flights reportedas domestic over the period.
Source: CAA Airport Statistics.
Table 4.6 Scheduled flights between UK regional airports and Heathrow
1992–2004
Airline 1992 1994 1996 1998 2000 2002 2004
BA 41,911 40,664 40,384 37,942 37,053 30,771 31,341
bmi 28,930 23,847 23,974 28,023 27,231 29,103 29,169
Manx 2,006 1,961 1,971 1,965 1,961 475
KLMuk 2,729 2,724 2,764 635
Brymon 2,307 2,335 2,652
British Regional 1,803
Total 77,883 73,334 71,745 68,565 66,245 60,349 60,510
Page 4624 February 2005
CAP 754 UK Regional Air Services
22 There may be other pressures on Heathrow services. The development of muchimproved networks from regional airports as described in Chapter 2 will reduce thenumber of passengers that need to travel to Heathrow for connecting flights. This willtend to reduce the number of connecting passengers travelling on domesticHeathrow services, which can represent a substantial and valuable proportion of thetotal traffic on such routes. Heathrow is also subject to strict night noise restrictionsand any tightening of those restrictions, squeezing flights in the early morning or lateevening, could have knock-on effects to feed traffic.
23 bmi has a sizeable slot holding at Heathrow, but has in the past withdrawn domesticservices (such as Liverpool–Heathrow in 1992) in order to mount new serviceselsewhere. In the last few years bmi has had aspirations for long-haul services fromHeathrow, and has recently announced its first such route to Mumbai. However, bmistated in its evidence to the CAA public hearing on UK/India routes that if it were tobe granted rights (for which it would require Heathrow slots) it was not its intentionto reduce frequency on any of its UK regional services to Heathrow in order to serveMumbai.
Page 4724 February 2005

Page 48

CAP 754 UK Regional Air Services
Chapter 5 Connections to the global network
1 Even with the much wider range of destinations now served from UK regionalairports, it is unlikely they could ever match the range of a major hub airport,particularly to more distant destinations. Passengers requiring connections to thisglobal air network have the option of travelling by surface to a hub, or picking up aconnecting flight to a hub from a regional airport closer to home.
2 Table 5.1 illustrates the relative importance of the different European hubs forpassengers travelling from a given UK regional airport. In relation to short-haulpassengers, the table suggests that Heathrow is now less important as a connectinghub for passengers. By 2001, Heathrow’s share had fallen to between a quarter anda third of the total short-haul connectors from a sample of regional airports. Thisresults from a combination of the increase in direct services from regional airports, asexplained in Chapter 2, and other hub airports providing connections, as shown in thetables later in this chapter.
3 Heathrow does, however, remain a prime transfer point, especially for passengersconnecting to long-haul flights and for those using regional airports without links toforeign hubs.
Notes: Figures for Scottish airports include only those passengers whose surface origin is in Scotland.
Figures for Newcastle include only those passengers whose surface origin is in the Northernplanning region.
In both cases this captures the majority of users at these airports.
Source: CAA O&D Surveys at regional airports.
Table 5.1 Hub share of passengers from regional airports who connect en route
Short-haul destinations Long-haul destinations
1990 2001 1990 2001
Edinburgh Heathrow 73% 24% Edinburgh Heathrow 70% 57%
Gatwick 8% 11% Gatwick 23% 6%
Other hubs 19% 65% Other hubs 7% 37%
100% 100% 100% 100%
Glasgow Heathrow 56% 33% Glasgow Heathrow 40% 48%
Gatwick 9% 9% Gatwick 13% 9%
Other hubs 35% 58% Other hubs 47% 43%
100% 100% 100% 100%
Aberdeen Heathrow 58% 36% Aberdeen Heathrow 58% 41%
Gatwick 11% 14% Gatwick 29% 20%
Other hubs 31% 50% Other hubs 13% 39%
100% 100% 100% 100%
1994/95 2001 1994/95 2001
Newcastle Heathrow 49% 25% Newcastle Heathrow 60% 55%
Gatwick 7% 11% Gatwick 12% 14%
Other hubs 44% 64% Other hubs 28% 31%
100% 100% 100% 100%
Page 4924 February 2005

CAP 754 UK Regional Air Services
4 Table 5.2 summarises the extent to which principal European hubs are connected tothe UK regions, and compares the general position in 2003 with 1990. The specificposition in May 2003 is examined in more detail by UK airport in Table 5.3.
Notes: The table shows routes with 500 or more one-way flights (in either direction) over the year,broadly equating to a daily weekday round-trip service.
The links to Brussels have since declined following the collapse of Sabena.
Source: CAA Airport Statistics.
Source: OAG database of BACK Information Services, May 2003.
Table 5.2 Services from UK regional airports to European hubs, 1990 and 2003
UK destinations served Average round trips per day
1990 2003 1990 2003
Amsterdam 15 16 35 71
Paris CDG 9 11 19 46
Frankfurt 2 4 7 18
Brussels 6 8 12 22
London Heathrow 18 8 118 79
Table 5.3 Services from UK regional airports to European hubs, 2003
Round trips per day
Heathrow Amsterdam Paris Brussels Frankfurt Copen-hagen
Milan Rome
Aberdeen 6.3 3.0 2.5 -- -- -- -- --
Belfast Int. -- 1.0 -- -- -- -- -- --
Belfast City 7.5 -- -- -- -- -- -- --
Birmingham -- 7.4 9.9 4.1 7.0 4.0 2.4 1.0
Bristol -- 3.5 5.5 1.9 0.8 -- -- --
Cardiff -- 3.8 1.5 -- -- -- -- --
Durham Tees V. 2.5 3.0 -- -- -- -- -- --
Edinburgh 18.0 7.8 5.2 2.4 3.0 1.7 -- --
Glasgow 17.7 5.0 -- -- -- 1.0 -- --
Humberside -- 3.7 -- -- -- -- -- --
Leeds Bradford 4.0 5.7 2.4 2.1 -- -- -- --
Liverpool -- 4.6 3.0 -- -- -- -- --
Manchester 17.0 9.5 10.0 5.0 7.5 2.8 1.7 1.7
Newcastle 5.4 4.8 2.5 2.6 -- -- -- --
Norwich -- 3.8 -- -- -- -- -- --
Nottingham EMA -- 1.7 1.8 1.7 -- -- -- --
Southampton -- 2.8 2.2 1.4 -- -- -- --
Total 78.3 71.2 46.6 21.1 18.3 9.5 4.1 2.7
Airports served 8 16 11 8 4 4 2 2
Page 5024 February 2005
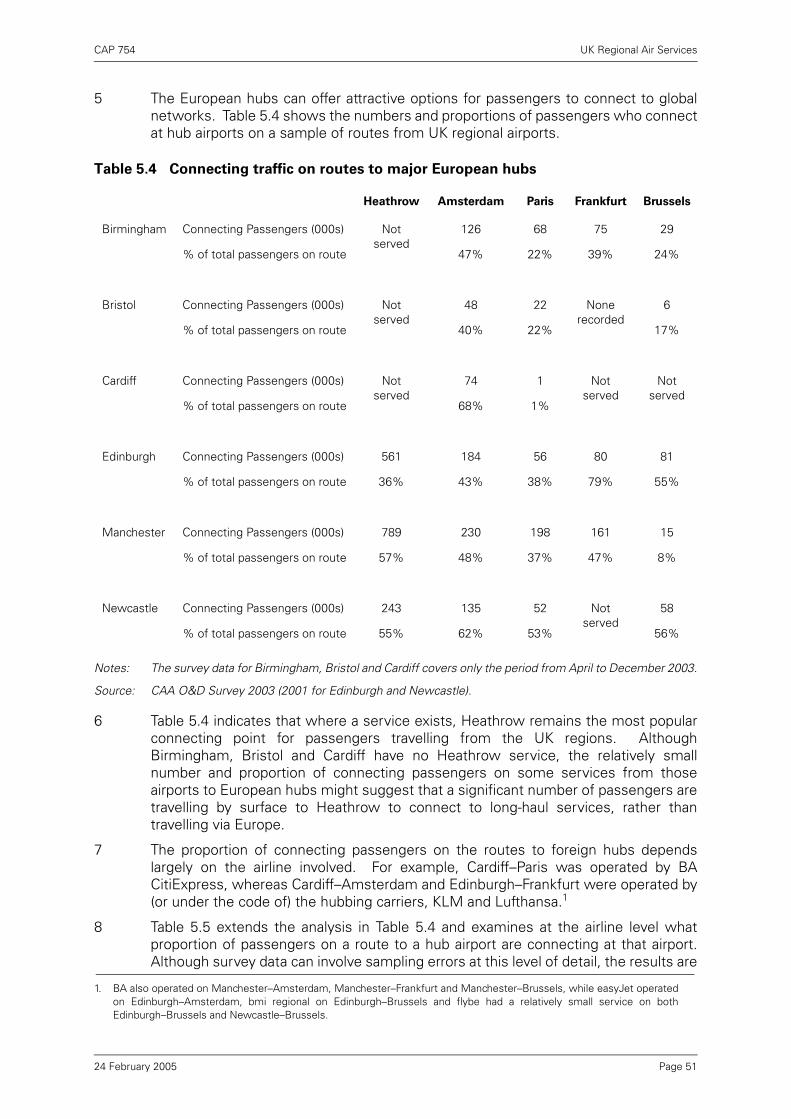
CAP 754 UK Regional Air Services
5 The European hubs can offer attractive options for passengers to connect to globalnetworks. Table 5.4 shows the numbers and proportions of passengers who connectat hub airports on a sample of routes from UK regional airports.
Notes: The survey data for Birmingham, Bristol and Cardiff covers only the period from April to December 2003.
Source: CAA O&D Survey 2003 (2001 for Edinburgh and Newcastle).
6 Table 5.4 indicates that where a service exists, Heathrow remains the most popularconnecting point for passengers travelling from the UK regions. AlthoughBirmingham, Bristol and Cardiff have no Heathrow service, the relatively smallnumber and proportion of connecting passengers on some services from thoseairports to European hubs might suggest that a significant number of passengers aretravelling by surface to Heathrow to connect to long-haul services, rather thantravelling via Europe.
7 The proportion of connecting passengers on the routes to foreign hubs dependslargely on the airline involved. For example, Cardiff–Paris was operated by BACitiExpress, whereas Cardiff–Amsterdam and Edinburgh–Frankfurt were operated by(or under the code of) the hubbing carriers, KLM and Lufthansa.1
8 Table 5.5 extends the analysis in Table 5.4 and examines at the airline level whatproportion of passengers on a route to a hub airport are connecting at that airport.Although survey data can involve sampling errors at this level of detail, the results are
Table 5.4 Connecting traffic on routes to major European hubs
Heathrow Amsterdam Paris Frankfurt Brussels
Birmingham Connecting Passengers (000s) Not served
126 68 75 29
% of total passengers on route 47% 22% 39% 24%
Bristol Connecting Passengers (000s) Not served
48 22 Nonerecorded
6
% of total passengers on route 40% 22% 17%
Cardiff Connecting Passengers (000s) Not served
74 1 Not served
Not served
% of total passengers on route 68% 1%
Edinburgh Connecting Passengers (000s) 561 184 56 80 81
% of total passengers on route 36% 43% 38% 79% 55%
Manchester Connecting Passengers (000s) 789 230 198 161 15
% of total passengers on route 57% 48% 37% 47% 8%
Newcastle Connecting Passengers (000s) 243 135 52 Not served
58
% of total passengers on route 55% 62% 53% 56%
1. BA also operated on Manchester–Amsterdam, Manchester–Frankfurt and Manchester–Brussels, while easyJet operatedon Edinburgh–Amsterdam, bmi regional on Edinburgh–Brussels and flybe had a relatively small service on bothEdinburgh–Brussels and Newcastle–Brussels.
Page 5124 February 2005

CAP 754 UK Regional Air Services
nevertheless quite revealing. Airlines best placed to provide the connectivity arethose that are based at the hub airports concerned. While other full-service airlineswill participate in the IATA multilateral interline system2 that gives the same access tothe global network, they are carrying relatively small amounts of such traffic. Airlinescompete aggressively for connecting passengers, particularly those travelling to long-haul destinations. As a general principle, airlines will offer lower fares where travel onboth connecting flights is on their services (or those of alliance partners) than they willwhere part of the journey (and therefore part of the revenue3) is lost to another airline(i.e. when a passenger is travelling on an interline ticket using the IATA system).
2. This system involves a commitment between airlines regarding the carriage of passengers on journeys involving morethan one airline. It includes travel on a single ticket, purchased in one transaction, with the ability to book flights throughtravel agents anywhere in the world through Global Distribution Systems (GDSs); the through checking of baggage; thecharging of “through fares”, and the shifting of fare revenue to and from interline partners by way of a clearing house andagreements on how to divide the revenue (proration).
3. Possibly a disproportionate amount, depending on the prorate agreement that divides the revenue on an interline ticketbetween the airlines.
Table 5.5 Proportion of connecting passengers on services to European hubs
– comparison of hub airlines with other airlines
% of passengers connecting at Amsterdam
Route Hub airline Other airlines
Birmingham KLM 52% MyTravel Lite ---
Bristol KLM 41% easyJet ---
Manchester KLM 58% BA 5%
Heathrow KLM 43% BA 1%, bmi 3%
London City KLM 38% n/a
Cardiff KLM 68% n/a
Liverpool n/a easyJet 1%
Nottingham EMA n/a bmibaby 10%
Gatwick n/a BA 4%, easyJet 0%
% of passengers connecting at Brussels
Route Hub airline Other airlines
Birmingham SN Brussels 25% flybe ---
Manchester SN Brussels 9% BA 8%
Bristol SN Brussels 17% n/a
Gatwick SN Brussels --- BA 3%
Nottingham EMA n/a bmi 4%, bmibaby 0%
Heathrow n/a BA and bmi both 2%
London City n/a VLM 2%
Page 5224 February 2005
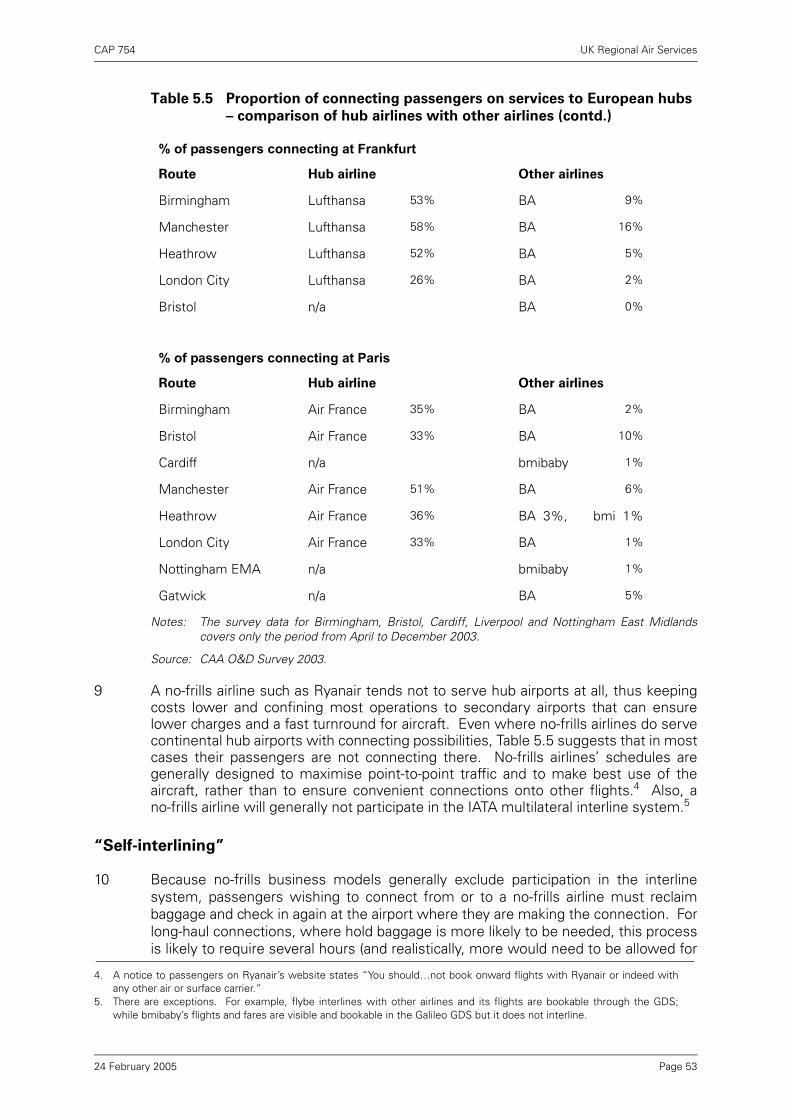
CAP 754 UK Regional Air Services
Notes: The survey data for Birmingham, Bristol, Cardiff, Liverpool and Nottingham East Midlandscovers only the period from April to December 2003.
Source: CAA O&D Survey 2003.
9 A no-frills airline such as Ryanair tends not to serve hub airports at all, thus keepingcosts lower and confining most operations to secondary airports that can ensurelower charges and a fast turnround for aircraft. Even where no-frills airlines do servecontinental hub airports with connecting possibilities, Table 5.5 suggests that in mostcases their passengers are not connecting there. No-frills airlines’ schedules aregenerally designed to maximise point-to-point traffic and to make best use of theaircraft, rather than to ensure convenient connections onto other flights.4 Also, ano-frills airline will generally not participate in the IATA multilateral interline system.5
“Self-interlining”
10 Because no-frills business models generally exclude participation in the interlinesystem, passengers wishing to connect from or to a no-frills airline must reclaimbaggage and check in again at the airport where they are making the connection. Forlong-haul connections, where hold baggage is more likely to be needed, this processis likely to require several hours (and realistically, more would need to be allowed for
Table 5.5 Proportion of connecting passengers on services to European hubs
– comparison of hub airlines with other airlines (contd.)
% of passengers connecting at Frankfurt
Route Hub airline Other airlines
Birmingham Lufthansa 53% BA 9%
Manchester Lufthansa 58% BA 16%
Heathrow Lufthansa 52% BA 5%
London City Lufthansa 26% BA 2%
Bristol n/a BA 0%
% of passengers connecting at Paris
Route Hub airline Other airlines
Birmingham Air France 35% BA 2%
Bristol Air France 33% BA 10%
Cardiff n/a bmibaby 1%
Manchester Air France 51% BA 6%
Heathrow Air France 36% BA 3%, bmi 1%
London City Air France 33% BA 1%
Nottingham EMA n/a bmibaby 1%
Gatwick n/a BA 5%
4. A notice to passengers on Ryanair’s website states “You should…not book onward flights with Ryanair or indeed withany other air or surface carrier.”
5. There are exceptions. For example, flybe interlines with other airlines and its flights are bookable through the GDS;while bmibaby’s flights and fares are visible and bookable in the Galileo GDS but it does not interline.
Page 5324 February 2005

CAP 754 UK Regional Air Services
in case the first flight was delayed), instead of the typical 45–75 minutes minimumconnecting time for an interline journey where passengers and baggage are checkedthrough at the point of origin. For short-haul connections it is more likely that thepassenger will have only carry-on baggage and, particularly at an airport such asStansted, which offers quite high frequencies to European destinations, the processmay be quicker and easier and so more feasible. Even so, “self-interlining”passengers will be travelling on tickets purchased separately for each sector, whichmeans that if the first flight is delayed and the connection missed, the first airline willtake no responsibility, and a non-refundable ticket on the second sector may beunusable.
11 The increased use of the internet to plan journeys and make bookings, and the generalawareness of the potential for low fares using no-frills airlines, means that passengersare generally more alive to constructing their own itinerary and the possibilities ofbuying two separate tickets if they need to.
12 Data on such interlining is difficult for the industry to obtain, because the separatetransactions for each sector on an itinerary constructed by the passenger can only bedetected by origin/destinations surveys, whereas a multi-sector journey bookedthrough a GDS will generate an automated record. Anecdotal evidence from airlinesand airports – and survey data – indicates that some “self-interlining” or “self-intralining” is taking place, at least at Luton or Stansted, where passengers areseeking out low fares and there is a relatively wide choice of destinations. Indeed,CAA survey data for 2003 shows that around 14% of passengers using Stanstedconnected to another flight there – a total of 2.5m passengers. Table 5.6 uses surveydata to analyse the proportion of passengers on regional routes to London that areusing London as a connecting point.
Page 5424 February 2005
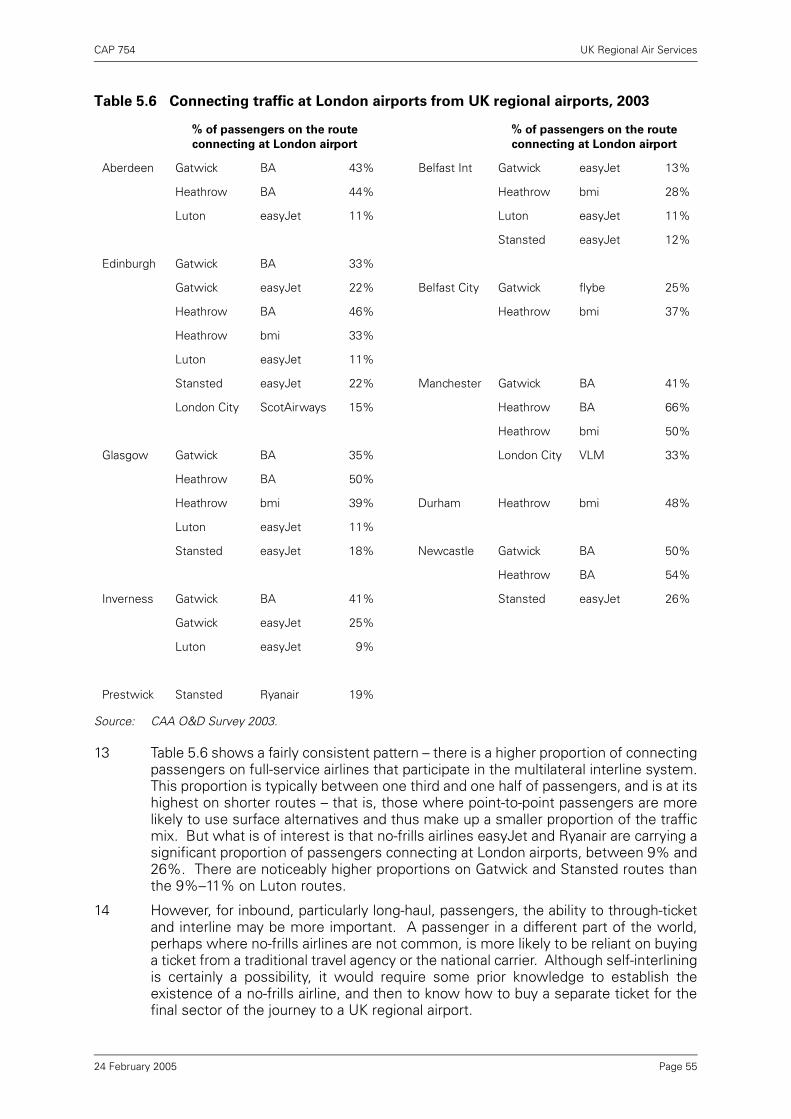
CAP 754 UK Regional Air Services
Source: CAA O&D Survey 2003.
13 Table 5.6 shows a fairly consistent pattern – there is a higher proportion of connectingpassengers on full-service airlines that participate in the multilateral interline system.This proportion is typically between one third and one half of passengers, and is at itshighest on shorter routes – that is, those where point-to-point passengers are morelikely to use surface alternatives and thus make up a smaller proportion of the trafficmix. But what is of interest is that no-frills airlines easyJet and Ryanair are carrying asignificant proportion of passengers connecting at London airports, between 9% and26%. There are noticeably higher proportions on Gatwick and Stansted routes thanthe 9%–11% on Luton routes.
14 However, for inbound, particularly long-haul, passengers, the ability to through-ticketand interline may be more important. A passenger in a different part of the world,perhaps where no-frills airlines are not common, is more likely to be reliant on buyinga ticket from a traditional travel agency or the national carrier. Although self-interliningis certainly a possibility, it would require some prior knowledge to establish theexistence of a no-frills airline, and then to know how to buy a separate ticket for thefinal sector of the journey to a UK regional airport.
Table 5.6 Connecting traffic at London airports from UK regional airports, 2003
% of passengers on the route
connecting at London airport
% of passengers on the route
connecting at London airport
Aberdeen Gatwick BA 43% Belfast Int Gatwick easyJet 13%
Heathrow BA 44% Heathrow bmi 28%
Luton easyJet 11% Luton easyJet 11%
Stansted easyJet 12%
Edinburgh Gatwick BA 33%
Gatwick easyJet 22% Belfast City Gatwick flybe 25%
Heathrow BA 46% Heathrow bmi 37%
Heathrow bmi 33%
Luton easyJet 11%
Stansted easyJet 22% Manchester Gatwick BA 41%
London City ScotAirways 15% Heathrow BA 66%
Heathrow bmi 50%
Glasgow Gatwick BA 35% London City VLM 33%
Heathrow BA 50%
Heathrow bmi 39% Durham Heathrow bmi 48%
Luton easyJet 11%
Stansted easyJet 18% Newcastle Gatwick BA 50%
Heathrow BA 54%
Inverness Gatwick BA 41% Stansted easyJet 26%
Gatwick easyJet 25%
Luton easyJet 9%
Prestwick Stansted Ryanair 19%
Page 5524 February 2005
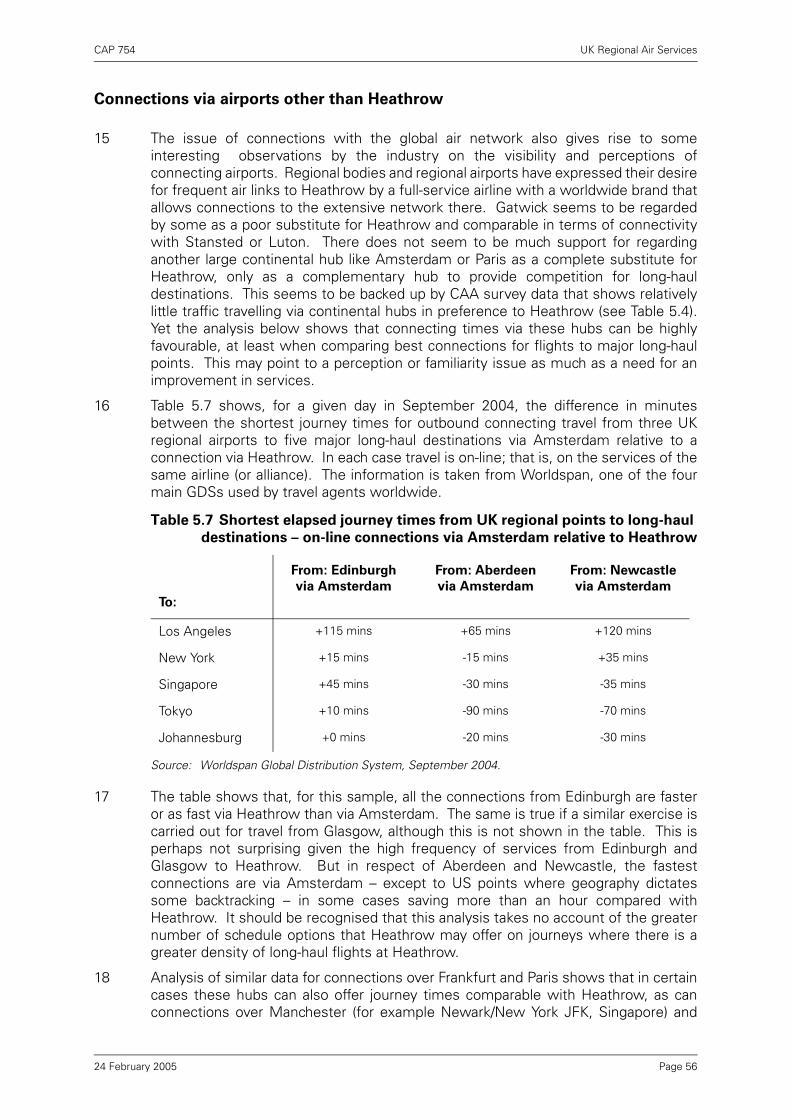
CAP 754 UK Regional Air Services
Connections via airports other than Heathrow
15 The issue of connections with the global air network also gives rise to someinteresting observations by the industry on the visibility and perceptions ofconnecting airports. Regional bodies and regional airports have expressed their desirefor frequent air links to Heathrow by a full-service airline with a worldwide brand thatallows connections to the extensive network there. Gatwick seems to be regardedby some as a poor substitute for Heathrow and comparable in terms of connectivitywith Stansted or Luton. There does not seem to be much support for regardinganother large continental hub like Amsterdam or Paris as a complete substitute forHeathrow, only as a complementary hub to provide competition for long-hauldestinations. This seems to be backed up by CAA survey data that shows relativelylittle traffic travelling via continental hubs in preference to Heathrow (see Table 5.4).Yet the analysis below shows that connecting times via these hubs can be highlyfavourable, at least when comparing best connections for flights to major long-haulpoints. This may point to a perception or familiarity issue as much as a need for animprovement in services.
16 Table 5.7 shows, for a given day in September 2004, the difference in minutesbetween the shortest journey times for outbound connecting travel from three UKregional airports to five major long-haul destinations via Amsterdam relative to aconnection via Heathrow. In each case travel is on-line; that is, on the services of thesame airline (or alliance). The information is taken from Worldspan, one of the fourmain GDSs used by travel agents worldwide.
Source: Worldspan Global Distribution System, September 2004.
17 The table shows that, for this sample, all the connections from Edinburgh are fasteror as fast via Heathrow than via Amsterdam. The same is true if a similar exercise iscarried out for travel from Glasgow, although this is not shown in the table. This isperhaps not surprising given the high frequency of services from Edinburgh andGlasgow to Heathrow. But in respect of Aberdeen and Newcastle, the fastestconnections are via Amsterdam – except to US points where geography dictatessome backtracking – in some cases saving more than an hour compared withHeathrow. It should be recognised that this analysis takes no account of the greaternumber of schedule options that Heathrow may offer on journeys where there is agreater density of long-haul flights at Heathrow.
18 Analysis of similar data for connections over Frankfurt and Paris shows that in certaincases these hubs can also offer journey times comparable with Heathrow, as canconnections over Manchester (for example Newark/New York JFK, Singapore) and
Table 5.7 Shortest elapsed journey times from UK regional points to long-haul
destinations – on-line connections via Amsterdam relative to Heathrow
To:
From: Edinburgh
via Amsterdam
From: Aberdeen
via Amsterdam
From: Newcastle
via Amsterdam
Los Angeles +115 mins +65 mins +120 mins
New York +15 mins -15 mins +35 mins
Singapore +45 mins -30 mins -35 mins
Tokyo +10 mins -90 mins -70 mins
Johannesburg +0 mins -20 mins -30 mins
Page 5624 February 2005

CAP 754 UK Regional Air Services
Birmingham (Newark). A detailed analysis of journey times from Edinburgh for a givenday in April 2004 showed that to Singapore the quickest journey was via Frankfurt, 50minutes quicker than via Heathrow, while a journey via Manchester was only 25minutes longer than the quickest connection via Heathrow. Repeating the analysisfor Los Angeles, Tokyo and Johannesburg, a connection via Frankfurt took 20–30minutes more than the quickest connection via Heathrow, and a connection via Paristook just over an hour more.
Summary
19 The growing role for regional airports, the increased density of services and greatervariety of available destinations should mean that the proportion of regionallyoriginating traffic relying on connections via London will reduce. Coupled with this,many regional airports, even those with no link to London, have retained services toan alternative hub such as Amsterdam. Therefore even where a direct service is notoffered, competitive connecting times to many destinations are possible without theneed to travel via London. These effects should go some way towards reducing(although not eliminating) the importance of Heathrow specifically, and Londongenerally, as a connecting point.
Page 5724 February 2005

Page 58
CAP 754 UK Regional Air Services
Chapter 6 Developments in regional services – the airline perspective
1 Earlier chapters have set out how regional services have expanded faster than Londonservices, not just in terms of the volume of passengers, but, importantly for theregions, also in terms of destinations served. Chapters 2 to 4 explained how thesechanges have impacted on services from regional airports to Europe and long-haulpoints, between regional airports, and from regional airports to London. The mostdramatic changes have occurred where no-frills airlines have entered the market onshort-haul scheduled routes, offering low fares with relatively few travel restrictions.This chapter discusses these developments in the short-haul market in more detail,from the airline perspective.
The changing structure of the regional airline market
2 Until the second half of the 1990s, the type of airlines offering services from UKregional airports conformed to a relatively stable pattern, which for the various typesof regional air services can broadly be summarised as: • domestic scheduled services to London – operated by larger network airlines like
BA and bmi as well as smaller regional airlines, primarily to Heathrow and Gatwick,serving the point-to-point market and also providing onward connections to theextensive networks from those airports;
• domestic scheduled services between UK regional airports – usually operatedeither by regional subsidiaries or franchises of the network airlines, or byindependent regional airlines, linking major UK population or business centres, orpoints with strong industry connections, or peripheral areas to the mainland viaoverwater routes;
• direct international scheduled services – operated by larger network airlines ortheir subsidiaries, these included some short-haul routes to prime businessdestinations from the bigger regional airports, airlines feeding traffic to continentalhubs such as Amsterdam for onward connecting flights, and some limited long-haul services;
• charter airlines contracted by tour operators for flights to popular, mainly short-haul, holiday destinations.
3 Since then, the pattern has changed as no-frills scheduled airlines, in particulareasyJet, Ryanair and flybe, have entered these short-haul markets – including somepreviously served by charter airlines – to such an extent that in terms of regional airservices they have, in less than a decade, become major players comparable in sizewith established airlines such as BA and bmi (albeit that the no-frills airlines do notserve Heathrow).
4 This change is illustrated in Table 6.1, which shows the relative sizes and networks ofairlines operating scheduled services from UK regional airports for the 12 monthsending August 2004.
5 The table is arranged in order of total scheduled passengers by airline or airline group,and by airport.1 It shows that the biggest operator at regional airports is easyJet with13.1m passengers arriving or departing at nine UK regional airports over the year. BAand BA CitiExpress together account for 10.9m and bmi, bmibaby and bmi regionalcollectively account for 8.5m. The next biggest are Ryanair (4.8m) and flybe (4.4m).These are followed by KLM and KLM Cityhopper (2.7m), which is by far the biggestoperator at UK regional airports without a significant UK base, serving 12 airports fromits Amsterdam hub compared with five served by Aer Lingus, four by Air France andthree by Lufthansa.
1. The table covers UK and Isle of Man airports reporting statistics, and therefore omits Channel Islands airports.
Page 5924 February 2005
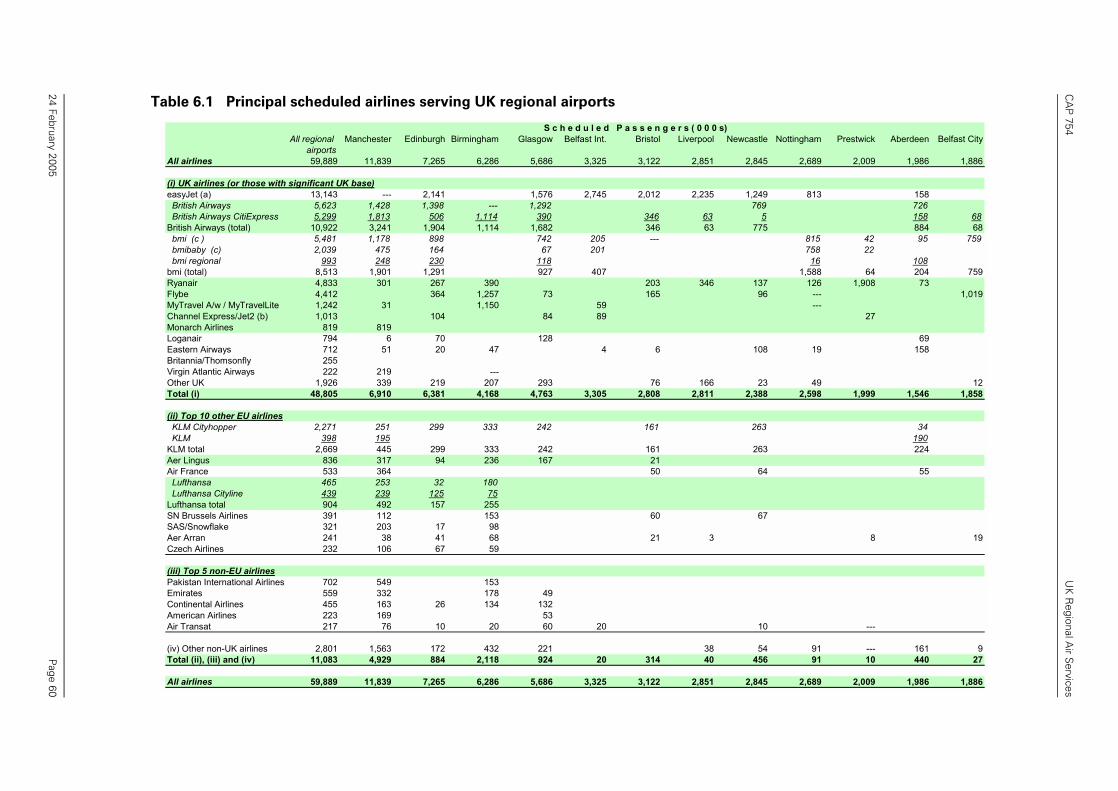
CA
P 754
UK
Regional A
ir Services
Page 60
0 s)l Newcastle Nottingham Prestwick Aberdeen Belfast City
1 2,845 2,689 2,009 1,986 1,886
5 1,249 813 158769 726
5 158 683 775 884 68
815 42 95 759758 22
16 1081,588 64 204 759
6 137 126 1,908 7396 --- 1,019
---27
69108 19 158
6 23 49 121 2,388 2,598 1,999 1,546 1,858
263 34190
263 224
64 55
67
3 8 19
10 ---
8 54 91 --- 161 90 456 91 10 440 27
1 2,845 2,689 2,009 1,986 1,886
24 February 2005
Table 6.1 Principal scheduled airlines serving UK regional airports
S c h e d u l e d P a s s e n g e r s ( 0 0All regional Manchester Edinburgh Birmingham Glasgow Belfast Int. Bristol Liverpoo
airportsAll airlines 59,889 11,839 7,265 6,286 5,686 3,325 3,122 2,85
(i) UK airlines (or those with significant UK base)easyJet (a) 13,143 --- 2,141 1,576 2,745 2,012 2,23 British Airways 5,623 1,428 1,398 --- 1,292 British Airways CitiExpress 5,299 1,813 506 1,114 390 346 63British Airways (total) 10,922 3,241 1,904 1,114 1,682 346 6 bmi (c ) 5,481 1,178 898 742 205 --- bmibaby (c) 2,039 475 164 67 201 bmi regional 993 248 230 118bmi (total) 8,513 1,901 1,291 927 407Ryanair 4,833 301 267 390 203 34Flybe 4,412 364 1,257 73 165MyTravel A/w / MyTravelLite 1,242 31 1,150 59Channel Express/Jet2 (b) 1,013 104 84 89Monarch Airlines 819 819Loganair 794 6 70 128Eastern Airways 712 51 20 47 4 6Britannia/Thomsonfly 255Virgin Atlantic Airways 222 219 ---Other UK 1,926 339 219 207 293 76 16Total (i) 48,805 6,910 6,381 4,168 4,763 3,305 2,808 2,81
(ii) Top 10 other EU airlines KLM Cityhopper 2,271 251 299 333 242 161 KLM 398 195KLM total 2,669 445 299 333 242 161Aer Lingus 836 317 94 236 167 21Air France 533 364 50 Lufthansa 465 253 32 180 Lufthansa Cityline 439 239 125 75Lufthansa total 904 492 157 255SN Brussels Airlines 391 112 153 60SAS/Snowflake 321 203 17 98Aer Arran 241 38 41 68 21Czech Airlines 232 106 67 59
(iii) Top 5 non-EU airlinesPakistan International Airlines 702 549 153Emirates 559 332 178 49Continental Airlines 455 163 26 134 132American Airlines 223 169 53Air Transat 217 76 10 20 60 20
(iv) Other non-UK airlines 2,801 1,563 172 432 221 3Total (ii), (iii) and (iv) 11,083 4,929 884 2,118 924 20 314 4
All airlines 59,889 11,839 7,265 6,286 5,686 3,325 3,122 2,85

CA
P 754
UK
Regional A
ir Services
Page 61
. (a) Excludes easyJet Switzerland. (b) Edinburgh/Glasgowits own Air Operator’s Certificate.nths to August 2004.
ry Norwich Other Other UK Isle of ManScotland (exc Scot.)
5 226 493 773 776
---53 36853 368
36 1736 17
4374 155
343 5168 6 27 36
5
72 112 1975 104 492 632 757
123 132
123 132
8 19
---123 140 19
5 226 493 773 776
24 February 2005
Notes: Passengers on domestic routes will be counted at both UK airports. --- indicates less than 2,500 passengers, to remove diversions, but these are included in the totalsflights were on behalf of FlyGlobespan. (c) bmi figures include bmibaby flights prior to it gaining
Source: CAA Airport Statistics for passengers on scheduled flights at UK reporting airports for the 12 mo
Table 6.1 Principal scheduled airlines serving UK regional airports (continued)
S c h e d u l e d P a s s e n g e r s ( 0 0 0 s)All regional Leeds Brad. So'hampton Cardiff Inverness Durham Bournem'th Exeter Covent
airportsAll airlines 59,889 1,681 1,394 951 542 457 298 256 25
(i) UK airlines (or those with significant UK base)easyJet (a) 13,143 4 208 --- --- British Airways 5,623 5 --- British Airways CitiExpress 5,299 263 150British Airways (total) 10,922 263 5 150 bmi (c ) 5,481 183 376 27 158 bmibaby (c) 2,039 268 84 bmi regional 993 220bmi (total) 8,513 403 644 27 243Ryanair 4,833 233 72 70 267Flybe 4,412 117 923 --- 236MyTravel A/w / MyTravelLite 1,242Channel Express/Jet2 (b) 1,013 708 ---Monarch Airlines 819Loganair 794 127Eastern Airways 712 51 65 24 20Britannia/Thomsonfly 255 25Virgin Atlantic Airways 222 ---Other UK airlines 1,926 69 56 3 27 6Total (i) 48,805 1,513 1,320 783 539 334 298 244 25
(ii) Top 10 other EU airlines KLM Cityhopper 2,271 168 157 123 KLM 398KLM total 2,669 168 157 123Aer Lingus 836Air France 533 Lufthansa 465 Lufthansa Cityline 439Lufthansa total 904SN Brussels Airlines 391SAS/Snowflake 321 3Aer Arran 241 16Czech Airlines 232
(iii) Top 5 non-EU airlinesPakistan International Airlines 702Emirates 559Continental Airlines 455American Airlines 223Air Transat 217 10 12
(iv) Other non-UK airlines 2,801 59Total (ii), (iii) and (iv) 11,083 168 74 168 3 123 12
All airlines 59,889 1,681 1,394 951 542 457 298 256 25
CAP 754 UK Regional Air Services
The advent of no-frills airlines
6 Liberalisation of the European market led directly to the emergence and developmentof no-frills airlines in the EU.2 In particular, easyJet and Ryanair began to developnetworks at Luton and Stansted in the mid to late 1990s. Of significance to this studyof regional air services is that easyJet’s first routes were between Luton andEdinburgh, Glasgow (1995) and Aberdeen (1996), while Ryanair began a Stansted–Prestwick service in 1995.3 Over time both have increased their services from UKregional airports.
7 Although business models vary between different no-frills airlines, the typical modelincludes a focus on minimising costs wherever possible. Standard characteristicsoften include:
• a fleet comprising a single aircraft type of Boeing 737 or A319/A320 size (i.e. in therange of 130–189 seats);
• high aircraft utilisation, including fast turnrounds; use of secondary airports at oneor both ends (in particular Ryanair, although easyJet developed its network initiallyfrom Luton and later Stansted before moving on to Gatwick);
• aircraft configured for maximum seating capacity with no premium class;
• high seat factors;
• high staff productivity;
• no explicit provision for passengers to connect between flights or interline withother airlines;
• low distribution costs through direct sales via the internet (or telesales) withouttickets, bookings through Global Distribution Systems, or travel agents;
• removing complex or restrictive fare rules, in particular the Saturday-nightminimum stay, with only one price per flight for sale at any given time;
• charging for snacks and drinks; and
• no bellyhold cargo.
8 There are variations; for example, flybe brands itself as a low-fares airline while usinga mixed fleet of smaller aircraft (including Dash 8 turboprops), interlining with full-service airlines, and allowing bookings through the GDSs by travel agents.
9 In 1998 BA launched a response to these developments in the shape of a no-frillsStansted-based subsidiary, Go, which was eventually purchased in 2002 by easyJet.The rapid change in the competitiveness of the market also led KLMuk and BritishEuropean to change their business models to a no-frills approach and re-brand asbuzz4 (in 2000), and flybe (in 2002) respectively.
10 The rapid spread of new routes and increased frequencies from London airports,including domestic routes, soon led to a further significant development. The focusfor new routes shifted from the London market to include services from regionalairports across the UK.5 As far back as 1997 easyJet had started an Amsterdamservice from Liverpool, which became a formal second base in 1999. Go’s second
2. A more detailed history of developments in the liberalised market, including the entry of no-frills airlines, appears in “TheSingle European Aviation Market: The First Five Years” (CAP685), CAA, June 1998. See www.caa.co.uk/default.aspx?categoryid=5&pagetype=90&pageid=2748#cap685 for further information.
3. Ryanair was the first no-frills airline to appear in Europe, when it restructured its existing operations in 1991. Its mainfocus was Ireland–UK routes, including many regional routes, but in 1995 it began its first UK domestic route fromStansted to Prestwick and moved on to routes from the UK to continental Europe.
4. buzz was purchased by Ryanair in 2003.5. In the case of easyJet and Ryanair, this included developing services from European bases outside the UK.
Page 6224 February 2005
CAP 754 UK Regional Air Services
base was Bristol, in 2001, followed by Nottingham East Midlands in 2002, both stillmaintained by easyJet. In addition, easyJet now has aircraft based at Belfast,Edinburgh, Glasgow and Newcastle. In 2002 bmi set up a no-frills subsidiary,bmibaby, based at Nottingham East Midlands; it added a second base later that yearat Cardiff, and further bases at Manchester and Durham Tees Valley in 2003.Jet2.com began operations from Leeds Bradford in 2003 and Manchester in 2004;Flyglobespan started a series of routes from Edinburgh and Glasgow in 2003; andEUJet began services from Kent International (Manston) in 2004. Details of flybe’sexpansion at various regional airports appear in Case study 5.
11 In addition, there has been a gradual shift by charter airlines such as MyTravel,Thomson and Monarch into scheduled services in response to the entry of no-frillsairlines. MyTravel set up MyTravelLite as a scheduled operation at Birmingham.Thomson now has a scheduled subsidiary Thomsonfly which began operations fromCoventry in 2004, and in 2005 will inaugurate flights from Bournemouth andDoncaster Sheffield. Half of Monarch’s business is now scheduled, which grew by30% in 2004. It plans similar growth in 2005 adding to its existing seven scheduledroutes from Manchester to Spain, Portugal and the Canaries, including a Manchester–Madrid service and a new base at Birmingham. Monarch is now the sole scheduledoperator on Manchester–Barcelona following the withdrawal of Iberia and bmibaby.6
Finally, there are various EU airlines not based in the UK that have begun no-frillsservices to UK regional airports, although on a relatively small scale so far.
6. Monarch press release, 15 December 2004. See also Figure 7.1 in Chapter 7.
Case study 4: Jet2.com
Jet2.com is a trading name of Channel Express (Air Services) Ltd, which has been asubstantial air freight operator for more than 25 years. Channel Express began passengercharters in 2001, primarily in the corporate and specialist market. It is a wholly ownedsubsidiary of Dart Group plc, an aviation services and distribution group.
Jet2.com commenced operations from Leeds Bradford in February 2003 with a dailyAmsterdam scheduled service. During 2003 it operated scheduled flights using Boeing 737-300 aircraft to seven European business, city break and sun destinations, carrying more than360,000 passengers. In 2004/05 it is serving 14 destinations from Leeds Bradford usingnine aircraft: Alicante, Amsterdam, Barcelona, Belfast, Faro, Geneva, Ibiza, Malaga, Murcia,Nice, Palma, Paris, Prague and Venice. In 2005 it will also be operating services from BelfastInternational to Barcelona, Bournemouth, Cork and Prague as well as Leeds Bradford. Theairline has now carried more than 1m passengers. In September 2004 Jet2.com announceda second base at Manchester. Daily flights to Alicante, Amsterdam, Budapest, Faro,Geneva, Pisa, Malaga, Murcia, Nice, Venice and Valencia are being added progressivelybetween December 2004 and May 2005. Additionally, two domestic routes fromManchester to Edinburgh and Gatwick (both three daily) begin in early 2005. 98% of seatsare currently booked on-line.
Source: Jet2.com website
Page 6324 February 2005

CAP 754 UK Regional Air Services
Case study 5: flybe
By the end of 2004, flybe had aircraft based at Belfast City (serving around 13 destinations),Birmingham (9), Bristol (3), Exeter (9), Southampton (13) and the Channel Islands (13), withnew bases announced at Leeds Bradford (3 destinations), Liverpool (6) and Norwich (4), and31 new routes planned for 2005. In total, flybe serves around 25 international destinations(mostly France, Spain and Ireland plus ski routes) and 17 domestic.
In 2003 flybe ordered 17 Dash 8-Q400 turboprops and followed this in January 2005 withan order for a further 20. These aircraft will be introduced to the fleet progressively until2009, making flybe the largest operator of the type (with 41). These aircraft have 78 seats.Despite the cost issues associated with a multi-type fleet, it also operates larger BAe146jets, which will be replaced in time, and the airline has recently started this process withplans to use Boeing 737-300 aircraft for summer 2005 on its longer routes out ofBirmingham. Flybe operated 29 aircraft at the end of 2004 and expects to carry 4.5mpassengers in 2004/05.
The Q400 climbs quickly, and on short sectors of less than 90 minutes this negates itsslower cruising speed giving a block time similar to that of a 737, and with a seat cost onlyslightly higher. The aircraft can nevertheless also be used economically on relatively longsectors, such as to the South of France. flybe sees the smaller capacity as an advantage,allowing it to offer more frequent services, which translates to a better business/leisuretraffic mix and a consequent yield benefit.
Originally Jersey European Airways, and then British European, the airline renamed itselfflybe in mid-2002 as it sought to compete with no-frills airlines on routes like Gatwick–Belfast. In the last five years flybe has therefore seen significant change, mostly driven bya focus on reducing costs. flybe has sought to rationalise its aircraft fleet, moving awayfrom smaller 30-seat turboprops, driving the unit cost downwards, and also to optimise itsnetwork by quickly shifting capacity away from under-performing routes to those withbetter prospects. Catering costs are now offset by charging passengers for in-flightcatering. It changed its ticketing and pricing to mirror other no-frills airlines, including a no-refund policy and a massive shift to on-line sales (from 6% to 80% in 18 months) with aconsequent reduction in distribution costs. The customer still has a choice of how andwhere to buy a ticket, as flybe continues to use travel agents, although it has reducedcommission rates to 1% and the agent now levies a service charge.
flybe continues to participate in the IATA multilateral interline and proration agreementswith other airlines, despite these elements usually being excluded from the typical no-frillsbusiness model. Its services and fares are fully bookable through Global DistributionSystems (GDSs), which means that they will be visible to any travel agent worldwiderequesting an itinerary involving a regional airport served by flybe. As a long-standingregional airline before its restructuring in 2002, flybe already had all the systems capabilityto handle the added complexity, and it believes that the additional running cost incurred iscovered by the incremental revenue provided by interline bookings. The charges levied foreach booking by the GDS, which have been much criticised by airlines in the past, have nowbeen restructured, and to some extent the costs can now be shared between the airline,agents and passengers.
Source: flybe website and CAA discussions with the airline
Page 6424 February 2005
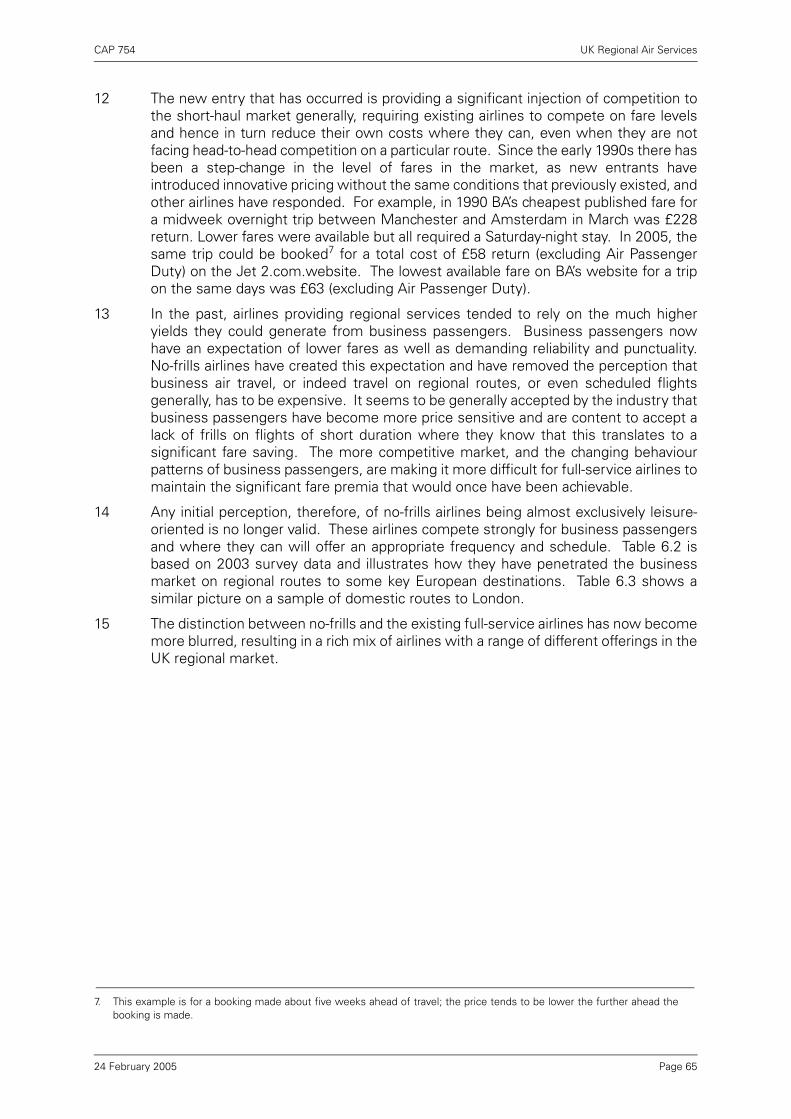
CAP 754 UK Regional Air Services
12 The new entry that has occurred is providing a significant injection of competition tothe short-haul market generally, requiring existing airlines to compete on fare levelsand hence in turn reduce their own costs where they can, even when they are notfacing head-to-head competition on a particular route. Since the early 1990s there hasbeen a step-change in the level of fares in the market, as new entrants haveintroduced innovative pricing without the same conditions that previously existed, andother airlines have responded. For example, in 1990 BA’s cheapest published fare fora midweek overnight trip between Manchester and Amsterdam in March was £228return. Lower fares were available but all required a Saturday-night stay. In 2005, thesame trip could be booked7 for a total cost of £58 return (excluding Air PassengerDuty) on the Jet 2.com.website. The lowest available fare on BA’s website for a tripon the same days was £63 (excluding Air Passenger Duty).
13 In the past, airlines providing regional services tended to rely on the much higheryields they could generate from business passengers. Business passengers nowhave an expectation of lower fares as well as demanding reliability and punctuality.No-frills airlines have created this expectation and have removed the perception thatbusiness air travel, or indeed travel on regional routes, or even scheduled flightsgenerally, has to be expensive. It seems to be generally accepted by the industry thatbusiness passengers have become more price sensitive and are content to accept alack of frills on flights of short duration where they know that this translates to asignificant fare saving. The more competitive market, and the changing behaviourpatterns of business passengers, are making it more difficult for full-service airlines tomaintain the significant fare premia that would once have been achievable.
14 Any initial perception, therefore, of no-frills airlines being almost exclusively leisure-oriented is no longer valid. These airlines compete strongly for business passengersand where they can will offer an appropriate frequency and schedule. Table 6.2 isbased on 2003 survey data and illustrates how they have penetrated the businessmarket on regional routes to some key European destinations. Table 6.3 shows asimilar picture on a sample of domestic routes to London.
15 The distinction between no-frills and the existing full-service airlines has now becomemore blurred, resulting in a rich mix of airlines with a range of different offerings in theUK regional market.
7. This example is for a booking made about five weeks ahead of travel; the price tends to be lower the further ahead thebooking is made.
Page 6524 February 2005
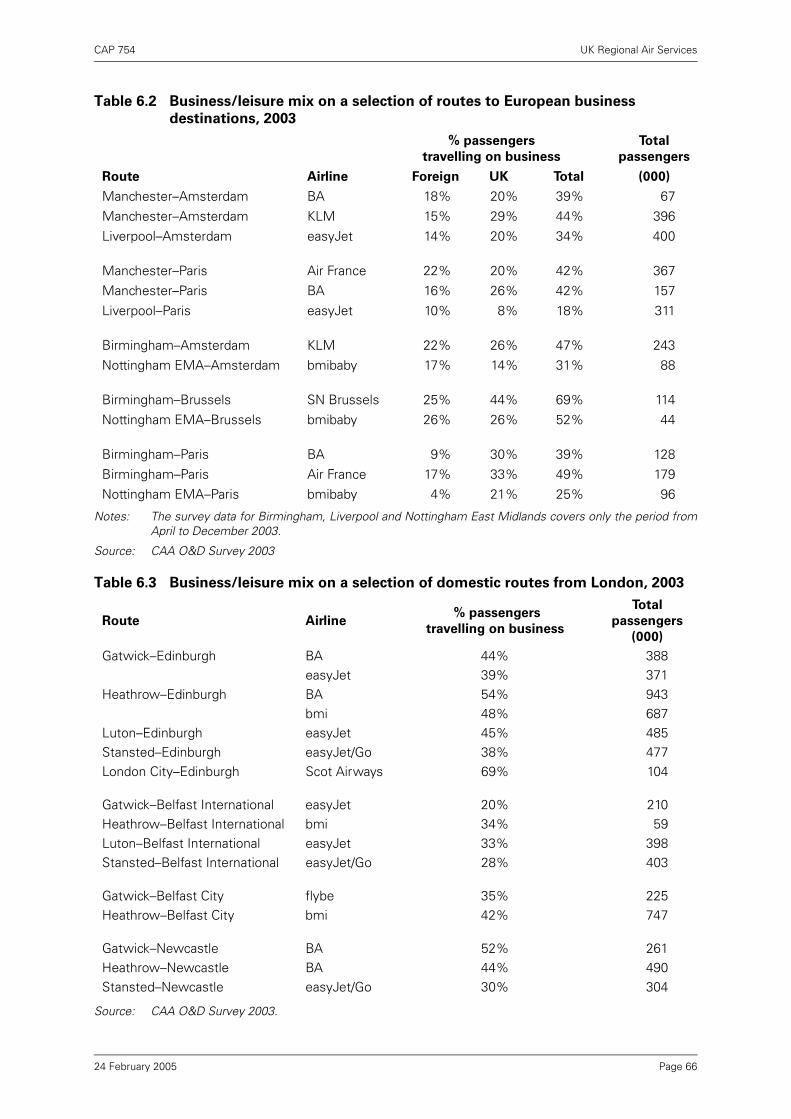
CAP 754 UK Regional Air Services
Notes: The survey data for Birmingham, Liverpool and Nottingham East Midlands covers only the period fromApril to December 2003.
Source: CAA O&D Survey 2003
Source: CAA O&D Survey 2003.
Table 6.2 Business/leisure mix on a selection of routes to European business
destinations, 2003
% passengers
travelling on business
Total
passengers
Route Airline Foreign UK Total (000)
Manchester–Amsterdam BA 18% 20% 39% 67Manchester–Amsterdam KLM 15% 29% 44% 396Liverpool–Amsterdam easyJet 14% 20% 34% 400
Manchester–Paris Air France 22% 20% 42% 367Manchester–Paris BA 16% 26% 42% 157
Liverpool–Paris easyJet 10% 8% 18% 311
Birmingham–Amsterdam KLM 22% 26% 47% 243Nottingham EMA–Amsterdam bmibaby 17% 14% 31% 88
Birmingham–Brussels SN Brussels 25% 44% 69% 114Nottingham EMA–Brussels bmibaby 26% 26% 52% 44
Birmingham–Paris BA 9% 30% 39% 128Birmingham–Paris Air France 17% 33% 49% 179Nottingham EMA–Paris bmibaby 4% 21% 25% 96
Table 6.3 Business/leisure mix on a selection of domestic routes from London, 2003
Route Airline % passengers
travelling on business
Total
passengers
(000)
Gatwick–Edinburgh BA 44% 388easyJet 39% 371
Heathrow–Edinburgh BA 54% 943bmi 48% 687
Luton–Edinburgh easyJet 45% 485Stansted–Edinburgh easyJet/Go 38% 477London City–Edinburgh Scot Airways 69% 104
Gatwick–Belfast International easyJet 20% 210Heathrow–Belfast International bmi 34% 59Luton–Belfast International easyJet 33% 398Stansted–Belfast International easyJet/Go 28% 403
Gatwick–Belfast City flybe 35% 225Heathrow–Belfast City bmi 42% 747
Gatwick–Newcastle BA 52% 261Heathrow–Newcastle BA 44% 490Stansted–Newcastle easyJet/Go 30% 304
Page 6624 February 2005

CAP 754 UK Regional Air Services
Impact of no-frills airlines on growth at UK regional airports
16 The following paragraphs examine how no-frills airlines (taking advantage of EUliberalisation) seem to have become the main driver behind the very strong recentgrowth in regional services. This is not the sole factor behind this phenomenon: therehave simultaneously been changes in the nature of regional airports themselves,which have developed a more commercial outlook and sought to increase their routeportfolio, thereby enabling airlines to play one airport off against another in order tosecure the best deal to place new capacity. This is analysed in more detail in the nextchapter. However, it is undeniable that the advent of no-frills has changed the face ofUK regional air services.
17 The specific focus on low fares and low costs that no-frills airlines have brought intothe short-haul market has had a very important effect on regional air services. Itmeans that a relatively “thin” route that was previously unviable may now be viable.For example, a low-frequency service may have been relatively expensive to market,but advertised and sold via the internet, and therefore free of the sales anddistribution costs that would once have been a necessity, might now be viable.
Case study 6: BA’s “Future Size and Shape” restructuring
In February 2002 BA announced its “Future Size and Shape” proposals. This was a majorexercise for BA, covering many elements of its business, but of most relevance to this studywas the restructuring of its short-haul services designed to reverse the airline’s decline inprofitability and to provide a competitive response to the no-frills airlines. The plans includedincreasing capacity and services on key business routes; simplifying the fleet and reducingthe number of aircraft types based at regional airports; better aircraft utilization and bettermatching of aircraft size to local markets; the withdrawal of loss-making services; andsimplifying both the pricing structure and internet booking.
BA CitiExpress was formed on 31 March 2002 as a wholly owned subsidiary of BA,consolidating the regional operations by British Airways Regional (based in Birmingham andManchester), Brymon Airways (Bristol) and former franchisees British Regional AirlinesGroup and Manx Airlines. Its primary focus is on carrying point-to-point passengers inbusiness markets, and it operates only two routes to London, from Inverness and Isle ofMan, apart from its London City services, which commenced in 2003.
As it restructured, BA CitiExpress rationalized its network, suspending services on morethan 30 routes between May 2002 and March 2003, and withdrawing completely fromCardiff and Leeds Bradford; it now serves 13 UK airports. Meanwhile, it has expanded itsservices to Europe, and now operates 63 routes, mainly from Manchester, Birmingham,Bristol and Edinburgh. It has reduced its fleet by a third to around 60 aircraft, and thenumber of regional aircraft types it operates from nine to four (mostly Embraer 145s andAvro RJ100s, plus Dash 8 turboprops). 12 Jetstream 41 aircraft were sub-leased to EasternAirways, which took over seven ex-BA routes, including three from Leeds Bradford. BACitiExpress claims the integration and restructuring has brought unit costs down by 30%.
Source: BA News, BA press releases, BA website, Air Transport World September 2004 and CAA discussionswith BA CitiExpress.
Page 6724 February 2005
CAP 754 UK Regional Air Services
18 By stimulating demand and eliminating unnecessary complexity and cost whereverpossible, no-frills airlines have managed to sustain services on a range of routes thathad never been contemplated in the past. Therefore, alongside new routes to Europesuch as Leeds Bradford–Prague, there are also routes to London (such as Blackpool–Stansted) and between regional points (such as Exeter–Newcastle). The potentialtraffic on such new routes would be unlikely to have been revealed in any past airpassenger survey data.
19 The new services have brought a range of destinations, for example from UK regionalairports to other UK destinations; to European capital cities; to holiday destinations;and to other EU regions (perhaps mostly in France) for second-home owners. Thefast, direct connections created draw existing traffic from roads and ferries,encourage people to invest in second homes abroad, and allow them to travel morefrequently than they might have done previously. Low-fare services from a localairport seem to be changing consumers’ perceptions about flying generally andconsequently are having an effect on travel patterns. As well as second homes, theseservices may encourage people to apply for jobs abroad, or may facilitate working farfrom home; and they may be used for more frequent visits to friends and relatives, formore affordable and frequent weekend breaks, by students returning home atweekends; and so on.
20 No-frills airlines tend not to fly very long sectors. Outside a certain radius, the greaterstage lengths mean that the aircraft is unable to perform as many daily rotations. Inconsequence, if the yield does not rise in line with distance because there is a limitto what the more price-sensitive leisure passenger is prepared to pay, then therevenue that aircraft can earn will fall, and it becomes less commercially attractive touse the aircraft on longer routes. UK no-frills airlines offer two routes to Greece, bothfrom London, and none to Turkey. Charter airlines, recognising these constraints, andunder pressure from no-frills airlines on traditional southern Europe routes, areadapting their operations so as to remain more competitive with the changes in thescheduled market, or are moving into medium-haul (Eastern Mediterranean) or long-haul markets. For example, the proportion of First Choice Holidays’ business that wasshort-haul has changed from 60% in 2000 to 40% in 2004, with 25% estimated for2008.8 No-frills airlines have tended to stick to routes within the European EconomicArea, where traffic rights are not subject to government-imposed restrictions onnationality, market entry, frequency, capacity or prices. These restrictions can impactsignificantly outside the EEA, which means that EU enlargement, and therefore anexpanded single aviation market, may begin to open up new opportunities tocountries such as the Czech Republic and Poland.
Regional jets
21 In the second half of the 1990s there has been a trend towards the use of regionaljets by full-service airlines in place of turboprops on thinner business routes (see CaseStudy 7). This is a technological development that would probably have occurredanyway irrespective of the change in competitive circumstances, but which may havechanged the viability of some services.
8. Source: First Choice Holidays website, October 2004. See also Table 2.7 in Chapter 2.
Page 6824 February 2005

CAP 754 UK Regional Air Services
Airline competition
22 There are some routes where regional airlines such as BA CitiExpress and bmiregional, or hub-feeding airlines such as Air France/KLM, are competing head-to-headwith no-frills airlines like easyJet or Jet2.com. Table 6.4 shows some examples, withthe relative frequency and aircraft types used.9 These are slightly different marketsto, say, Edinburgh–London. The traditional full-service airlines are more likely to offera frequency that gives business passengers as a minimum morning and eveningtimings that allow a full day’s business at the destination without the need for anovernight stop – or a schedule that provides good connections to a continental hub.They may be more prepared to station an aircraft overnight away from base, incurringadditional costs, in order to allow an early morning departure convenient for thebusiness market. The table shows that, on some routes, no-frills airlines’ schedulesare less convenient for business passengers and less frequent. Most flights are withaircraft of 150 seats or more, which may be too big to use more than once a day on asingle route. On other routes the no-frills airlines appear to be seeking to capturesome of the business market with a morning and evening departure. The challengefor the full-service airline in dedicating a smaller aircraft to a more frequent service ishow to use the aircraft in the off-peak period during the day or at weekends – whetherto operate additional frequencies on the same route, which may have poor loads oryields, or to use the aircraft to a different, more leisure-oriented, destination.
Case study 7: Regional jets
Unlike no-frills airlines, which have tended to standardise their fleet on one aircraft type,traditional full-service airlines use a variety of aircraft types depending on their network. Onthinner regional routes that require a frequency attractive to the business market, and whichwould not sustain aircraft with the capacity of a Boeing 737 or A319, such airlines may userelatively small aircraft, which are sometimes operated by a regional subsidiary or by anindependent airline under a franchise agreement. One trend during the second half of the1990s has been for such airlines to switch some routes from turboprops to small regionaljets with around 50 seats. Previously the smallest jets were 70 seats or more. The 49-seatEmbraer 145 is operated by both BA CitiExpress and bmi regional, the latter also operatingthe smaller Embraer 135 regional jet. The 50 to 90-seat Bombardier/Canadair RJ series, nolonger operated by UK airlines, is used by other European airlines feeding their hubs fromUK regional points. Regional jets have brought greater range, speed and comfort, allowingthinner business-oriented routes to be operated over longer distances and giving airlines theability to widen their coverage of services to secondary cities. Despite their size theseaircraft are equipped with complete galley facilities allowing a full catering service with hotmeals.
The first generation of regional jets give around a 2½ hour flying time capability – at the limitof their range they can operate a route such as Manchester–Warsaw. The secondgeneration Embraer 170 and 190 regional jets now being delivered have a capacity of around70-100 seats with an even longer range. This greater capability is likely to take the conceptof the regional jet even further and should improve the links between regional cities acrossEurope.
flybe and Air Southwest in the UK have adapted the no-frills model to smaller regionalaircraft, including turboprops (see separate case studies), and in the USA JetBlue hasdeparted from the no-frills single-type model with an order for 100-seat Embraer 190s (to bedelivered from 2005) to operate on "mid-sized" routes alongside its 156-seat Airbus A320s.
Source: airline and manufacturer websites and CAA discussions with UK airlines
9. See also Figure 3.3 in Chapter 3 in respect of Bristol–Edinburgh.
Page 6924 February 2005
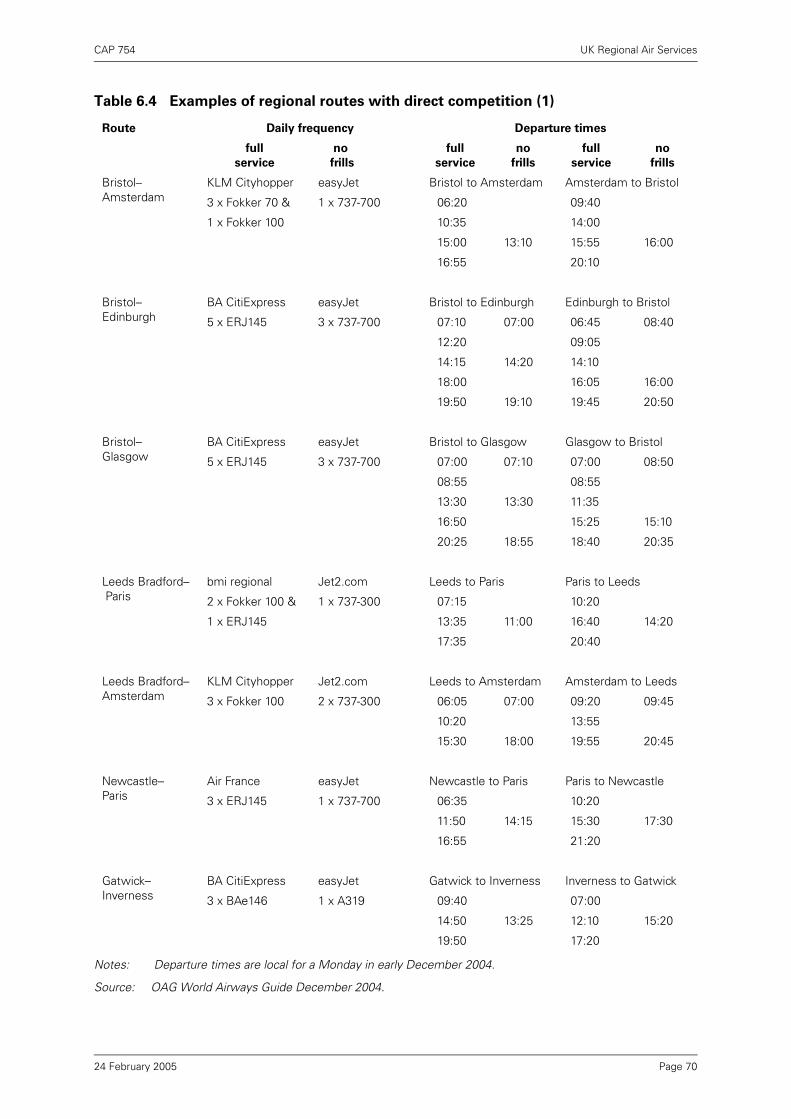
CAP 754 UK Regional Air Services
Notes: Departure times are local for a Monday in early December 2004.
Source: OAG World Airways Guide December 2004.
Table 6.4 Examples of regional routes with direct competition (1)
Route Daily frequency Departure times
full
service
no
frills
full
service
no
frills
full
service
no
frills
Bristol–Amsterdam
KLM Cityhopper easyJet Bristol to Amsterdam Amsterdam to Bristol
3 x Fokker 70 & 1 x 737-700 06:20 09:40
1 x Fokker 100 10:35 14:00
15:00 13:10 15:55 16:00
16:55 20:10
Bristol–Edinburgh
BA CitiExpress easyJet Bristol to Edinburgh Edinburgh to Bristol
5 x ERJ145 3 x 737-700 07:10 07:00 06:45 08:40
12:20 09:05
14:15 14:20 14:10
18:00 16:05 16:00
19:50 19:10 19:45 20:50
Bristol–Glasgow
BA CitiExpress easyJet Bristol to Glasgow Glasgow to Bristol
5 x ERJ145 3 x 737-700 07:00 07:10 07:00 08:50
08:55 08:55
13:30 13:30 11:35
16:50 15:25 15:10
20:25 18:55 18:40 20:35
Leeds Bradford– Paris
bmi regional Jet2.com Leeds to Paris Paris to Leeds
2 x Fokker 100 & 1 x 737-300 07:15 10:20
1 x ERJ145 13:35 11:00 16:40 14:20
17:35 20:40
Leeds Bradford–Amsterdam
KLM Cityhopper Jet2.com Leeds to Amsterdam Amsterdam to Leeds
3 x Fokker 100 2 x 737-300 06:05 07:00 09:20 09:45
10:20 13:55
15:30 18:00 19:55 20:45
Newcastle–Paris
Air France easyJet Newcastle to Paris Paris to Newcastle
3 x ERJ145 1 x 737-700 06:35 10:20
11:50 14:15 15:30 17:30
16:55 21:20
Gatwick–Inverness
BA CitiExpress easyJet Gatwick to Inverness Inverness to Gatwick
3 x BAe146 1 x A319 09:40 07:00
14:50 13:25 12:10 15:20
19:50 17:20
Page 7024 February 2005

CAP 754 UK Regional Air Services
23 Further examples of head-to-head competition are shown in Table 6.5. In theseexamples, BA CitiExpress uses mostly jets in competition with turboprops flown byflybe and ScotAirways. On the Birmingham routes, BA generally operates largeraircraft (110-seat RJ100s) than flybe (78-seat Dash 8s), while from Southampton itoperates smaller aircraft (50-seat Embraer 145s); both airlines operate broadly similarfrequencies.
Page 7124 February 2005
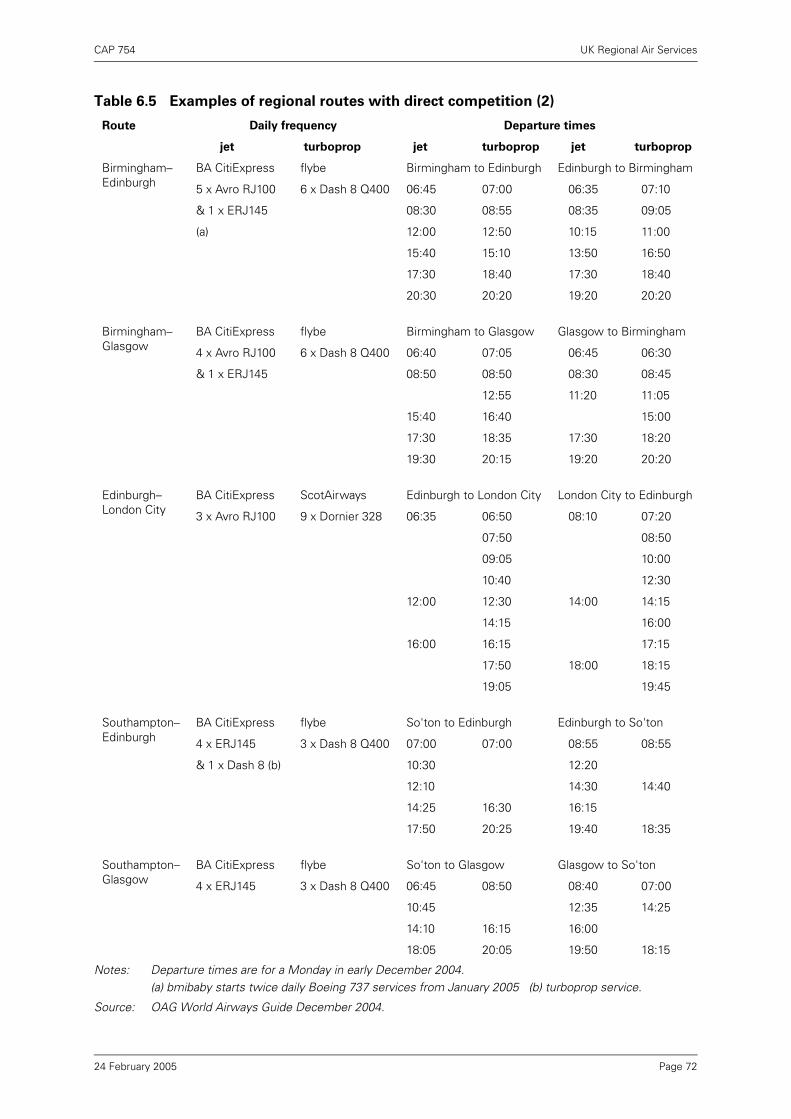
CAP 754 UK Regional Air Services
Notes: Departure times are for a Monday in early December 2004.(a) bmibaby starts twice daily Boeing 737 services from January 2005 (b) turboprop service.
Source: OAG World Airways Guide December 2004.
Table 6.5 Examples of regional routes with direct competition (2)
Route Daily frequency Departure times
jet turboprop jet turboprop jet turboprop
Birmingham–Edinburgh
BA CitiExpress flybe Birmingham to Edinburgh Edinburgh to Birmingham
5 x Avro RJ100 6 x Dash 8 Q400 06:45 07:00 06:35 07:10
& 1 x ERJ145 08:30 08:55 08:35 09:05
(a) 12:00 12:50 10:15 11:00
15:40 15:10 13:50 16:50
17:30 18:40 17:30 18:40
20:30 20:20 19:20 20:20
Birmingham–Glasgow
BA CitiExpress flybe Birmingham to Glasgow Glasgow to Birmingham
4 x Avro RJ100 6 x Dash 8 Q400 06:40 07:05 06:45 06:30
& 1 x ERJ145 08:50 08:50 08:30 08:45
12:55 11:20 11:05
15:40 16:40 15:00
17:30 18:35 17:30 18:20
19:30 20:15 19:20 20:20
Edinburgh–London City
BA CitiExpress ScotAirways Edinburgh to London City London City to Edinburgh
3 x Avro RJ100 9 x Dornier 328 06:35 06:50 08:10 07:20
07:50 08:50
09:05 10:00
10:40 12:30
12:00 12:30 14:00 14:15
14:15 16:00
16:00 16:15 17:15
17:50 18:00 18:15
19:05 19:45
Southampton–Edinburgh
BA CitiExpress flybe So'ton to Edinburgh Edinburgh to So'ton
4 x ERJ145 3 x Dash 8 Q400 07:00 07:00 08:55 08:55
& 1 x Dash 8 (b) 10:30 12:20
12:10 14:30 14:40
14:25 16:30 16:15
17:50 20:25 19:40 18:35
Southampton–Glasgow
BA CitiExpress flybe So'ton to Glasgow Glasgow to So'ton
4 x ERJ145 3 x Dash 8 Q400 06:45 08:50 08:40 07:00
10:45 12:35 14:25
14:10 16:15 16:00
18:05 20:05 19:50 18:15
Page 7224 February 2005
CAP 754 UK Regional Air Services
24 Table 6.5 also shows how ScotAirways competes on frequency on Edinburgh–LondonCity using 31-seat Dornier 328 turboprops. Services from London City and BelfastCity airports have a particular niche role that allows them to co-exist with otherairlines, including no-frills airlines, serving the same destinations from other Londonairports or from Belfast International. 90 minutes flying time has generally beenregarded as the threshold for the effective use of turboprops. The success of VLMAirlines’ Fokker 50 turboprop services from London City to both Manchester (currentlyten per day, with a half-hourly frequency in the morning peak) and Liverpool (currentlyfive per day) has in turn attracted bmi to start a new Leeds–London City route usingan ATR42 turboprop (its Embraer 145 regional jets are not cleared to operate intoLondon City).
25 flybe and easyJet compete on parallel Belfast routes to Bristol, Edinburgh, Glasgowand Newcastle – flybe with the Dash 8 turboprop from Belfast City and easyJet fromBelfast International.10 A further example is BA CitiExpress’ Dash 8 service fromBelfast City to Manchester in competition with bmibaby’s no-frills service from BelfastInternational (and easyJet’s frequent service to Liverpool – see Table 3.3 in Chapter 3).These examples seem to illustrate that a turboprop aircraft can be competitive wherethere are frequent, short sectors to/from a city centre airport, perhaps seeking tomake the product particularly attractive to the business market.
26 As noted in the next chapter, in terms of the richness of the network from each airport,there is still a potentially important role for the more traditional full-service airlines inmeeting particular market needs. For example, a full-service airline feeding its ownhub may be catering for a different market from no-frills airlines because of its relianceon transfer traffic as typified by the Bristol–Amsterdam example in Table 6.4. In otherwords, hub feeding services operated by full-service airlines are marketing andproviding connections to the global network in a way that no-frills airlines do not – orat least this is how passengers perceive it.
27 In some markets no-frills airlines may find it difficult to operate at all because of thelimits to stimulation of the market. For example, bmi found that the East Midlands–Brussels and Paris routes are better suited to operation by its regional subsidiary with50-seat aircraft than by the no-frills subsidiary bmibaby with a Boeing 737 (see casestudy).
10. See also Figure 3.2 in Chapter 3 in respect of Belfast–Edinburgh.
Page 7324 February 2005
CAP 754 UK Regional Air Services
Emerging trends
28 Growth in domestic and short haul services looks set to continue as people becomeincreasingly accustomed to direct services from a local airport rather than having toconnect or travel by surface to a distant hub. But there is a finite number of city-pairswhere there will be a sufficient level of pre-existing demand to make them obviousmarkets to exploit. This leaves routes where the market (and in these cases it is morelikely to be a leisure market) can be “created” through demand stimulation. Thatrequires an airline to make a judgement as to whether such potential routes will evergrow to a viable size and whether it is worth the risk.
29 Although it seems likely that there will be further consolidation (or possibly exit)among the no-frills airlines, particularly if they continue to expand at the present rateand begin to compete head to head, the distinction between full-service and no-frillsairlines will also continue to be gradually eroded. In some respects, the full-serviceairline may be able to differentiate its product through offering elements such as goodconnectivity to the global network (or simply access to congested hubs), and,primarily in longer-haul markets, business class frills like in-flight service/comfort,airport lounges, easier check-in etc. Meanwhile the no-frills airlines may now belosing some of their early cost advantages, such as distribution costs, and start-updeals on airport charges.
30 It is also likely that some thin niche markets will continue to be served by airlines suchas Eastern Airways and Loganair using relatively small aircraft, mostly of 30 seats orless.
Case study 8: bmi regional and bmibaby
Shortly after BA’s no-frills subsidiary Go announced that it was setting up a base atNottingham East Midlands (NEMA) in 2001, bmi set up its own no-frills subsidiary, bmibaby,at NEMA, using Boeing 737s transferred from the parent company. The bmi group’s short-haul business is therefore in three divisions: mainline, which covers all Heathrow routes,including domestic routes; regional, with a fleet of Embraer 135/145 regional jets; andbmibaby. The mainline and regional divisions are full-service airlines. bmibaby and bmiregional therefore co-exist, but to a large extent operate independently; bmibaby has its ownAir Operator’s Certificate, flight designator, management team and accounts.
bmi regional’s operations are based at Aberdeen. It operates a network of around 18 routesfrom Aberdeen, Edinburgh, Glasgow, Leeds Bradford and Manchester, linking these citieswith each other as well as offering some services to Brussels, Paris and Copenhagen.
At NEMA bmibaby took over all bmi’s existing routes, which gave rise to some interestingchanges. The much larger aircraft size has resulted in some reductions in frequency – thefive daily frequencies to Edinburgh and Glasgow have been reduced to three, and the four-daily Paris service was reduced to two. Similarly, the Brussels route went from three to twodaily, but the market could not support the extra capacity of the bmibaby 737s, and this routehas now reverted to three daily bmi regional Embraer 145s. By the end of 2004 this wasthe only bmi full-service route from NEMA, alongside more than 15 served by bmibaby.However, from March 2005 two more bmibaby routes from NEMA are being transferred tobmi regional, Paris, which increases to three daily, and the twice-weekly service to Nice.
Source: bmi website and CAA discussions with the airline
Page 7424 February 2005

CAP 754 UK Regional Air Services
Charter services
31 As noted earlier in this study, the number of passengers on charter services fromregional airports had exceeded those travelling from London airports by the late 1980sand is now approximately twice as great. However, the charter market is changingfrom being almost wholly “inclusive tour” to include both flight-only sales topassengers that already have their own accommodation, and self-packaging bypassengers that have booked a hotel themselves and are now in search of a flight.Tour operators, like incumbent scheduled airlines, have had to react to the entry ofno-frills airlines into traditional charter markets. Last-minute bookings with a tour
Case study 9: Air Southwest
Air Southwest completed its first year of operations in October 2004. It is a subsidiary ofSutton Harbour Holdings Plc, the owners of its home base, Plymouth Airport. The airlinewas formed from scratch to take over the Plymouth/Newquay–Gatwick service from BACitiExpress, and in particular the Gatwick slots (which would otherwise have beenre-allocated to other destinations). The potential loss of the London service had been ofgreat concern locally and, as a result, passenger awareness of the new airline had been highfrom the beginning. Air Southwest currently employs around 75 staff. In its first year itcarried 170,000 passengers with 98% reliability. Traffic on the four times daily Gatwickservice has risen by 22% compared with the BA service.
Air Southwest added a twice-daily Plymouth–Bristol–Manchester service from March 2004.The aircraft continues on to Jersey from Plymouth in the middle of the day (giving a one-stopBristol–Jersey service) and does a third rotation Manchester–Bristol in the late afternoon.From April 2005 a third aircraft will operate Newquay–Bristol–Leeds Bradford twice daily,continuing on from Newquay to Dublin in the early afternoon (giving a one-stop Bristol-Dublin service). This service will also link Newquay with Manchester, and Plymouth withLeeds Bradford, via a change of plane at Bristol; with these combinations included this willtake the network to 15 routes.
From the beginning Air Southwest adopted a no-frills strategy, including high aircraftutilisation. Turnaround times are typically 15–20 minutes (30 minutes at Gatwick). Theairline offers point-to-point tickets only and does not interline or allow booking throughGlobal Distribution Systems, despite the connecting possibilities from serving Gatwick.90% of bookings are made on-line. Removing this complexity and cost allows it to offer asimple fares structure with only one price per flight for sale at any given time. Prices startat £34 one way to London including taxes and charges, and £19 and £29 to Bristol andManchester respectively. Air Southwest believes that these lower fares have attractedpassengers who previously would not have considered flying; for example, the large localstudent population, or people visiting them. The airline also believes that relatively poor roadand rail connections to the far south west of England have been to its advantage.
Despite the lack of through ticketing and baggage checking, a significant proportion ofpassengers (perhaps as many as 40% on some services) are thought to be connecting withother flights at Gatwick. Air Southwest has also sought to improve customer awareness ofthe possibilities of connecting with Continental Airlines’ new Newark–Bristol service, andshares a website with Isles of Scilly Skybus promoting links between Manchester orGatwick and the Isles of Scilly via a change of aircraft at Newquay.
Source: Air Southwest website and CAA discussions with the airline
Page 7524 February 2005
CAP 754 UK Regional Air Services
operator would historically have meant a bargain, which is in complete contrast to thepricing model used by no-frills scheduled airlines where early bookings are sold at thelowest prices. While charter airlines have necessarily always had a “low cost”strategy because of the nature of the market they serve, there has, as noted earlierin this chapter, been a gradual shift by charter airlines onto scheduled routes inresponse to the entry of no-frills airlines.
32 Airports clearly still regard charters as an important part of their business. The casestudies in Chapter 7 suggest that some have been striving to manage the entry ofno-frills airlines so as to protect an existing charter programme (presumably tomitigate the risk that the tour operators would withdraw completely) or employing astrategy of attracting charter flights that for historical reasons were operating fromneighbouring airports. But, overall, charter traffic from UK regional airports hasremained relatively static over the last few years.
Inbound traffic
33 There is evidence that some routes that begin as primarily outbound leisure, sayBarcelona, may have considerable potential for attracting inbound traffic, be it leisureor business. This will depend on the attractiveness of the UK region and how well itis marketed as a destination.
34 This inbound element of the traffic mix is likely to be extremely important to the localregion. In less densely populated areas, like Inverness or Belfast, the local catchmentarea may not generate enough outbound passengers to support the service, makingthese inbound passengers essential. It could also be a crucial element in any decisionabout the use of route development funding (as discussed in more detail inChapter 8), as it may affect the long-term viability of a particular route. The investmentthese inbound passengers generate should create economic growth, bringing jobsand greater prosperity to the region. Business passengers potentially bring asignificant benefit, for example through improving business links with UK companies,setting up a UK subsidiary, or attending events or conferences. Tourists will bringmoney into the region, balancing the loss from outbound tourists using the newservice to spend money abroad. The balance has to be seen in terms of net valuerather than passenger numbers, as some of these tourists may be relatively highspenders. Passengers visiting friends or relatives will bring less spillover financialbenefit, but may still help to boost traffic levels and keep a route viable.
Barriers to new regional services
35 In general, the view expressed by airlines during research for this study was that therewere few barriers to new services between two EU regional airports. The mainconsideration was whether the airline had a suitable aircraft to operate the service.Even if it has spare capacity, an airline with a single-type fleet may still judge its aircraftto be too big for the route. In the case of smaller airports there may be operationallimitations on the aircraft that can be used. The difficulty of judging the size of thepotential market was mentioned by a number of airlines and airports. Becauseregional services tend to be relatively thin, airlines were said to be more reluctant toenter a new market without properly assessing the market size. The CAA publishesdata collected from UK airports, and survey data showing existing origin anddestination flows, but it is still difficult to estimate the likely degree of stimulation ofa market. Data may also be available from other sources, for example showing whatbusiness demand is likely to be between two points. But data on surface travel, forexample traffic carried by train operators, is said to be lacking.
Page 7624 February 2005
CAP 754 UK Regional Air Services
36 In the case of a new route to a congested airport, either London or on the continent,a major barrier would be obtaining the necessary slots to operate the service. Theview expressed was that even though a strong potential market might exist for newservices to Heathrow, Paris, Frankfurt and so on, only an airline already established atthe congested airport would have any reasonable chance of obtaining sufficientsuitable slots to mount a service, despite the current rule that gives some preferenceto new entrants in the slot allocation process.
37 It was also suggested by some airlines that not all EU airports were as commerciallyminded as UK airports, or as willing to negotiate discounts for incremental traffic.Such airports were said to show little interest in stimulating new traffic.
Withdrawing service
38 The CAA recognises that considerable disruption can result when an airline suspendsan air service. Some businesses – or perhaps second-home owners – may evendepend on the service. In general, airlines wishing to maintain good relations withcustomers and regional bodies will be wary of suspending a route. Nevertheless,airlines are commercial entities, although BA, for example, still has to deal with aperception in some quarters that it should act as the national flag carrier and providea public service regardless of commercial considerations. Its withdrawal from theGatwick–Leeds Bradford route is a recent example where it came in for criticism.
39 Where an airline is the sole operator on a route with no significant surface alternative,then, to maintain good public relations, it is likely to make known its intention towithdraw. For example, the Plymouth/Newquay–Gatwick route did not fit BA’soverall strategic plan of consolidating and rationalising its operations, and BA took acommercial decision to withdraw. However, it was able to provide some operationalassistance while Air Southwest took over the service, acquired the Gatwick slots, andgained its own Air Operator’s Certificate. Another example was the Guernsey–Gatwick route, which in similar circumstances BA was able to transfer to an existingairline, Aurigny.
Environmental issues
40 There is general recognition in the industry that addressing aviation’s environmentalimpacts is of increasing importance. These issues are outside the scope of this study.However, it is worth recording that there may be countervailing environmentalbenefits from new regional air services to the extent that they diminish the amountof passengers (or cargo) that would otherwise travel by road over long distances tocatch a flight from another airport; and that there is concern over the possibility ofenvironmental measures disproportionately affecting regional services, to thedetriment of the regions.
Page 7724 February 2005

Page 78

CAP 754 UK Regional Air Services
Chapter 7 Developments in regional services – the airport
perspective
1 Table 7.1 below shows how traffic has developed at individual UK airports since 1990.
Table 7.1 Traffic development at UK airports 1990–2004
Passengers (000) 1990 1992 1994 1996 1998 2000 2002 2004 (a)
London Area Airports
Gatwick 21,043 19,841 21,041 24,099 29,031 31,948 29,518 31,220
Heathrow 42,635 44,968 51,360 55,727 60,356 64,277 63,035 66,979
London City 230 186 477 724 1,358 1,581 1,602 1,645
Luton 2,679 1,943 1,801 2,406 4,110 6,164 6,474 7,399
Southend 119 16 --- 4 3 3 5 3
Stansted 1,156 2,332 3,252 4,808 6,830 11,858 16,049 20,835
Total London Airports 67,861 69,287 77,931 87,768 101,688 115,831 116,684 128,082
Metro London Heliport 7 4 5 5 5 6 --- ---
Other UK Airports
Aberdeen 1,947 2,153 2,108 2,333 2,620 2,454 2,549 2,617
Barra (b) --- --- 5 8 9 8 8 9
Barrow-in-Furness --- 1 --- --- --- --- --- ---
Belfast City 548 612 1,227 1,360 1,313 1,288 1,890 2,071
Belfast International 2,294 2,241 2,038 2,351 2,626 3,127 3,551 4,340
Bembridge --- --- --- --- --- --- --- ---
Benbecula 32 33 36 36 35 34 32 30
Biggin Hill (c) --- --- 4 3 3 2 1 1
Birmingham 3,492 3,652 4,783 5,351 6,607 7,492 7,911 8,836
Blackpool 137 109 79 84 93 107 70 264
Bournemouth 137 105 107 157 308 271 392 491
Bristol 774 1,026 1,275 1,394 1,814 2,124 3,415 4,550
Cambridge 30 23 31 28 17 20 1 3
Campbeltown (d) --- --- --- 6 9 8 8 8
Cardiff 593 653 990 1,001 1,228 1,498 1,416 1,875
Carlisle 1 --- 1 --- --- --- --- ---
City of Derry 41 28 34 64 49 163 199 237
Coventry 17 9 2 1 1 2 4 416
Dundee 5 13 14 13 9 49 45 51
Edinburgh 2,492 2,538 2,996 3,808 4,542 5,494 6,911 7,955
Exeter 217 167 196 202 240 317 336 597
Glasgow 4,286 4,669 5,454 5,470 6,477 6,920 7,769 8,521
Gloucestershire 5 8 3 2 --- --- --- ---
Hawarden 1 1 --- --- 4 2 2 28
Humberside 135 151 246 274 336 443 490 533
Inverness 216 213 260 284 320 337 363 516
Islay 21 18 18 19 20 20 21 21
Isle of Man 532 460 500 584 692 698 718 758
Page 7924 February 2005
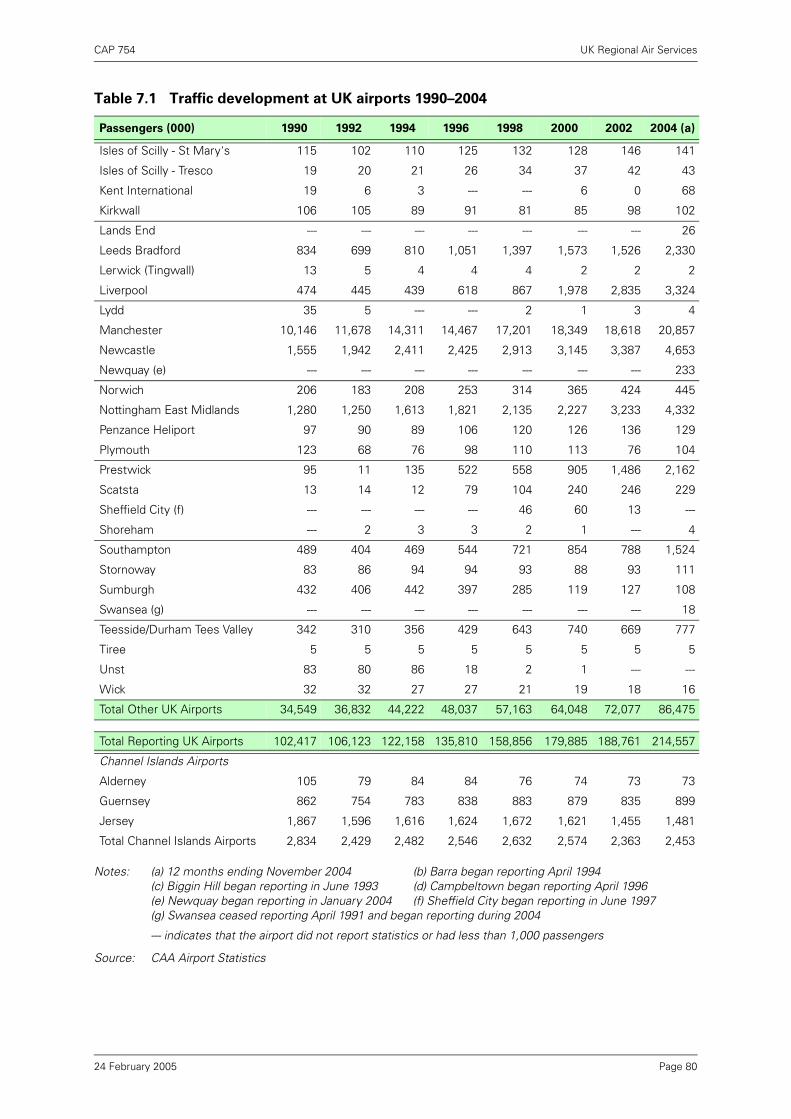
CAP 754 UK Regional Air Services
Notes: (a) 12 months ending November 2004 (b) Barra began reporting April 1994(c) Biggin Hill began reporting in June 1993 (d) Campbeltown began reporting April 1996(e) Newquay began reporting in January 2004 (f) Sheffield City began reporting in June 1997(g) Swansea ceased reporting April 1991 and began reporting during 2004
--- indicates that the airport did not report statistics or had less than 1,000 passengers
Source: CAA Airport Statistics
Isles of Scilly - St Mary's 115 102 110 125 132 128 146 141
Isles of Scilly - Tresco 19 20 21 26 34 37 42 43
Kent International 19 6 3 --- --- 6 0 68
Kirkwall 106 105 89 91 81 85 98 102
Lands End --- --- --- --- --- --- --- 26
Leeds Bradford 834 699 810 1,051 1,397 1,573 1,526 2,330
Lerwick (Tingwall) 13 5 4 4 4 2 2 2
Liverpool 474 445 439 618 867 1,978 2,835 3,324
Lydd 35 5 --- --- 2 1 3 4
Manchester 10,146 11,678 14,311 14,467 17,201 18,349 18,618 20,857
Newcastle 1,555 1,942 2,411 2,425 2,913 3,145 3,387 4,653
Newquay (e) --- --- --- --- --- --- --- 233
Norwich 206 183 208 253 314 365 424 445
Nottingham East Midlands 1,280 1,250 1,613 1,821 2,135 2,227 3,233 4,332
Penzance Heliport 97 90 89 106 120 126 136 129
Plymouth 123 68 76 98 110 113 76 104
Prestwick 95 11 135 522 558 905 1,486 2,162
Scatsta 13 14 12 79 104 240 246 229
Sheffield City (f) --- --- --- --- 46 60 13 ---
Shoreham --- 2 3 3 2 1 --- 4
Southampton 489 404 469 544 721 854 788 1,524
Stornoway 83 86 94 94 93 88 93 111
Sumburgh 432 406 442 397 285 119 127 108
Swansea (g) --- --- --- --- --- --- --- 18
Teesside/Durham Tees Valley 342 310 356 429 643 740 669 777
Tiree 5 5 5 5 5 5 5 5
Unst 83 80 86 18 2 1 --- ---
Wick 32 32 27 27 21 19 18 16
Total Other UK Airports 34,549 36,832 44,222 48,037 57,163 64,048 72,077 86,475
Total Reporting UK Airports 102,417 106,123 122,158 135,810 158,856 179,885 188,761 214,557
Channel Islands Airports
Alderney 105 79 84 84 76 74 73 73
Guernsey 862 754 783 838 883 879 835 899
Jersey 1,867 1,596 1,616 1,624 1,672 1,621 1,455 1,481
Total Channel Islands Airports 2,834 2,429 2,482 2,546 2,632 2,574 2,363 2,453
Table 7.1 Traffic development at UK airports 1990–2004
Passengers (000) 1990 1992 1994 1996 1998 2000 2002 2004 (a)
Page 8024 February 2005

CAP 754 UK Regional Air Services
2 Table 7.2 shows the 15 UK regional airports where total passenger numbers exceeded1m in 2004. It is apparent that Manchester has by far the greatest traffic at 21m.Since 1990 there has been very strong growth at several airports, including Bristol,Liverpool and Prestwick where no-frills airlines have become established.
Notes: 2004 figures are for the 12 months ending November.
Airports with total passengers of more than 1m in 2004 are shown.
Source: CAA Airport Statistics.
Airport ownership
3 Over the last 20 years, airports in the UK have moved from being predominantly inpublic ownership to being mainly in private ownership, either wholly or partially (Table7.3). Whatever their ownership, the evidence gathered during this study suggeststhat airports generally now have a much more commercial outlook. Their more pro-active approach, and the aggressive expansion of no-frills airlines stemming from theliberalised market, have combined to provide a level of network development thatregional airports have lacked in the past.
Table 7.2 Total passengers at top 15 UK regional airports 1990–2004
Passengers (000) Growth
1990–2004 Airport 1990 2004
Manchester 10,146 20,857 106%Birmingham 3,492 8,836 153%Glasgow 4,286 8,521 99%
Edinburgh 2,492 7,955 219%Newcastle 1,555 4,653 199%Bristol 774 4,550 488%Belfast International 2,294 4,340 89%Nottingham East Midlands 1,280 4,332 238%Liverpool 474 3,324 601%Aberdeen 1,947 2,617 34%Leeds Bradford 834 2,330 179%Glasgow Prestwick 95 2,162 2176%Belfast City 548 2,071 278%Cardiff 593 1,875 216%Southampton 489 1,524 212%
Page 8124 February 2005
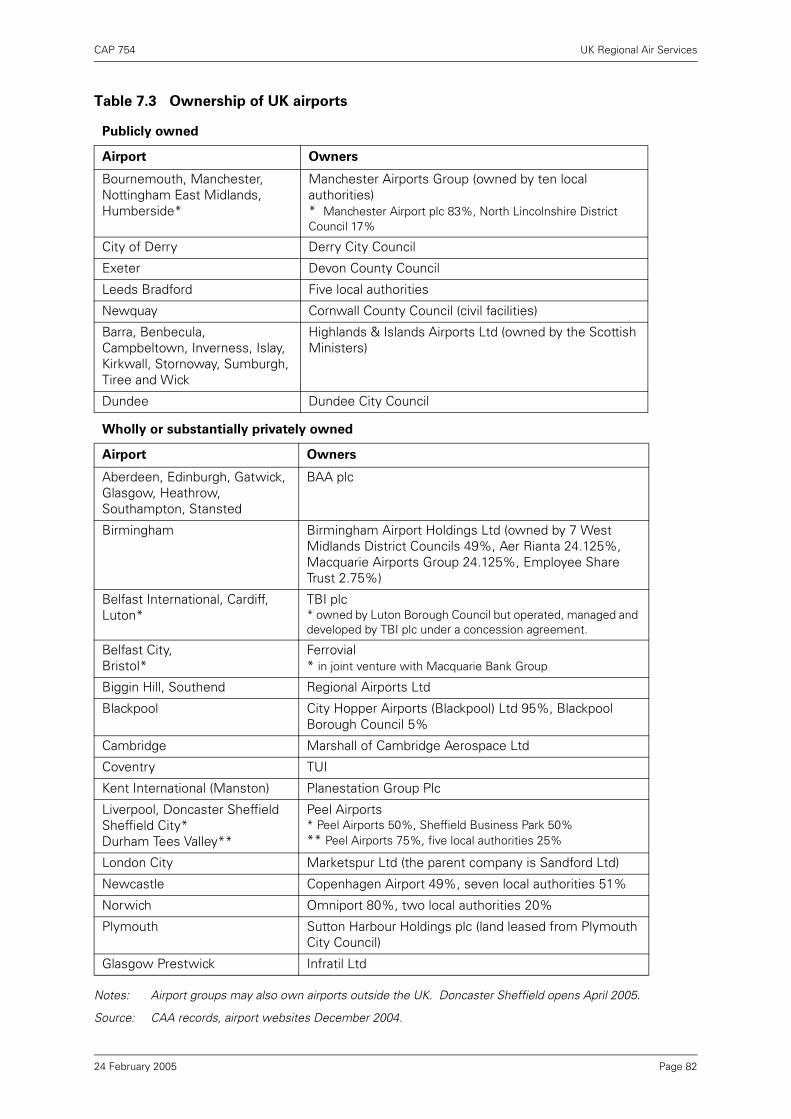
CAP 754 UK Regional Air Services
Notes: Airport groups may also own airports outside the UK. Doncaster Sheffield opens April 2005.
Source: CAA records, airport websites December 2004.
Table 7.3 Ownership of UK airports
Publicly owned
Airport Owners
Bournemouth, Manchester, Nottingham East Midlands, Humberside*
Manchester Airports Group (owned by ten local authorities)* Manchester Airport plc 83%, North Lincolnshire District Council 17%
City of Derry Derry City Council
Exeter Devon County Council
Leeds Bradford Five local authorities
Newquay Cornwall County Council (civil facilities)
Barra, Benbecula, Campbeltown, Inverness, Islay, Kirkwall, Stornoway, Sumburgh, Tiree and Wick
Highlands & Islands Airports Ltd (owned by the Scottish Ministers)
Dundee Dundee City Council
Wholly or substantially privately owned
Airport Owners
Aberdeen, Edinburgh, Gatwick, Glasgow, Heathrow, Southampton, Stansted
BAA plc
Birmingham Birmingham Airport Holdings Ltd (owned by 7 West Midlands District Councils 49%, Aer Rianta 24.125%, Macquarie Airports Group 24.125%, Employee Share Trust 2.75%)
Belfast International, Cardiff,Luton*
TBI plc* owned by Luton Borough Council but operated, managed and developed by TBI plc under a concession agreement.
Belfast City, Bristol*
Ferrovial* in joint venture with Macquarie Bank Group
Biggin Hill, Southend Regional Airports Ltd
Blackpool City Hopper Airports (Blackpool) Ltd 95%, Blackpool Borough Council 5%
Cambridge Marshall of Cambridge Aerospace Ltd
Coventry TUI
Kent International (Manston) Planestation Group Plc
Liverpool, Doncaster SheffieldSheffield City* Durham Tees Valley**
Peel Airports* Peel Airports 50%, Sheffield Business Park 50%** Peel Airports 75%, five local authorities 25%
London City Marketspur Ltd (the parent company is Sandford Ltd)
Newcastle Copenhagen Airport 49%, seven local authorities 51%
Norwich Omniport 80%, two local authorities 20%
Plymouth Sutton Harbour Holdings plc (land leased from Plymouth City Council)
Glasgow Prestwick Infratil Ltd
Page 8224 February 2005
CAP 754 UK Regional Air Services
Airport competition
4 As noted in Chapter 6, airlines with new capacity to place in the market are continuallyseeking out new market opportunities. As a result, airports are in competition withone another to secure that capacity. In the course of discussions with airlines andairports there was a general impression that UK regional airports, to varying degrees,were now seeking out business much more actively, perhaps in response to thegrowth in the airline market, which has stimulated a more commercial approach anda greater recognition of the opportunities this affords for the airport and the widerregion. One airline mentioned that in the past it had once started a service to aregional airport without even discussing the level of charges with the airportconcerned. This would be unlikely now, and is a measure of how things havechanged.
5 Although the competition for airline business may be sharpest between neighbouringairports, there is a degree of competitive tension between airports right across the UKand Europe. Where an airline is considering launching a series of new routes, theprocess may take the form of a negotiated package. As well as agreement on jointmarketing, advertising and so on, this package might include the airport offering aparticular level of charges – perhaps encouraging new routes by way of start-updiscounts for the first few years – and the airline basing a certain number of aircraft atthe airport, perhaps specifying particular routes.
6 Each airport tends to have a preferred portfolio of potential destinations for which itmay actively seek services to give a rich and balanced network in terms ofdestinations (both UK and abroad, perhaps including long haul), scheduled/charter,frequency, and connections to the global network via services to larger hub airports.Those considerations may mean it will focus on attracting a particular type of airline.Case Studies 10 to 12 below provide some illustrations. Research for this studysuggested a strong identification between the airport and the community it served,and a partial reflection of that was the airport’s preferred portfolio of routes andairlines.
7 Once an airport has managed to attract a new service, it is of course the airline thatthen competes openly for passengers and attempts to draw them to the airportconcerned using fare offers, marketing and advertising. In other words, theheightened competition between airports for airline business is generally hidden fromthe consumer, as it pre-dates the point at which competition for the final consumertakes place.
8 As noted in Chapter 6, different airports adopt different approaches when it comes toairport charges. Some airports are more willing than others to use lower charges toencourage airlines to set up new services; while others will not negotiate on chargesper se, but will provide support for marketing a new service, thus reducing the airline’sstart-up costs. Indeed, a “virtuous circle” can develop whereby airports’ morecommercial approach, competitive pricing and improved facilities stimulate trafficgrowth, which in turn generates revenue from non-aeronautical activities andunderpins further expansion.
9 However, once an airline has established itself at a particular airport, it may be moredifficult for a neighbouring competing airport to attract it away because of the sunkcosts involved, particularly when an airline has a large fleet based there. Someestablished airlines that may not qualify for new entrant deals can be frustrated by thelevel of airport charges they face, particularly as, with other costs having reduced,airport charges can form an increasingly large element of a short-haul airline’s totaloperating costs. Airlines and airports consulted for this study suggested that whereairport charges are low – perhaps in part through discounts, or discounts linked toroute development funding – it can make a significant difference to airlines’willingness to open up new routes from that airport.
Page 8324 February 2005
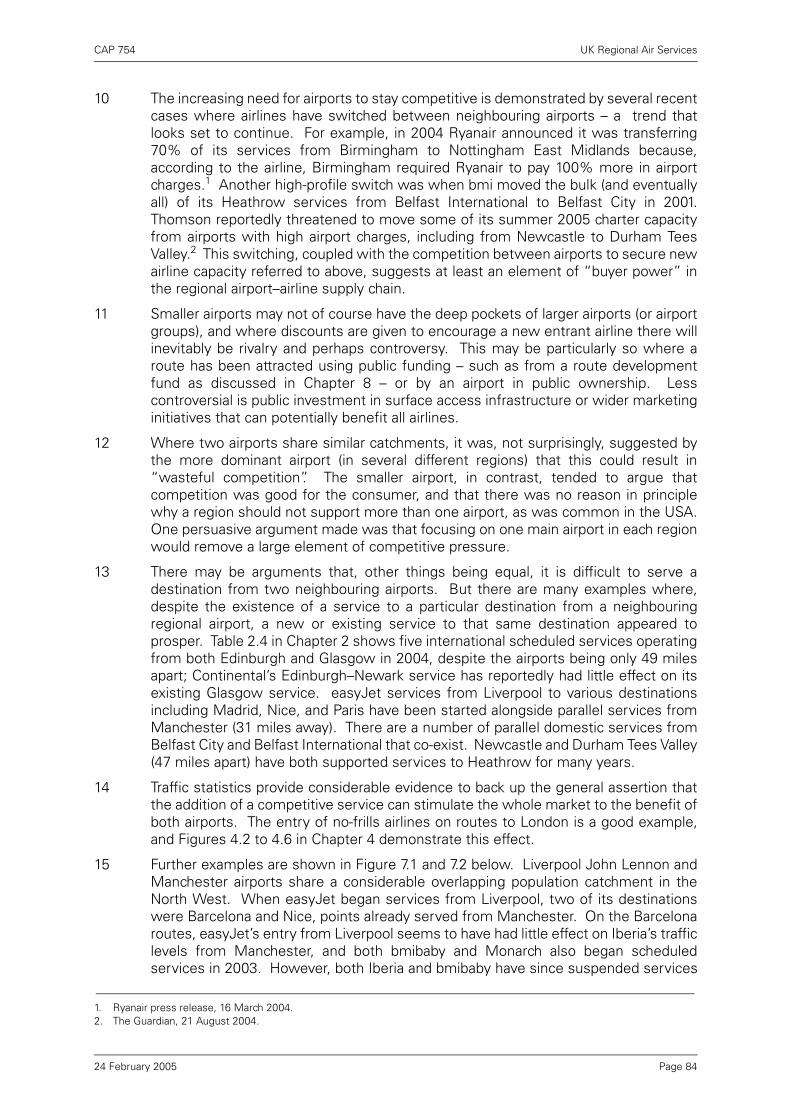
CAP 754 UK Regional Air Services
10 The increasing need for airports to stay competitive is demonstrated by several recentcases where airlines have switched between neighbouring airports – a trend thatlooks set to continue. For example, in 2004 Ryanair announced it was transferring70% of its services from Birmingham to Nottingham East Midlands because,according to the airline, Birmingham required Ryanair to pay 100% more in airportcharges.1 Another high-profile switch was when bmi moved the bulk (and eventuallyall) of its Heathrow services from Belfast International to Belfast City in 2001.Thomson reportedly threatened to move some of its summer 2005 charter capacityfrom airports with high airport charges, including from Newcastle to Durham TeesValley.2 This switching, coupled with the competition between airports to secure newairline capacity referred to above, suggests at least an element of “buyer power” inthe regional airport–airline supply chain.
11 Smaller airports may not of course have the deep pockets of larger airports (or airportgroups), and where discounts are given to encourage a new entrant airline there willinevitably be rivalry and perhaps controversy. This may be particularly so where aroute has been attracted using public funding – such as from a route developmentfund as discussed in Chapter 8 – or by an airport in public ownership. Lesscontroversial is public investment in surface access infrastructure or wider marketinginitiatives that can potentially benefit all airlines.
12 Where two airports share similar catchments, it was, not surprisingly, suggested bythe more dominant airport (in several different regions) that this could result in“wasteful competition”. The smaller airport, in contrast, tended to argue thatcompetition was good for the consumer, and that there was no reason in principlewhy a region should not support more than one airport, as was common in the USA.One persuasive argument made was that focusing on one main airport in each regionwould remove a large element of competitive pressure.
13 There may be arguments that, other things being equal, it is difficult to serve adestination from two neighbouring airports. But there are many examples where,despite the existence of a service to a particular destination from a neighbouringregional airport, a new or existing service to that same destination appeared toprosper. Table 2.4 in Chapter 2 shows five international scheduled services operatingfrom both Edinburgh and Glasgow in 2004, despite the airports being only 49 milesapart; Continental’s Edinburgh–Newark service has reportedly had little effect on itsexisting Glasgow service. easyJet services from Liverpool to various destinationsincluding Madrid, Nice, and Paris have been started alongside parallel services fromManchester (31 miles away). There are a number of parallel domestic services fromBelfast City and Belfast International that co-exist. Newcastle and Durham Tees Valley(47 miles apart) have both supported services to Heathrow for many years.
14 Traffic statistics provide considerable evidence to back up the general assertion thatthe addition of a competitive service can stimulate the whole market to the benefit ofboth airports. The entry of no-frills airlines on routes to London is a good example,and Figures 4.2 to 4.6 in Chapter 4 demonstrate this effect.
15 Further examples are shown in Figure 7.1 and 7.2 below. Liverpool John Lennon andManchester airports share a considerable overlapping population catchment in theNorth West. When easyJet began services from Liverpool, two of its destinationswere Barcelona and Nice, points already served from Manchester. On the Barcelonaroutes, easyJet’s entry from Liverpool seems to have had little effect on Iberia’s trafficlevels from Manchester, and both bmibaby and Monarch also began scheduledservices in 2003. However, both Iberia and bmibaby have since suspended services
1. Ryanair press release, 16 March 2004.2. The Guardian, 21 August 2004.
Page 8424 February 2005
CAP 754 UK Regional Air Services
in 2004, leaving Monarch as the only scheduled operator serving Barcelona fromManchester (Figure 7.1). In contrast, on the Nice routes, BA has actually re-enteredthe market from Manchester having withdrawn its service in 1996 prior to easyJet’sentry from Liverpool (Figure 7.2).
Notes: 2004 statistics are for the 12 months ending November.
Source: CAA Airport Statistics.
Notes: 2004 statistics are for the 12 months ending November.
Source: CAA Airport Statistics
Figure 7.1 Traffic on Liverpool–Barcelona and Manchester–Barcelona 1990–2004
Figure 7.2 Traffic on Liverpool–Nice and Manchester–Nice 1990–2004
0
100
200
300
400
1990 1991 1992 1993 1994 1995 1996 1997 1998 1999 2000 2001 2002 2003 2004
Pass
enge
rs (0
00)
easyJet Liverpool
IberiaManchester
BAManchester
MonarchManchester
bmibaby Manchester
0
40
80
120
160
200
1990 1991 1992 1993 1994 1995 1996 1997 1998 1999 2000 2001 2002 2003 2004
Pass
enge
rs (0
00)
easyJet Liverpool
British Regional/ BA CitiExpress
ManchesterBA Manchester
Air Liberté/TAT Manchester
Page 8524 February 2005
CAP 754 UK Regional Air Services
16 The evidence seems to suggest that competition between airports is the preferredoutcome, and that the market is the best determinant of what services can besustained at any particular airport. Although combining services at one airport maylead to benefits from economies of scale, this will not necessarily provide a betteroutcome than competition, spurred by the ability of the airlines to switch, whichprovides a check on airports’ pricing and service quality.
Case Study 10: Exeter Airport
Despite having only two scheduled services prior to Summer 2004, to the Channel Islandsand Dublin, Exeter was anxious not to lose its charter programme – which had beengrowing – as a result of introducing a large-scale no-frills airline operation. The package ofnew scheduled services introduced by flybe in 2004 included a mix of domestic (dailyservices to Belfast, Glasgow, Edinburgh and Newcastle) as well as “sun” destinations(Alicante, Faro and Malaga – which inevitably caused some reduction in charter flights tothose points). As a result, Exeter’s passenger figures for 2004 exceeded 0.5m with April toOctober figures 70% higher than the same period in 2003. Summer 2005 will see furtherflybe services to Brest, Liverpool, Leeds Bradford, and, significantly, a twice-daily service toParis, where flybe is making use of slots being released by a Birmingham service that it waspreviously operating on behalf of Air France.
Source: Exeter airport website and CAA discussions with the airport
Case study 11: Bristol Airport
In 2004 Bristol was served by 12 scheduled airlines and traffic levels reached 4.5m, comfortablyexceeding the next biggest neighbouring airports (Exeter 0.7m and Cardiff 2m) put together.Bristol was chosen by Go (now absorbed by easyJet) as its second operating base. It was thefirst no-frills base outside London with an established “traditional” network of charter andscheduled operations, including services to Scotland, Paris and Amsterdam, which might beseen as potentially at risk from no-frills entry. This distinguishes Bristol from, say, Liverpool,where easyJet set up its first non-London operation but which previously had very fewscheduled services.
In fact the entry of a no-frills airline has stimulated the market, and the airport has managed toavoid any loss of existing scheduled services at the airport. For example, KLM Cityhopper (fourtimes daily) competes head to head against easyJet (daily) to Amsterdam, as does BACitiExpress (five times daily) against easyJet (three times daily) to both Edinburgh and Glasgow.BA CitiExpress also operates to Paris five times daily, having increased frequency to replacefrequencies lost after Air France withdrew its own service when the post-merger Air France/KLM group rationalised services that fed both Paris and Amsterdam hubs. Traffic at the airportis now split 40% no frills, 25% full service and 35% charter. The airport notes that BACitiExpress has recently expanded its operations from Bristol with new services to Zurich andMilan despite the substantial easyJet operation.
Bristol now has 37 scheduled services, including no less than six with head-to-head competition.This critical mass is now stimulating markets as the significant local catchment area becomesmore aware of Bristol as a convenient local alternative to travelling by surface to London, whichmany had been doing. The most important recent development is Continental Airlines’ decisionto start a daily Newark service in May 2005.
Page 8624 February 2005

CAP 754 UK Regional Air Services
Case study 11: Bristol Airport (continued)
To illustrate the improved international connectivity, the table below compares theinternational scheduled departure board at Bristol on a Wednesday in June 1993 with aWednesday in August 2004.
Scheduled international services from Bristol
9th June 1993 18th August 2004
06:10 Malaga easyJet
06:25 Amsterdam KLM Cityhopper
06:40 Alicante easyJet
07:00 Amsterdam KLM Cityhopper 07:05 Paris (CDG) BA CitiExpress
07:20 Amsterdam easyJet
07:55 Paris (CDG) BA 07:40 Palma easyJet
08:30 Brussels Sabena 08:20 Dublin Ryanair
09:00 Dublin Aer Lingus 08:40 Paris (CDG) BA CitiExpress
09:35 Paris (CDG) Air France 10:25 Barcelona easyJet
10:20 Amsterdam KLM Cityhopper 10:35 Amsterdam KLM Cityhopper
10:35 Nice easyJet
10:50 Munich BA CitiExpress
10:55 Prague easyJet
11:40 Paris (CDG) BA CitiExpress
11:50 Bordeaux flybe
13:10 Venice easyJet
13:40 Dublin Ryanair
14:10 Copenhagen easyJet
14:10 Dublin Aer Lingus
14:35 Brussels Sabena 14:50 Berlin (SXF) easyJet
14:55 Bilbao easyJet
15:00 Frankfurt Brymon 15:25 Frankfurt BA CitiExpress
15:05 Amsterdam KLM Cityhopper 15:30 Amsterdam KLM Cityhopper
15:05 Paris (CDG) BA 16:00 Paris (CDG) BA CitiExpress
16:35 Dublin Aer Lingus 16:30 Brussels SN Brussels Airlines
16:35 Faro easyJet
16:40 Bergerac flybe
16:45 Toulouse flybe
17:00 Amsterdam KLM Cityhopper
18:55 Brussels Sabena 18:50 Dublin Ryanair
18:55 Paris (CDG) Air France 19:00 Amsterdam easyJet
19:30 Malaga easyJet
19:50 Dublin Aer Lingus 19:40 Alicante easyJet
Source: OAG Database of BACK Information Services and CAA discussions with the airport.
Page 8724 February 2005

CAP 754 UK Regional Air Services
Case study 12: Liverpool John Lennon Airport
Liverpool Airport was acquired by Peel Airports in 1997, currently owners of airports atDoncaster Sheffield, Durham Tees Valley (75%) and Sheffield City (50%). Liverpool lost itsHeathrow service in 1992 and had no air link with London for most of the 1990s. At that timethe only other scheduled services were to Dublin, Isle of Man, Belfast and Jersey. Passengernumbers remained stagnant at 0.4–0.6m until 1997, when Peel entered into a contract witheasyJet for it to act as “anchor” tenant at the airport by setting up its second base there afterLuton. By 2002 easyJet was operating to Amsterdam, Barcelona, Geneva, Madrid, Malaga,Nice, Palma and Paris. Recently other operators have started to see Liverpool as a viable airport with 23 new routesbeing announced since September 2004 to add to the existing 20. The new routes are to beoperated by Air Wales, flybe, Ryanair and Wizz Air (of Hungary). Ryanair has announced that itwill base up to four aircraft at Liverpool from March 2005 and will bring the total number ofdestinations it serves up to 13, including “plugging a gap” with new services to Italy. In termsof much-needed links with UK points, flybe’s network will include new services from Liverpoolto Glasgow, Edinburgh and Belfast City, and Air Wales’ network will include Cardiff andAberdeen. Passenger levels reached nearly 3.4m in 2004. The airport believes that the success of the Continental and Emirates services to Scotland –where the conurbations are smaller than the potential catchment area of the North West – willincrease the recognition that Liverpool could attract long-haul services. The airport also believesthat it could attract significantly more charter traffic, given that its current share relative toManchester is small compared with the relative size of the catchment areas of the two airports. To illustrate the rapid increase in international connectivity, the table below compares theinternational scheduled departure board at Liverpool on a Wednesday in June 1993 with aWednesday in August 2004.
Scheduled international services from Liverpool
9th June 1993 18th August 200406:10 Amsterdam easyJet06:30 Malaga easyJet07:00 Nice easyJet07:40 Barcelona easyJet07:50 Basel easyJet08:00 Paris (CDG) easyJet08:10 Palma easyJet
08:50 Dublin Ryanair 09:45 Amsterdam easyJet10:30 Dublin Ryanair11:55 Geneva easyJet12:05 Berlin (SXF) easyJet12:25 Malaga easyJet12:40 Madrid easyJet12:50 Dublin Ryanair13:30 Cologne easyJet13:55 Paris (CDG) easyJet15:20 Alicante easyJet15:45 Amsterdam easyJet17:20 Nice easyJet17:45 Malaga easyJet17:55 Barcelona easyJet18:55 Amsterdam easyJet19:15 Paris (CDG) easyJet19:40 Palma easyJet20:00 Gerona easyJet20:35 Connaught Aer Arann Express
21:55 Dublin Ryanair 22:25 Dublin Ryanair
Source: OAG Database of BACK Information Services, CAA discussions with the airport.
Page 8824 February 2005

CAP 754 UK Regional Air Services
“Visibility” and perception of airports
17 One recurring theme in the CAA’s regional interviews was that regional airports hadhistorically suffered from a lack of visibility. Even the immediate population issometimes unaware, or at least insufficiently aware, of the scheduled services fromtheir nearest airport. And, at a broader level, there can be serious practical difficulties,as explained below, when the flights on no-frills airlines that are actually providing themain connections to a regional airport, do not show on travel agents’ reservationsystems.
18 Yet, the more peripheral the region, the more enthusiasm, promotion and localcoverage of a new air service there seems to be. Some regional airports have goneto considerable lengths and invested substantial resources to improve their brandimage and visibility. For example, Liverpool is now known as Liverpool John LennonAirport, Teesside is now known as Durham Tees Valley, East Midlands is now knownas Nottingham East Midlands, and the new airport opening in 2005 at the former RAFFinningley is named Robin Hood Doncaster Sheffield.
19 Before no-frills airlines entered regional markets, the lack of visibility could probablybe attributed to a genuine lack of scheduled services from regional airports, and airlineperception that these airports could generate very little demand for scheduledservices. Increasingly this is no longer the case. The success of no-frills airlines andairports’ own initiatives has changed consumer perceptions massively.
20 But there may still be a need to promote the airport to both prospective outbound andinbound passengers, as well as to airlines. There can be a “snowball” effect whereby,as new services develop, people will become more accustomed to taking a flight fromtheir local airport. Word will spread. The visibility of that airport will grow. Thenetwork may achieve a “critical mass”, which will then attract more passengers andairlines. This sort of effect seems to have resulted in the recent rush of new servicesand airlines at Liverpool (see case study).
21 In recent years there have been greater efforts to bring large numbers of airports andairlines together at events such as the annual Routes conference. Such events wouldseem to be an excellent and cost-effective means of facilitating new services.Discussions appear to have brought together airlines and airports that might neverotherwise have contemplated meeting, and to have resulted in new air serviceproposals.
22 Interviews with some airlines or airports suggested, perhaps surprisingly, that theannouncement of a new regional service by one airline seems to attract the interestof other airlines. The implication is that, hitherto, airlines had not been aware, normade aware, of the potential market that the airport concerned could offer. It is thisperceived lack of awareness of the possibilities offered by regional airports that led theScottish Executive (in association with Scottish Enterprise) to develop the ScottishRoute Development Fund, which is discussed in more detail in Chapter 8.
23 In the discussion above it was noted that many regional airports seem to have apreference for a balance between full-service and no-frills airlines. As noted inChapter 6, a preference for a full-service airline is understandable where such anairline is likely to provide better connectivity to a hub. But there also seems to be acredibility and visibility “boost” for the region in having a globally branded airlineserving the airport. Foreign businesses are reportedly reluctant to set up in a city thatis perceived as having inadequate air links, and what constitutes “adequacy” mayinclude having a well-known airline operating from the local airport. No-frills airlineslike easyJet and Ryanair are becoming well-known, particularly across Europe, butthey may not have the same brand awareness or profile that the global alliances suchas oneworld, SkyTeam or Star Alliance have outside Europe.
Page 8924 February 2005

CAP 754 UK Regional Air Services
24 There are also more practical difficulties. CAA survey evidence3 suggests that a notinsignificant proportion of passengers are using no-frills airlines to fly to Stansted inorder to connect with other no-frills flights and thus access low fares and flights to awide range of destinations not available from their region. But it is less clear fromsurvey data or discussions with the industry whether long-haul passengers, and inparticular non-UK residents and business passengers, would use a no-frills airline aspart of a multi-sector journey. As noted in Chapter 5, their ticket is more likely to bebooked through a travel agent or travel website, both of which will usually make thebooking through a Global Distribution System (GDS), which is not able to book flightson most no-frills airlines. Such passengers may not have the necessary knowledgeof UK airline networks to construct their own itinerary, even if there were anadvantage in doing so. This can be a serious drawback for an airport that has few orno full-service links. For example, an itinerary request to a travel website or travelagent using a GDS may show no (or convoluted) connecting possibilities using theservices of full-service airlines, ignoring what may be feasible using the services of ano-frills airline. Understandably airports are therefore keen to encourage a full-serviceairline giving hub access to provide the practical visibility through the GDS as well asactual connectivity (via hub airports) to long-haul destinations.
Challenges for capacity development
25 Interviews with industry representatives suggested that there were no majorinfrastructure issues at regional airports, at least to the extent of any problems beingan insurmountable barrier to the expansion of air services. However, the need foraccess to the airways system and for changes to controlled airspace required forsafety reasons could be an obstacle to increased services. In addition, an increase incontrolled airspace around regional airports will have a knock-on effect on other usersof airspace, and will require the airport to consult with its local community and takeinto account the environmental impacts of any change. There are also issues aroundsurface access.
26 Some airports expressed their frustration at problems with surface access. Forexample, planning requirements in respect of road improvements held up outlineplanning permission for new terminal development at Exeter. The perverse effect ofdiscouraging the development was that passengers are likely to drive much furtherdistances (in the case of Exeter, to Bristol or London), with consequent congestionand environmental implications. One UK airport suggested that it was disadvantagedrelative to European airports – with which it is competing for new capacity placed byairlines – because it is expected to fund, or find ways to fund, new access roads thatwould be paid for by the taxpayer in other countries.
27 A dedicated rail or tramlink to a regional airport is desirable where it is feasible and canbe financed, but it might be beyond the scope of the airport’s resources, at leastwithout outside assistance. Bus services tend to be locally run and may not serve thewider catchment area. Public transport issues can of course become embroiled inlocal government politics where airports have overlapping catchment areas and theyare potentially competing for funding, or where the catchment covers more than onelocal authority. For example, a local authority may be unlikely to help set up a new busroute if this pulls traffic from its local airport to a neighbouring one. Such tensions maymake public transport access issues extremely difficult to resolve. For example,Liverpool Airport is looking at running or soliciting services from nearby cities in theNorth West that would be outside the usual operating area of the local buscompanies; while easyJet at one time ran seven daily buses from Manchester toLiverpool timed to feed its seven daily Liverpool–Belfast flights.
3. See Table 5.6 in Chapter 5.
Page 9024 February 2005

CAP 754 UK Regional Air Services
28 To conclude, surface access appears to remain a difficult issue in some regions – andit could be one area where greater commonality of purpose among the variousGovernmental bodies and agencies involved in taking funding decisions and agreeingpriorities could be helpful.
Page 9124 February 2005

Page 92

CAP 754 UK Regional Air Services
Chapter 8 Public policy initiatives
Slot allocation and regional access
1 The extent to which regional access to Heathrow can be protected, and theinteraction with the method by which slots at congested airports such as Heathroware allocated, is an area where there has been lively debate. The lack of availability ofHeathrow slots was cited by many industry representatives as the main infrastructureconstraint they face.
2 The CAA has long advocated a move away from the existing method of administrativeallocation of scarce slots towards market mechanisms as the best means of ensuringthe most efficient use of a scarce resource.1 This could be achieved through a systemwhereby existing slots can be traded between airlines and potentially between otherparties as well, and newly created slots (as a result of a new runway for example)could be auctioned in some way. The recent European Commission consultation onreform of EU slot regulations suggested the introduction of formalised secondarytrading of slots. In December 2004 the CAA published its response2 in support of thatgeneral concept and contributed to the UK Government’s response to the sameconsultation.3
3 The CAA is aware of concerns that secondary trading might endanger existingregional links at Heathrow. In fact, the choice of switching services away from UKregional destinations to other points may often be forced upon airlines because of theoverall constraints at Heathrow and, in the absence of a transparent and efficientsecondary slot market, the difficulty of expanding their slot portfolio within theseoverall constraints. A secondary market in slots could, therefore, provide greateropportunities for UK-based airlines to acquire slots and thus reduce the pressure onUK domestic services. In addition, the establishment of a slot market which allowedregional or other public bodies, or business consortia, to purchase slots could providea means by which slots at Heathrow could be preserved for regional services if thevalue placed on them by those bodies was sufficiently large to justify the purchaseprice.
4 The main reduction in regional services from Heathrow occurred during the 1990s.4
This was primarily the result of more marginal services being squeezed out ascapacity became more constrained. There may be some natural constraints on theextent to which the remaining Heathrow-based airlines operating domestic serviceswould wish to reduce significantly the amount of regional feed traffic they bring intoan airport they use as a hub, as this would negatively impact on the viability of otherservices operating from that hub. Without the feed traffic from UK regional (andother) points network airlines would be less able to operate longer haul services atthe load factors and profitability that they can currently. Indeed, bmi has recentlyintroduced services between Heathrow and Aberdeen and Inverness.
1. “The Implications of Secondary Slot Trading”, CAA, November 2001 available at www.caa.co.uk/erg/ergdocs/slotsnov01.pdf
2. “Introducing Commercial Allocation Mechanisms: the UK CAA’s Response to the European Commission’s Staff WorkingPaper on Slot Reform”, CAA, December 2004 available atwww.caa.co.uk/docs/5/SlotReform-theUKCAAFinalResponse.pdf
3. “UK Response to the European Commission’s Slot Allocation Consultation”, Department for Transport, December 2004available at www.dft.gov.uk/stellent/groups/dft_aviation/documents/page/dft_aviation_033272.hcsp
4. See Tables 4.2 and 4.6 in Chapter 4.
Page 9324 February 2005

CAP 754 UK Regional Air Services
5 An approach based on secondary trading as the best means of securing continuedaccess to Heathrow from regional airports goes with the grain of commercialdecisions and the dynamics of the airline market. The alternative is to attempt tointervene in the market through mechanisms such as the ring-fencing of slots atHeathrow for regional services, as some have advocated. However, such ring-fencingrisks imposing a high, and hidden, cost on the aviation industry and on the widereconomy.
Public Service Obligations
6 Public Service Obligations (PSOs) are used in the UK to protect certain routes that arevital to the economic development of a region and that cannot otherwise sustain acommercial air service. Provision for a PSO to be imposed by an EU Member Stateis included in the “market access” Regulation 2408/925 that formed part of theliberalisation measures of the EU Third Package that took effect from 1993.
7 If no airline has commenced or is about to commence scheduled air services inaccordance with the PSO that has been imposed on that route, a Member State mayoffer the right to operate the services by open public tender in accordance withRegulation 2408/92. The contract arising out of an invitation to tender, which wouldnormally specify a minimum level of service, including fares, may include the paymentof subsidy, taking into account the costs and revenue generated by the service. Wheninitiating a tender process, a Member State may limit access on that route to only oneairline for a period of up to three years.
8 Following the imposition of a PSO on a route, it is possible for the Member State toring-fence slots at airports for domestic scheduled services so that an airline cannotuse them for a service to an alternative destination. It is only possible to ring-fenceslots currently being used for the regional service concerned. Only slots at airportswhich have been designated “co-ordinated” under the European regulation on slotallocation6 can be ring-fenced. Heathrow, Gatwick, Stansted and Manchester are allco-ordinated airports in the UK.
9 Before a PSO can be imposed, Regulation 2408/92 requires that the route must:
• be to a "peripheral region", or be to a "development region", or be a "thin route toany regional airport"
• be “vital to the economic development of the region"
• require a PSO to ensure the "adequate" provision of scheduled air services – inassessing “adequacy”, the public interest, other forms of transport, air fares andconditions, and the combined effect of all airlines operating or intending to operateon the route must be taken into consideration.
10 The third criterion suggests that it is not possible to impose a PSO on a route betweentwo cities or regions on which adequate services are already being operatedcommercially.7
5. Council Regulation (EEC) No. 2408/92 of 23 July 1992 on access for Community air carriers to intra-Community airroutes.
6. Council Regulation (EEC) No. 95/93 of 18 January 1993 on common rules for the allocation of slots at Communityairports, as amended by Regulation (EC) No. 793/2004 of the European Parliament and of the Council of 21 April 2004.
7. See paragraph 4.47 of “The Future of Air Transport” White Paper, December 2003.
Page 9424 February 2005
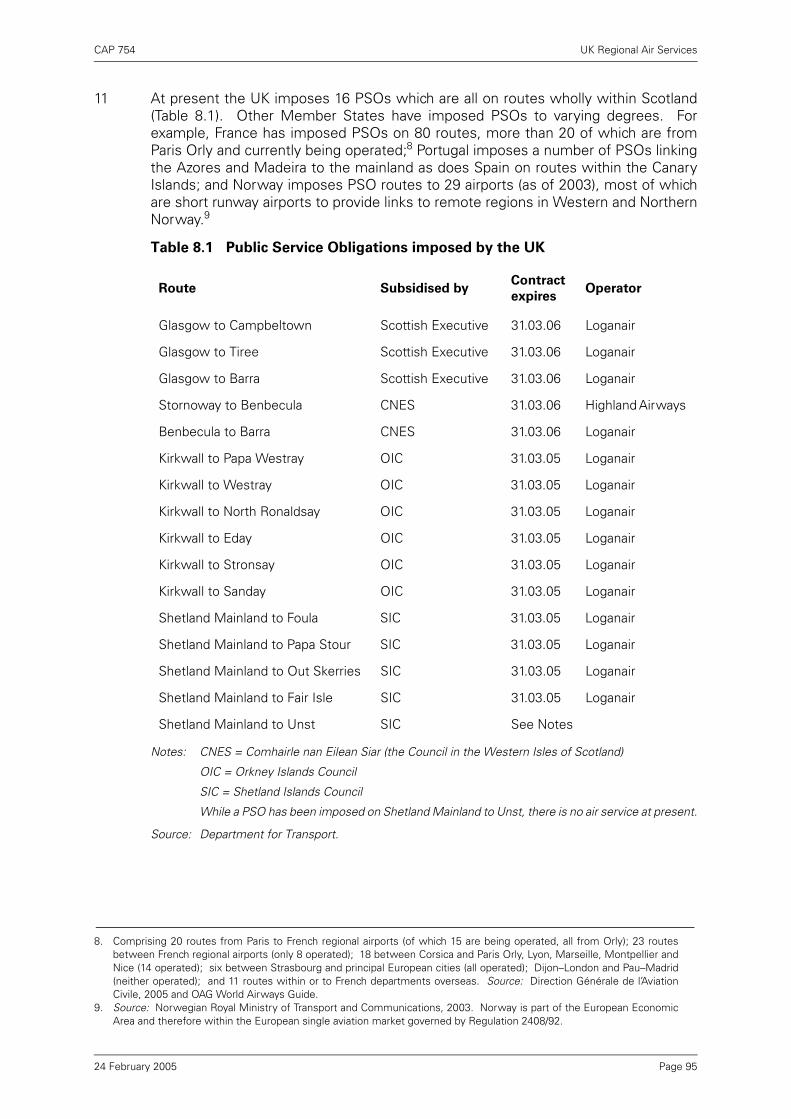
CAP 754 UK Regional Air Services
11 At present the UK imposes 16 PSOs which are all on routes wholly within Scotland(Table 8.1). Other Member States have imposed PSOs to varying degrees. Forexample, France has imposed PSOs on 80 routes, more than 20 of which are fromParis Orly and currently being operated;8 Portugal imposes a number of PSOs linkingthe Azores and Madeira to the mainland as does Spain on routes within the CanaryIslands; and Norway imposes PSO routes to 29 airports (as of 2003), most of whichare short runway airports to provide links to remote regions in Western and NorthernNorway.9
Notes: CNES = Comhairle nan Eilean Siar (the Council in the Western Isles of Scotland)
OIC = Orkney Islands Council
SIC = Shetland Islands Council
While a PSO has been imposed on Shetland Mainland to Unst, there is no air service at present.
Source: Department for Transport.
8. Comprising 20 routes from Paris to French regional airports (of which 15 are being operated, all from Orly); 23 routesbetween French regional airports (only 8 operated); 18 between Corsica and Paris Orly, Lyon, Marseille, Montpellier andNice (14 operated); six between Strasbourg and principal European cities (all operated); Dijon–London and Pau–Madrid(neither operated); and 11 routes within or to French departments overseas. Source: Direction Générale de l’AviationCivile, 2005 and OAG World Airways Guide.
9. Source: Norwegian Royal Ministry of Transport and Communications, 2003. Norway is part of the European EconomicArea and therefore within the European single aviation market governed by Regulation 2408/92.
Table 8.1 Public Service Obligations imposed by the UK
Route Subsidised byContract
expiresOperator
Glasgow to Campbeltown Scottish Executive 31.03.06 Loganair
Glasgow to Tiree Scottish Executive 31.03.06 Loganair
Glasgow to Barra Scottish Executive 31.03.06 Loganair
Stornoway to Benbecula CNES 31.03.06 Highland Airways
Benbecula to Barra CNES 31.03.06 Loganair
Kirkwall to Papa Westray OIC 31.03.05 Loganair
Kirkwall to Westray OIC 31.03.05 Loganair
Kirkwall to North Ronaldsay OIC 31.03.05 Loganair
Kirkwall to Eday OIC 31.03.05 Loganair
Kirkwall to Stronsay OIC 31.03.05 Loganair
Kirkwall to Sanday OIC 31.03.05 Loganair
Shetland Mainland to Foula SIC 31.03.05 Loganair
Shetland Mainland to Papa Stour SIC 31.03.05 Loganair
Shetland Mainland to Out Skerries SIC 31.03.05 Loganair
Shetland Mainland to Fair Isle SIC 31.03.05 Loganair
Shetland Mainland to Unst SIC See Notes
Page 9524 February 2005

CAP 754 UK Regional Air Services
The use of PSOs to protect a regional service to London
12 In 2004 the UK Government consulted on the criteria that it should use to triggerwhether and how to protect existing regional air services to London using the PSOmechanism.10 The CAA responded to the consultation in October 2004.11 (TheGovernment is still developing its policy following the consultation.) The CAA’s viewsare summarised below.
13 The benefits conferred by the liberalisation of aviation in Europe, both generally andin the regions, suggest that the interests of users will be best served if airlines arefree to operate air services in competition with one another according to theircommercial judgement, subject only to the application of normal competition policy.Similarly, users will tend to benefit most through airports being run on commerciallines, with their owners seeking to maximise the efficiency and commercialattractiveness of their operations.
14 There may be wider economic and social benefits from air services that cannot becaptured by the operator of the air service driven solely by the profit motive. If thesebenefits are significant, then it may be reasonable for local or national government toseek to support the service. Table 8.1 shows that in the UK, PSOs have been usedfor precisely this purpose, as these services represent lifeline routes for peripheralcommunities. PSOs are therefore, in certain circumstances, a necessary and usefultool for protecting air services to regional points, but any proposals for their extensionneed to be seen in the context of what the market has delivered already, as their usewill risk distortion to that market.
15 These considerations suggest that PSOs should be used sparingly and in tightlydefined circumstances; they should be restricted to ensuring the retention ofessential services and be regularly reviewed, to mitigate negative impacts. This isbecause PSOs can have downside effects and hidden costs. As noted above,preventing scarce slots at congested airports from being put to alternative uses, i.e.ring-fencing them, could impose a high and hidden cost on the airline industry and onthe economy generally.
16 The barrier to entry created where access to the route is limited to one airline only fora set period of time risks stunting innovation and the development of more efficientservices, new products and lower fares. It could reduce cost pressure on the airlineoperating the PSO service and so generate requirement for subsidy. Any exclusivegrant of a right to serve a route under a PSO should therefore be non-discriminatoryand transparent, with the maximum degree of contestability concurrent with ensuringthat a service can be provided. In all cases the PSO should be retendered periodically.The period should be kept short – unless there are extenuating circumstances – andthe tender process framed so as to encourage bidding and innovative solutions.
17 The Government’s consultation document did not envisage that there would be needfor subsidy on regional routes to London, but if a subsidy is paid to an airline to providea PSO service, the CAA believes that the cost should be borne by those who standto reap the wider benefits. There would then be a much greater likelihood ofdecisions on the level of subsidy taking proper account of the likely benefits of theservice.
18 EU law states that the PSO service must be vital to the economic development of theregion. The economic case for a PSO should therefore include convincing evidenceto demonstrate that all alternative options for supplying the service have been
10. This followed an announcement in “The Future of Air Transport” White Paper. 11. Available at www.caa.co.uk/docs/5/CAAResponse-DfTConsultationonProtectionofRegionalAirServicestoLondon.pdf
Page 9624 February 2005
CAP 754 UK Regional Air Services
exhausted. It is important to consider carefully in each case whether intervention isnecessary or desirable, in order to avoid excessive use of PSOs and consequent re-regulation and distortion of competition in the market for UK domestic air services,and to minimise any potential for airlines to “game” the system.
19 The Government’s consultation paper stated that the withdrawal of a service to oneLondon airport would not be enough to trigger consideration of a PSO as long as thereis an adequate overall service provided to other London airports. This will help to limitthe potential negative impacts of a proliferation of PSO routes on the mosteconomically efficient usage of slots at very constrained airports such as Heathrow.
Route Development Funds
20 Airport operators routinely offer incentives to airlines to “kick-start” the inaugurationof new routes, usually in the form of a package of discounts on airport charges ormarketing support. Some routes may also qualify for assistance from a RouteDevelopment Fund (RDF), whereby incentives are provided by regional bodies toservices that are deemed beneficial to the region’s overall economic development,encouraging inbound tourism or new business, and that meet the criteria of the fund.The funds bring together key public sector economic development stakeholders –including regional administrations, regional development agencies and tourismauthorities – in the decision-making process and allow them together to influence theair services being attracted to the region. The RDF implemented by the ScottishExecutive in 2002 has proved particularly successful in helping to attract a range ofnew direct services to Scotland, with offers having been made on 28 routes by theend of 2004 (see Case Study 13). The Government’s The Future of Air TransportWhite Paper12 subsequently invited the Welsh Assembly Government and the EnglishRegional Development Agencies to consider whether they would wish to set up anRDF to encourage the establishment of new services from regional airports in theirareas and to consider what priority they would attach to such a fund. By the end of2004, the Northern Ireland fund had announced support for seven new routes. TheNorth West Development Agency announced its intention to set up an RDF inNovember 2004, and other Regional Development Agencies and the Welsh AssemblyGovernment have also shown an interest.
21 As the White Paper made clear, any such fund needs to comply with UK and EU law,especially in respect of state aids and competition. The Government is now workingwith regional bodies to develop guidance for devolved administrations anddevelopment agencies, in the form of a protocol to which they can voluntarily adhere.The guidance will be concerned with the operation of all funds to ensure that they arecompatible with the “Manchester”13 and “Charleroi”14 decisions, and any furtherguidance the Commission may subsequently publish. The Government also aims toaddress any emerging problems with funds and to keep under review the contributionthey are making to regional economic development targets. The funds currently inoperation are subject to strict conditions and are intended to provide support forroutes that are likely to be commercially viable after the first three years. The budgetsfor these funds are spread over three years; after this period the fund managers willneed to decide whether there is a case for continuing to operate the fund, based onthe needs of the region.
12. Paragraphs 4.41 to 4.43 regarding the establishment of the Scotland and Northern Ireland funds.13. European Commission Decision of 14 June 1999, United Kingdom – Manchester Airport, State Aid NN 109/98.14. European Commission Decision of 12 February 2004, OJ L137, 30.4.2004.
Page 9724 February 2005
CAP 754 UK Regional Air Services
22 The views of the industry itself about the use of RDFs seem somewhat polarised:some regard such funds as very important, while others see them as unnecessary orpotentially distortive. Some development agencies are quite clear that an RDF is aworthwhile investment of public funds, for example because new air services thatbring wider benefits to the region are achievable for a reasonable outlay, whereasimprovements to other transport modes may be difficult to achieve. There is aconsistent view that the availability of funding – not surprisingly – should help to makethe airport more attractive to airlines. In other words, it would move the airport up the“league table” of airports in Europe for airlines (particularly no-frills airlines, but alsoother airlines – like Continental, or Emirates) that see the UK regions as a growthopportunity for new capacity coming on line. Airlines are seen as having taken all the“low-hanging fruit” routes and the decisions are now much more marginal and hencecan be swung by relatively small amounts of temporary funding. Others seem morecautious, pointing to the difficulty of ensuring RDFs will deliver value for money andconsidering whether alternative uses of the money might be more productive.
23 The financial support from an RDF will not, in isolation, be the sole reason for thedevelopment of new services. The amounts involved are relatively small, and asnoted below some services qualifying for funding have been withdrawn while othersignificant services have started without funding. Experience with the Scottish andNorthern Ireland funds suggests that the establishment of a fund, financial supportaside, may be raising the profile of the airports and region concerned, encouragingairports to be more dynamic in their marketing, and generally attracting interest fromairlines. In other words, what seems to be particularly important is that a fundrepresents a firm recognition that the airport and the region are prepared to share thefinancial risk of a new service with the airline. That seems to generate confidence inthe airline and a “feel-good” factor that spreads to other airlines and thus otherroutes, some of which do not qualify for funding but may be inspired by new routesthat do.
Page 9824 February 2005
CAP 754 UK Regional Air Services
24 The CAA believes that there are certain circumstances where using RDFs could bejustified, for example if the market is reluctant to offer a new air service because ofrisk aversion or the lack of awareness of potential. The CAA recognises the successof the Scottish and Northern Ireland funds in bringing forward new routes andchanging perceptions, although there are a number of routes from Scotland thatqualified for funding that are no longer operating. RDF funding will not necessarilygenerate a sustainable service (for example the Inverness–Stockholm service15)where other essential factors for success such as the right aircraft, fares and slottimes are not also in place. One factor that may determine the long-term viability ofa route is the amount of inbound traffic it can generate. Some routes to Scotland andNorthern Ireland that airlines see as a good commercial prospect are being startedwithout RDF funding. Examples are as Aberdeen–Heathrow (bmi), Glasgow–Philadelphia (US Airways), Belfast–Prague and Belfast–Barcelona (both Jet2.com),while easyJet’s services at Belfast are a package of funded and unfunded routes.
Case Study 13: Route Development Funds
The Scottish Route Development Fund
The fund was created by the Scottish Executive in November 2002. Its stated aim is toredress the barriers to economic growth caused by international scheduled destinationsbeing underserved from Scotland. The fund is managed by Scottish Enterprise and existsto support year-round new direct scheduled services which will bring tangible economicbenefits to Scotland, including reductions in journey times, the creation of day-return tripsto overseas destinations, stimulation of export markets, direct employment and improvedglobal connectivity. The Scottish Executive claims that the £6.8m fund (spread over threeyears) will create an estimated economic benefit of £150m over ten years and around 600tourism jobs. As of December 2004, eight different airlines were receiving support, andthere were 17 routes that had been offered funding and that were being operated or wereproposed, including eight Ryanair routes from Prestwick, and two long-haul routes that areseen as strategically very important for Scotland, Continental’s Edinburgh–Newark andEmirates’ Glasgow–Dubai services. Seven funded routes have been withdrawn – fiveroutes from Edinburgh operated by Duo (which went out of business), Edinburgh–Jersey(bmi) and Inverness–Stockholm (Snowflake).
The Northern Ireland Air Route Development Fund
The fund was launched in September 2003 and is administered by Air Route Development(NI) Ltd, a new company set up by Invest NI. The £4m fund provides investment support tolocal commercial airports for up to three years. It is aimed at helping the airports to reducethe costs of landing charges on new routes that are shown to be of net economic benefit toNorthern Ireland. As of December 2004, seven routes have been offered RDF funding,including Continental’s Belfast International–Newark service and easyJet services to Paris,Nice and Geneva.
The North West Air Services Development Fund
The Air Services Development Fund is the first English regional fund. It was launched bythe North West Regional Development Agency in November 2004 for an initial three-yearperiod starting in April 2005.
Source: relevant websites and CAA discussions with the fund managers.
15. See Case Study 3 in Chapter 4.
Page 9924 February 2005
CAP 754 UK Regional Air Services
25 Moreover, financial support could have the undesirable effect of:
• replacing private sector funds with public sector funds to the detriment of thetaxpayer and to the benefit of the airline;
• encouraging airlines to operate routes that are not actually commercially viable,such that when the funding dries up either the route is discontinued or the airline’sfinancial position is more precarious – including:
• the use of (perhaps spare) aircraft that are too big for the likely traffic demand;
• encouraging small airlines to over-expand;
• discouraging other airlines from entering the market in competition with asubsidised service;
• potentially creating a “race to subsidy” as each region seeks to outbid its rivals inattracting air services using public funds;
• encouraging gaming behaviour by airlines or airports to gain the benefit of subsidy.
26 Regional bodies contacted during research for this study were aware of the potentialfor displacement, gaming and subsidy races, and the existing criteria for the Scottishand Northern Irish schemes are designed to try to reduce these risks. Similarly, theGovernment is clearly aware of these same issues and its ongoing work in developinga protocol for the use of RDFs is welcome.
27 With this in mind, any support should be based on non-discriminatory criteria andopen to any airline. It should be no more than is necessary to kick-start a route andsupport it for a short period while it becomes established. In other words, it shouldaccelerate development of a route that might otherwise have been a marginaldecision.
28 As with PSOs, the CAA recognises that there may be positive externalities connectedto the provision of regional air services, and because these may not be capturedthrough the decisions of airlines based solely on the profit motive, this may justifyfinancial support in some way. The support should be provided by those benefitingfrom the positive externalities arising from the service (i.e. regional stakeholders) sothat they will accurately price the value of the service and expose what they are trulywilling to pay for. A properly run RDF should be a way of sharing the start-up riskamong the airline, airport and region.
29 The CAA does however suggest a cautious approach to the use of RDFs. Thereremains a need to avoid excessive use of subsidies because of the potential marketdistortions this could create; and it will be important that decisions on RDFs are takenagainst the backdrop of the overall growth in unsupported services from regionalairports, which suggests that the market can, in the main, work well without publicintervention.
30 Any policies put in place should seek to minimise these downside risks – and mustnot infringe European state aid rules. The role of central Government in relation toRDFs, as set out in The Future of Air Transport White Paper, should primarily befacilitative and focused on providing guidance on such legal issues.
Page 10024 February 2005
CAP 754 UK Regional Air Services
Chapter 9 Conclusions
1 The foregoing analysis of data, and interviews with industry, shows that UK regionalair services are in a good state of health and have enjoyed a period of substantial andsustained growth in recent years, although there are variations between regions.
2 The growth in UK regional air services has been fuelled by liberalisation of the EUaviation market from 1993, which provided opportunities for new entry, particularlyfrom no-frills airlines. The greater competition this has brought has in turn drivenlower fares, shorter journey times, other innovations and stimulation of passengerdemand. Airlines and airports are now more fully promoting the attractiveness ofregional services and exploiting the propensity to fly of passengers in the localcatchment areas. A rich mix of short-haul airlines serving a wide range of UK regionalairports has developed, offering a range of different products.
3 The growth story includes big increases in the numbers of passengers travelling toand from UK regional airports, and also in the number of destinations (including“business” destinations) being served. All of this is good news for consumers, forbusiness, for the regional economies, and for the UK as a whole; and it brings theadditional benefit of reducing the pressure on overstretched London infrastructure asmore passengers make use of direct services from their local airport rather thantravelling through London.
4 The growth in international services from the regions has primarily been in the short-haul market, but there are some signs of an increase in long-haul services fromregional airports. Long-haul services from regional airports are, however, always likelyto be more limited by the absolute size of catchment areas and the need for feedtraffic to make them commercially viable – something that a true hub airport can offerbut is harder for regional airports to match. An interesting development is the use ofsmaller narrowbody aircraft for services to the US from airports like Bristol and Belfast– paralleling the trend in the last 10 years for full-service airlines to operate 50-seatregional jets on some relatively long, thin short-haul routes.
5 In response to these changing market conditions in the airline sector, regional airportshave themselves changed the way they conduct their business. They appear to beadopting a more commercially focused approach, seeking to maximise non-aviationrevenues in order to price their landing fees competitively and improve their facilities,attract services to their airport and realise the full potential of their business and theregional economy. There appears to be a greater propensity for some airlines toswitch operations between UK airports than before, suggesting that in certaincircumstances, for some airports at least, there may be a shift in the balance of powerbetween the airport and the airline.
6 The perception of regional airports as a place to do business has improvedsignificantly since the early 1990s as the success of new entrants has demonstratedtheir commercial potential and as regional airports have successfully marketedthemselves. However, there may be some residual problems regarding the low publicprofile of some regional airports among potential airline customers.
7 Access to Heathrow remains an important issue for regional airports and regionaleconomic development, and in particular for passengers wishing to connect to otherservices. There has been some reduction in services between UK regional airportsand Heathrow over the past decade. However, overall, London is better served fromthe regions than in the past, with more services at Gatwick, Stansted, Luton andLondon City that numerically much more than offset the loss of Heathrow services.
Page 10124 February 2005
CAP 754 UK Regional Air Services
In addition, links to other European hubs from regional airports can provide analternative means of making connections, and survey data suggests that passengersmay also be using Stansted for connections to the no-frills short-haul network there.
8 The main physical constraint cited by industry representatives was the availability ofslots at congested airports, particularly Heathrow. The introduction of a formalisedmarket in slots seems the best way of dealing with the problem of allocating scarcecapacity at congested airports such as Heathrow and could make it easier for UK-based airlines to expand their portfolios, thus reducing the pressure on regionalservices. It might also provide opportunities for non-airline ownership of slots.
9 There are some arguments for initial, limited support for new services to regionalairports (including overcoming information and perception problems) and there issome evidence from Northern Ireland and Scotland that public funding via RouteDevelopment Funds can bring forward new services. However, this sort of supportshould continue to be used cautiously and against strict and transparent criteria.
10 Imposing Public Service Obligations may also in some cases be appropriate tomaintain essential air services providing they are used sparingly, in tightly definedcircumstances, and are regularly reviewed, to mitigate negative impacts. Preventingscarce slots at congested airports from being put to alternative uses, i.e. ring-fencingthem, could impose a high and hidden cost on the airline industry and on the economygenerally.
11 The challenge for Government, regional bodies and the aviation industry would appearto be how best to ensure a continuation of what has largely been a success story inthe regions, delivered through the normal workings of the market, and removingresidual regulatory impediments. The policy position in relation to liberalising fifth-freedom (or indeed other) traffic rights available to overseas airlines from UK regionalairports may be an example of the latter.
12 Connectivity of UK regions to key domestic and international destinations contributesto their growth potential, and air transport is the main conduit for this. Over the lasttwo decades there has been a massive improvement in this connectivity, deliveringdirect benefits to passengers and, potentially, wider economic benefits to the UKregions. This has been almost entirely delivered by the market responding to theincentives created through liberalisation. Policy makers at all levels should seek towork with the grain of the commercial incentives that have driven the success of UKregional air services so far.
Page 10224 February 2005