CancerExosomesPerform Cell-IndependentMicroRNA.pdf
15
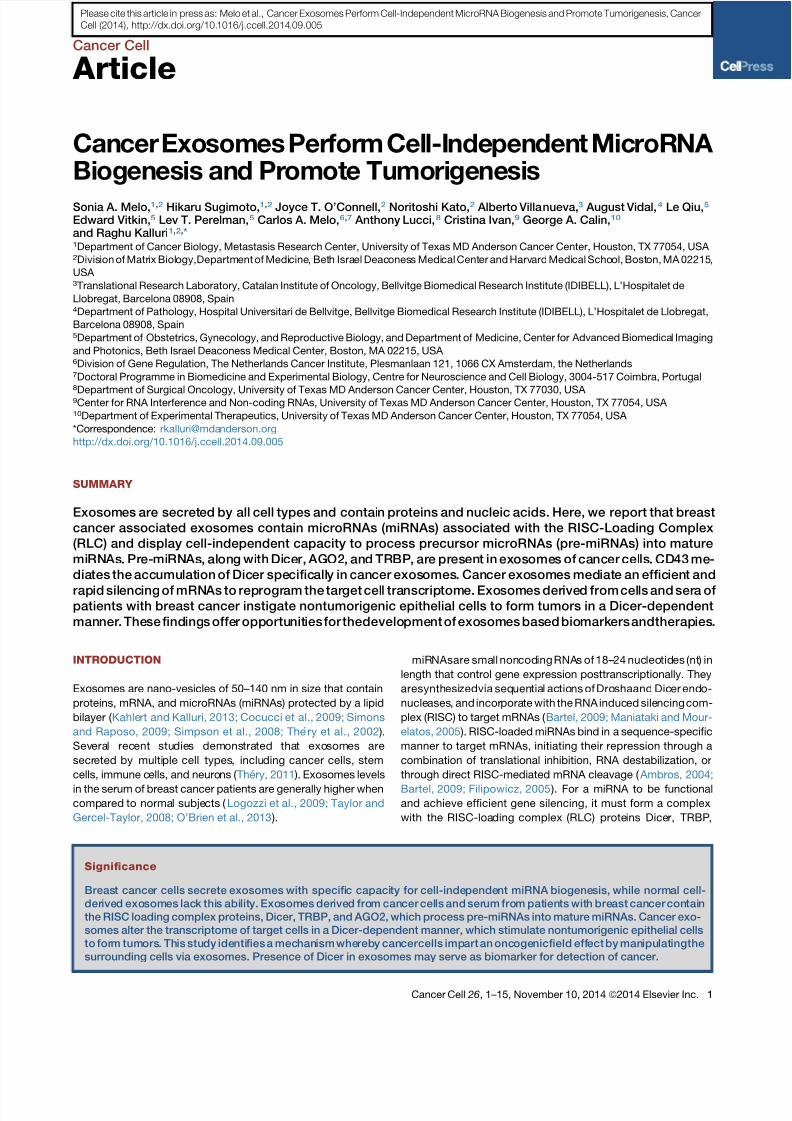
Cancer Cell Article Can cer Exosomes Perform Cell-I nde pendent Mic roRNA Bi og enes is and Promote Tu mori ge nesis Sonia A. Melo, 1,2 Hikaru Sugimoto, 1,2 Joyce T. O’Connell, 2 Noritoshi Kato, 2 Alberto Villa nueva, 3 August Vidal, 4 Le Qiu, 5 Edward Vitkin, 5 Lev T. Perelman, 5 Carlos A. Melo, 6,7 Anthony Lucci, 8 Cristina Ivan, 9 George A. Calin, 10 and Raghu Kalluri 1,2, * 1 Department of Cancer Biology, Metastasis Research Center, University of Texas MD Anderson Cancer Center, Houston, TX 77054, USA 2 Division of Matr ix Biology,Department of Medi cine , Beth Israel Deac ones s Medical Cent er and Harv ard Medical School, Boston, MA 02215, USA 3 Translational Research Laboratory, Catalan Institute of Oncology, Bellvitge Biomedical Research Institute (IDIBELL), L’Hospitalet de Llobregat, Barcelona 08908, Spain 4 Department of Pathology, Hospital Universitari de Bellvitge, Bellvitge Biomedical Research Institute (IDIBELL), L’Hospitalet de Llobregat, Barcelona 08908, Spain 5 Departme nt of Obstetrics, Gynecology, and Reproductive Biology, and Department of Medicine, Center for Advanced Biomedica l Imaging and Photonics, Beth Israel Deaconess Medical Center, Boston, MA 02215, USA 6 Division of Gene Regulation, The Netherlands Cancer Institute, Plesmanlaan 121, 1066 CX Amsterdam, the Netherlands 7 Doctoral Programme in Biomedicine and Experimental Biology, Centre for Neuroscience and Cell Biology, 3004-517 Coimbra, Portugal 8 Department of Surgical Oncology, University of Texas MD Anderson Cancer Center, Houston, TX 77030, USA 9 Center for RNA Interference and Non-coding RNAs, University of Texas MD Anderson Cancer Center, Houston, TX 77054, USA 10 Department of Experimental Therapeutics, University of Texas MD Anderson Cancer Center, Houston, TX 77054, USA *Correspondence: rkalluri@mda nderson.org http://dx.doi.org/10.1016/j.ccell.2014.09.005 SUMMARY Exosomes are secret ed by all cell types and contai n proteins and nucleic acids. Here, we report that breast cancer associated exosomes contain microRNAs (miRNAs) associated with the RISC-Loading Complex (RLC) and display cell-independent capacity to process precursor microRNAs (pre-miRNAs) into mature mi RNAs. Pr e-mi RNAs, al ong wi th Di cer, AGO2, and TRBP, are present in exosomes of cancer cel ls. CD43 me- diates the accumulationof Dicer spe ci ficall y in cancer exos omes . Can cer exosomes mediat e an effic ient and rapid sil enc ing of mRNAs to reprogr am the tar get cel l transcriptome. Exosomes der ived from cel ls and ser a of patients with breast cancer instigate nontumorigenic epithelial cells to form tumors in a Dicer-dependent manner. These findings offe r opportu nit ies for thedevelo pment of exosomes based biomark ers andtherapies . INTRODUCTION Exosomes are nano-vesicles of 50–140 nm in size that contain proteins, mRNA, and microRNAs (miRNAs) protected by a lipid bilayer ( Kahlert and Kalluri, 2013; Cocucci et al., 2009; Simons and Raposo, 2009; Simpson et al., 2008; The ´ ry et al., 2002 ). Sev era l rec ent stu die s demons tra ted tha t exo somes are secr eted by multi ple cell types , inclu ding cancer cells, stem cells, immune c ells, and neuro ns ( The ´ ry, 2011 ). Exosomes levels in the serum of breast cancer patients are generally higher when comp ared to norma l subje cts ( Logozzi et al., 2009; Taylor and Gercel-Taylor, 2008; O’Brien et al., 2013 ). miRNAsare sma ll non cod ing RNA s of 18–24 nucleo tid es (nt) in length that control gene expression posttranscriptionally. They aresynthesi zedvia seq uen tia l actio ns of Dro shaand Dic er end o- nucleases, and incor pora te with the RNA induced sile ncing com- plex (RISC) to target mRNAs ( Bartel, 2009; Maniataki and Mour- elatos, 2005 ). RISC-loaded miRNAs bind in a sequence-specific manner to target mRNAs, initiating their repression through a combination of translational inhibition, RNA destabilization, or through direct RISC-mediated mRNA cleavage ( Ambros, 2004; Bartel, 2009; Filipowicz, 2005 ). For a miRNA to be functional and achieve efficient gene silencing, it must form a complex with the RISC-loa ding complex (RLC) prote ins Dice r, TRBP, Significance Breast cancer cells secrete exosomes with specifi c capaci ty for cell-inde pendent miRNA biogene sis, while normal cell- der ived exosomes lack thi s abilit y. Exosomes der ived fro m cancer cells and ser um from patien ts wit h breast can cer con tai n the RISC loading complex proteins, Dicer, TRBP, and AGO2, which process pre-miRNAs into mature miRNAs. Cancer exo- somes alter the transcriptome of target cells in a Dicer-dependent manner, which stimulate nontumorigenic epithelial cells to for m tumors. This study identi fies a mechanism whe reby cancercellsimpartanonc oge nicfield eff ectbymanipulatingthe surrounding cells via exosomes. Presence of Dicer in exosomes may serve as biomarker for detection of cancer. Cancer Cell 26, 1–15, November 10, 2014 ª2014 Elsevier Inc. 1 Please cite this article in press as: Melo et al., Cancer Exosomes Perform Cell-Independent MicroRNA Biogenesis and Promote Tumorigenesis, Cancer Cell (2014), http://dx.doi.org/10. 1016/j.ccell.2014.09.005
-
Upload
rui-freitas -
Category
Documents
-
view
213 -
download
0
Transcript of CancerExosomesPerform Cell-IndependentMicroRNA.pdf
8/9/2019 CancerExosomesPerform Cell-IndependentMicroRNA.pdf
http://slidepdf.com/reader/full/cancerexosomesperform-cell-independentmicrornapdf 1/15
Cancer Cell
Article
CancerExosomes Perform Cell-Independent MicroRNA Biogenesis and Promote Tumorigenesis
Sonia A. Melo,1,2 Hikaru Sugimoto,1,2 Joyce T. O’Connell,2 Noritoshi Kato,2 Alberto Villanueva,3 August Vidal,4 Le Qiu,5
Edward Vitkin,5 Lev T. Perelman,5 Carlos A. Melo,6,7 Anthony Lucci,8 Cristina Ivan,9 George A. Calin,10
and Raghu Kalluri1,2,*1Department of Cancer Biology, Metastasis Research Center, University of Texas MD Anderson Cancer Center, Houston, TX 77054, USA 2Division of Matrix Biology,Department of Medicine, Beth Israel Deaconess Medical Center and Harvard Medical School, Boston, MA 02215,
USA 3Translational Research Laboratory, Catalan Institute of Oncology, Bellvitge Biomedical Research Institute (IDIBELL), L’Hospitalet de
Llobregat, Barcelona 08908, Spain4Department of Pathology, Hospital Universitari de Bellvitge, Bellvitge Biomedical Research Institute (IDIBELL), L’Hospitalet de Llobregat,
Barcelona 08908, Spain5Department of Obstetrics, Gynecology, and Reproductive Biology, and Department of Medicine, Center for Advanced Biomedical Imaging
and Photonics, Beth Israel Deaconess Medical Center, Boston, MA 02215, USA 6Division of Gene Regulation, The Netherlands Cancer Institute, Plesmanlaan 121, 1066 CX Amsterdam, the Netherlands7Doctoral Programme in Biomedicine and Experimental Biology, Centre for Neuroscience and Cell Biology, 3004-517 Coimbra, Portugal8
Department of Surgical Oncology, University of Texas MD Anderson Cancer Center, Houston, TX 77030, USA 9Center for RNA Interference and Non-coding RNAs, University of Texas MD Anderson Cancer Center, Houston, TX 77054, USA 10Department of Experimental Therapeutics, University of Texas MD Anderson Cancer Center, Houston, TX 77054, USA
*Correspondence: [email protected]
http://dx.doi.org/10.1016/j.ccell.2014.09.005
SUMMARY
Exosomes are secreted by all cell types and contain proteins and nucleic acids. Here, we report that breast
cancer associated exosomes contain microRNAs (miRNAs) associated with the RISC-Loading Complex
(RLC) and display cell-independent capacity to process precursor microRNAs (pre-miRNAs) into mature
miRNAs. Pre-miRNAs, along with Dicer, AGO2, and TRBP, are present in exosomes of cancer cells. CD43 me-
diates the accumulation of Dicer specifically in cancer exosomes. Cancer exosomes mediate an efficient and
rapid silencing of mRNAs to reprogram the target cell transcriptome. Exosomes derived from cells and sera of patients with breast cancer instigate nontumorigenic epithelial cells to form tumors in a Dicer-dependent
manner. These findings offer opportunities for thedevelopment of exosomes based biomarkers andtherapies.
INTRODUCTION
Exosomes are nano-vesicles of 50–140 nm in size that contain
proteins, mRNA, and microRNAs (miRNAs) protected by a lipid
bilayer ( Kahlert and Kalluri, 2013; Cocucci et al., 2009; Simons
and Raposo, 2009; Simpson et al., 2008; The ry et al., 2002 ).
Several recent studies demonstrated that exosomes are
secreted by multiple cell types, including cancer cells, stem
cells, immune cells, and neurons ( The ry, 2011 ). Exosomes levels
in the serum of breast cancer patients are generally higher whencompared to normal subjects ( Logozzi et al., 2009; Taylor and
Gercel-Taylor, 2008; O’Brien et al., 2013 ).
miRNAsare small noncoding RNAs of 18–24 nucleotides (nt) in
length that control gene expression posttranscriptionally. They
aresynthesizedvia sequential actions of Droshaand Dicer endo-
nucleases, and incorporate with the RNA induced silencing com-
plex (RISC) to target mRNAs ( Bartel, 2009; Maniataki and Mour-
elatos, 2005 ). RISC-loaded miRNAs bind in a sequence-specific
manner to target mRNAs, initiating their repression through a
combination of translational inhibition, RNA destabilization, or
through direct RISC-mediated mRNA cleavage ( Ambros, 2004;
Bartel, 2009; Filipowicz, 2005 ). For a miRNA to be functionaland achieve efficient gene silencing, it must form a complex
with the RISC-loading complex (RLC) proteins Dicer, TRBP,
Significance
Breast cancer cells secrete exosomes with specific capacity for cell-independent miRNA biogenesis, while normal cell-
derived exosomes lack this ability. Exosomes derived from cancer cells and serum from patients with breast cancer contain
the RISC loading complex proteins, Dicer, TRBP, and AGO2, which process pre-miRNAs into mature miRNAs. Cancer exo-
somes alter the transcriptome of target cells in a Dicer-dependent manner, which stimulate nontumorigenic epithelial cells
to form tumors. This study identifies a mechanism whereby cancercells impart an oncogenicfield effect by manipulatingthe
surrounding cells via exosomes. Presence of Dicer in exosomes may serve as biomarker for detection of cancer.
Cancer Cell 26, 1–15, November 10, 2014 ª2014 Elsevier Inc. 1
Please cite this article in press as: Melo et al., Cancer Exosomes Perform Cell-Independent MicroRNA Biogenesis and Promote Tumorigenesis, Cancer
Cell (2014), http://dx.doi.org/10.1016/j.ccell.2014.09.005

8/9/2019 CancerExosomesPerform Cell-IndependentMicroRNA.pdf
http://slidepdf.com/reader/full/cancerexosomesperform-cell-independentmicrornapdf 2/15
8/9/2019 CancerExosomesPerform Cell-IndependentMicroRNA.pdf
http://slidepdf.com/reader/full/cancerexosomesperform-cell-independentmicrornapdf 3/15
and AGO2. Within the RLC, Dicer and TRBP process precursor
miRNAs(pre-miRNAs) after they emergefrom thenucleus viaex-
portin-5, to generate miRNAs and associate with AGO2. AGO2
bound to the mature miRNA constitutes the minimal RISC and
may subsequently dissociate from Dicer and TRBP ( Chendri-mada et al., 2005; Gregory et al., 2005; Haase et al., 2005; Ma-
cRae et al., 2008; Maniataki and Mourelatos, 2005; Melo et al.,
2009 ). Single-stranded miRNAs by themselves incorporate into
RISC very poorly and therefore cannot be efficiently directed to
target mRNAs for posttranscriptional regulation ( Tang, 2005;
Thomson et al., 2013 ). Nonetheless, several reports suggest
that miRNAs contained in exosomes can influence gene expres-
sion in target cells ( Ismailet al., 2013; Kogure et al., 2011; Kosaka
et al., 2013; Narayanan et al., 2013; Pegtel et al., 2010; Valadi
et al., 2007; Zhang et al., 2010 ). Drosha and Dicer are present
in exosomes from cell culture supernatants from HIV-1 infected
cells and HIV patient sera ( Narayanan et al., 2013 ). Cofractiona-
tion of Dicer, TRBP, and AGO2 in late endosome/ multivesicular
bodies(MVBs) is also observed ( Shenet al., 2013 ). These studiesreflect the need to evaluate the functional contribution of miRNA
machinery proteins in exosomes and their role in tumor
progression.
RESULTS
Isolation and Identification of Exosomes
Exosomes from cancer cells (MDA-MB-231 triple negative hu-
man metastatic breast carcinoma, MCF7 human breast adeno-
carcinoma, 67NR mouse nonmetastatic mammary carcinoma,
and 4T1 mouse metastatic mammary carcinoma) and control
cells (MCF10A nontumorigenic human mammary epithelial cells
and NMuMG nontumorigenic mouse mammary epithelial cells)
were isolated using established ultracentrifugation methods
( Figure S1 A available online; see Supplemental Experimental
Procedures ) ( Luga et al., 2012; The ry et al., 2006 ). The harvested
exosomes were analyzed by transmission electron microscopy
(TEM) and atomic force microscopy (AFM). Particles between
50–140 nm were identified ( Figures 1 A and 1B) ( The ry et al.,
2002 ). The average size observed in 112 captured images by
TEM was 108 ± 6 nm and by AFM was 112 ± 5 nm ( Figures 1 A
and 1B, graphs). The identity of the exosomes was confirmed
through detection of TSG101, CD9, and CD63, three exosomes
markers ( Figure S1B) ( The ry et al., 2006 ). The isolated exosomes
were also positive for the CD9 marker by immunogold TEM ( Fig-ure 1 A, lower right panel). Exosomes coupled to latex beads
were analyzed by flow cytometry, showing expression of CD9,
flotillin1, CD63, and TSG101, the commonly used exosomes
markers ( Figure S1C). Light scattering spectroscopy (LSS)
( Fang et al., 2007; Itzkan et al., 2007 ) was used to show that
the isolated samples reveal a tight size distribution with a
mode value peaking at 104 nm ( Figure S1D). LSS also excluded
potential microvesicles and bacterial or cellular debris contami-
nation ( Figure S1D). In agreement with LSS data, the NanoSight
nanoparticle tracking analysis for MCF10A, MCF7, MDA-MB-
231, 67NR, 4T1, and NMuMG exosomes revealed an average
of the mode value of 103 ± 5 nm ( Figure S1E). Based on LSS
and NanoSight analysis, the most prevalent population of parti-
cles in solution ranged in size from 89 to 118 nm in diameter ( Fig-ures S1D and S1E). Colorimetric cell viability assay (Thiazolyl
blue tetrazolium bromide [MTT]), terminal deoxynucleotidyl
transferase dUTP nick end labeling (TUNEL) assay, flow cytom-
etry analysis for Anexin V using propidium iodide, and cyto-
chrome C immunoblots ( Figures S1F–S1I) were used to demon-
strate the viability of cells prior to exosomes extraction to
exclude apoptotic bodies or random cell debris. Exosomes iso-
lated from cancer cells are collectively termed as cancer
exosomes, whereas exosomes isolated from control cells are
collectively termed normosomes.
Cancer Exosomes Are Specifically Enriched in
MicroRNAs
The global miRNA content of cancer exosomes and normo-
somes was investigated. A low correlation between the levels
of expression of miRNAs in normosomes and cancer exosomes
was observed (MCF10A versus MCF-7:r = 0.56; MCF10A versus
MDA-MB-231:r = 0.39; and NMuMG versus 4T1:r = 0.40) ( Fig-
ure 1C), while correlation levels among normosomes and among
cancer exosomes was generally higher despite their species
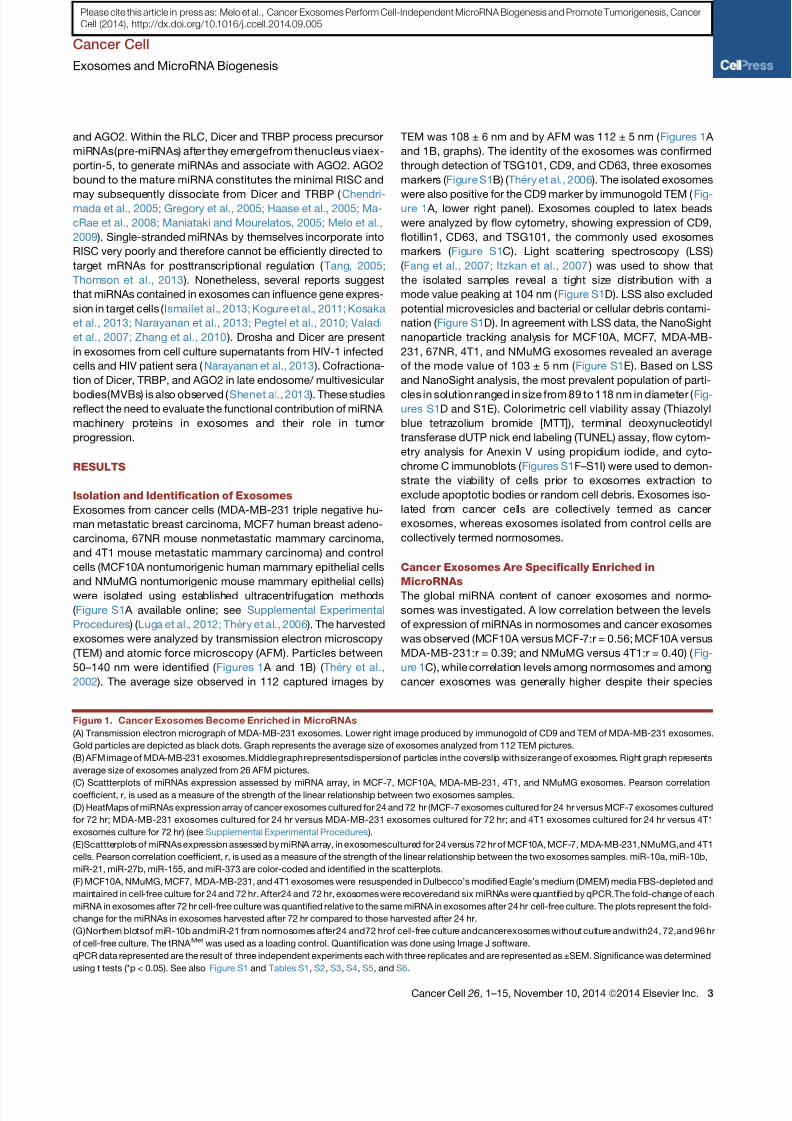
Figure 1. Cancer Exosomes Become Enriched in MicroRNAs
(A) Transmission electron micrograph of MDA-MB-231 exosomes. Lower right image produced by immunogold of CD9 and TEM of MDA-MB-231 exosomes.
Gold particles are depicted as black dots. Graph represents the average size of exosomes analyzed from 112 TEM pictures.
(B) AFM image of MDA-MB-231 exosomes.Middle graph representsdispersion of particles in the coverslip with size range of exosomes. Right graph represents
average size of exosomes analyzed from 26 AFM pictures.
(C) Scattterplots of miRNAs expression assessed by miRNA array, in MCF-7, MCF10A, MDA-MB-231, 4T1, and NMuMG exosomes. Pearson correlationcoefficient, r, is used as a measure of the strength of the linear relationship between two exosomes samples.
(D) HeatMaps of miRNAs expression array of cancer exosomes cultured for 24 and 72 hr (MCF-7 exosomes cultured for 24 hr versus MCF-7 exosomes cultured
for 72 hr; MDA-MB-231 exosomes cultured for 24 hr versus MDA-MB-231 exosomes cultured for 72 hr; and 4T1 exosomes cultured for 24 hr versus 4T1
exosomes culture for 72 hr) (see Supplemental Experimental Procedures ).
(E)Scattterplots of miRNAs expression assessed by miRNA array, in exosomescultured for 24 versus 72 hr of MCF10A, MCF-7, MDA-MB-231,NMuMG,and 4T1
cells. Pearson correlation coefficient, r, is used as a measure of the strength of the linear relationship between the two exosomes samples. miR-10a, miR-10b,
miR-21, miR-27b, miR-155, and miR-373 are color-coded and identified in the scatterplots.
(F) MCF10A, NMuMG, MCF7, MDA-MB-231, and 4T1 exosomes were resuspended in Dulbecco’s modified Eagle’s medium (DMEM) media FBS-depleted and
maintained in cell-free culture for 24 and 72 hr. After24 and 72 hr, exosomes were recoveredand six miRNAs were quantified by qPCR.The fold-change of each
miRNA in exosomes after 72 hr cell-free culture was quantified relative to the same miRNA in exosomes after 24 hr cell-free culture. The plots represent the fold-
change for the miRNAs in exosomes harvested after 72 hr compared to those harvested after 24 hr.
(G)Northern blotsof miR-10b andmiR-21 from normosomes after24 and72 hrof cell-free culture andcancerexosomes without culture andwith24, 72,and 96 hr
of cell-free culture. The tRNA Met was used as a loading control. Quantification was done using Image J software.
qPCR data represented are the result of three independent experiments each with three replicates and are represented as ±SEM. Significance was determined
using t tests (*p < 0.05). See also Figure S1 and Tables S1, S2, S3, S4, S5, and S6.
Cancer Cell
Exosomes and MicroRNA Biogenesis
Cancer Cell 26, 1–15, November 10, 2014 ª2014 Elsevier Inc. 3
Please cite this article in press as: Melo et al., Cancer Exosomes Perform Cell-Independent MicroRNA Biogenesis and Promote Tumorigenesis, Cancer
Cell (2014), http://dx.doi.org/10.1016/j.ccell.2014.09.005
8/9/2019 CancerExosomesPerform Cell-IndependentMicroRNA.pdf
http://slidepdf.com/reader/full/cancerexosomesperform-cell-independentmicrornapdf 4/15
differences (MCF10A versus NMuMG [normal exosomes]:r =
0.83; MDA-MB-231 versus 4T1:r = 0.64; MDA-MB-231 versus
MCF7:r = 0.52; and MFC7 versus 4T1:r = 0.55). We observed
an overall enrichment of miRNAs in cancer exosomes (MCF7,
MDA-MB-231, and 4T1) when compared with normosomes(MCF10A andNMuMG) ( Figure 1C; Tables S1, S2, and S3 ). Inter-
estingly, breast cancer exosomes derived from metastatic
breast cancer cells, MDA-MB-231 and 4T1, show higher enrich-
ment in miRNAs when compared to breast cancer exosomes
derived from nonmetastatic breast cancer cells, MCF7 ( Fig-
ure 1C; Tables S1, S2, and S3 ). Enrichment of miRNAs in
MDA-MB-231, MCF7, and 4T1 exosomes was not a mere reflec-
tion of an increase in total miRNAs in cancer cells, since these
cancer cells actually exhibited a lower amount of total small
RNAs when compared to nontumorigenic cells ( Figure S2 A).
MCF7-, MDA-MB-231-, and 4T1-derived exosomes exhibit an
enrichment of miRNAs when compared to cells of origin (MCF7
exos versus MCF7 cells r = 0.566; MDA-MB-231 exos versus
MDA-MB-231 cells r = 0.574; and 4T1 exos versus 4T1 cells 4 =0.644). While MCF10A- and NMuMG-derived exosomes reveal
lower amounts of miRNAs when compared to the cells
(MCF10A exos versus MCF10A cells r = 0.425 and NMuMG
exos versus NMuMG cells r = 0.4283) ( Figure S2B).
We used a cell-free culture system to determine the expres-
sion of miRNAs in exosomes at different time points of culture.
Purified exosomes were placed in fetal bovine serum (FBS)-
depleted culture media and incubated for 24 and 72 hr at 37C
(see Supplemental Experimental Procedures for details). After
the incubation period, exosomes were profiled by miRNA
expression arrays ( Figures 1D and 1E). Cancer exosomes
cultured for 72 hr showed an enrichment of miRNAs when
compared to cancer exosomes cultured for 24 hr ( Figure 1D; Ta-
bles S4, S5, and S6 ). On the contrary, normosomes did not show
significant differences in miRNAs expression after 72 hr of cul-
ture (MCF10A:r = 0.9145; NMuMG:r = 0.9327; MCF7:r =
0.5782; MDA-MB-231:r = 0.5087; and4T1:r = 0.4833; Figure 1E).
As proof of concept, a set of miRNAs (miR-10a, miR-10b, miR-
21, miR-27a, miR-155, and miR-373) that were increased in can-
cer exosomes after 72h of culture were used for further analysis
( Figure 1E). This set was selected because they were signifi-
cantly upregulated after 72 hr of culture, and each has been
extensively implicated in cancer progression ( Figure S2C; see
color-coded miRNAs in scatterplots; Tables S4, S5, and S6 ). A
striking upregulation of the six analyzed miRNAs was observed
exclusively in cancer exosomes cultured for 72 hr when
compared to cancer exosomes cultured for 24 hr, with anaverage fold-change of 17.6 for MDA-MB-231-derived exo-
somes, 4.5 for MCF-7-exosomes, and 13.2 for 4T1-derived can-
cer exosomes. ( Figure 1F). In contrast, the miRNA content of
normosomes wasnot significantly affected over time ( Figure 1F).
When the miRNA content of MDA-MB-231, MCF-7, and 4T1
cancer exosomes was compared to that of normosomes from
MCF10A and NMuMG cells, an enrichment was observed in all
six miRNAs in cancer exosomes cultured for 24 hr with an
average fold-change of 2.7, 1.7, and 2.0, respectively ( Fig-
ure S2D). At the 72 hr time point, an average fold-change of
30, 4.5, and 18.2 was detected in the six miRNAs in MDA-
MB231, MCF-7, and 4T1 derived cancer exosomes, respec-
tively, when compared to MCF10A and NMuMG derived normo-
somes ( Figure S2D). Northern blots confirmed the upregulation
of miR-10b and miR-21 exclusively in cancer exosomes, lending
additional support to the miRNA array expression data and the
quantitative PCR (qPCR) analyses ( Figure 1G).
Cancer Exosomes Contain Pre-MicroRNAs, and the
Core RNA Induced Silencing Complex-Loading Complex
Proteins
The data suggested active miRNA biogenesis in exosomes.
Therefore, the potential presence of pre-miRNAs in normosomes
and cancer exosomes was explored. Cell-free culture of exo-
somes 24 or 72 hr after their isolation was performed, and the
exosomes subjected to RNase treatment for the depletion of
any possible extra-exosomal RNA. This was followed by the
detection of the six pre-miRNAs in the exosomes corresponding
to the mature miRNAs previously evaluated ( Figure S2E).
All six pre-miRNAs analyzed were present in exosomes (nor-
mosomes and cancer exosomes) ( Figures 2 A and S2E). A signif-
icant downregulation of pre-miRNAs was observed in cancerexosomesculturedfor 72 hr whencompared to cancer exosomes
cultured for 24 hr. No variation of pre-miRNAs was observed in
normosomes ( Figure 2B). Downregulation of pre-miRNAs in can-
cer exosomes was further confirmed by northern blot for pre-
miR10b and pre-miR21 ( Figure 2C). Next, a time-course analysis
of pre-miRNAs and miRNAs in exosomes was performed. We
cultured isolated cancer exosomes for 6, 12, 24, 36, 48, 72, and
96 hr and observed that the levels of the six pre-miRNAs were
inversely proportional to their respective miRNAs ( Figure 2D).
MaturemiRNAsincreasedin quantitybetween24 and72 hr ofcul-
ture, after which they reached a plateau ( Figure 2D).
To understand why the processing of pre-miRNAs in cultured
exosomes is delayed by 24 hr, we monitored miR-21 and miR-
155 in MDA-MB-231 cells that were silenced for exportin-5
( XPO5 ) ( Figure S2F). XPO5 is responsible for the transport of
pre-miRNAs from the nucleus to the cytoplasm ( Yi et al., 2003;
Melo et al., 2010 ). Silencing XPO5 prevents the flow of pre-
miRNAs from the nucleus to the cytoplasm, allowing for an eval-
uation of cytoplasmic pre-miRNA processing ( Figures S2F and
S2G). miRNA-21 and -155 were monitored in MDA-MB-
231si XPO5 cells before and after centrifugation ( Figure S2G),
which occurred at 4C for 3 hr to mimic the conditions of exo-
somes isolation (see Supplemental Experimental Procedures ).
Both miR-21 and miR-155 present a lag phase of processing in
centrifuged cells ( Figure S2G). For the cells to accomplish a 2-
fold increase of miR-21, 8 hr are enough, while centrifuged cells
take about 24 hr for the same fold increase ( Figure S2G). Thesame holds true for mir-155 that takes about 10 hr to reach
2-fold increase, while centrifuged cells take 27 hr for the same
fold increase ( Figure S2G). Therefore, exosomes require a
certain period of acclimatization that is already expected for re-
coveryof enzymatic activities in cultured cells after tissue culture
passage.
miRNA biogenesis requires key protein components of the
RLC, Dicer, TRBP, and AGO2 ( Chendrimada et al., 2005 ). Dicer
andTRBP form a complex that stabilizes Dicer,while AGO2 is re-
cruited later in the biogenesis pathway for strand selection and
the RNA unwinding process ( Chendrimada et al., 2005 ). Dicer
was detected in exosomes derived from MCF7, MDA-MB231,
67NR, and 4T1 cells ( Figures 3 A, 3B, and S3 A). All exosomes
Cancer Cell
Exosomes and MicroRNA Biogenesis
4 Cancer Cell 26, 1–15, November 10, 2014 ª2014 Elsevier Inc.
Please cite this article in press as: Melo et al., Cancer Exosomes Perform Cell-Independent MicroRNA Biogenesis and Promote Tumorigenesis, Cancer
Cell (2014), http://dx.doi.org/10.1016/j.ccell.2014.09.005
8/9/2019 CancerExosomesPerform Cell-IndependentMicroRNA.pdf
http://slidepdf.com/reader/full/cancerexosomesperform-cell-independentmicrornapdf 5/15
preparations were treated with proteinase K before exosomal
protein extraction, as previously described ( Montecalvo et al.,
2012 ) ( Figures 3 A, 3B, and S3 A). Dicer was not detected in nor-
mosomes produced by MCF10A and NMuMG cells ( Figures 3 A and S3 A). Immunogold labeling of exosomes using TEM
confirmed that Dicer was present in cancer exosomes, but not
in normosomes ( Figures 3B and S3B). The use of an anti-GFP
antibody as negative control failed to detect any gold particles
by immunogold TEM ( Figure S3C).
Dicer was overexpressed with an N-terminal FLAG tag in
MCF10A and MDA-MB-231 cells ( Figure S3D). Immunoblot
and confocal microscopy localized the FLAG-Dicer protein spe-
cifically to cancer exosomes ( Figures 3C, S3D, and S3E). Inaddi-
tion, Dicer expression was decreased via stable expression of
two short-hairpin constructs in MCF10A and MDA-MB-231 cells
( Figures S3F and S3G). Exosomes derived from MDA-MB-
231shDicer cells contained significantly less Dicer compared
A
B
M C F 1
0 A p r e - m i R N A s
e x o s ( 1 / ∆ C t )
M D A - M B 2
3 1 p r e - m i R N A s
e x
o s ( 1 / ∆ C t )
C
pre-miR-21
Met
24h 72h 0h 24h 72h 96h
MDA-MB231
exos
tRNA
pre-miR-10b
Met
0h 24h 72h 96h
MDA-MB231
exos
tRNA
24h 72h
D
M D A - M B 2 3 1 p r e - m i R N A s
e x o s ( 1 / ∆ C t )
M D A - M B 2 3 1 m i R N A s
e x o s ( 1 / ∆ C t )
pre-miR-10b 0.97 0.83 0.50 0.48 0.56 0.59 pre-miR-21 0.56 0.62 0.97 0.99 0.02 0.03
MCF10A
exos
MCF10A
exos
0.12
0.10.080.060.04
0.020
p r e -
1 0 a
p r e -
1 0 b
p r e -
2 1
p r e -
2 7 a
p r e -
1 5 5
p r e -
3 7 3
p r e -
1 0 a
p r e -
1 0 b
p r e -
2 1
p r e -
2 7 a
p r e -
1 5 5
p r e -
3 7 3
1.5
1
0.5
0
9 6 h
7 2 h
4 8 h
3 6 h
2 4 h
1 2 h 6 h
1
1.5
0.5
0
pre-miR-10a
pre-miR-10b
pre-miR-21
pre-miR-27a
pre-miR-155
pre-miR-373
2.0
1.5
1
0.5
0
9 6 h
7 2 h
4 8 h
3 6 h
2 4 h
1 2 h 6 h
miR-10a
miR-10b
miR-21
miR-27a
miR-155
miR-373
p r e - m i R N A s e x o s
( f o l d c h a n g e )
1.5
1
0.5
0
MCF10A exos
MDA-MB-231 exos
24h 72h
pre-miR-10a
pre-miR-10b
pre-miR-21
pre-miR-27a
pre-miR-155
pre-miR-373
1.5
1
0.5
024h 72h
NMuMG exos
4T1 exos
p r e - m i R N A s e x o s
( f o l d c h a n g e )
* *
p r e - m i R N
A s e x o s
( f o l d c h
a n g e )
1.5
1
0.5
0
24h 72h
MCF10A exos
MCF7 exos*
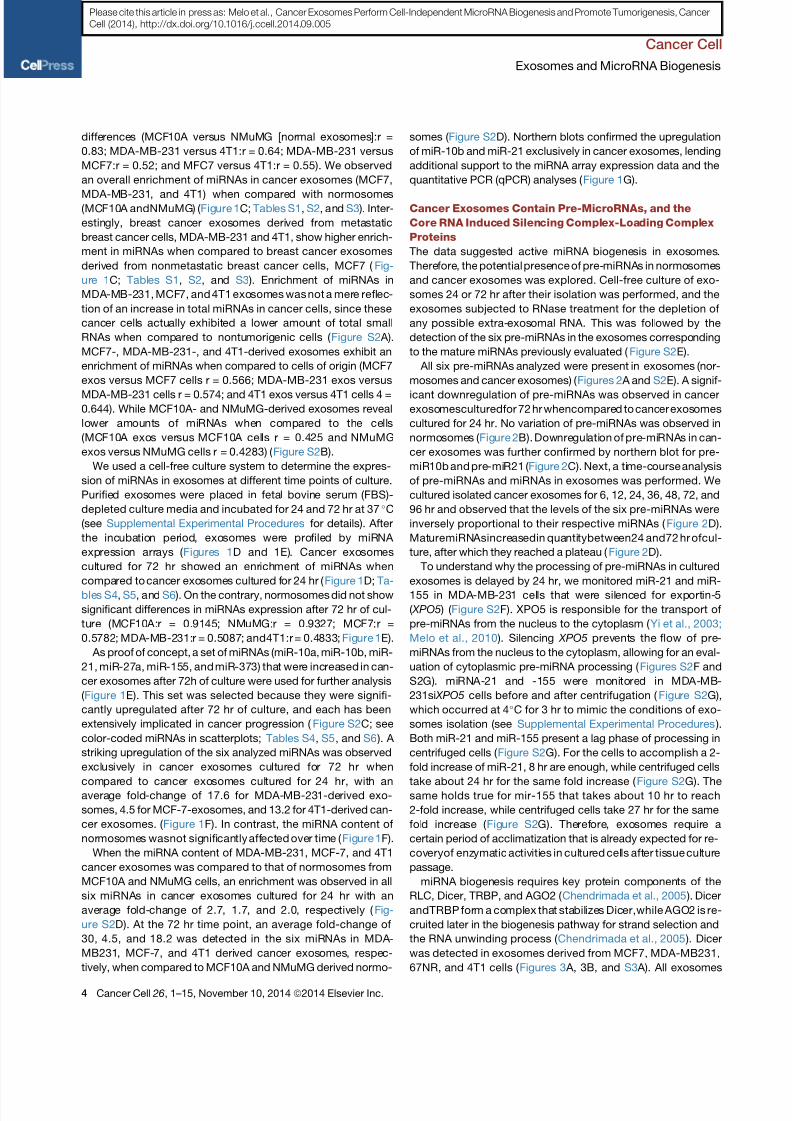
Figure 2. Cancer Exosomes get Depleted of
Pre-MicroRNAs
(A) Six pre-miRNAs were quantified by qPCR of
MCF10A and MDA-MB231 exosomes. The inverse
of the DCt value for each pre-miRNA was plotted.
(B) Cancer exosomes and normosomes were re-suspended in DMEM media depleted of FBS and
maintained for 24 and 72 hr in cell-free culture
conditions. After 24 and 72 hr exosomes were
extracted and six pre-miRNAs were quantified by
qPCR. Graphs show fold-change of each pre-
miRNA in MCF10A and MDA-MB231 exosomes
after 72 hr of cell-free culture relative to 24 hr cell-
free culture.
(C) Northern blots of pre-miR-10b and pre-miR-21
using MCF10A normosomes after 24 and 72 hr of
cell-free culture, and MDA-MB231 cancer exo-
somes with 0, 24, 72, and 96 hr of cell-free culture.
The tRNA Met was used as a loading control.
Quantification was done using Image J software.
(D) Pre-miRNAs (left graph) and mature miRNAs
(right graph) of cancer exosomes (MDA-MB231)
were quantified after6, 12,24, 36,48, 72,and 96hr
of cell-free culture conditions. The inverse of the
DCt value for each pre-miRNA (left graph) and
miRNA (right graph) at different time points was
plotted.
The data presented are the result of three inde-
pendent experiments each with three replicates
and are represented as ±SEM; significance was
determined using t tests (*p < 0.05). Northern blots
were performed once to validate qPCR and
miRNAs array data. See also Figure S2.
to shScramble or parental MDA-MB-231
cells, as determined by immunoblot and
immunogold TEM ( Figures 3D and 3E).
Dicer was not detected in normosomes
derived from MCF10AshDicer cells
( Figure 3D).
RLC proteins, AGO2, and TRBP, were
also present in cancer exosomes, but
not in normosomes ( Figures 3F and 3G).
Exosomes were extracted from MCF10A
and MDA-MB-231 cells transfected with a GFP-tagged AGO2
( Figure 3H). The presence of GFP-AGO2 was detected in exo-
somes extracted from MDA-MB-231-GFP-AGO2 cells ( Fig-
ure 3I). Dicer immunoprecipitation revealed that AGO2 binds toDicer in cancer exosomes, while both are undetectable in nor-
mosomes ( Figure 3J). TRBP functions as a key partner of Dicer
protein and aids in its stability and in its pre-miRNA cleavage ac-
tivity ( Chendrimada et al., 2005; Melo et al., 2009 ). Dicer immu-
noprecipitation revealed the presence of Dicer/TRBP complex
in cancer exosomes, but not in normosomes ( Figure 3K).
MVBs are cellular organelles that contain endosomes that are
released as exosomes upon fusion with the plasma membrane
( Pant et al., 2012 ). We compared the cellular distribution of Dicer
together with markers of MVBs. Hrs and BiG2 are early endo-
some markers, and TSG101 is a marker for MVBs ( Razi and
Futter, 2006; Shin et al., 2004 ). Dicer colocalized with Hrs,
BiG2, and TSG101 in MDA-MB231 and 4T1 cells ( Figure S3H).
Cancer Cell
Exosomes and MicroRNA Biogenesis
Cancer Cell 26, 1–15, November 10, 2014 ª2014 Elsevier Inc. 5
Please cite this article in press as: Melo et al., Cancer Exosomes Perform Cell-Independent MicroRNA Biogenesis and Promote Tumorigenesis, Cancer
Cell (2014), http://dx.doi.org/10.1016/j.ccell.2014.09.005
8/9/2019 CancerExosomesPerform Cell-IndependentMicroRNA.pdf
http://slidepdf.com/reader/full/cancerexosomesperform-cell-independentmicrornapdf 6/15
Exogenously delivered N-rhodamine-labeled phosphotidyletha-
nolamine (NRhPE) is taken up by cells and retained within MVBs
( Sherer et al., 2003 ). Dicer labeling in MDA-MB-231 cells colocal-
ized with NRhPE in MVBs ( Figure S3H). This data is in agreement
with previous observations that showed Dicer, TRBP, and AGO2
in late endosomes/MVB fractions using cofractionation analysis
( Shen et al., 2013 ). In contrast, there was no colocalization of
Dicer with Hrs, BiG2, TSG101, or NRhPE in MCF10A cells ( Fig-
ure S3H). Further, HRS, TSG101, and BIG2 genes were silenced
using two different siRNAs and shRNAs in MDA-MB-231 and
MCF10A cells, and Dicer protein expression was evaluated ( Fig-
ure S3I). Silencing HRS, BIG2, and TSG101 impaired MVBs
A B
D
C
E
F G H
I J K
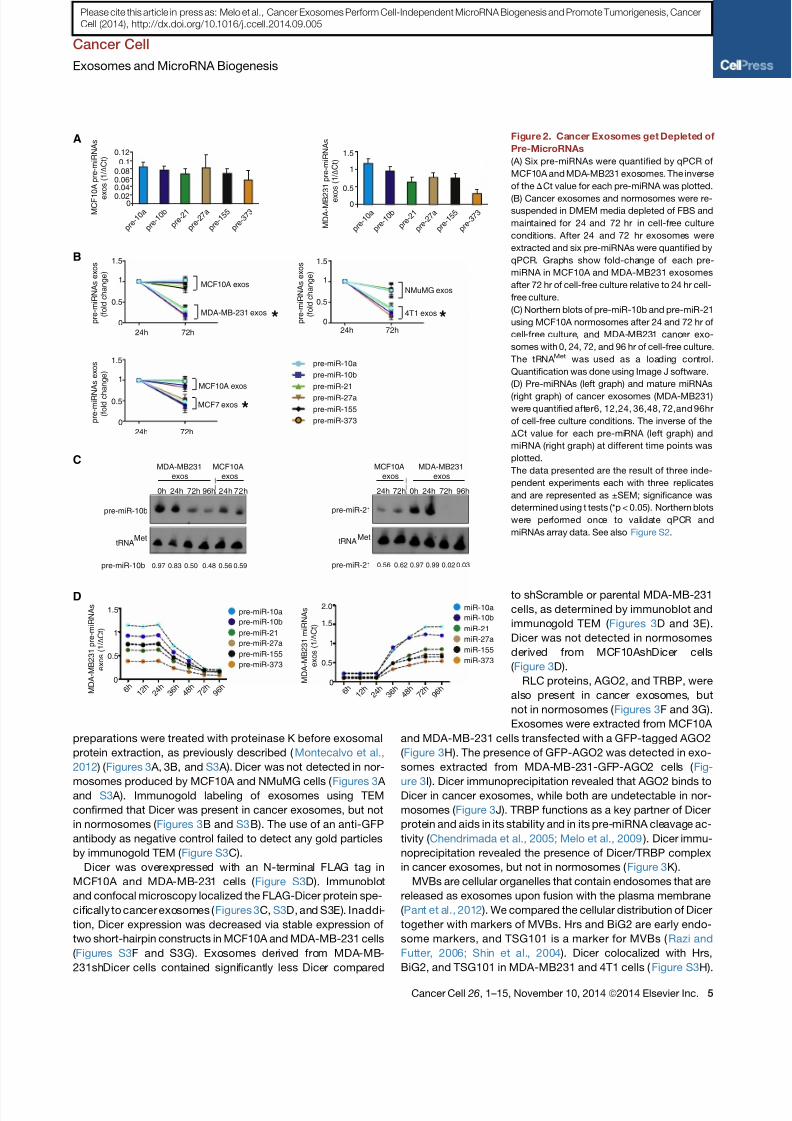
Figure 3. Cancer Exosomes Contain RNA
Induced Silencing Complex-Loading Com-
plex Proteins
(A) Immunoblot of Dicer in exosomes harvested
from, NMuMG, MCF10A, MCF7, MDA-MB-231,
67NR, and 4T1 cells. Controls used were; exo-somes treated with TritonX followed by proteinase
K (PK) treatment (Triton + PK), and exosomes
treated with proteinase K (PK). Immunoblots for
TSG101 (second row) and CD9 (third row) are
shown. Quantification isthe ratio of Dicer and CD9
intensity bands as quantified by Image J software.
(B) TEM of immunogold of Dicer in MDA-MB-231
exosomes. Right image contains zoomed inset to
show labeling in one exosome with diameter of
103 nm. Left bottom image is digitally zoomed
from a new independent image of the extraction.
Negative control (NC) refers to secondary anti-
body. Gold particles are depicted as black dots.
Right lower graph represents the average number
of gold dots inten differentfields of each of thetwo
samples on the top.
(C) Immunoblot for FLAG (upper panel) in MCF10A
and MDA-MB231 exosomes harvested from cells
transfected with empty vector (pCMV-Tag4B; first
and third lanes, respectively) and FLAG-Dicer
vector (second and fourth lanes). CD9 immunoblot
was used as a loading control (lower panel).
(D) Immunoblot for Dicer in exosomes extracted
from MCF10A, MDA-MB231 parental cells, and
cells transfected with shScramble and shDicer
plasmids (upper blot). CD9 immunoblot was used
as a loading control (lower blot). Immunoblot
quantification was done using Image J software.
(E) TEM of immunogold of Dicer in cancer exo-
somes derived from MDA-MB231shDicer cells.
Gold particles are depicted as black dots. Right
graph represents the average number of gold dots
in ten different fields of the same sample.
(F) Immunoblot of AGO2 in exosomes harvested
from MCF7, MDA-MB231, and MCF10A cells.
Controls used were, exosomes treated with Triton
X followed by proteinase K (Triton X + PK); exo-
somes treated with proteinase k (PK); and super-
natant after ultracentrifugation to harvest exo-
somes (Supernatant). Immunoblots of TSG101
(second row) and CD9 (third row) are shown.
(G) Immunoblot of TRBP in exosomes harvested from MCF7, MDA-MB231, and MCF10A cells. The controls used were, exosomes treated with Triton X followed
by proteinase K (Triton X + PK); exosomes treated with proteinase K (PK); and supernatant after ultracentrifugation to harvest exosomes (Supernatant). TSG101
(second row) and CD9 (third row) immunoblots were used as exosomes markers.
(H) Immunoblot of GFP in MCF10A and MDA-MB231 cells transfected with GFP-AGO2 plasmid (upper panel). Beta actin was used as loading control (lower
panel).
(I) Immunoblotof GFP antibodyin exosomesextracted fromMCF10A and MDA-MB231 cells transfected withGFP-AGO2 plasmid (upper panel). TSG101 (middle
panel) and CD9 (lower panel) were used as loading controls.
(J) Immunoblot of AGO2 in exosomal proteins extracted from MCF10A and MDA-MB231 cells immunoprecipitated with Dicer antibody or IgG (upper panel).
5% of the lysate input of MDA-MB-231 exosomes was used as control. Immunoblot of Dicer was used as control for immunoprecipitation (lower panel).
(K) Immunoblot of TRBP antibody in exosomal proteins extracted from MCF10A and MDA-MB231 cells immunoprecipitated with Dicer antibody or IgG (upper
panel). Lysate input of MDA-MB-231 exosomes (5%) was used as control. Immunoblot of Dicer was used as control for immunoprecipitation (lower panel).
Data in (B) and (E) are represented as ±SEM. See also Figure S3.
Cancer Cell
Exosomes and MicroRNA Biogenesis
6 Cancer Cell 26, 1–15, November 10, 2014 ª2014 Elsevier Inc.
Please cite this article in press as: Melo et al., Cancer Exosomes Perform Cell-Independent MicroRNA Biogenesis and Promote Tumorigenesis, Cancer
Cell (2014), http://dx.doi.org/10.1016/j.ccell.2014.09.005
8/9/2019 CancerExosomesPerform Cell-IndependentMicroRNA.pdf
http://slidepdf.com/reader/full/cancerexosomesperform-cell-independentmicrornapdf 7/15
formation and led to significant downregulation of exosomes
production ( Figure S3J). Increased Dicer protein was observed
in the nucleus and cytoplasm, including MVBs, of MDA-MB-
231 cells with siHRS, shBIG2, or siTSG101 ( Figure S3K).
Silencing of HRS, BIG2, or TSG101 genes in MCF10A cells didnot alter Dicer protein expression or cellular localization
( Figure S3K).
Recently,a variety of plasmamembraneanchor proteins, such
as CD43, were speculated as likely mediators of protein trans-
port into MVBs and exosomes ( Shen et al., 2011 ). CD43 is pre-
dominantly a leukocyte transmembrane sialoglycoprotein, which
is aberrantly expressed highly in the cytoplasm of breast cancer
cells, butnot in normal epithelial cells ( Tuccillo et al., 2014 ). CD43
is also detected in many solid tumors including breast cancer
and correlates with cancer progression and metastasis ( Tuccillo
et al., 2014 ). We demonstrate that Dicer immunoprecipitates
with CD43 in MDA-MB231 cells ( Figure 4 A). When CD43 is
silenced using siRNA in MCF10A and MDA-MB231 cells, Dicer
levels significantly decrease in cancer exosomes and reveal anincreased nuclear and cytoplasmic accumulation of Dicer
protein ( Figures 4B and 4C). When CD43 is overexpressed in
MCF10A cells (MCF10A-CD43 cells), Dicer is detectedin normo-
somes ( Figure 4D).
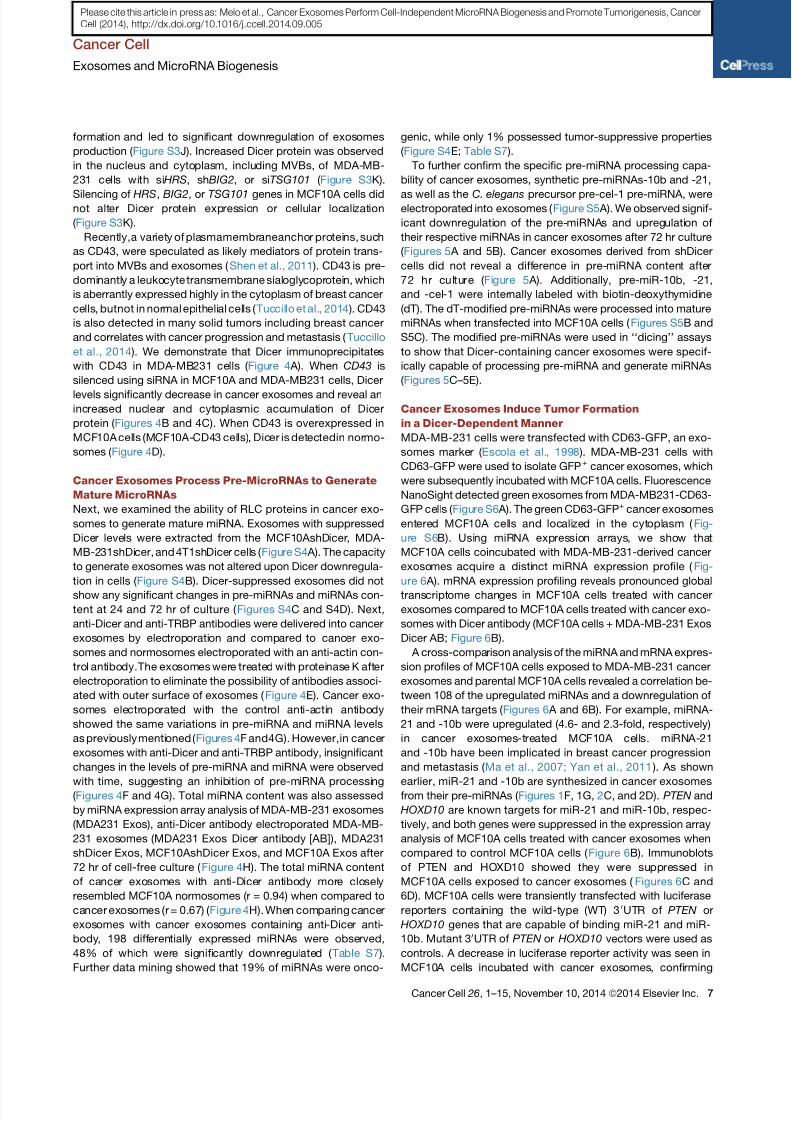
Cancer Exosomes Process Pre-MicroRNAs to Generate
Mature MicroRNAs
Next, we examined the ability of RLC proteins in cancer exo-
somes to generate mature miRNA. Exosomes with suppressed
Dicer levels were extracted from the MCF10AshDicer, MDA-
MB-231shDicer, and 4T1shDicer cells ( Figure S4 A). The capacity
to generate exosomes was not altered upon Dicer downregula-
tion in cells ( Figure S4B). Dicer-suppressed exosomes did not
show any significant changes in pre-miRNAs and miRNAs con-
tent at 24 and 72 hr of culture ( Figures S4C and S4D). Next,
anti-Dicer and anti-TRBP antibodies were delivered into cancer
exosomes by electroporation and compared to cancer exo-
somes and normosomes electroporated with an anti-actin con-
trol antibody.The exosomes were treated with proteinase K after
electroporation to eliminate the possibility of antibodies associ-
ated with outer surface of exosomes ( Figure 4E). Cancer exo-
somes electroporated with the control anti-actin antibody
showed the same variations in pre-miRNA and miRNA levels
as previously mentioned ( Figures 4F and4G). However,in cancer
exosomes with anti-Dicer and anti-TRBP antibody, insignificant
changes in the levels of pre-miRNA and miRNA were observed
with time, suggesting an inhibition of pre-miRNA processing( Figures 4F and 4G). Total miRNA content was also assessed
by miRNA expression array analysis of MDA-MB-231 exosomes
(MDA231 Exos), anti-Dicer antibody electroporated MDA-MB-
231 exosomes (MDA231 Exos Dicer antibody [AB]), MDA231
shDicer Exos, MCF10AshDicer Exos, and MCF10A Exos after
72 hr of cell-free culture ( Figure 4H). The total miRNA content
of cancer exosomes with anti-Dicer antibody more closely
resembled MCF10A normosomes (r = 0.94) when compared to
cancer exosomes (r = 0.67) ( Figure 4H). When comparing cancer
exosomes with cancer exosomes containing anti-Dicer anti-
body, 198 differentially expressed miRNAs were observed,
48% of which were significantly downregulated ( Table S7 ).
Further data mining showed that 19% of miRNAs were onco-
genic, while only 1% possessed tumor-suppressive properties
( Figure S4E; Table S7 ).
To further confirm the specific pre-miRNA processing capa-
bility of cancer exosomes, synthetic pre-miRNAs-10b and -21,
as well as the C. elegans precursor pre-cel-1 pre-miRNA, wereelectroporated into exosomes ( Figure S5 A). We observed signif-
icant downregulation of the pre-miRNAs and upregulation of
their respective miRNAs in cancer exosomes after 72 hr culture
( Figures 5 A and 5B). Cancer exosomes derived from shDicer
cells did not reveal a difference in pre-miRNA content after
72 hr culture ( Figure 5 A). Additionally, pre-miR-10b, -21,
and -cel-1 were internally labeled with biotin-deoxythymidine
(dT). The dT-modified pre-miRNAs were processed into mature
miRNAs when transfected into MCF10A cells ( Figures S5B and
S5C). The modified pre-miRNAs were used in ‘‘dicing’’ assays
to show that Dicer-containing cancer exosomes were specif-
ically capable of processing pre-miRNA and generate miRNAs
( Figures 5C–5E).
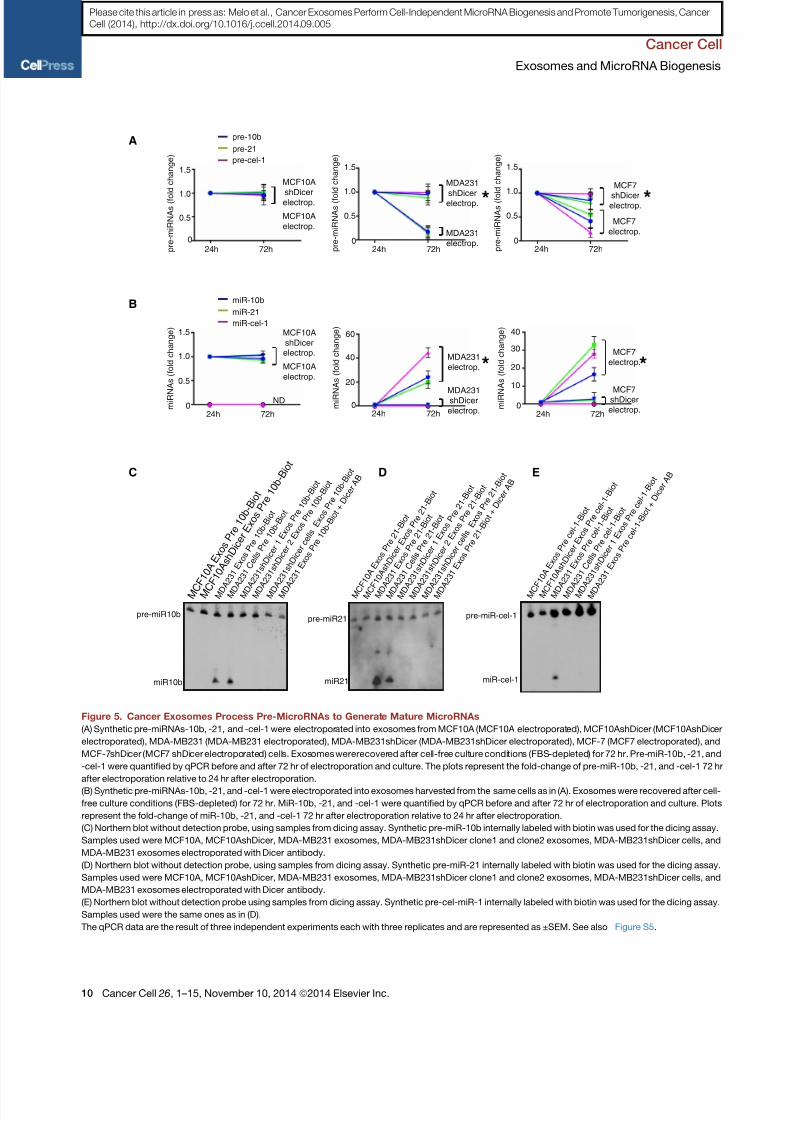
Cancer Exosomes Induce Tumor Formation
in a Dicer-Dependent Manner
MDA-MB-231 cells were transfected with CD63-GFP, an exo-
somes marker ( Escola et al., 1998 ). MDA-MB-231 cells with
CD63-GFP were used to isolate GFP+ cancer exosomes, which
were subsequently incubated with MCF10A cells. Fluorescence
NanoSight detected green exosomes from MDA-MB231-CD63-
GFP cells ( Figure S6 A). The green CD63-GFP+ cancer exosomes
entered MCF10A cells and localized in the cytoplasm ( Fig-
ure S6B). Using miRNA expression arrays, we show that
MCF10A cells coincubated with MDA-MB-231-derived cancer
exosomes acquire a distinct miRNA expression profile ( Fig-
ure 6 A). mRNA expression profiling reveals pronounced global
transcriptome changes in MCF10A cells treated with cancer
exosomes compared to MCF10A cells treated with cancer exo-
somes with Dicer antibody (MCF10A cells + MDA-MB-231 Exos
Dicer AB; Figure 6B).
A cross-comparison analysis of the miRNA and mRNA expres-
sion profiles of MCF10A cells exposed to MDA-MB-231 cancer
exosomes and parental MCF10A cells revealed a correlation be-
tween 108 of the upregulated miRNAs and a downregulation of
their mRNA targets ( Figures 6 A and 6B). For example, miRNA-
21 and -10b were upregulated (4.6- and 2.3-fold, respectively)
in cancer exosomes-treated MCF10A cells. miRNA-21
and -10b have been implicated in breast cancer progression
and metastasis ( Ma et al., 2007; Yan et al., 2011 ). As shown
earlier, miR-21 and -10b are synthesized in cancer exosomesfrom their pre-miRNAs ( Figures 1F, 1G, 2C, and 2D). PTEN and
HOXD10 are known targets for miR-21 and miR-10b, respec-
tively, and both genes were suppressed in the expression array
analysis of MCF10A cells treated with cancer exosomes when
compared to control MCF10A cells ( Figure 6B). Immunoblots
of PTEN and HOXD10 showed they were suppressed in
MCF10A cells exposed to cancer exosomes ( Figures 6C and
6D). MCF10A cells were transiently transfected with luciferase
reporters containing the wild-type (WT) 30UTR of PTEN or
HOXD10 genes that are capable of binding miR-21 and miR-
10b. Mutant 30UTR of PTEN or HOXD10 vectors were used as
controls. A decrease in luciferase reporter activity was seen in
MCF10A cells incubated with cancer exosomes, confirming
Cancer Cell
Exosomes and MicroRNA Biogenesis
Cancer Cell 26, 1–15, November 10, 2014 ª2014 Elsevier Inc. 7
Please cite this article in press as: Melo et al., Cancer Exosomes Perform Cell-Independent MicroRNA Biogenesis and Promote Tumorigenesis, Cancer
Cell (2014), http://dx.doi.org/10.1016/j.ccell.2014.09.005

8/9/2019 CancerExosomesPerform Cell-IndependentMicroRNA.pdf
http://slidepdf.com/reader/full/cancerexosomesperform-cell-independentmicrornapdf 8/15
E
HC
LC
MDA-MB231 exos
+ -anti-actin
F
G
H
Intensity
0 2
+ -anti-Dicer
-2
MCF10AshDicer Exos
MCF10A Exos
MDA231 Exos Dicer AB
MDA231 Exos
MDA231 shDicer Exos
+ -anti-TRBP
IB:CD43
IB:Dicer
I g G I P D i c e
r
5 % i n p
u tMDA-MB231
C e l l s
A
Dicer
CD9 E
x o s
Dicer 0.89 0.87 0.43
B
1 2 3
1 - MDA231
2 - MDA231siScramble
3- MDA231 siCD43
C
D i c e r / D a p i
10 µm
Dicer
CD9
D
1 2 3
1 - MCF10A Cells
2 - MCF10A Exos3- MCF10A CD43 Exos
MCF10A MCF10A siCD43 MDA-MB-231 MDA-MB-231 siCD43
MDA-MB-231
Dicer AB exos
MDA-MB-231 exos
p r e - m i R N A s e x o s
( f o l d c h a n g e )
1.5
1
0.5
0
24h 72h
MDA-MB-231
TRBP AB exos
MDA-MB-231 exos
1.5
1
0.5
0
24h 72h
MDA-MB-231Actin AB exos
MDA-MB-231 exos
* *
1.5
1
0.5
0
24h 72h
m i R N A s e x o s
( f o l d c h a n g e )
20
10
0
24h 72h
30
40
M D A - M B - 2 3 1
e x o s
MDA-MB-231Dicer AB exos *
M D A - M B - 2 3 1
e x o s
MDA-MB-231TRBP AB exos*
m i R N A s e x o s
( f o l d c h a n g e )
20
10
024h 72h
30
40
MDA-MB-231Actin AB exos
MDA-MB-231exos
m i R N A s e x o s
( f o l d c h a n g e )
20
10
024h 72h
30
40
p r e - m i R N A s e x o s
( f o l d c h a n g e )
p r e - m i R N A s e x o s
( f o l d c h a n g e )
pre-10a
pre-10b
pre-21
pre-27a
pre-155
pre-373
miR-10a
miR-10b
miR-21
miR-27a
miR-155
miR-373
Figure 4. Cancer Exosomes Process Pre-MicroRNAs to Generate Mature MicroRNAs
(A) Immunoblot for CD43 and Dicer in MDA-MB-231 cell lysates immunoprecipitated with Dicer antibody and IgG.
(B) Immunoblot of Dicer in MDA-MB-231siCD43 exosomes. CD9 was used as a loading control and quantification achieved by Image J software.
(C) Dicer expression in MCF10A and MDA-MB-231 cells (first and third panels) compared to MCF10A and MDA-MB231siCD43 cells (second and fourth panels).
Scale bars, 20 mm (two left images) and 10 mm (two right images).
(D) Immunoblot of Dicer in MCF10A exosomes (2), exosomes derived from MCF10A cells overexpressing CD43 (3), and MCF10A cells (1). CD9 was used as a
loading control.
(E) Immunoblot using anti-rabbit and anti-mouse secondary antibody to detect heavy chain (HC) and light chain (LC) primary Dicer, actin, or TRBP antibodies
electroporated in exosomes of MDA-MB231 cells. Electroporated exosomes without antibody derived from MDA-MB231 cells were used as negative control.
Proteinase K treatments were performed after electroporation.
(legend continued on next page)
Cancer Cell
Exosomes and MicroRNA Biogenesis
8 Cancer Cell 26, 1–15, November 10, 2014 ª2014 Elsevier Inc.
Please cite this article in press as: Melo et al., Cancer Exosomes Perform Cell-Independent MicroRNA Biogenesis and Promote Tumorigenesis, Cancer
Cell (2014), http://dx.doi.org/10.1016/j.ccell.2014.09.005

8/9/2019 CancerExosomesPerform Cell-IndependentMicroRNA.pdf
http://slidepdf.com/reader/full/cancerexosomesperform-cell-independentmicrornapdf 9/15
functional delivery of miRNAs from cancer exosomes to recipient
cells ( Figure 6E). PTEN and HOXD10 protein levels were evalu-
ated in MCF10A cells incubated with cancer exosomes at
different time points. A significant decrease was detected in
PTEN and HOXD10 protein immediately after treating the cellswith 72 hr cultured cancer exosomes ( Figures 6C and 6D).
PTEN and HOXD10 protein levels changed minimally in
MCF10A cells treated with freshly isolated cancer exosomes,
suggesting that sufficient concentration of the mature miRNAs
is not present at this time point ( Figures S6C and S6D).
MCF10A cells treated with 72 hr-cultured cancer exosomes
with Dicer antibody revealed an insignificant downregulation of
PTEN and HOXD10 ( Figure 6F). Additionally, processing of
miR-15 in cells, a miRNA not detected in MDA-MB231-derived
cancer exosomes, was not altered due to treatment of
MCF10A cells with MDA-MB-231 exosomes containing Dicer
antibody ( Figure S6E). Some reports show downregulation of
miRNA targets in cells incubated with exosomes without a
need for culture ( Kosakaet al., 2013; Narayanan et al., 2013; Peg-tel et al., 2010 ). MiR-182-5p is one of the miRNAs upregulated in
MCF10A cells upon cancer exosomes incubation. SMAD4, a
miR-182-5p target ( Hirataet al., 2012 ), is one of the genes down-
regulated upon cancer exosomes treatment of MCF10A cells
( Figure S6F). Upregulation of miR-182-5p in cancer exosomes
during the culture period was not observed and pre-miR182-5p
was not detected in cancer exosomes ( Figure S6G). Therefore,
cancer exosomes also pack mature miRNAs without the need
for processing pre-miRs. If such mature miRs are present in stoi-
chiometric amounts, they may be able to regulate gene expres-
sion of recipient cells, as shown previously ( Ismail et al., 2013;
Kogure et al., 2011; Kosaka et al., 2013; Narayanan et al.,
2013; Pegtel et al., 2010; Valadi et al., 2007; Zhang et al., 2010 ).
Cell viability and proliferation of MCF10A cells treated with
72 hr cultured cancer exosomes was increased, which was not
observed when freshly isolated cancer exosomes were used
( Figure 6G). No changes were seen after incubation of MCF10A
cells with cancer exosomes containing Dicer antibodies ( Fig-
ure 6G). The same held true for the colony formation capacity
of MCF10A cells treated with cancer exosomes ( Figure 6H).
To address the functional ‘‘oncogenic potential’’ of MCF10A
and MCF10A cells with prior exposure to cancer exosomes
(MCF10A cells + MDA231 exos culture), we implanted the cells
into the mammary fat pads of female nu/nu mice. Similar to re-
sults previously published, MCF10A cells did not form tumors
in nude mice ( Mavel et al., 2002; The ry et al., 2002 ) ( Figure 6I).
MCF10A cells coinjected with cancer exosomes formed tumors,whereas MCF10A cells coinjected with cancer exosomes con-
taining Dicer antibody (but not control anti-actin antibodies)
showed a significant reduction in tumor growth ( Figures 6I and
S6H). These results suggest that Dicer in cancer exosomes con-
tributesto oncogenic conversionof MCF10A cells ( Figures6G–6I).
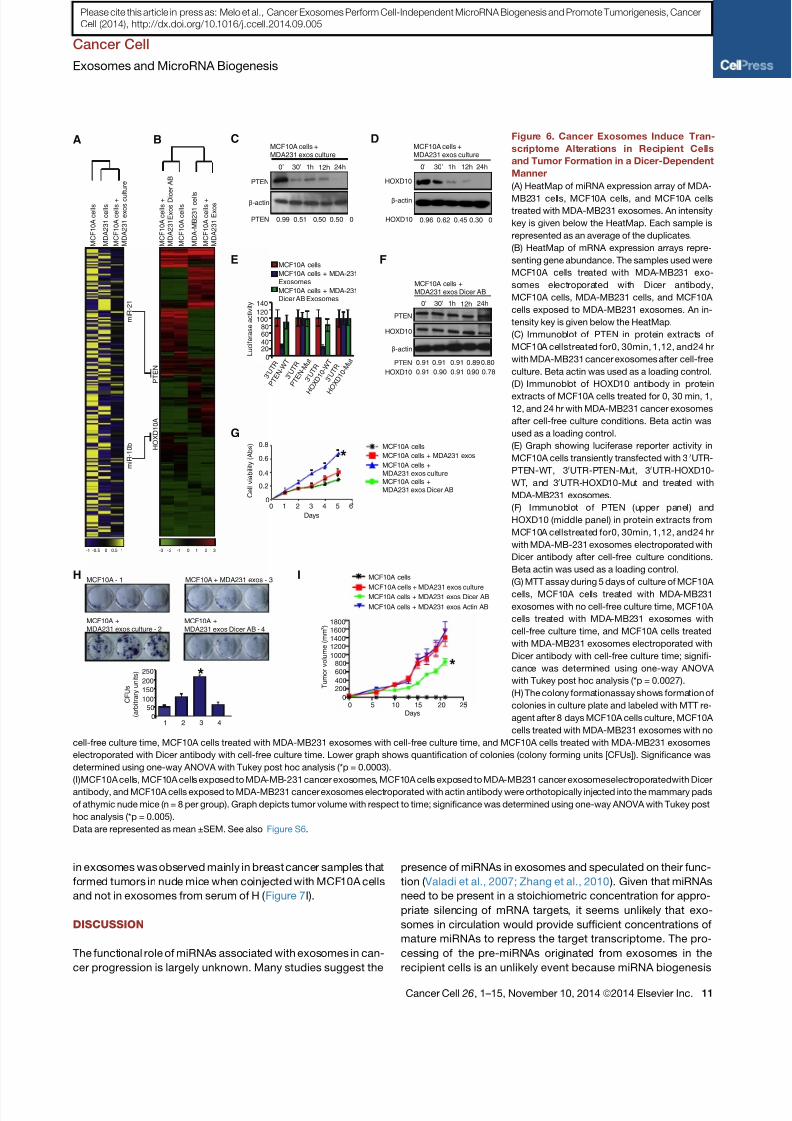
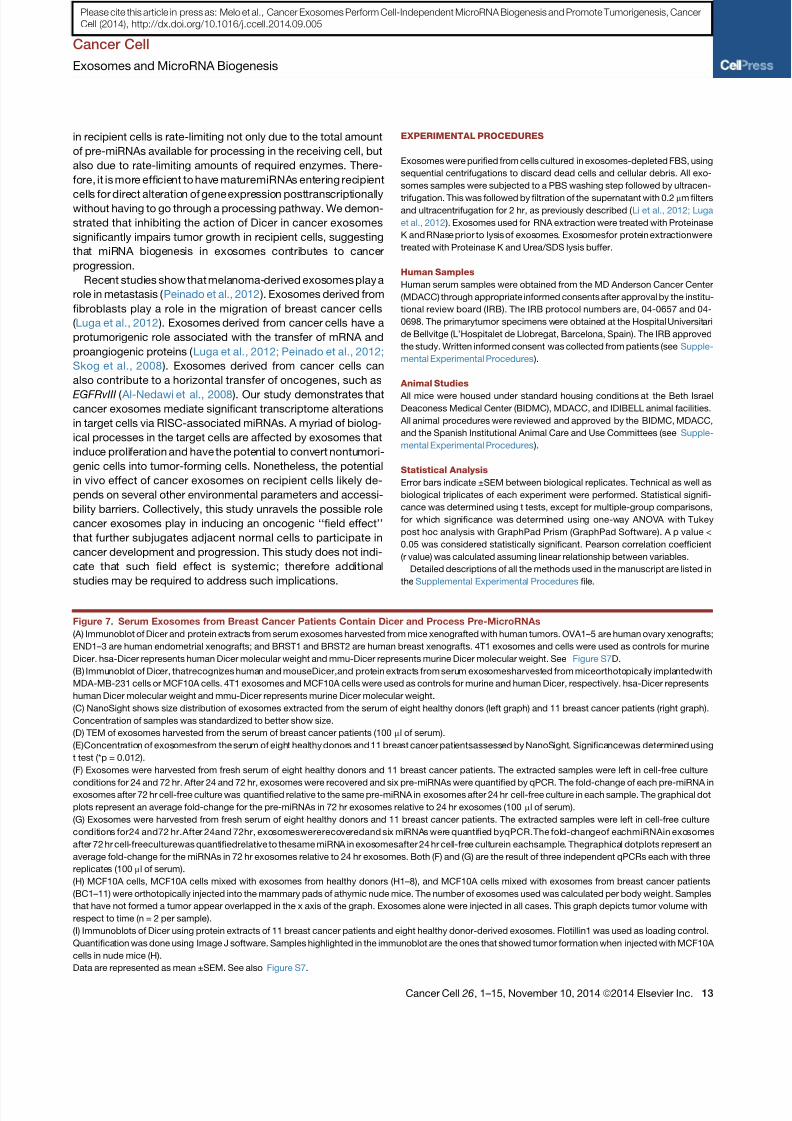
Serum Exosomes from Cancer Patients Contain Dicer
and Process Pre-MicroRNAs to Generate Mature
MicroRNAs
Freshly isolated human primary ovarian, breast, and endometrial
tumor fragments were orthotopically grafted onto the appro-
priate organs of female athymic nu/nu mice ( Figures S7 A and
S7B), and serum exosomes from these mice were evaluated
by TEM ( Figure S7C). Size exclusion immunoblot of the exo-
somes extracts demonstrated the existence of Dicer exclusively
of human origin in the purified exosomes (hsa-Dicer) ( Figures 7 A
and S7D). Protein extracts from 4T1-derived exosomes were
used as controls to show that Dicer of mouse origin exhibited
a different molecular size (mmu-Dicer) ( Figure 7 A). Additionally,
serum exosomes from nude mice orthotopically injected withMDA-MB-231 cells or MCF10A cells show Dicer protein of
human origin in MDA-MB-231-injected mice, while no protein
is detected in serum exosomes of MCF10A-injected mice or
noninjected mice ( Figure 7B). This strongly supports the fact
that Dicer in exosomes is exclusively originated from the human
cancer epithelial cells injected into mice.
Next, 100 ml of fresh serum samples were used to isolate exo-
somes from eight healthy individuals (H) and 11 patients with
breast carcinoma (BC) ( Figure 7C). Exosomes were 100 nm
(average of the mode for the size distributions), and their lipid
bilayer membranes were identified by TEM ( Figures 7C and
7D). Serum of breast cancer patients contained significantly
more exosomes when compared to serum of healthy donors
( Figure 7E). When equal numbers of exosomes were placed in
culture for 24 and 72 hr, the six pre-miRNAs ( vide supra ) were
found to be downregulated exclusively in breast cancer patients,
andtheir respective mature miRNAswere upregulated after 72 hr
of culture ( Figures 7F and 7G). Next, exosomes alone or com-
bined with MCF10A cells were injected orthotopically in the
mammary fat pad of female nu/nu mice. We noted that five out
of 11 serum exosomes induced MCF10A cells to form tumors
( Figure 7H). In contrast, when exosomes from healthy donors
were combined with MCF10A cells or administered alone, tu-
mors were not detected ( Figure 7H). Interestingly, exosomes
that formedtumors were also shown to have thehighest increase
in the amount of mature miRNAs after 72 hr culture ( Figures 7F
and 7G). Exosomes from serum of breast cancer patients andhealthy donors were analyzed for Dicer expression. Dicer protein
(F) MDA-MB-231 exosomes were harvested in quadruplicate. Samples were electroporated with anti-Dicer, antiactin, or anti-TRBP antibodies. The three
samplesplus control wereleft in cell-freeculture conditions(FBS-depleted) for 24 and 72 hr. After 24 and 72 hr exosomeswere extracted, and thesix pre-miRNAs
were quantified by qPCR. The fold-change of each pre-miRNA in exosomes after 72 hr cell-free culture was quantified relative to the same pre-miRNA in
exosomes after 24 hr cell-free culture in each sample. The graphical plots represent the fold change of the six pre-miRNAs.
(G) MDA-MB-231 exosomes were harvested in quadruplicate. Samples were electroporated with anti-Dicer, antiactin, or anti-TRBP antibodies. The three
samplesplus control were left in cell-freecultureconditions (FBS-depleted) for24 and72 hr.After 24 and72 hr exosomes were extracted once again,and thesix
miRNAs were quantified by qPCR. The fold-change of each miRNA in exosomes after 72 hr cell-free culture was quantified relative to the same miRNA in
exosomes after 24 hr cell-free culture in each sample. The graphical plots are a representation of the fold change of the six miRNAs.
(H) HeatMap of miRNAs array MDA-MB-231 exos, exosomes electroporated with Dicer antibody (MDA231 exos Dicer AB), MCF10A exosomes, MDA-MB-231
shDicer Exosomes, and MCF10AshDicer Exosomes. An average of duplicates is represented for each sample.
The qPCR data are the result of three independent experiments each with three replicates and are represented as ±SEM; significance was determined using
t tests (*p < 0.05). See also Figure S4 and Table S7.
Cancer Cell
Exosomes and MicroRNA Biogenesis
Cancer Cell 26, 1–15, November 10, 2014 ª2014 Elsevier Inc. 9
Please cite this article in press as: Melo et al., Cancer Exosomes Perform Cell-Independent MicroRNA Biogenesis and Promote Tumorigenesis, Cancer
Cell (2014), http://dx.doi.org/10.1016/j.ccell.2014.09.005
8/9/2019 CancerExosomesPerform Cell-IndependentMicroRNA.pdf
http://slidepdf.com/reader/full/cancerexosomesperform-cell-independentmicrornapdf 10/15
C D E
M C
F 1 0 A
E x o s
P r e 1 0
b - B i o t
M C
F 1 0 A
s h D i c e r
E x o s
P r e 1 0
b - B i o t
M D A 2 3 1
E x o s
P r e 1 0
b - B i o t
M D A 2 3 1
C e l l s P r
e 1 0 b -
B i o t
M D A 2 3 1
s h D i c e
r 1 E x o s
P r e 1 0
b - B i o t
M D A 2 3 1
E x o s
P r e 1 0
b - B i o t +
D i c e
r A B
M D A 2 3 1
s h D i c e
r 2 E x o s
P r e 1 0
b - B i o t
M D A 2 3 1
s h D i c e
r c e l l s E x
o s P r
e 1 0 b -
B i o t
miR10b
pre-miR10b
M C F 1
0 A E x
o s P r
e 2 1 - B i o t
M C F 1
0 A s h D
i c e r E x
o s P r
e 2 1 - B i o t
M D A 2 3 1
E x o s
P r e 2 1
- B i o t
M D A 2 3 1
C e l l s P r
e 2 1 - B i o t
M D A 2 3 1
s h D i c e
r 1 E x o s
P r e 2 1
- B i o t
M D A 2 3 1
E x o s
P r e 2 1
- B i o t + D i c e
r A B
M D A 2 3 1
s h D i c e
r 2 E x o s
P r e 2 1
- B i o t
M D A 2 3 1
s h D i c e
r c e l l s E x
o s P r
e 2 1 - B i o t
miR21
pre-miR21
M C F 1
0 A E x
o s P r
e c e l - 1 -
B i o t
M C F 1
0 A s h D
i c e r E x
o s P r
e c e l - 1 -
B i o t
M D A 2 3 1
E x o s
P r e c e
l - 1 - B i o t
M D A 2 3 1
C e l l s P r
e c e l - 1 -
B i o t
M D A 2 3 1
s h D i c e
r 1 E x o s
P r e c e
l - 1 - B i o t
M D A 2 3 1
E x o s
P r e c e
l - 1 - B i o t +
D i c e
r A B
miR-cel-1
pre-miR-cel-1
A
B
0.5
0
1.0
1.5
pre-10b
pre-21
pre-cel-1
miR-10b
miR-21
miR-cel-1
MCF10A
electrop.
MCF10A
shDicerelectrop.
24h 72h
p r e - m i R N A s ( f o
l d c h a n g e )
0
0.5
1.0
1.5
p r e - m i R N A s ( f o
l d c h a n g e )
MDA231
electrop.
MDA231
shDicerelectrop.
24h 72h
*
0
0.5
1.0
1.5
p r e - m i R N A s ( f o
l d c h a n g e )
24h 72h
MCF7
electrop.
MCF7
shDicerelectrop. *
m i R N
A s ( f o l d c h a n g e )
0
0.5
1.0
1.5
24h 72h
MCF10A
electrop.
MCF10A
shDicerelectrop.
ND
m i R N
A s ( f o l d c h a n g e )
0
20
40
60
24h 72h
MDA231
electrop.
MDA231shDicer
electrop.
*
m i R N
A s ( f o l d c h a n g e )
0
10
20
40
24h 72h
30
*MCF7
electrop.
MCF7shDicer
electrop.
Figure 5. Cancer Exosomes Process Pre-MicroRNAs to Generate Mature MicroRNAs
(A) Synthetic pre-miRNAs-10b, -21, and -cel-1 were electroporated into exosomes from MCF10A (MCF10A electroporated), MCF10AshDicer (MCF10AshDicer
electroporated), MDA-MB231 (MDA-MB231 electroporated), MDA-MB231shDicer (MDA-MB231shDicer electroporated), MCF-7 (MCF7 electroporated), and
MCF-7shDicer (MCF7 shDicer electroporated) cells. Exosomes wererecovered after cell-free culture conditions (FBS-depleted) for 72 hr. Pre-miR-10b, -21, and
-cel-1 were quantified by qPCR before and after 72 hr of electroporation and culture. The plots represent the fold-change of pre-miR-10b, -21, and -cel-1 72 hr
after electroporation relative to 24 hr after electroporation.
(B) Synthetic pre-miRNAs-10b, -21, and -cel-1 were electroporated into exosomes harvested from the same cells as in (A). Exosomes were recovered after cell-
free culture conditions (FBS-depleted) for 72 hr. MiR-10b, -21, and -cel-1 were quantified by qPCR before and after 72 hr of electroporation and culture. Plots
represent the fold-change of miR-10b, -21, and -cel-1 72 hr after electroporation relative to 24 hr after electroporation.
(C) Northern blot without detection probe, using samples from dicing assay. Synthetic pre-miR-10b internally labeled with biotin was used for the dicing assay.
Samples used were MCF10A, MCF10AshDicer, MDA-MB231 exosomes, MDA-MB231shDicer clone1 and clone2 exosomes, MDA-MB231shDicer cells, and
MDA-MB231 exosomes electroporated with Dicer antibody.
(D) Northern blot without detection probe, using samples from dicing assay. Synthetic pre-miR-21 internally labeled with biotin was used for the dicing assay.
Samples used were MCF10A, MCF10AshDicer, MDA-MB231 exosomes, MDA-MB231shDicer clone1 and clone2 exosomes, MDA-MB231shDicer cells, and
MDA-MB231 exosomes electroporated with Dicer antibody.
(E) Northern blot without detection probe using samples from dicing assay. Synthetic pre-cel-miR-1 internally labeled with biotin was used for the dicing assay.
Samples used were the same ones as in (D).
The qPCR data are the result of three independent experiments each with three replicates and are represented as ±SEM. See also Figure S5.
Cancer Cell
Exosomes and MicroRNA Biogenesis
10 Cancer Cell 26, 1–15, November 10, 2014 ª2014 Elsevier Inc.
Please cite this article in press as: Melo et al., Cancer Exosomes Perform Cell-Independent MicroRNA Biogenesis and Promote Tumorigenesis, Cancer
Cell (2014), http://dx.doi.org/10.1016/j.ccell.2014.09.005
8/9/2019 CancerExosomesPerform Cell-IndependentMicroRNA.pdf
http://slidepdf.com/reader/full/cancerexosomesperform-cell-independentmicrornapdf 11/15
in exosomes was observed mainly in breast cancer samples that
formed tumors in nude mice when coinjected with MCF10A cells
and not in exosomes from serum of H ( Figure 7I).
DISCUSSION
The functional role of miRNAs associated with exosomes in can-
cer progression is largely unknown. Many studies suggest the
presence of miRNAs in exosomes and speculated on their func-
tion ( Valadi et al., 2007; Zhang et al., 2010 ). Given that miRNAs
need to be present in a stoichiometric concentration for appro-
priate silencing of mRNA targets, it seems unlikely that exo-
somes in circulation would provide sufficient concentrations of
mature miRNAs to repress the target transcriptome. The pro-
cessing of the pre-miRNAs originated from exosomes in the
recipient cells is an unlikely event because miRNA biogenesis
A C
PTEN
β-actin
0’ 30’ 1h 12h 24h
MCF10A cells +MDA231 exos culture
D
HOXD10
β-actin
0’ 30’ 1h 24h
MCF10A cells +MDA231 exos culture
12h
F
PTEN
β-actin
0’ 30’ 1h 12h 24h
MCF10A cells +MDA231 exos Dicer AB
HOXD10
G
MCF10A cells
MCF10A cells + MDA231 exos
MCF10A cells +MDA231 exos cultureMCF10A cells +MDA231 exos Dicer AB
C e l l v i a b i l i t y ( A b s )
Days
H MCF10A - 1 MCF10A + MDA231 exos - 3
MCF10A +MDA231 exos Dicer AB - 4
MCF10A +MDA231 exos culture - 2
*
M C F 1 0 A c e l l s +
M D A 2 3 1 E x o s
M D A - M B 2 3 1 c e l l s
M C F 1 0 A c e l l s
MCF10A cells
MCF10A cells + MDA231 exos cultureMCF10A cells + MDA231 exos Dicer AB
T u m o r v o l u m e ( m m )
I
3
Days
-3 -2 -1 0 1 2 3
PTEN 0.99 0.51 0.50 0.50 0 HOXD10 0.96 0.62 0.45 0.30 0
PTEN 0.91 0.91 0.91 0.89 0.80
HOXD10 0.91 0.90 0.91 0.90 0.78
E
3 ’ U T R
P T E N - W
T
MCF10A cells
MCF10A cells + MDA-231Exosomes
MCF10A cells + MDA-231Dicer AB Exosomes
3 ’ U T R
P T E N - M
u t
3 ’ U T R
H
O X D
1 0 - W
T
3 ’ U T R
H
O X D
1 0 - M
u t
B
M C F 1 0 A c e l l s
M D A 2 3 1 c e l l s
M C F 1 0 A c e l l s +
M D A 2 3 1 e x o s c u
l t u r e
-1 -0.5 0 0.5 1
M C F 1 0 A c e l l s +
M D A 2 3 1 E x o s D i c e r A B
80604020
0
100120
140
0.8
0.6
0.4
0.2
00 1 2 3 4 5 6
MCF10A cells + MDA231 exos Actin AB
18001600
14001200
1000800
600
400200
00 5 10 15 20 25
*
m i R - 2 1
P T E N
H O X D 1 0 A
m i R - 1 0 b
C F U s
( a r b i t r a r y u n i t s )
*200
150
100
50
0
250
1 2 3 4
L u c i f e r a s e a c t i v i t y
Figure 6. Cancer Exosomes Induce Tran-
scriptome Alterations in Recipient Cells
and Tumor Formation in a Dicer-Dependent
Manner
(A) HeatMap of miRNA expression array of MDA-
MB231 cells, MCF10A cells, and MCF10A cellstreated with MDA-MB231 exosomes. An intensity
key is given below the HeatMap. Each sample is
represented as an average of the duplicates.
(B) HeatMap of mRNA expression arrays repre-
senting gene abundance. The samples used were
MCF10A cells treated with MDA-MB231 exo-
somes electroporated with Dicer antibody,
MCF10A cells, MDA-MB231 cells, and MCF10A
cells exposed to MDA-MB231 exosomes. An in-
tensity key is given below the HeatMap.
(C) Immunoblot of PTEN in protein extracts of
MCF10A cellstreated for0, 30min, 1,12, and24 hr
with MDA-MB231 cancer exosomes after cell-free
culture. Beta actin was used as a loading control.
(D) Immunoblot of HOXD10 antibody in protein
extracts of MCF10A cells treated for 0, 30 min, 1,
12, and 24 hr with MDA-MB231 cancer exosomes
after cell-free culture conditions. Beta actin was
used as a loading control.
(E) Graph showing luciferase reporter activity in
MCF10A cells transiently transfected with 30UTR-
PTEN-WT, 30UTR-PTEN-Mut, 30UTR-HOXD10-
WT, and 30UTR-HOXD10-Mut and treated with
MDA-MB231 exosomes.
(F) Immunoblot of PTEN (upper panel) and
HOXD10 (middle panel) in protein extracts from
MCF10A cellstreated for0, 30min, 1,12, and24 hr
with MDA-MB-231 exosomes electroporated with
Dicer antibody after cell-free culture conditions.
Beta actin was used as a loading control.
(G) MTT assay during 5 days of culture of MCF10A
cells, MCF10A cells treated with MDA-MB231
exosomes with no cell-free culture time, MCF10A
cells treated with MDA-MB231 exosomes with
cell-free culture time, and MCF10A cells treated
with MDA-MB231 exosomes electroporated with
Dicer antibody with cell-free culture time; signifi-
cance was determined using one-way ANOVA
with Tukey post hoc analysis (*p = 0.0027).
(H) The colony formationassay shows formation of
colonies in culture plate and labeled with MTT re-
agent after 8 days MCF10A cells culture, MCF10A
cells treated with MDA-MB231 exosomes with no
cell-free culture time, MCF10A cells treated with MDA-MB231 exosomes with cell-free culture time, and MCF10A cells treated with MDA-MB231 exosomes
electroporated with Dicer antibody with cell-free culture time. Lower graph shows quantification of colonies (colony forming units [CFUs]). Significance was
determined using one-way ANOVA with Tukey post hoc analysis (*p = 0.0003).
(I)MCF10A cells, MCF10A cells exposed to MDA-MB-231 cancer exosomes, MCF10A cells exposed to MDA-MB231 cancer exosomeselectroporatedwith Dicer
antibody, and MCF10A cells exposed to MDA-MB231 cancer exosomes electroporated with actin antibody were orthotopically injected into the mammary pads
of athymic nude mice (n = 8 per group). Graph depicts tumor volume with respect to time; significance was determined using one-way ANOVA with Tukey post
hoc analysis (*p = 0.005).
Data are represented as mean ±SEM. See also Figure S6.
Cancer Cell
Exosomes and MicroRNA Biogenesis
Cancer Cell 26, 1–15, November 10, 2014 ª2014 Elsevier Inc. 11
Please cite this article in press as: Melo et al., Cancer Exosomes Perform Cell-Independent MicroRNA Biogenesis and Promote Tumorigenesis, Cancer
Cell (2014), http://dx.doi.org/10.1016/j.ccell.2014.09.005
8/9/2019 CancerExosomesPerform Cell-IndependentMicroRNA.pdf
http://slidepdf.com/reader/full/cancerexosomesperform-cell-independentmicrornapdf 12/15
A
C
N o r m a l i z e d c o n c e n t r a t i o n o f
e x o s o m e s o f h e a l t h y d o n o r s
E
Serum exosomes of
breast cancer patients
H
T u m o r v
o l u m e ( m m )
3
hsa-Dicer
mmu-Dicer
O V A
1
O V A
2
O V A
3
O V A
4
4 T 1 e x
o s
4 T 1 c e l l
O V A
5
E N D
1
E N D
2
E N D
3
B R S T 1
B R S T 2
4 T 1 e x
o s
4 T 1 c e l l
F
G
*
D
hsa-Dicer
mmu-Dicer
N o r m a l i z e d c o n c e n t r a t i o n o f
e x o s o m e s o f b r e a s t c a n c e r p a t i e n t s
100 nm
2
1.5
1
0.5
0
2.5
3
3.5
0 100 200 300 400
210
3456789
1011
0 100 200
1.5
1
0.5
0 E x o s o m e s / m l ( x 1 0 ) 9
Healthydonors
Breast cancer patients
Healthydonors
Breast cancer patients
1.5
1
0.5
0
p r e - m i R s e x o s 7 2 v e r s u s 2 4 h
( m e a n o f f o l d c h a n g e )
3
2
1
0
4
5
m i R s e x o s 7 2 v e r s u s 2
4 h
( m e a n o f f o l d c h a n g e )
Healthydonors
Breast cancer patients
Days
0 20 40 60
300
BC1BC2BC3BC4BC5BC6BC7BC8BC9BC10BC11
H1H2H3H4H5H6H7H8
pre-10apre-10bpre-21pre-27apre-155pre-373
H1H2H3H4H5H6H7H8
BC1BC2BC3BC4BC5BC6BC7BC8BC9BC10BC11
miR-10amiR-10bmiR-21miR-27amiR-155miR-373
MCF10A cellsMCF10A + BC1 ExMCF10A + BC2 ExMCF10A + BC3 Ex
MCF10A + BC5 Ex
MCF10A + BC4 Ex
MCF10A + BC6 ExMCF10A + BC7 ExMCF10A + BC8 ExMCF10A + BC9 ExMCF10A + BC10 ExMCF10A + BC11 ExMCF10A + H1 ExMCF10A + H2 ExMCF10A + H3 ExMCF10A + H4 ExMCF10A + H5 ExMCF10A + H6 ExMCF10A + H7 ExMCF10A + H8 Ex
200
400
600
800
1000
0
M D A - 2
3 1 c e l l s
BC7 BC6BC1BC3 BC10
2.6 0 0.2 0.5 0.3 0.3
Dicer1
Flotillin1
I
BC8 BC11BC9BC4 BC2BC5
0.6 0 0 0 0.3 0 0
H1 H2 H3 H4 H5 H6 H7 H8
1.2 0 0 0 0 0 0 0 0
Dicer/Flot1
∆ ∆ ∆∆
M D A
- 2 3 1
c e l l s
Dicer1
Flotillin1
Dicer/Flot1
∆
M D A
- 2 3 1
c e l l s
Dicer1
Flotillin1
Dicer/Flot1
Size (nm)Size (nm)
B 1 2 3 4 5
hsa-Dicer
mmu-Dicer
Flotillin1
1 - 4T1 exos
2 - Exos MDA-231 orthotopic mice
3 - Exos MCF10A orthotopic mice
4 - Exos wild-type mice5 - MCF10A cells
∆∆
∆
∆
∆
B C 1 0
B C 2
B C 3
B C 4
B C 5
B C 8
B C 9
B C 6
B C 1
B C 7
B C 1 1
B C 1 0
B C 2
B C 3
B C 4
B C 5
B C 8
B C 9
B C 6
B C 1
B C 7
B C 1 1
(legend on next page)
Cancer Cell
Exosomes and MicroRNA Biogenesis
12 Cancer Cell 26, 1–15, November 10, 2014 ª2014 Elsevier Inc.
Please cite this article in press as: Melo et al., Cancer Exosomes Perform Cell-Independent MicroRNA Biogenesis and Promote Tumorigenesis, Cancer
Cell (2014), http://dx.doi.org/10.1016/j.ccell.2014.09.005
8/9/2019 CancerExosomesPerform Cell-IndependentMicroRNA.pdf
http://slidepdf.com/reader/full/cancerexosomesperform-cell-independentmicrornapdf 13/15
in recipient cells is rate-limiting not only due to the total amount
of pre-miRNAs available for processing in the receiving cell, but
also due to rate-limiting amounts of required enzymes. There-
fore, it is more efficient to have maturemiRNAs entering recipient
cells for direct alteration of gene expression posttranscriptionallywithout having to go through a processing pathway. We demon-
strated that inhibiting the action of Dicer in cancer exosomes
significantly impairs tumor growth in recipient cells, suggesting
that miRNA biogenesis in exosomes contributes to cancer
progression.
Recent studies show that melanoma-derived exosomes play a
role in metastasis ( Peinado et al., 2012 ). Exosomes derived from
fibroblasts play a role in the migration of breast cancer cells
( Luga et al., 2012 ). Exosomes derived from cancer cells have a
protumorigenic role associated with the transfer of mRNA and
proangiogenic proteins ( Luga et al., 2012; Peinado et al., 2012;
Skog et al., 2008 ). Exosomes derived from cancer cells can
also contribute to a horizontal transfer of oncogenes, such as
EGFRvIII ( Al-Nedawi et al., 2008 ). Our study demonstrates thatcancer exosomes mediate significant transcriptome alterations
in target cells via RISC-associated miRNAs. A myriad of biolog-
ical processes in the target cells are affected by exosomes that
induce proliferation and have the potential to convert nontumori-
genic cells into tumor-forming cells. Nonetheless, the potential
in vivo effect of cancer exosomes on recipient cells likely de-
pends on several other environmental parameters and accessi-
bility barriers. Collectively, this study unravels the possible role
cancer exosomes play in inducing an oncogenic ‘‘field effect’’
that further subjugates adjacent normal cells to participate in
cancer development and progression. This study does not indi-
cate that such field effect is systemic; therefore additional
studies may be required to address such implications.
EXPERIMENTAL PROCEDURES
Exosomes were purified from cells cultured in exosomes-depleted FBS, using
sequential centrifugations to discard dead cells and cellular debris. All exo-
somes samples were subjected to a PBS washing step followed by ultracen-
trifugation. This was followed by filtration of the supernatant with 0.2mm filtersand ultracentrifugation for 2 hr, as previously described ( Li et al., 2012; Luga
et al., 2012 ). Exosomes used for RNA extraction were treated with Proteinase
K and RNase prior to lysis of exosomes. Exosomesfor protein extractionwere
treated with Proteinase K and Urea/SDS lysis buffer.
Human Samples
Human serum samples were obtained from the MD Anderson Cancer Center
(MDACC) through appropriate informed consents after approval by the institu-
tional review board (IRB). The IRB protocol numbers are, 04-0657 and 04-
0698. The primarytumor specimens were obtained at the Hospital Universitari
de Bellvitge (L’Hospitalet de Llobregat, Barcelona, Spain). The IRB approved
the study. Written informed consent was collected from patients (see Supple-
mental Experimental Procedures ).
Animal Studies
All mice were housed under standard housing conditions at the Beth Israel
Deaconess Medical Center (BIDMC), MDACC, and IDIBELL animal facilities.
All animal procedures were reviewed and approved by the BIDMC, MDACC,
and the Spanish Institutional Animal Care and Use Committees (see Supple-
mental Experimental Procedures ).
Statistical Analysis
Error bars indicate ±SEM between biological replicates. Technical as well as
biological triplicates of each experiment were performed. Statistical signifi-
cance was determined using t tests, except for multiple-group comparisons,
for which significance was determined using one-way ANOVA with Tukey
post hoc analysis with GraphPad Prism (GraphPad Software). A p value <
0.05 was considered statistically significant. Pearson correlation coefficient
(r value) was calculated assuming linear relationship between variables.
Detailed descriptions of all the methods used in the manuscript are listed in
the Supplemental Experimental Procedures file.
Figure 7. Serum Exosomes from Breast Cancer Patients Contain Dicer and Process Pre-MicroRNAs
(A) Immunoblot of Dicer and protein extracts from serum exosomes harvested from mice xenografted with human tumors. OVA1–5 are human ovary xenografts;
END1–3 are human endometrial xenografts; and BRST1 and BRST2 are human breast xenografts. 4T1 exosomes and cells were used as controls for murine
Dicer. hsa-Dicer represents human Dicer molecular weight and mmu-Dicer represents murine Dicer molecular weight. See Figure S7D.
(B) Immunoblot of Dicer, thatrecognizes human and mouseDicer,and protein extracts from serum exosomesharvested from miceorthotopically implantedwith
MDA-MB-231 cells or MCF10A cells. 4T1 exosomes and MCF10A cells were used as controls for murine and human Dicer, respectively. hsa-Dicer represents
human Dicer molecular weight and mmu-Dicer represents murine Dicer molecular weight.
(C) NanoSight shows size distribution of exosomes extracted from the serum of eight healthy donors (left graph) and 11 breast cancer patients (right graph).
Concentration of samples was standardized to better show size.
(D) TEM of exosomes harvested from the serum of breast cancer patients (100 ml of serum).
(E)Concentration of exosomesfrom the serum of eight healthy donors and 11 breast cancer patientsassessed by NanoSight. Significancewas determined using
t test (*p = 0.012).
(F) Exosomes were harvested from fresh serum of eight healthy donors and 11 breast cancer patients. The extracted samples were left in cell-free culture
conditions for 24 and 72 hr. After 24 and 72 hr, exosomes were recovered and six pre-miRNAs were quantified by qPCR. The fold-change of each pre-miRNA inexosomes after 72 hr cell-free culture was quantified relative to the same pre-miRNA in exosomes after 24 hr cell-free culture in each sample. The graphical dot
plots represent an average fold-change for the pre-miRNAs in 72 hr exosomes relative to 24 hr exosomes (100 ml of serum).
(G) Exosomes were harvested from fresh serum of eight healthy donors and 11 breast cancer patients. The extracted samples were left in cell-free culture
conditions for24 and72 hr.After 24and 72hr, exosomeswererecoveredand six miRNAs were quantified byqPCR.The fold-changeof eachmiRNAin exosomes
after 72 hr cell-freeculturewas quantifiedrelative to thesame miRNA in exosomesafter 24 hr cell-free culturein eachsample. Thegraphical dotplots represent an
average fold-change for the miRNAs in 72 hr exosomes relative to 24 hr exosomes. Both (F) and (G) are the result of three independent qPCRs each with three
replicates (100 ml of serum).
(H) MCF10A cells, MCF10A cells mixed with exosomes from healthy donors (H1–8), and MCF10A cells mixed with exosomes from breast cancer patients
(BC1–11) were orthotopically injected into the mammary pads of athymic nude mice. The number of exosomes used was calculated per body weight. Samples
that have not formed a tumor appear overlapped in the x axis of the graph. Exosomes alone were injected in all cases. This graph depicts tumor volume with
respect to time (n = 2 per sample).
(I) Immunoblots of Dicer using protein extracts of 11 breast cancer patients and eight healthy donor-derived exosomes. Flotillin1 was used as loading control.
Quantification was done using Image J software. Samples highlighted in the immunoblot are the ones that showed tumor formation when injected with MCF10A
cells in nude mice (H).
Data are represented as mean ±SEM. See also Figure S7.
Cancer Cell
Exosomes and MicroRNA Biogenesis
Cancer Cell 26, 1–15, November 10, 2014 ª2014 Elsevier Inc. 13
Please cite this article in press as: Melo et al., Cancer Exosomes Perform Cell-Independent MicroRNA Biogenesis and Promote Tumorigenesis, Cancer
Cell (2014), http://dx.doi.org/10.1016/j.ccell.2014.09.005
8/9/2019 CancerExosomesPerform Cell-IndependentMicroRNA.pdf
http://slidepdf.com/reader/full/cancerexosomesperform-cell-independentmicrornapdf 14/15
ACCESSION NUMBERS
The microarray data are available in the Gene Expression Omnibus (GEO)
database ( http://www.ncbi.nlm.nih.gov/gds ) under the accession number
GSE60716.
SUPPLEMENTAL INFORMATION
Supplemental Information includes Supplemental Experimental Procedures,
seven figures, and seven tables and can be found with this article online at
http://dx.doi.org/10.1016/j.ccell.2014.09.005.
AUTHORS CONTRIBUTIONS
S.A.M.designed andcarriedout most of theexperiments andwrote themanu-
script; H.S. performed in vivo mice xenograft experiments of Figure 7; J.T.O.
carried out the in vivo mice xenograft experiments of Figure 6; N.K. selected
positive clones for shBiG2 silencing and did qPCR analysis of BiG2 and Dicer;
A.V. and A.V.I. carried out human orthotopic implantations in nude mice and
collected the tumors; L.Q., E.V., and L.T.P. carried out LSS experiment;
C.A.M. carried out mRNA arrays bioinformatic analysis; A.L. provided breast
cancer serum samplesand helped withpatientanalysis;C.I. performedmiRNA
array analysis of the data; G.A.C. helped with miRNA array analysis and
revised the manuscript; R.K. conceptually designed and supervised the proj-
ect and wrote the manuscript.
ACKNOWLEDGMENTS
This work was primarily supported by the Cancer Prevention and Research
Institute of Texas (R.K.). S.A.M. was supported by the Human Frontiers Sci-
ence Program. L.Q., E.V., and L.T.P. were supported by the National Science
Foundation grants EFRI-1240410, CBET-0922876, and CBET-1144025, and
NIH grants R01 EB003472 and R01 EB006462. G.A.C. is the Alan M. Gewirtz
Leukemia & Lymphoma Society Scholar. G.A.C. is also supported as a Fellow
at University of Texas MD Anderson Research Trust, as a University of Texas
System Regents Research Scholar and by the CLL Global Research Founda-
tion. Work in G.A.C.’s laboratory is supported in part by the NIH/National Can-
cer Institute grants 1UH2TR00943-01 and 1R01 CA182905-01. R.K. is also
supported by NIH Grants CA-163191, CA-155370, CA-151925, DK 081576,
and DK 055001. A.V. is supported by the Spanish Ministry of Economy and
Competitiveness (FIS: PI10-0222 and PI13-01339), INNPACTO (ORAL-
BEADS-IPT-2011-0754-900000), and the Generalitat de Catalunya
(2005SGR00727). We thank Dr. Carolyn Hall for providing us access to the hu-
man serum samples.
Received: January 24, 2014
Revised: June 1, 2014
Accepted: September 18, 2014
Published: October 23, 2014
REFERENCES
Al-Nedawi, K., Meehan, B., Micallef, J., Lhotak, V., May, L., Guha, A., and Rak,J. (2008). Intercellular transfer of the oncogenic receptor EGFRvIII by microve-
sicles derived from tumour cells. Nat. Cell Biol. 10, 619–624.
Ambros, V. (2004). The functions of animal microRNAs. Nature 431, 350–355.
Bartel, D.P. (2009). MicroRNAs: target recognition and regulatory functions.
Cell 136, 215–233.
Chendrimada, T.P., Gregory, R.I., Kumaraswamy, E., Norman, J., Cooch, N.,
Nishikura, K., and Shiekhattar, R. (2005). TRBP recruits the Dicer complex to
Ago2 for microRNA processing and gene silencing. Nature 436, 740–744.
Cocucci, E., Racchetti, G., and Meldolesi, J. (2009). Shedding microvesicles:
artefacts no more. Trends Cell Biol. 19, 43–51.
Escola, J.M., Kleijmeer, M.J., Stoorvogel, W., Griffith, J.M., Yoshie, O., and
Geuze, H.J. (1998). Selective enrichment of tetraspan proteins on the internal
vesiclesof multivesicular endosomesand on exosomessecreted by humanB-
lymphocytes. J. Biol. Chem. 273, 20121–20127.
Fang, H., Qiu, L., Vitkin, E., Zaman, M.M., Andersson, C., Salahuddin, S.,
Kimerer, L.M., Cipolloni, P.B., Modell, M.D., Turner, B.S., et al. (2007).
Confocal light absorption and scattering spectroscopic microscopy. Appl.
Opt. 46, 1760–1769.
Filipowicz, W. (2005). RNAi: the nuts and bolts of the RISC machine. Cell 122,
17–20.
Gregory, R.I., Chendrimada, T.P., Cooch, N., and Shiekhattar, R. (2005).
Human RISC couples microRNA biogenesis and posttranscriptional gene
silencing. Cell 123, 631–640.
Haase, A.D., Jaskiewicz, L., Zhang, H., Laine , S., Sack, R., Gatignol, A., and
Filipowicz, W. (2005). TRBP, a regulator of cellularPKR andHIV-1 virus expres-
sion, interacts with Dicer and functions in RNA silencing. EMBO Rep. 6,
961–967.
Hirata, H., Ueno, K., Shahryari, V., Tanaka, Y., Tabatabai, Z.L., Hinoda, Y., and
Dahiya, R. (2012). Oncogenic miRNA-182-5p targets Smad4 and RECK in hu-
man bladder cancer. PLoS ONE 7 , e51056.
Ismail, N., Wang,Y., Dakhlallah, D.,Moldovan, L., Agarwal,K., Batte, K., Shah,
P., Wisler,J., Eubank, T.D., Tridandapani,S., et al. (2013). Macrophage micro-
vesicles induce macrophage differentiation and miR-223 transfer. Blood 121,
984–995.Itzkan, I., Qiu, L., Fang, H., Zaman, M.M., Vitkin, E., Ghiran, I.C., Salahuddin,
S., Modell, M., Andersson, C., Kimerer, L.M., et al. (2007). Confocal light ab-
sorption and scattering spectroscopic microscopy monitors organelles in
live cells with no exogenous labels. Proc. Natl. Acad. Sci. USA 104, 17255–
17260.
Kahlert, C., and Kalluri, R. (2013). Exosomes in tumor microenvironment influ-
ence cancer progression and metastasis. J. Mol. Med. 91, 431–437.
Kogure, T., Lin, W.L., Yan, I.K., Braconi, C., and Patel, T. (2011). Intercellular
nanovesicle-mediated microRNA transfer: a mechanism of environmental
modulation of hepatocellular cancer cell growth. Hepatology 54, 1237–1248.
Kosaka, N., Iguchi, H., Hagiwara, K., Yoshioka, Y., Takeshita, F., and Ochiya,
T. (2013). Neutral sphingomyelinase 2 (nSMase2)-dependent exosomal trans-
fer of angiogenic microRNAs regulate cancer cell metastasis. J. Biol. Chem.
288, 10849–10859.
Li,L., Zhu, D.,Huang, L.,Zhang, J.,Bian, Z.,Chen, X.,Liu,Y., Zhang,C.Y., and
Zen, K. (2012). Argonaute 2 complexes selectively protect the circulating
microRNAs in cell-secreted microvesicles. PLoS ONE 7 , e46957.
Logozzi, M., De Milito, A., Lugini, L., Borghi, M., Calabro ` , L., Spada, M.,
Perdicchio, M., Marino, M.L., Federici, C., Iessi, E., et al. (2009). High levels
of exosomes expressing CD63 and caveolin-1 in plasma of melanoma pa-
tients. PLoS ONE 4, e5219.
Luga, V., Zhang, L., Viloria-Petit, A.M., Ogunjimi, A.A., Inanlou, M.R., Chiu, E.,
Buchanan, M., Hosein, A.N., Basik, M., and Wrana, J.L. (2012). Exosomes
mediate stromal mobilization of autocrine Wnt-PCP signaling in breast cancer
cell migration. Cell 151, 1542–1556.
Ma, L., Teruya-Feldstein, J., and Weinberg, R.A. (2007). Tumour invasion and
metastasis initiated by microRNA-10b in breast cancer. Nature 449, 682–688.
MacRae, I.J., Ma, E., Zhou, M., Robinson, C.V., and Doudna, J.A. (2008).
In vitro reconstitution of the human RISC-loading complex. Proc. Natl. Acad.
Sci. USA 105, 512–517.
Maniataki, E., and Mourelatos, Z. (2005). A human, ATP-independent, RISC
assembly machine fueled by pre-miRNA. Genes Dev. 19, 2979–2990.
Mavel, S., Thery, I., and Gueiffier, A. (2002). Synthesis of imidazo[2,1-a]phtha-
lazines, potential inhibitors of p38 MAP kinase. Prediction of binding affinities
of protein ligands. Arch. Pharm. (Weinheim) 335, 7–14.
Melo, S.A., Ropero, S., Moutinho, C., Aaltonen, L.A., Yamamoto, H., Calin,
G.A., Rossi, S., Fernandez, A.F., Carneiro, F., Oliveira, C., et al. (2009). A
TARBP2 mutation in human cancer impairs microRNA processing and
DICER1 function. Nat. Genet. 41, 365–370.
Melo, S.A., Moutinho, C., Ropero, S., Calin, G.A., Rossi, S., Spizzo, R.,
Fernandez, A.F., Davalos, V., Villanueva, A., Montoya, G., et al. (2010). A ge-
netic defect in exportin-5 traps precursor microRNAs in the nucleus of cancer
cells. Cancer Cell 18, 303–315.
Cancer Cell
Exosomes and MicroRNA Biogenesis
14 Cancer Cell 26, 1–15, November 10, 2014 ª2014 Elsevier Inc.
Please cite this article in press as: Melo et al., Cancer Exosomes Perform Cell-Independent MicroRNA Biogenesis and Promote Tumorigenesis, Cancer
Cell (2014), http://dx.doi.org/10.1016/j.ccell.2014.09.005

8/9/2019 CancerExosomesPerform Cell-IndependentMicroRNA.pdf
http://slidepdf.com/reader/full/cancerexosomesperform-cell-independentmicrornapdf 15/15
Montecalvo, A., Larregina, A.T., Shufesky, W.J., Stolz, D.B., Sullivan, M.L.,
Karlsson, J.M., Baty, C.J., Gibson, G.A., Erdos, G., Wang, Z., et al. (2012).
Mechanism of transferof functional microRNAs between mousedendriticcells
via exosomes. Blood 119, 756–766.
Narayanan, A., Iordanskiy, S., Das,R., Van Duyne, R., Santos, S., Jaworski, E.,
Guendel, I., Sampey, G., Dalby, E., Iglesias-Ussel, M., et al. (2013). Exosomes
derived from HIV-1-infected cells contain trans-activation response element
RNA. J. Biol. Chem. 288, 20014–20033.
O’Brien, K., Rani, S., Corcoran, C., Wallace, R., Hughes, L., Friel, A.M.,
McDonnell, S., Crown, J., Radomski, M.W., and O’Driscoll, L. (2013).
Exosomes from triple-negative breast cancer cells can transfer phenotypic
traits representing their cells of origin to secondary cells. Eur. J. Cancer 49,
1845–1859.
Pant, S., Hilton, H., and Burczynski, M.E. (2012). The multifaceted exosome:
biogenesis, rolein normal and aberrantcellular function,and frontiersfor phar-
macological and biomarker opportunities. Biochem. Pharmacol. 83, 1484–
1494.
Pegtel, D.M., Cosmopoulos, K., Thorley-Lawson, D.A., van Eijndhoven, M.A.,
Hopmans, E.S., Lindenberg, J.L., de Gruijl, T.D., Wu ¨ rdinger, T., and
Middeldorp, J.M. (2010). Functional delivery of viral miRNAs via exosomes.
Proc. Natl. Acad. Sci. USA 107 , 6328–6333.
Peinado, H., Aleckovic, M., Lavotshkin, S., Matei, I., Costa-Silva, B., Moreno-
Bueno, G., Hergueta-Redondo, M., Williams, C., Garcı a-Santos, G., Ghajar,
C., et al. (2012). Melanoma exosomes educate bone marrow progenitor cells
toward a pro-metastatic phenotype through MET. Nat. Med. 18, 883–891.
Razi, M., and Futter, C.E. (2006). Distinct roles for Tsg101 and Hrs in multive-
sicular body formation and inward vesiculation. Mol. Biol. Cell 17 , 3469–3483.
Shen, B., Wu, N., Yang, J.M., and Gould, S.J. (2011). Protein targeting to exo-
somes/microvesicles by plasma membrane anchors. J. Biol. Chem. 286,
14383–14395.
Shen, J., Xia, W., Khotskaya, Y.B., Huo, L., Nakanishi, K., Lim, S.O., Du, Y.,
Wang, Y., Chang, W.C., Chen, C.H., et al. (2013). EGFR modulates
microRNA maturation in response to hypoxia through phosphorylation of
AGO2. Nature 497 , 383–387.
Sherer, N.M., Lehmann, M.J., Jimenez-Soto, L.F., Ingmundson, A., Horner,
S.M., Cicchetti, G., Allen, P.G., Pypaert, M., Cunningham, J.M., and Mothes,
W. (2003). Visualization of retroviral replication in living cells reveals budding
into multivesicular bodies. Traffic 4, 785–801.
Shin, H.W., Morinaga,N., Noda,M., and Nakayama, K. (2004). BIG2, a guanine
nucleotide exchange factor for ADP-ribosylation factors: its localization to re-
cycling endosomes and implication in the endosome integrity. Mol. Biol. Cell
15, 5283–5294.
Simons, M., and Raposo, G. (2009). Exosomes—vesicular carriers for intercel-
lular communication. Curr. Opin. Cell Biol. 21, 575–581.
Simpson, R.J., Jensen, S.S., and Lim, J.W. (2008). Proteomic profiling of exo-
somes: current perspectives. Proteomics 8, 4083–4099.
Skog, J., Wu ¨ rdinger, T., van Rijn, S., Meijer, D.H., Gainche, L., Sena-Esteves,
M., Curry, W.T., Jr., Carter, B.S., Krichevsky, A.M., and Breakefield, X.O.
(2008). Glioblastoma microvesicles transport RNA and proteins that promote
tumour growth and provide diagnostic biomarkers. Nat. Cell Biol. 10, 1470–
1476.
Tang, G. (2005). siRNA and miRNA: an insight into RISCs. Trends Biochem.
Sci. 30, 106–114.
Taylor, D.D., and Gercel-Taylor, C. (2008). MicroRNA signatures of tumor-
derived exosomes as diagnostic biomarkers of ovarian cancer. Gynecol.
Oncol. 110, 13–21.
The ry, C., Zitvogel, L., and Amigorena, S. (2002). Exosomes: composition,
biogenesis and function. Nat. Rev. Immunol. 2, 569–579.
The ry, C., Amigorena, S., Raposo, G., and Clayton, A. (2006). Isolation and
characterization of exosomes from cell culture supernatants and biological
fluids. Curr. Protoc. Cell Biol. Chapter 3, Unit 3 22.
The ry, C. (2011). Exosomes: secreted vesicles and intercellular communica-tions. F1000 Biol. Rep. 3, 15.
Thomson, D.W., Bracken, C.P., Szubert, J.M., and Goodall, G.J. (2013). On
measuring miRNAs after transient transfection of mimics or antisense inhibi-
tors. PLoS ONE 8, e55214.
Tuccillo, F.M., de Laurentiis, A., Palmieri, C., Fiume, G., Bonelli, P., Borrelli, A.,
Tassone, P., Scala, I., Buonaguro, F.M., Quinto, I., and Scala, G. (2014).
Aberrant glycosylation as biomarker for cancer: focus on CD43. BioMed Res
Int. 2014, 742831.
Valadi, H., Ekstro ¨ m, K., Bossios, A., Sjo ¨ strand, M., Lee, J.J., and Lo ¨ tvall, J.O.
(2007). Exosome-mediated transfer of mRNAs and microRNAs is a novel
mechanism of genetic exchange between cells. Nat. Cell Biol. 9, 654–659.
Yan, L.X., Wu, Q.N., Zhang, Y., Li, Y.Y., Liao, D.Z., Hou, J.H., Fu, J., Zeng,
M.S., Yun, J.P., Wu, Q.L., et al. (2011). Knockdown of miR-21 in human breast
cancer cell lines inhibits proliferation, in vitro migration and in vivo tumor
growth. Breast Cancer Res. 13, R2.Yi, R., Qin, Y., Macara, I.G., and Cullen, B.R. (2003). Exportin-5 mediates the
nuclear export of pre-microRNAs and short hairpin RNAs. Genes Dev. 17 ,
3011–3016.
Zhang, Y.,Liu, D.,Chen, X.,Li, J.,Li, L.,Bian, Z.,Sun, F.,Lu, J.,Yin,Y., Cai, X.,
et al. (2010). Secreted monocytic miR-150 enhances targeted endothelial cell
migration. Mol. Cell 39, 133–144.
Cancer Cell
Exosomes and MicroRNA Biogenesis
Please cite this article in press as: Melo et al., Cancer Exosomes Perform Cell-Independent MicroRNA Biogenesis and Promote Tumorigenesis, Cancer
Cell (2014), http://dx.doi.org/10.1016/j.ccell.2014.09.005